
User Stories Applied for Agile Software Development Mike Cohn
Planning and TrackingAgile Projects
Mike CohnAugust 15, 2007
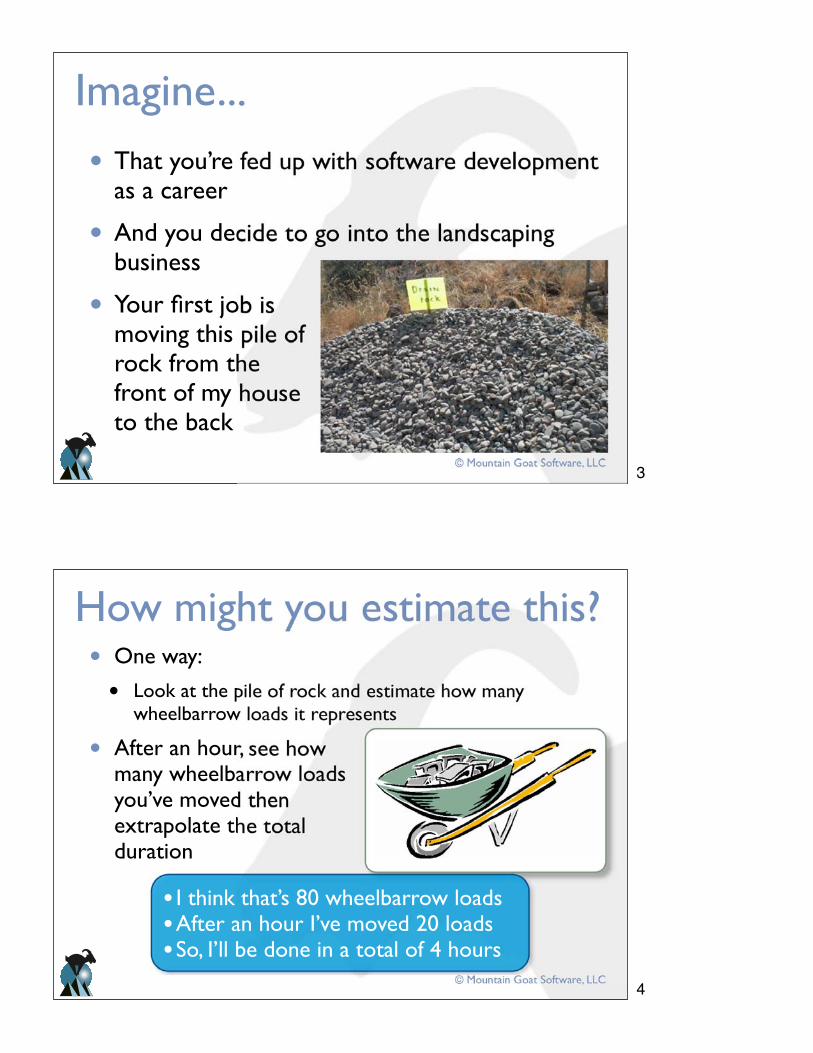
Mike Cohn - background
© Mountain Goat Software, LLC
1
2
© Mountain Goat Software, LLC
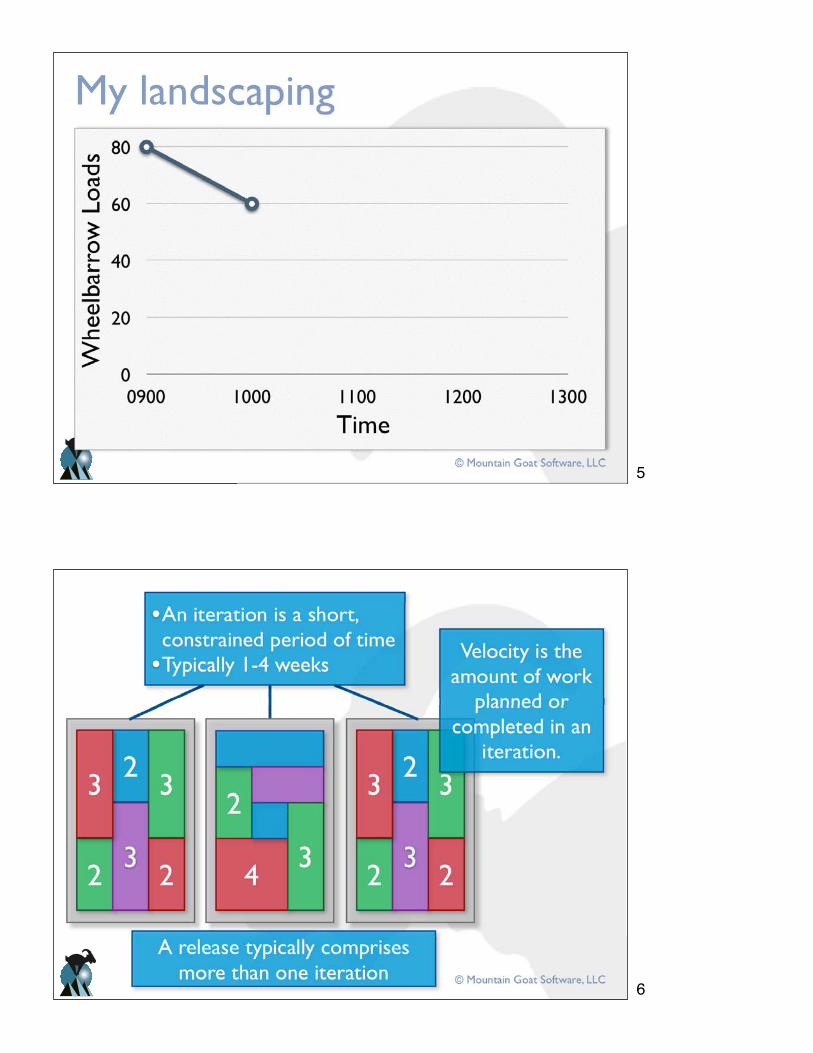
Imagine...
• That you’re fed up with software development as a career
• And you decide to go into the landscaping business
• Your first job is moving this pile of rock from the front of my house to the back
© Mountain Goat Software, LLC
How might you estimate this?• One way:
• Look at the pile of rock and estimate how many wheelbarrow loads it represents
• After an hour, see how many wheelbarrow loads you’ve moved then extrapolate the total duration
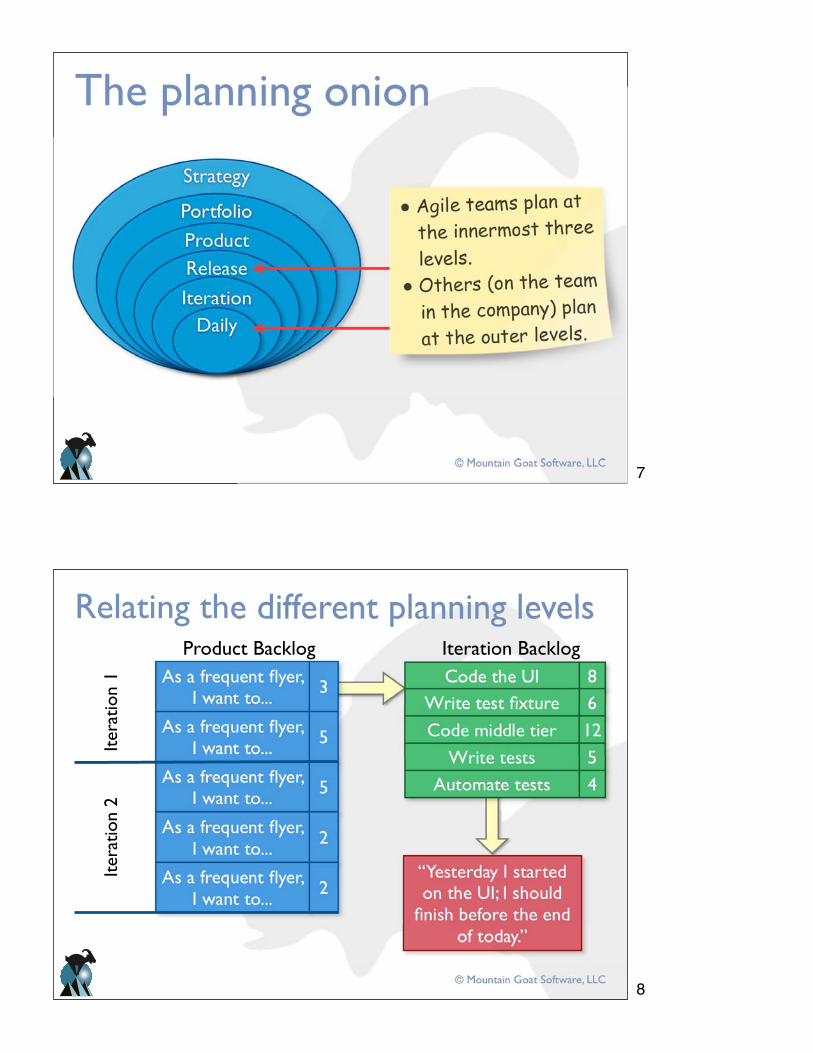
• I think that’s 80 wheelbarrow loads•After an hour I’ve moved 20 loads•So, I’ll be done in a total of 4 hours
3
4
© Mountain Goat Software, LLC
My landscaping
0
20
40
60
80
0900 1000 1100 1200 1300
Whe
elba
rrow
Loa
ds
Time
© Mountain Goat Software, LLC
5
6
© Mountain Goat Software, LLC
The planning onion
© Mountain Goat Software, LLC
Relating the different planning levels
Iter
atio
n 2
Iter
atio
n 1
Product Backlog Iteration Backlog
7
8
© Mountain Goat Software, LLC
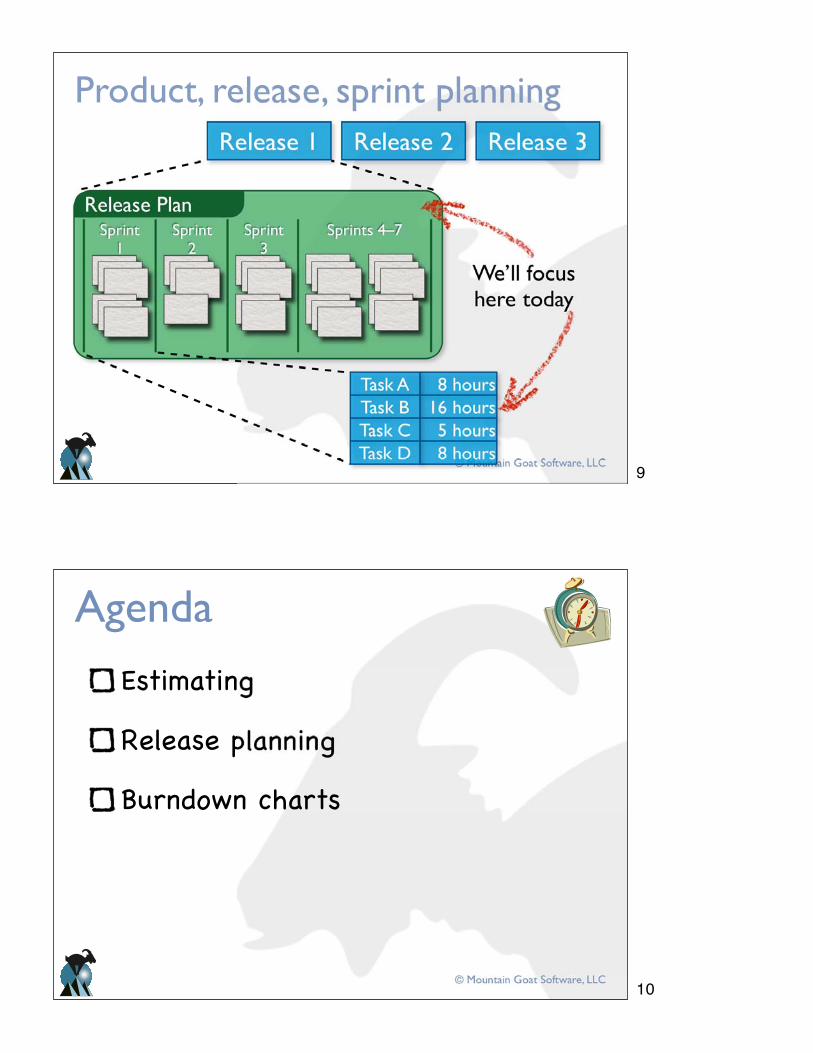
Product, release, sprint planning
Release Plan
We’ll focushere today
© Mountain Goat Software, LLC
Estimating
Release planning
Burndown charts
Agenda
9
10
© Mountain Goat Software, LLC
Story points
• Probably the most commonly used estimating unit among agile teams today
• Name is derived from agile teams commonly expressing requirements as “user stories”
• Based on a combination of the size and complexity of the work
• Unitless but numerically relevant estimates
• A 10-point user story is expected to take twice as long as a 5-point user story
© Mountain Goat Software, LLC
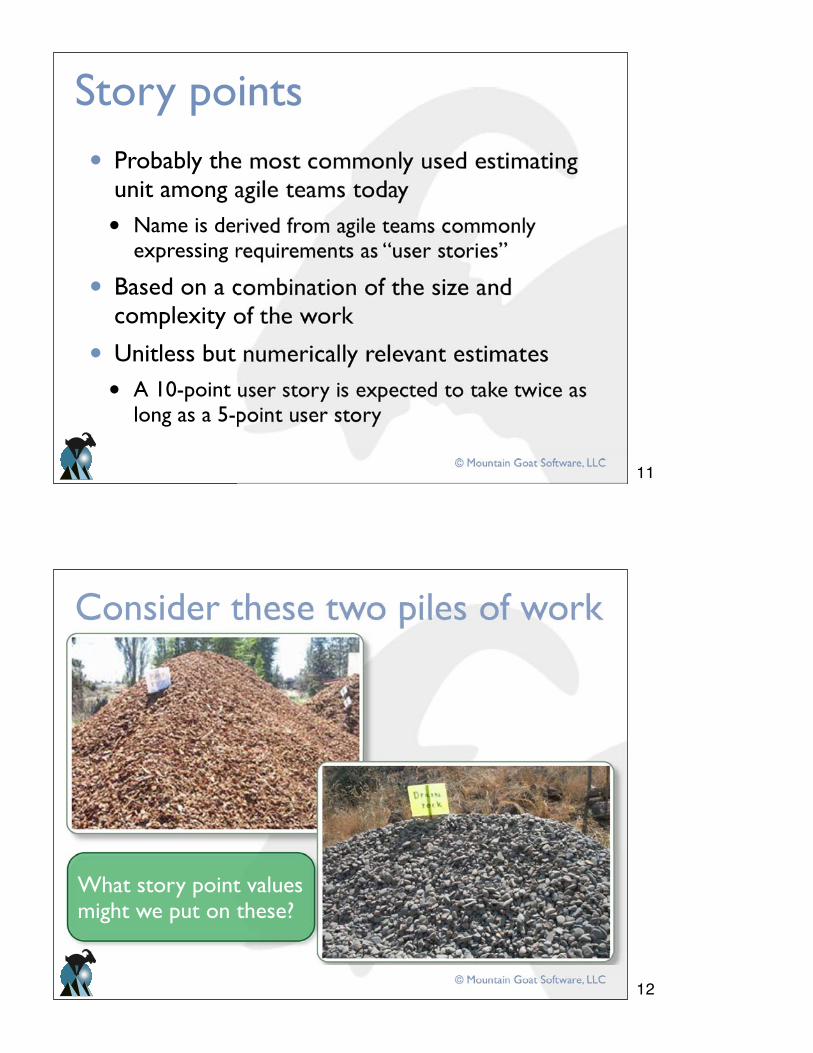
Consider these two piles of work
What story point values might we put on these?
11
12
© Mountain Goat Software, LLC
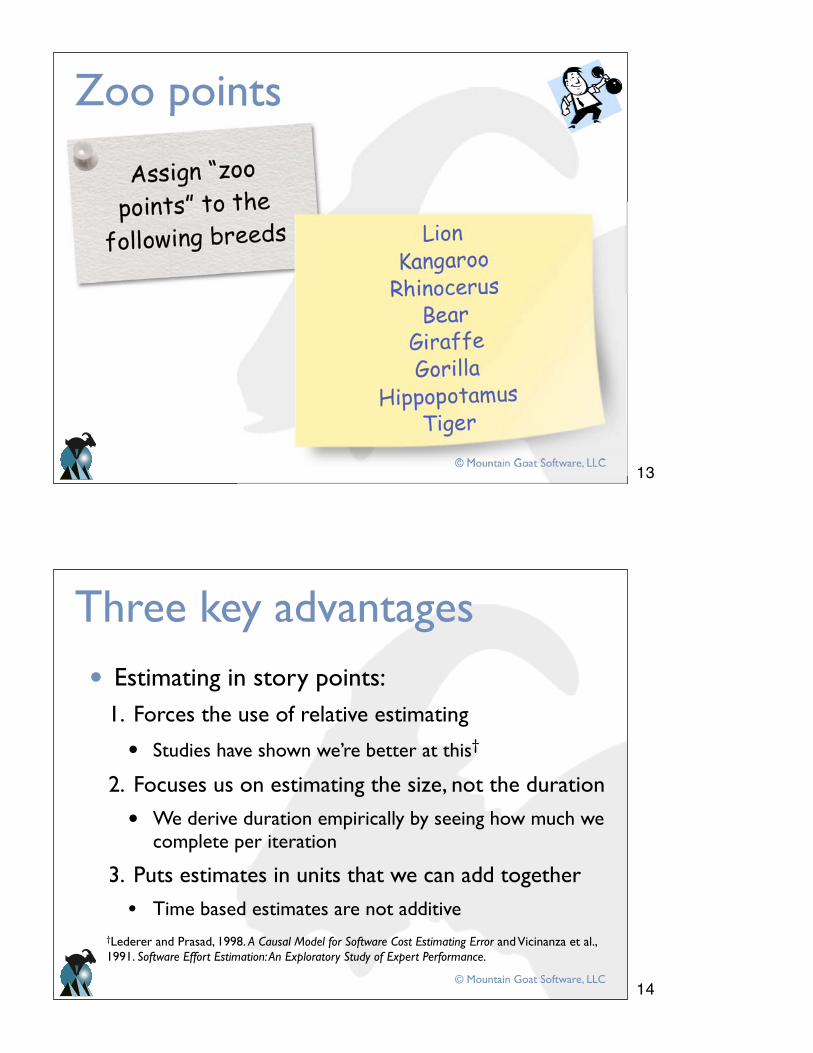
Zoo points
Assign “zoo
points” to the
following breeds
© Mountain Goat Software, LLC
Three key advantages
• Estimating in story points:1. Forces the use of relative estimating
• Studies have shown we’re better at this†
2. Focuses us on estimating the size, not the duration
• We derive duration empirically by seeing how much we complete per iteration
3. Puts estimates in units that we can add together
• Time based estimates are not additive†Lederer and Prasad, 1998. A Causal Model for Software Cost Estimating Error and Vicinanza et al., 1991. Software Effort Estimation: An Exploratory Study of Expert Performance.
13
14
© Mountain Goat Software, LLC
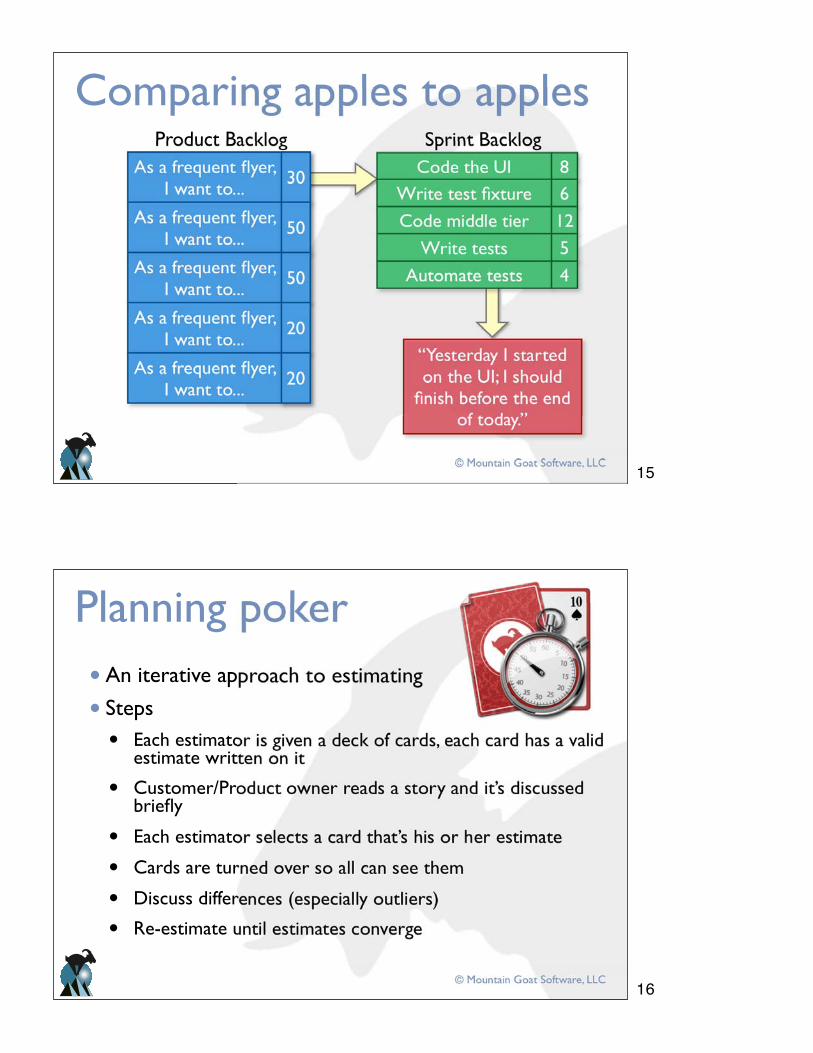
Comparing apples to applesProduct Backlog Sprint Backlog
© Mountain Goat Software, LLC
Planning poker• An iterative approach to estimating
• Steps
• Each estimator is given a deck of cards, each card has a valid estimate written on it
• Customer/Product owner reads a story and it’s discussed briefly
• Each estimator selects a card that’s his or her estimate
• Cards are turned over so all can see them
• Discuss differences (especially outliers)
• Re-estimate until estimates converge
15
16
© Mountain Goat Software, LLC
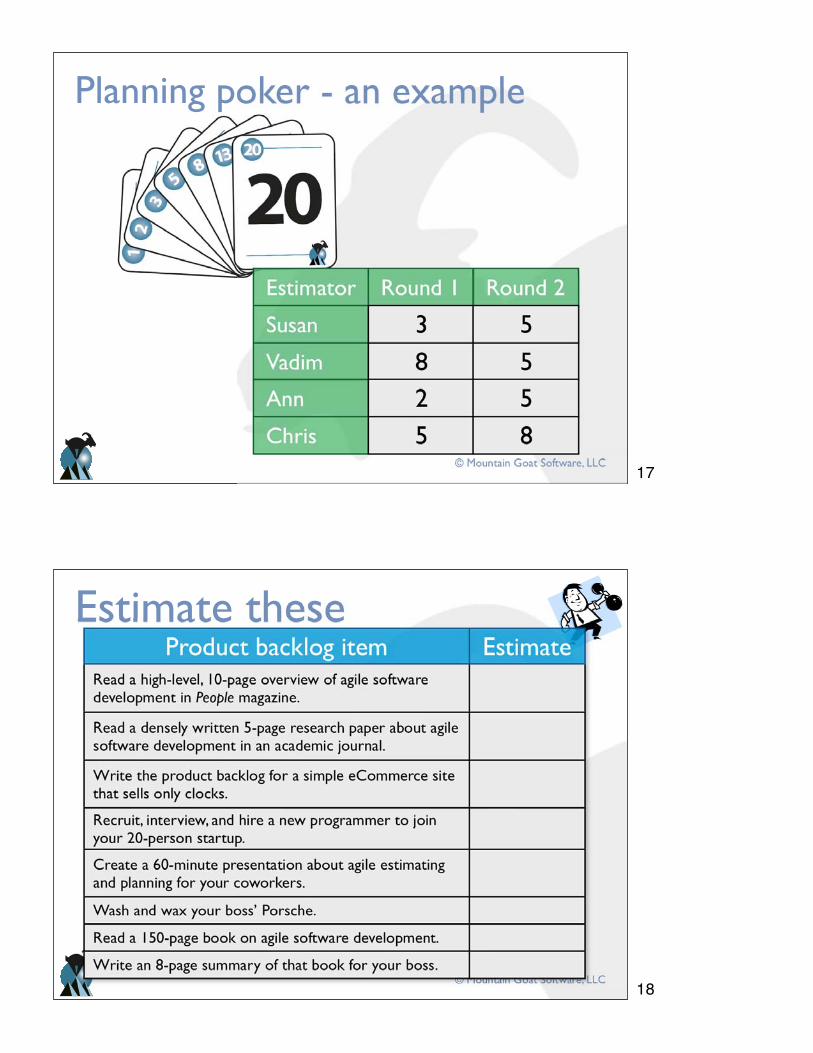
Planning poker - an example
Estimator Round 1
Vadim 8
Susan 3
Ann 2Chris 5
Round 2
55
58
© Mountain Goat Software, LLC
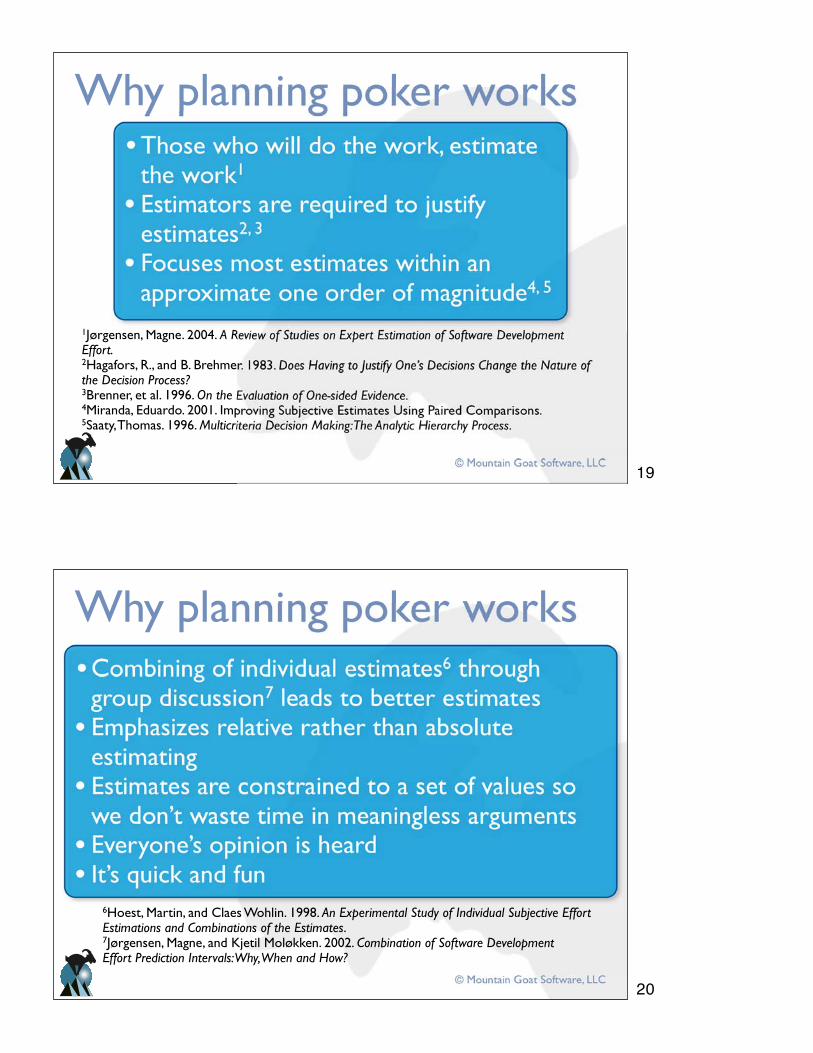
Estimate these
17
18
© Mountain Goat Software, LLC
Why planning poker works
1Jørgensen, Magne. 2004. A Review of Studies on Expert Estimation of Software Development Effort.2Hagafors, R., and B. Brehmer. 1983. Does Having to Justify One’s Decisions Change the Nature of the Decision Process?3Brenner, et al. 1996. On the Evaluation of One-sided Evidence. 4Miranda, Eduardo. 2001. Improving Subjective Estimates Using Paired Comparisons. 5Saaty, Thomas. 1996. Multicriteria Decision Making: The Analytic Hierarchy Process.
© Mountain Goat Software, LLC
Why planning poker works
6Hoest, Martin, and Claes Wohlin. 1998. An Experimental Study of Individual Subjective Effort Estimations and Combinations of the Estimates.7Jørgensen, Magne, and Kjetil Moløkken. 2002. Combination of Software DevelopmentEffort Prediction Intervals: Why, When and How?
19
20
© Mountain Goat Software, LLC
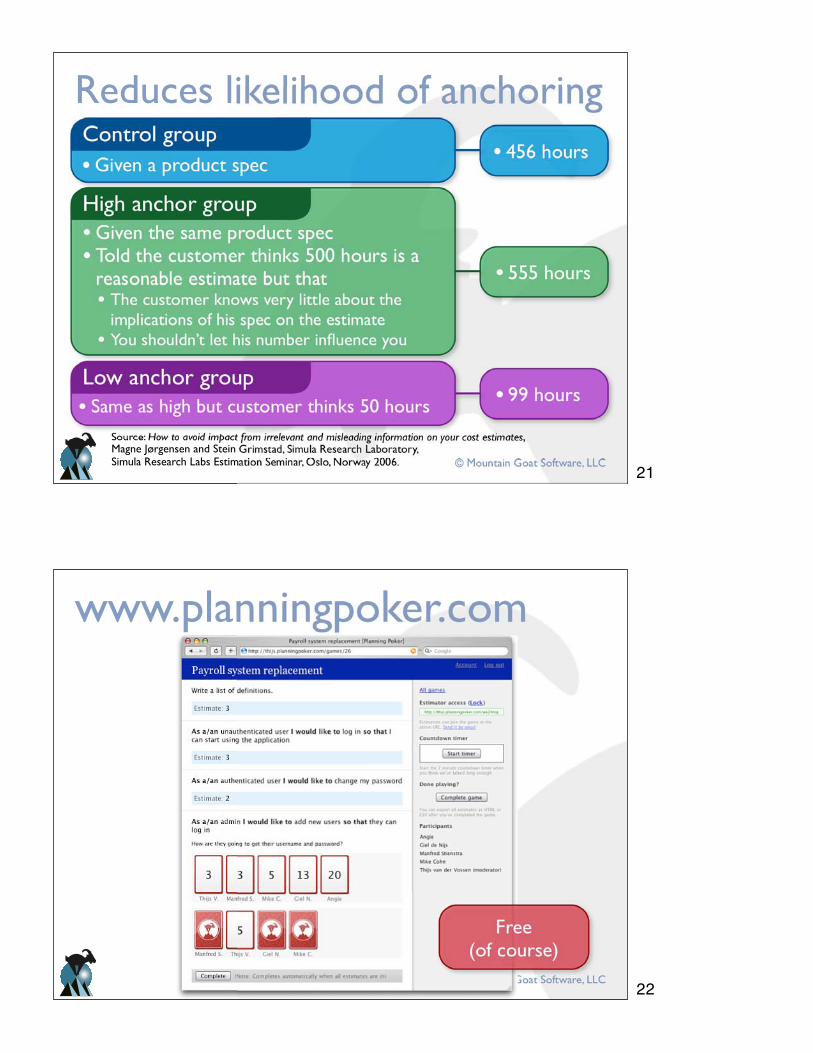
Reduces likelihood of anchoring
• Given a product spec
Control group• 456 hours
• Given the same product spec• Told the customer thinks 500 hours is a
reasonable estimate but that• The customer knows very little about the
implications of his spec on the estimate• You shouldn’t let his number influence you
High anchor group
• 555 hours
• Same as high but customer thinks 50 hoursLow anchor group
• 99 hours
Source: How to avoid impact from irrelevant and misleading information on your cost estimates, Magne Jørgensen and Stein Grimstad, Simula Research Laboratory,Simula Research Labs Estimation Seminar, Oslo, Norway 2006.
© Mountain Goat Software, LLC
www.planningpoker.com
21
22
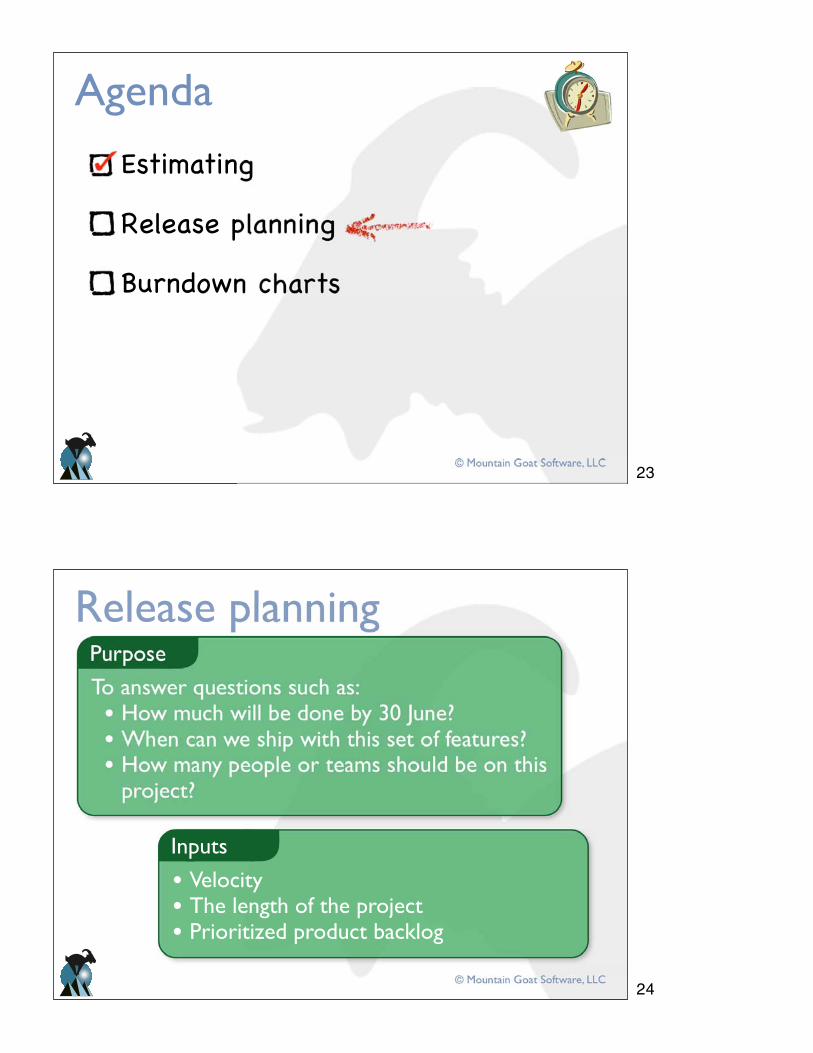
© Mountain Goat Software, LLC
Estimating
Release planning
Burndown charts
Agenda
© Mountain Goat Software, LLC
Release planning
To answer questions such as:• How much will be done by 30 June?• When can we ship with this set of features?• How many people or teams should be on this
project?
Purpose
• Velocity• The length of the project• Prioritized product backlog
Inputs
23
24
© Mountain Goat Software, LLC
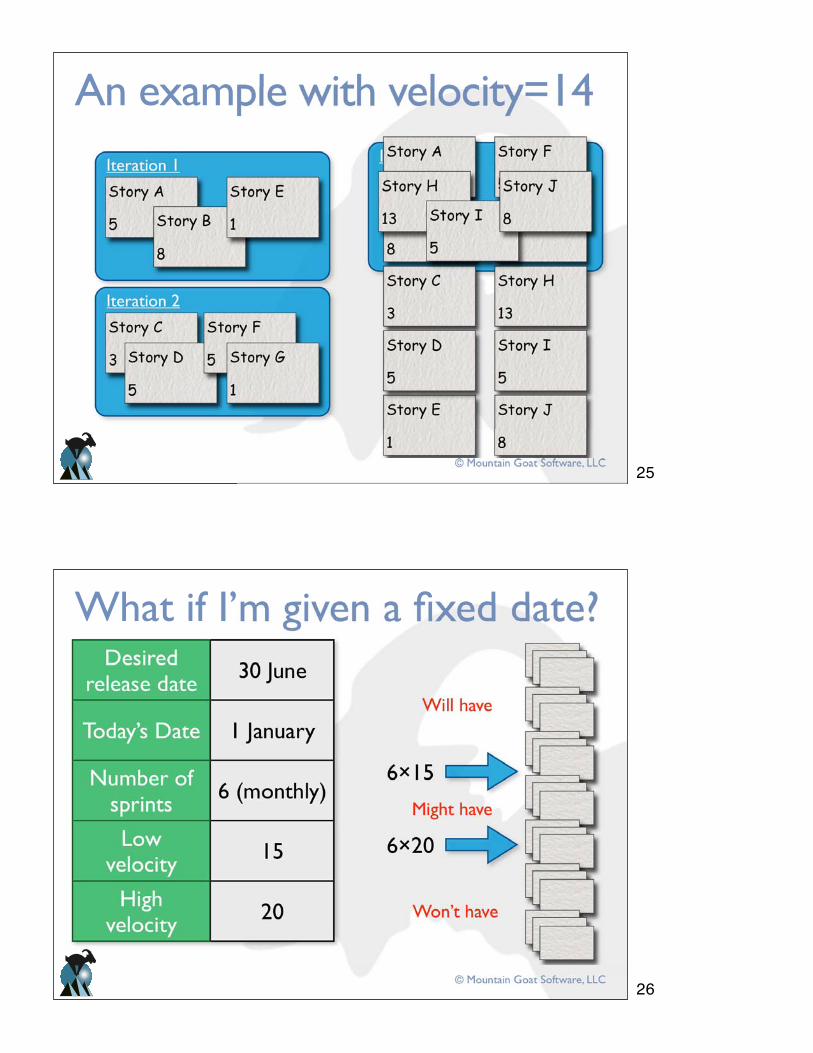
An example with velocity=14
© Mountain Goat Software, LLC
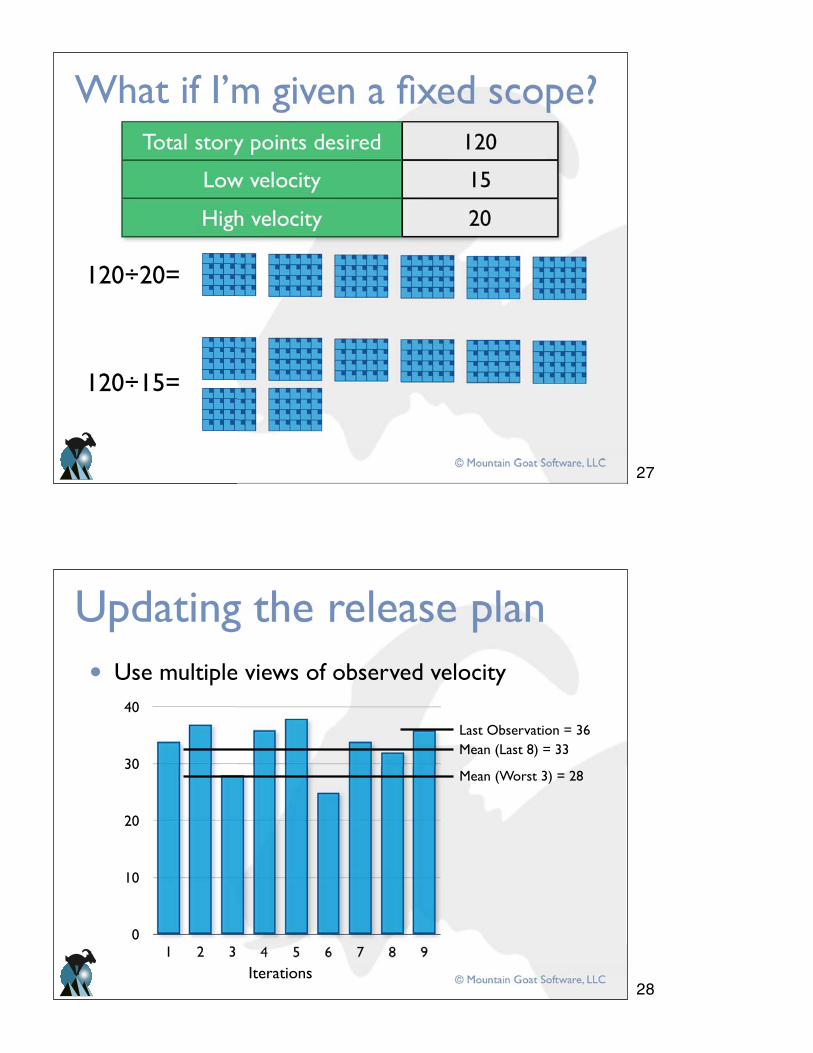
What if I’m given a fixed date?
6 15
6 20
Will have
Might have
Won’t have
25
26
© Mountain Goat Software, LLC
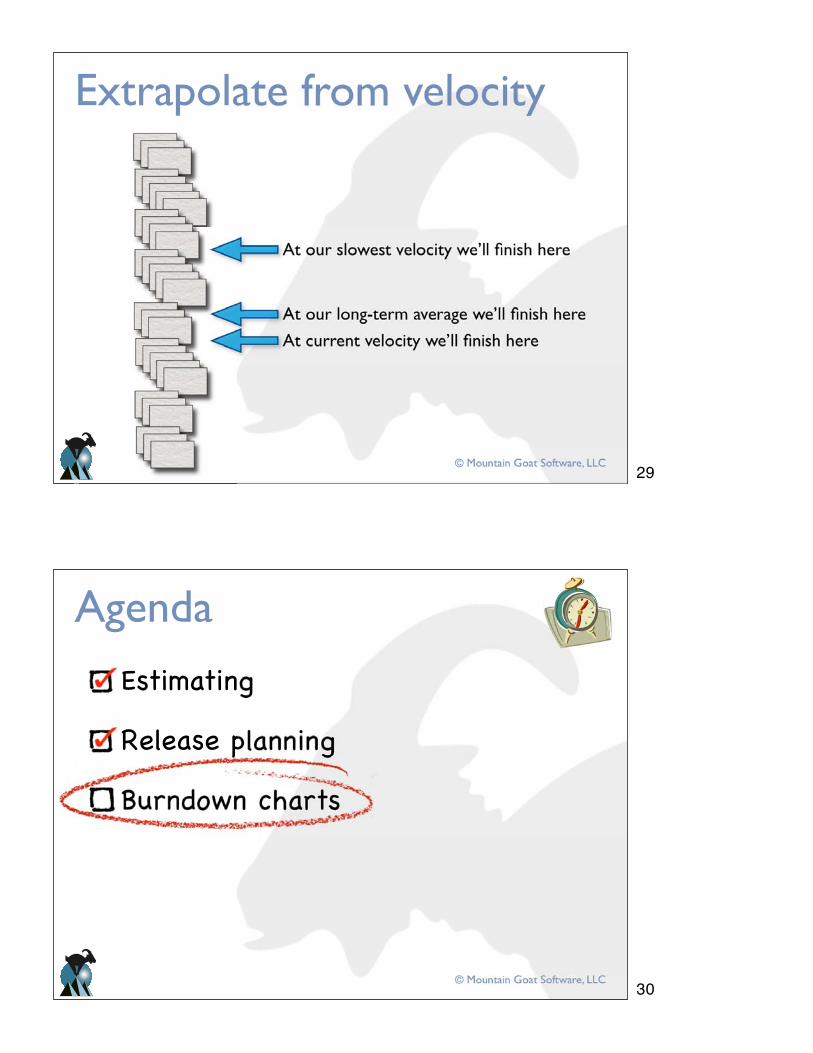
What if I’m given a fixed scope?
120÷20=
120÷15=
© Mountain Goat Software, LLC
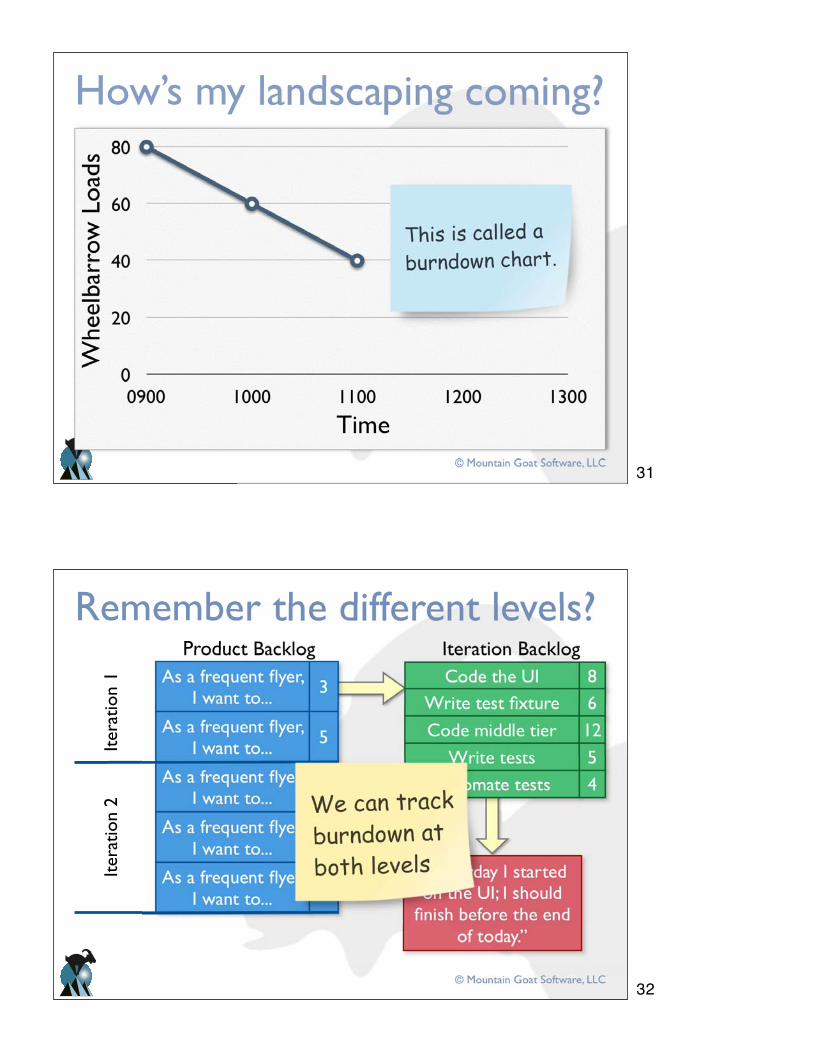
Updating the release plan
0
10
20
30
40
1 2 3 4 5 6 7 8 9Iterations
Mean (Worst 3) = 28
Mean (Last 8) = 33Last Observation = 36
• Use multiple views of observed velocity
27
28
© Mountain Goat Software, LLC
Extrapolate from velocity
At our long-term average we’ll finish here
At our slowest velocity we’ll finish here
At current velocity we’ll finish here
© Mountain Goat Software, LLC
Estimating
Release planning
Burndown charts
Agenda
29
30
© Mountain Goat Software, LLC
How’s my landscaping coming?
0
20
40
60
80
0900 1000 1100 1200 1300
Whe
elba
rrow
Loa
ds
Time
© Mountain Goat Software, LLC
Remember the different levels?
Iter
atio
n 2
Iter
atio
n 1
Product Backlog Iteration Backlog
31
32
© Mountain Goat Software, LLC
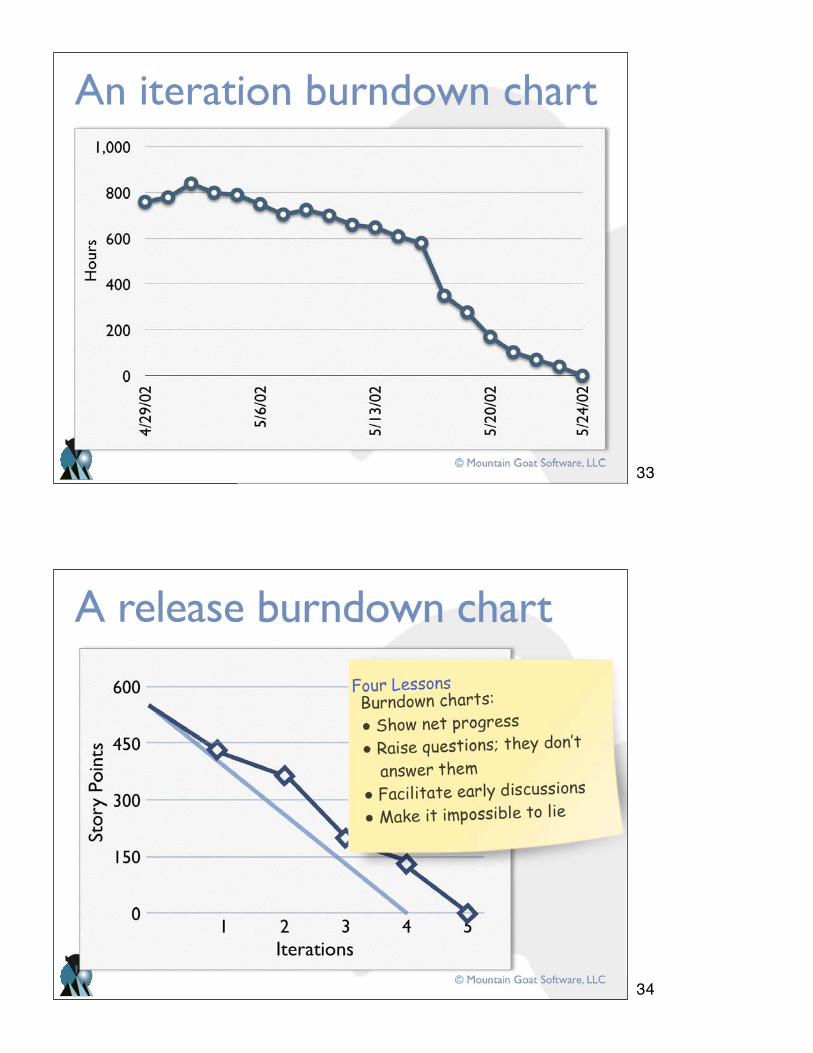
An iteration burndown chart
0
200
400
600
800
1,0004/
29/0
2
5/6/
02
5/13
/02
5/20
/02
5/24
/02
Hou
rs
© Mountain Goat Software, LLC
A release burndown chart
Stor
y Po
ints
Iterations
600
450
300
150
01 2 3 4 5
33
34
© Mountain Goat Software, LLC
Mike Cohn contact info
35