Plan smart with the right mix of investments. - TIAA smart with the right mix of investments. ......
24
Plan smart with the right mix of investments. Intelligent Variable Annuity® Intelligent Life® Variable Universal Life Insurance Intelligent Life® Survivorship Variable Universal Life Insurance
Transcript of Plan smart with the right mix of investments. - TIAA smart with the right mix of investments. ......

Plan smart with the right mix of investments.Intelligent Variable Annuity® Intelligent Life® Variable Universal Life Insurance Intelligent Life® Survivorship Variable Universal Life Insurance
T:11”
B:11.25”

Table of contents
1 Put your Investments to work
2 Step One: Determine risk tolerance
6 Step Two: How to use your scores
7 Step Three: Identify your investment style
8 Step Four: Finding your target allocation
9 Step Five: Consider a recommended portfolio
11 Step Five: Build your own portfolio
14 Investment management firms
Asset Allocation 1
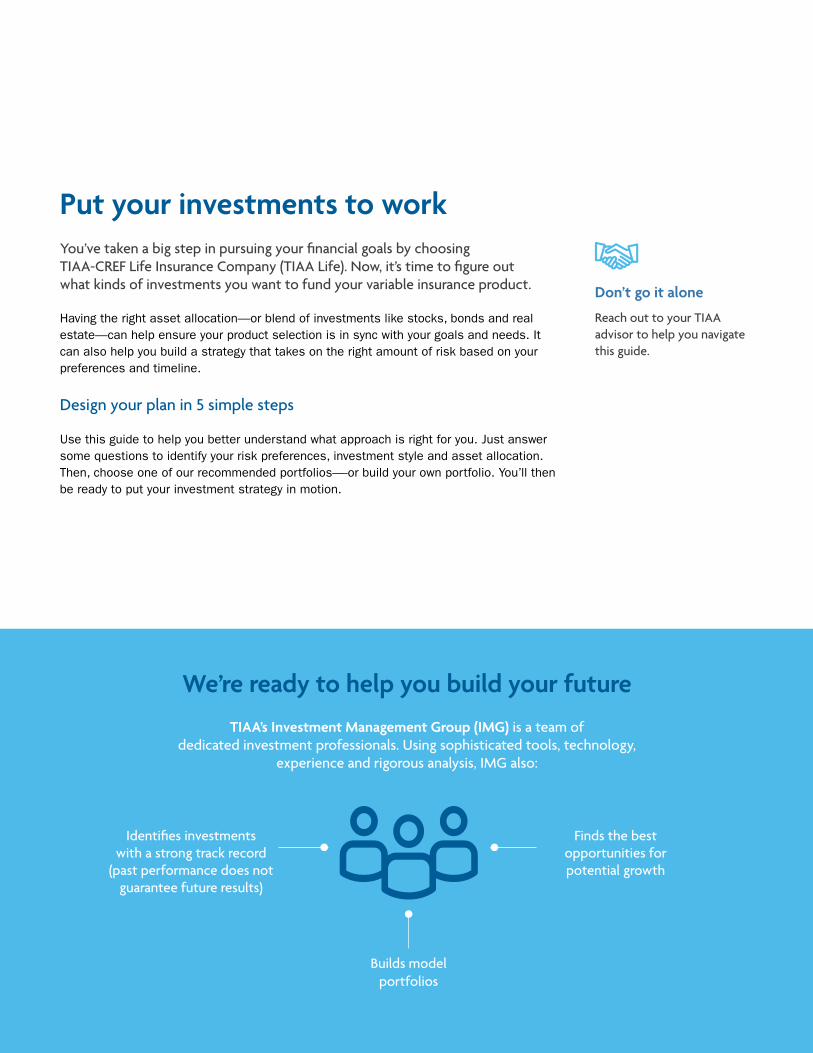
TIAA’s Investment Management Group (IMG) is a team of dedicated investment professionals. Using sophisticated tools, technology,
experience and rigorous analysis, IMG also:
We’re ready to help you build your future
Put your investments to work You’ve taken a big step in pursuing your financial goals by choosing TIAA-CREF Life Insurance Company (TIAA Life). Now, it’s time to figure out what kinds of investments you want to fund your variable insurance product.
Having the right asset allocation—or blend of investments like stocks, bonds and real estate—can help ensure your product selection is in sync with your goals and needs. It can also help you build a strategy that takes on the right amount of risk based on your preferences and timeline.
Design your plan in 5 simple steps
Use this guide to help you better understand what approach is right for you. Just answer some questions to identify your risk preferences, investment style and asset allocation. Then, choose one of our recommended portfolios—-or build your own portfolio. You’ll then be ready to put your investment strategy in motion.
Don’t go it alone
Reach out to your TIAA advisor to help you navigate this guide.
Identifies investments with a strong track record
(past performance does not guarantee future results)
Finds the best opportunities for potential growth
Builds model portfolios
T:11”
B:11.25”

2 Asset Allocation
Determine your risk toleranceUse this risk tolerance questionnaire1 to help determine how comfortable you are with risk. Risk tolerance is based primarily on two factors: your time horizon (the years you expect to invest before you start withdrawing money) and attitude toward taking investment risks. In most cases, the shorter the investment period, the less risk the investor can afford to take. While many people feel more comfortable with less exposure to risk, it’s important to note that there is generally a relationship between risk and return, with potentially higher returns coming from riskier investments.
1 Used by permission. ©2016 Morningstar Investment Management, LLC. All rights reserved.
Time horizon
1. When do you expect to begin withdrawing money from your investment account? (Choose one only)
a. Less than one year (0 Points)
b. 1 to 2 years (1 Point)
c. 3 to 4 years (3 Points)
d. 5 to 7 years (7 Points)
e. 8 to 10 years (9 Points)
f. 11 years or more (11 Points)
2. Once you begin withdrawing money from your investment account, how long do you expect the withdrawals to last? (Choose one only)
a. I plan to take a lump-sum distribution. (0 Points)
b. 1 to 4 years (2 Points)
c. 5 to 7 years (4 Points)
d. 8 to 10 years (5 Points)
e. 11 years or more (6 Points)
STEP ONE
Score
Time horizon score
(sum of scores from questions 1 and 2)
1.
2.

Asset Allocation 3
STEP ONE
The risk of inflation
Inflation, the rise in prices over time, can erode your investment return. If portfolio returns are lower than the inflation rate, an investor’s future buying power might actually decline. However, portfolios with long-term returns that significantly beat inflation tend to be associated with a higher degree of risk.
Risk tolerance
3. Which of the following portfolios is most consistent with your investment philosophy? (Choose one only)
a. Portfolio A seeks to exceed long-term inflation by a large margin and has a high degree of risk. (18 points)
b. Portfolio B seeks to exceed long-term inflation by a moderate margin and has a high to moderate degree of risk. (12 Points)
c. Portfolio C seeks to exceed long-term inflation by a small margin and has a moderate degree of risk. (6 Points)
d. Portfolio D seeks to match the rate of long-term inflation and has a low degree of risk. (0 Points)
4. Historically, portfolios with the highest average returns also tend to have the highest chance of short-term losses. The table below provides five hypothetical scenarios. Each of these scenarios offers a different degree of risk and reward over a one-year holding period.
Please select the option with which you are most comfortable.2
Hypothetical results at the end of one year
Potential gain at the end of one year
Potential loss at the end of one year
Portfolio A 5.8% 22% (0 Points)
Portfolio B 7.1% 25% (5 Points)
Portfolio C 8.4% 27% (9 points)
Portfolio D 9.7% 29% (14 points)
Portfolio E 11.1% 30% (18 points)
2 The maximum gain or loss on an investment is impossible to predict; results based on actual investments will vary. The ranges shown in the table are hypothetical and are designed solely to help determine an investor’s risk tolerance.
Score
3.
4.
T:11”
B:11.25”

4 Asset Allocation
Risk tolerance (continued)
5. Which statement best describes your investment goals?
a. Protect the value of my account. In order to minimize the chance for loss, I am willing to accept the lower long-term returns provided by conservative investments. (0 Points)
b. Keep risk to a minimum while trying to achieve slightly higher returns than the returns provided by investments that are more conservative. (5 Points)
c. Long-term growth is equally as important as managing portfolio risk. (10 Points)
d. Maximize long-term investment returns. I am willing to accept large and sometimes dramatic fluctuations in the value of my investments. (15 Points)
6. Historically, markets have experienced downturns, both short-term and prolonged, followed by market recoveries. Suppose you owned a well-diversified portfolio that fell by 20% (i.e., $1,000 initial investment would now be worth $800) over a short period, consistent with the overall market. Assuming you still have 10 years until you begin withdrawals, how would you react?
a. I would not change my portfolio. (15 Points)
b. I would wait at least one year before changing to options that are more conservative. (10 Points)
c. I would wait at least three months before changing to options that are more conservative. (5 Points)
d. I would immediately change to options that are more conservative. (0 Points)
A well-diversified portfolio is typically invested in many different types of assets—to help reduce risk and seek consistent performance.3
STEP ONE
Score
5.
6.
3 Diversification is a technique to help reduce risk. It is not guaranteed to protect against loss.

Asset Allocation 5
7. The following graph shows the hypothetical best and worst results of five sample portfolios over a one-year holding period. Note that the portfolio with the highest upside also has the largest potential downside. Which of the portfolios below would you prefer to hold?2
60%
50%
40%
30%
20%
10%
0%
–10%
–20%
–30%
–40%
RET
UR
N (
%)
PORTFOLIO A PORTFOLIO B PORTFOLIO C PORTFOLIO D
54%
45%
36%
28%
–14%
PORTFOLIO E
21%
–9%
–19%–25%
–32%
a. Portfolio A (19 Points)
b. Portfolio B (14 Points)
c. Portfolio C (9 Points)
d. Portfolio D (5 Points)
e. Portfolio E (0 Points)
8. I am comfortable with investments that may frequently experience large declines in value if there is a potential for higher returns. Does this describe you?
a. Agree (15 Points)
b. Disagree (8 Points)
c. Strongly Disagree (0 Points)
STEP ONE
Risk tolerance score
(sum of scores from questions 3–8)
Score
7.
8.
T:11”
B:11.25”

6 Asset Allocation
How to use your scoresYour scores will help determine which portfolio may suit you best. Your time horizon score is based on the length of time you can invest and potentially recover from market downturns. Typically, the shorter your time frame, the more conservative your recommended portfolio will be.
The risk tolerance score shows how much risk you’re willing to take. We combine these two scores to form a total score. Your total score directs you to a recommended portfolio, as indicated in this scoring grid.
To find your Portfolio, plot your Time Horizon score from page 2 and your Risk Tolerance score from page 5 on the grid below. For example, if your Time Horizon score is 15 and your Risk Tolerance score is 56, your Portfolio is 3.
Time Horizon score (from page 2) Risk Tolerance score (from page 5)
Time Horizon Score
1 – 2 3 – 5 6 – 7 8 – 10 11 +
Ris
k S
core
0 - 16Portfolio
1Portfolio
1Portfolio
1Portfolio
1Portfolio
1
17 - 39Portfolio
1Portfolio
2Portfolio
2Portfolio
2Portfolio
2
40 - 65Portfolio
1Portfolio
2Portfolio
3Portfolio
3Portfolio
3
66 - 87Portfolio
1Portfolio
2Portfolio
3Portfolio
4Portfolio
4
88 - 100Portfolio
1Portfolio
2Portfolio
3Portfolio
4Portfolio
5
STEP TWO
Portfolio 1Conservative
Portfolio 2 Moderately Conservative
Portfolio 3 Moderate
Portfolio 4 Moderate-Aggressive
Portfolio 5 Aggressive
Used with permission. ©2016 Morningstar Investment Management, LLC. All rights reserved

Asset Allocation 7
Ris
k S
core
Actively managed investments
Active fund managers make deliberate— or active—decisions to buy, sell or
hold securities. They conduct their own research to determine a method to strive to
outperform a recognized market index.
Passively managed investments
Passive fund managers try to match the performance of an index—not beat it. They
do not make ongoing buy, sell and hold decisions based on their research.
STEP THREE
Identify your investment styleOnce you identify your risk tolerance, you can choose an investment style.
Whether you prefer a more hands-on approach or want to go with the flow, there are two typical types of investment approaches: active or passive.4
What’s an index?
It’s a group of investments intended to represent a particular sector of the market. For example, the S&P 500, one of the most well-known indexes, tracks 500 large
companies on the New York Stock Exchange. You cannot invest directly in an index.
4 Please note that the terms active and passive refer to the management of the underlying funds in the portfolio models, and not the management of the overall models.
T:11”
B:11.25”

8 Asset Allocation
Finding your target allocationNow, use your portfolio number from page 6 to find your target allocation. The pie charts below show suggested allocations based on different time horizons and levels of risk tolerance.5
5 The portfolios, provided by IMG, may not take into account your particular goals or preferences.
Please note that no strategy can eliminate or anticipate all market risks, and losses can occur.
The Conservative portfolio is designed to potentially provide stability and protection from loss to investors who either have a short time horizon and/or a primary goal of avoiding potential loss. The stability of this portfolio comes at the expense of achieving potentially higher long-term returns.
W 19% Domestic Stocks
W 8% International Stocks
W 71% Bonds/Fixed Income
W 0% Real Estate Stocks
W 2% Cash Equivalents
W 29% Domestic Stocks
W 14% International Stocks
W 55% Bonds/Fixed Income
W 0% Real Estate Stocks
W 2% Cash Equivalents
W 34% Domestic Stocks
W 20% International Stocks
W 41% Bonds/Fixed Income
W 4% Real Estate Stocks
W 1% Cash Equivalents
W 45% Domestic Stocks
W 20% International Stocks
W 29% Bonds/Fixed Income
W 5% Real Estate Stocks
W 1% Cash Equivalents
W 53% Domestic Stocks
W 24% International Stocks
W 17% Bonds/Fixed Income
W 5% Real Estate Stocks
W 1% Cash Equivalents
Portfolio 1 - Conservative
The Moderate-Conservative portfolio primarily attempts to avoid short-term loss, but still seeks somewhat higher returns over the long term. To achieve higher potential returns, some fluctuations in investment value are to be expected.
Portfolio 2 - Moderate-Conservative
The Moderate portfolio is designed for those who are equally concerned with risk and return. The objective for this portfolio is to provide returns that outpace inflation over the long term. Those using the suggested allocation for this portfolio should be comfortable with fluctuations in the portfolio’s value and occasional short-term loss.
Portfolio 3 - Moderate
The Moderate-Aggressive portfolio is designed for investors seeking greater accumulation over intermediate to long-term horizons. Those using the suggested allocation for this portfolio must be comfortable with more-than-average volatility and potential short-term losses to achieve the desired higher returns.
Portfolio 4 - Moderate-Aggressive
The Aggressive portfolio is designed for investors seeking the potential for even greater returns over a long-term horizon. Those using the suggested allocation for this portfolio must be comfortable with experiencing frequent short-term loss and extreme volatility in port-folio value in exchange for potentially higher returns over the long term.
Portfolio 5 - Aggressive
STEP FOUR

Asset Allocation 9
Consider a recommended portfolio or build your ownYou can have your allocations match one of the IMG-built portfolios. Or, you can select your investments and choose how your assets are allocated starting on page 11. Consider working with your advisor to help you decide the right approach.
Recommended active portfolios Portfolio 1 Portfolio 2 Portfolio 3 Portfolio 4 Portfolio 5
Fund Name
Conservative
W 27% Equity W 71% Fixed IncomeW 2% Cash
Moderate- Conservative
W 43% Equity W 55% Fixed IncomeW 2% Cash
Moderate
W 58% Equity W 41% Fixed IncomeW 1% Cash
Moderate- Aggressive
W 70% Equity W 29% Fixed IncomeW 1% Cash
Aggressive
W 82% Equity W 17% Fixed IncomeW 1% Cash
ClearBridge Variable Aggressive Growth Portfolio-Class I 7% 7% 10% 12% 14%
PVC Equity Income Account – Class I 7% 11% 11% 15% 17%
Franklin Small-Mid Cap Growth VIP Fund 0% 0% 3% 3% 6%
Neuberger Berman AMT Mid Cap Intrinsic Value Portfolio – I Class 5% 7% 7% 9% 10%
Vanguard VIF Small Company Growth Portfolio 0% 0% 0% 3% 3%
Delaware VIP Small-Cap Value Series – Standard Class 0% 4% 3% 3% 3%
Delaware VIP International Value Equity Series – Standard Class 4% 4% 10% 10% 12%
DFA VA International Small Portfolio 4% 5% 5% 5% 5%
John Hancock Emerging Markets Value Trust 0% 5% 5% 5% 7%
Vanguard VIF REIT Index Portfolio 0% 0% 4% 5% 5%
TIAA-CREF Life Bond Fund 11% 9% 6% 6% 4%
Vanguard VIF Total Bond Market Index Portfolio 11% 9% 6% 0% 0%
T. Rowe Price Limited-Term Bond Portfolio 11% 6% 9% 4% 0%
DFA VA Short-Term Fixed Portfolio 11% 5% 0% 0% 0%
PIMCO VIT Emerging Markets Bond 4% 4% 4% 5% 4%
PIMCO VIT Real Return Portfolio-Institutional Class 15% 14% 12% 11% 6%
Vanguard VIF High Yield Bond Portfolio 8% 8% 4% 3% 3%
TIAA-CREF Life Money Market Fund 2% 2% 1% 1% 1%
Total 100% 100% 100% 100% 100%
Portfolio weighted average expense ratio6 0.51 0.57 0.65 0.68 0.71
STEP FIVE
T:11”
B:11.25”

10 Asset Allocation
Recommended passive portfolios
Portfolio 1 Portfolio 2 Portfolio 3 Portfolio 4 Portfolio 5
Fund Name
Conservative
W 27% Equity W 71% Fixed IncomeW 2% Cash
Moderate- Conservative
W 43% Equity W 55% Fixed IncomeW 2% Cash
Moderate
W 58% Equity W 41% Fixed IncomeW 1% Cash
Moderate- Aggressive
W 70% Equity W 29% Fixed IncomeW 1% Cash
Aggressive
W 82% Equity W 17% Fixed IncomeW 1% Cash
TIAA-CREF Life Stock Index Fund 7% 7% 10% 12% 14%
DFA VA US Large Value Portfolio 7% 11% 11% 15% 17%
Vanguard VIF Mid-Cap Index Portfolio 5% 7% 10% 12% 16%
Vanguard VIF Small Company Growth Portfolio 0% 0% 0% 3% 3%
DFA VA US Targeted Value Portfolio 0% 4% 3% 3% 3%
VA International Value Portfolio 4% 4% 10% 10% 12%
DFA VA International Small Portfolio 4% 5% 5% 5% 5%
John Hancock Emerging Markets Value Trust 0% 5% 5% 5% 7%
Vanguard VIF REIT Index Portfolio 0% 0% 4% 5% 5%
Vanguard VIF Total Bond Market Index Portfolio 22% 18% 12% 6% 4%
DFA VA Short-Term Fixed Portfolio 22% 11% 9% 4% 0%
PIMCO VIT Emerging Markets Bond Portfolio-Institutional Class 4% 4% 4% 5% 4%
PIMCO VIT Real Return Portfolio- Institutional Class 15% 14% 12% 11% 6%
Vanguard VIF High Yield Bond Portfolio 8% 8% 4% 3% 3%
TIAA-CREF Life Money Market Fund 2% 2% 1% 1% 1%
Total 100% 100% 100% 100% 100%
Portfolio weighted average expense ratio6 0.32 0.36 0.37 0.37 0.37
STEP FIVE
Although asset allocation is intended to mitigate investment risk, implementation does not guarantee a profit or protect against a loss. Investment options and allocation percentages may change over time and may be different from previous models. Performance returns depicted are calculated based on the current models revised as of 6/20/16. Performance does not reflect previous model allocations.
6 The expenses for each fund is weighted pursuant to the recommended allocation amount, resulting in the Total weighted expense for each Portfolio. Expenses for each portfolio can be found in the policy and fund prospectuses.

Asset Allocation 11
Build your own portfolioYou can choose from a wide array of investments—listed by classification in this section*—to build your portfolio. Work with your advisor to help you select investments and determine how your assets are allocated. You and your advisor can also refer to this section when completing your application. (For more on the investment firms, see page 14.)
Domestic Equity
Value Blend Growth
Large-Cap W PVC Equity Income Account – Class I W TIAA-CREF Life Large-Cap Value Fund W DFA VA US Large Value Portfolio
W Franklin Mutual Shares VIP Fund7
W Neuberger Berman AMT Large Cap Value Portfolio – I Class
W TIAA-CREF Life Social Choice Equity Fund W TIAA-CREF Life Stock Index Fund W Prudential Series Fund – Value Portfolio – Class II
W Vanguard VIF Equity Index Portfolio
W Janus Henderson Forty Portfolio 8 W MFS Growth Series 9 – Initial Class W Prudential Series Fund – Jennison 20/20 Focus Portfolio – Class II
W ClearBridge Variable Aggressive Growth Portfolio 10 – Class 1
W MFS Massachusetts Investors Growth Stock Portfolio 11
W TIAA-CREF Life Growth Equity Fund W TIAA-CREF Life Growth & Income Fund W Vanguard VIF Capital Growth Portfolio
Mid-Cap W Neuberger Berman AMT Mid Cap Intrinsic Value Portfolio – I Class
W Janus Henderson Mid Cap Value Portfolio 12
W Matson Money U.S. Equity VI Portfolio
W PVC MidCap Account 13 – Class I W Vanguard VIF Mid-Cap Index Portfolio
W Franklin Small-Mid Cap Growth VIP Fund14
W Wanger Select
Small-Cap W Delaware VIP Small-Cap Value Series – Standard Class
W DFA VA US Targeted Value Portfolio
W Royce Capital Fund Micro-Cap Portfolio – Investment Class
W Royce Capital Fund Small-Cap Portfolio – Investment Class
W TIAA-CREF Life Small-Cap Equity Fund
W ClearBridge Variable Small Cap Growth Portfolio 15 – Class I
W Vanguard VIF Small Company Growth Portfolio
W Wanger USA
7 Formerly known as Mutual Shares Securities Fund-Class 1. 8 Formerly known as Janus Aspen Forty Portfolio – Institutional Shares. 9 Effective February 18, 2013, the MFS Growth Series is closed to new investors. 10 Formerly known as Legg Mason Variable Aggressive Growth Portfolio.11 Effective March 27, 2015, the MFS Investors Growth Stock Series-Initial Class merged with the MFS Massachusetts Investors Growth
Stock Portfolio. 12 Formerly known as Janus Aspen Perkins Mid Cap Value Portfolio – Institutional Shares.13 Closed to new contract owners effective August 15, 2013.14 Formerly known as Franklin Small-Mid Cap Growth Securities Fund-Class 115 Formerly known as Legg Mason Variable Small Cap Growth Portfolio.
* Classification of the investment options was made by Morningstar.
© 2016 Morningstar, Inc. All Rights Reserved. The information contained herein: (1) is proprietary to Morningstar; (2) may not be copied or distributed; and (3) is not warranted to be accurate, complete or timely. Neither Morningstar nor its content providers are responsible for any damages or losses arising from any use of this information. Past performance is no guarantee of future results.
STEP FIVE
T:11”
B:11.25”

12 Asset Allocation
International/Global Equity
Value Blend Growth
Large-Cap W Delaware VIP International Value Equity Series – Standard Class
W Templeton Developing Markets VIP Fund16
W DFA VA International Value Portfolio W DFA VA Equity Allocation Portfolio
W TIAA-CREF Life International Equity Fund W John Hancock Emerging Markets Value Trust
W Janus Henderson Overseas Portfolio 17 W MFS Global Equity Series 18 – Initial Class
Mid-Cap W Matson Money International Equity VI Portfolio
W DFA VA International Small Portfolio W Wanger International
16 Formerly known as Templeton Developing Markets Securities Fund-Class 1.17 Formerly known as Janus Aspen Overseas Portfolio-Institutional Shares. Effective February 18, 2013, the Janus Aspen Overseas Portfolio is closed to new investors.18 Consists of both domestic and international equity.
Fixed Income
Short Term Intermediate Term Long Term
High W DFA VA Short-Term Fixed Portfolio
W Matson Money Fixed Income VI Portfolio
W TIAA-CREF Life Bond Fund W DFA VA Global Bond Portfolio W Vanguard VIF Total Bond Market Index Portfolio
W PIMCO VIT Real Return Portfolio 19 – Institutional Class W PIMCO VIT Global Bond Portfolio (Unhedged) – Institutional Class
W DFA VIT Inflation Protected Securities Portfolio20
Medium W T. Rowe Price Limited - Term Bond Portfolio
W Delaware VIP Diversified Income Series – Standard Class
W PIMCO VIT Emerging Markets Bond Portfolio – Institutional Class
Low W Vanguard VIF High Yield Bond Portfolio W Western Asset Variable Global High Yield Bond Portfolio21 – Class I
19 The PIMCO VIT Real Return Portfolio is primarily invested in inflation-protected securities.20 Not available in Intelligent Variable Annuity (IVA).21 Formerly known as Legg Mason Western Asset Variable Global High Yield Bond Portfolio.
STEP FIVE
Asset Allocation 13
Other
Balanced W Calamos Growth & Income Portfolio 22
W DFA VA Global Moderate Allocation Portfolio W Franklin Income VIP Fund23
W PIMCO VIT All Asset Portfolio – Institutional Class W TIAA-CREF Life Balanced Fund
Sector Spe-cific
W Credit Suisse Trust-Commodity Return Strategy Portfolio W VY Clarion Global Real Estate Portfolio – Class I W MFS Utilities Series – Initial Class W PIMCO VIT Commodity Real Return Strategy Portfolio – Institutional Class
W Prudential Series Fund – Natural Resources Portfolio – Class ll W TIAA-CREF Life Real Estate Securities Fund W T. Rowe Price Health Sciences Portfolio I W Vanguard VIF REIT Index Portfolio
Other W TIAA-CREF Life Money Market Fund
22 Effective July 30, 2012, the Calamos Growth & Income Portfolio is closed to new investors.23 Formerly known as Franklin Income Securities Fund-Class 1.
Money in the TIAA Life Fixed Account is part of the TIAA Life General Account and is managed by TIAA investment professionals. It is only available in Intelligent Life Variable Universal Life Insurance and Intelligent Life Survivorship Variable Universal Life Insurance. Funds earn a current interest rate, but never less than the guaranteed crediting rate stated in the policy contract. This guarantee is backed by the claims-paying ability of TIAA-CREF Life Insurance Company. The TIAA Life Fixed Account has not been analyzed by Morningstar Investment Management LLC.
Your TIAA advisor is ready to help
Now that you’ve built an asset mix attuned to your goals, it’s time to put it in action to help power your variable product’s potential. Reach out to your TIAA advisor
to implement your asset allocation strategy.
Questions? Call 855-200-6529 to speak to a TIAA representative.
If you are working with a non-TIAA financial advisor, please consult him or her before making investment decisions.
STEP FIVE
T:11”
B:11.25”

14 Asset Allocation
About the firm
Over 30 years in business W Calamos Investments is a global investment firm committed to excellence in investment management and client services.
W A global investment platform with focused, experienced teams, specialized by investment discipline
W Serving the needs of institutional and individual investors for over 30 years
W Offering a range of global investment solutions to work with a client’s asset allocation framework
– Equity
– Fixed Income
– Convertibles
– Alternatives
W Publicly listed, employee-owned business
W 333 employees, 68 investment professionals
$18.3 Billion Assets Under Management as of 12/31/16
Over 25 years in business
W Adherence to the Growth at a Reasonable Price (GARP) style has caused the firm to correctly react to valuation extremes in the market.
W Experienced team of professionals dedicated to robust fundamental research focused on small and mid-cap stocks.
W Consistent investment process since inception of Columbia Acorn Fund in 1970
W The Advisor is a registered investment advisor and wholly owned subsidiary of Ameriprise Financial.
$456.3 Billion Assets Under Management as of 12/31/16
Over 150 years in business
W Credit Suisse Asset Management is a multi-specialist boutique manager operating within a leading global financial institution. Our multi-specialist boutique approach is combined with the institutional quality governance, stability and opportunity of Credit Suisse’s worldwide franchise. This allows us to deliver distinct product expertise through active and passive solutions in both traditional and alternative investments.
W By leveraging the oversight, infrastructure, insights and talent of our parent organization, we ensure that our multi-specialist boutiques remain nimble, performance- and client-focused. Similarly, we focus on our distinct strengths and form partnerships with experienced managers to unearth hard to source alpha opportunities on behalf of our clients.
W Our globally diverse client base includes governments, central banks, corporations, pension and endowment funds, sovereign wealth funds, family offices and private individuals.
$314.4 Billion Assets Under Management as of 12/31/16
Investment account
W Calamos Growth & Income Portfolio W Wanger International W Wanger Select W Wanger USA
W Credit Suisse Trust-Commodity Return Strategy Portfolio
Investment management firmsOnce you’ve completed the five steps, learn how the 20 highly regarded firms - included in our portfolios- can help support your investment needs.

Asset Allocation 15
About the firm
Over 85 years in business W Macquarie is a global provider of banking advisory, financial, investment, and asset management services established in Australia in 1969. Asset management is the largest contributor to the firm’s results, and Macquarie Asset Management is a top 50 global asset manager, a top 10 insurance manager, and the world’s largest infrastructure manager. Macquarie Investment Management (MIM) forms part of the asset management arm of Macquarie Group, a diversified global business with more than 45 years of unbroken profitability.
W Macquarie Investment Management (MIM) is a global asset manager with offices throughout the US, Europe, Asia, and Australia. We are active managers who prioritize autonomy and accountability at the investment team level in pursuit of opportunities that matter for clients. Our conviction-based, long-term approach guides us in managing assets on behalf of investors worldwide, across fixed income, equities, listed real estate, listed infrastructure, hedge funds, and multi-asset solutions. In the US, retail investors recognize our Delaware FundsSM by Macquarie as one of the longest-standing mutual fund families, with more than 75 years in existence.
$167.2 Billion Assets Under Management as of 12/31/16
Over 30 years in business W Dimensional Fund Advisors is a leading global investment firm that has been translating academic research into practical investment solutions since 1981. Guided by a strong belief in markets, Dimensional* builds and manages strategies to help clients pursue higher expected returns. The firm works closely with leading financial academics to identify new ideas that may benefit investors and applies a dynamic investment process that integrates advanced research with careful portfolio design and implementation, while balancing the investment tradeoffs that can impact returns.
W Dimensional has a long history of putting financial science to work for clients. In 1981, the firm introduced its first strategy, a US small cap strategy, to help institutional investors diversify beyond large cap stocks. The launch coincided with research documenting the stronger performance of US small cap stocks. Over the years, Dimensional has created a full suite of global equity and fixed income strategies in response to new research and evolving client needs.
W Dimensional is headquartered in Austin, Texas, and maintains trading offices in North America, Europe, and the Asia-Pacific region. As of December 30, 2016, Dimensional* and its affiliates manage $460 billion for investors worldwide.
$460 Billion Global Assets Under Management as of 12/31/16* “Dimensional” refers to the Dimensional separate but
affiliated entities generally, rather than to one particular entity. These entities are Dimensional Fund Advisors LP, Dimensional Fund Advisors Ltd., DFA Australia Limited, Dimensional Fund Advisors Canada ULC, Dimensional Fund Advisors Pte. Ltd., and Dimensional Japan Ltd.
Over 60 years in business W Franklin Templeton’s distinct multimanager structure combines the specialized expertise of three world-class investment management groups – Franklin, Templeton and Mutual Series.
W Franklin: Founded in 1947, Franklin is a recognized leader in fixed-income investing and also brings expertise in growth- and value-style U.S. equity investing.
W Templeton: Founded in 1940, Templeton pioneered international investing and, in 1954, launched what has become the industry’s oldest global fund. Today, with offices in over 25 countries, Templeton offers investors a truly global perspective.
W Mutual Series: Founded in 1949, Mutual Series is dedicated to a unique style of value investing, searching aggressively for opportunity among what it believes are undervalued stocks, as well as arbitrage situations and distressed securities.
$720 Billion Assets Under Management as of 12/31/16
Investment account
W Delaware VIP Diversified Income Series – Standard Class
W Delaware VIP International Value Equity Series – Standard Class
W Delaware VIP Small-Cap Value Series – Standard Class
W DFA VA Equity Allocation Portfolio W DFA VA Global Bond Portfolio W DFA VA Global Moderate Allocation Portfolio W DFA VA International Small Portfolio W DFA VA International Value Portfolio W DFA VA Short-Term Fixed Portfolio W DFA VA US Large Value Portfolio W DFA VA US Targeted Value Portfolio W DFA VIT Inflation-Protected Securities Portfolio*
*Not available with the Intelligent Variable Annuity (IVA).
W Franklin Income VIP Fund W Franklin Mutual Shares VIP Fund W Franklin Small-Mid Cap Growth VIP Fund W Templeton Developing Markets VIP Fund
T:11”
B:11.25”

16 Asset Allocation
About the firm
Over 40 years in business
W Since 1969, Janus Capital Group has stayed true to our mission: deliver better client outcomes through actively managed investment solutions. Today, we offer a broad range of fixed income, equity, alternative and multi-asset strategies managed by Janus, INTECH, and Perkins, as well as a suite of exchange traded products. Through expertise in security selection, portfolio construction, and asset allocation, we help investors meet their goals of growth, volatility management, uncorrelated returns and income.
W Our forward-looking, innovative product development strategy is responsive to the needs of investors in today’s complex market environment. With more than 100 expertly constructed investment strategies and an unwavering focus on delivering superior risk-adjusted returns, Janus can meet the needs of virtually any investor.
$194.5 Billion Assets Under Management as of 12/31/16
Over 47 years in business
W Commitment to Performance: Superior long-term investment returns for over 47 years.
W Investment Culture: Values individual impact and rewards team performance
W Consistent Philosophy: Internal Fundamental Research, bottom-up stock selection and a highly interactive investment process
W Top-Caliber Investment Talent: Small, highly experienced investment teams exclusively focused on investing
$159.8 Billion Assets Under Management as of 12/31/16
Over 150 years of promises kept
W John Hancock Investments is a premier asset manager representing one of America’s most trusted brands, with a heritage of financial stewardship dating back to 1862. Helping our shareholders pursue their financial goals is at the core of everything we do. It’s why we support the role of professional financial advice and operate with the highest standards of conduct and integrity.
W We serve investors globally through a unique multimanager approach: We search the world to find proven portfolio teams with specialized expertise for every strategy we offer, then we apply robust investment oversight to ensure they continue to meet our uncompromising standards and serve the best interests of our shareholders.
W Our unique approach to asset management enables us to provide a diverse set of investments backed by some of the world’s best managers, along with strong risk-adjusted returns across asset classes.
$135.6 Billion Assets Under Management as of 12/31/16
Investment account
W Janus Henderson Forty Portfolio
W Janus Henderson Mid Cap Value Portfolio
W Janus Henderson Overseas Portfolio
W Prudential Series Fund – Jennison 20/20 Focus Portfolio – Class II
W Prudential Series Fund – Natural Resources Portfolio – Class II
W Prudential Series Fund – Value Portfolio – Class II
W John Hancock Emerging Markets Value Trust

Asset Allocation 17
About the firm
Over 115 years in business
W Since its founding in 1899, Legg Mason has evolved into one of the largest asset management firms in the world, serving individual and institutional investors on six continents.
W Today’s Legg Mason is a globally diversified family of independent investment managers who are each widely recognized for their specialized expertise, commitment to long-term performance and outstanding client service.
W The distinctive Legg Mason “multi-manager” business model provides clients with a broad spectrum of investment solutions across asset classes, geographies and channels. Legg Mason’s corporate services include global retail distribution, capital management, as well as fiduciary and governance oversight.
$710 Billion Assets Under Management as of 12/31/16
Over 20 years in business
W Established in 1991, (as Matrix Asset Allocation, Inc.) Matson Money’s unique approach to investing is firmly grounded in Nobel-Prize winning financial and economic principles. Matson Money brings academic concepts used by institutional investors to Main Street, helping investors understand their investment approach, bring discipline to the investing process and build investor confidence.
W Over the last 25 plus years, Matson Money has brought investing education and coaching programs to thousands of financial professionals and investors nationwide. These programs focus on sharing the concepts of free markets, diversification, discipline and rebalancing to create a long-term approach to life-long endeavor.
W As of December 31, 2016, Matson Money manages $7.1 billion for thousands of investors in America through independent financial professionals. Through education and strong investment solutions, Matson Money helps individuals create the wealth they need to have the life they want. To that end, we are pleased to announce two new products we’re offering in partnership with TIAA. We are bringing true no-load Variable Life and Variable Annuity products to the marketplace that also provide the investor with the diversification, discipline and solid economic theory that sets Matson Money apart from other investment firms.
$7.1 Billion Assets Under Management as of 12/31/16
Over 92 years in business
We recognize that investment professionals and the clients who work with them look for investment managers with the expertise to deliver consistent returns over the long term. A long-term discipline drives the way we think, the way we invest and the way we are rewarded. MFS is an active, global investment manager with a uniquely collaborative approach that brings you our best insights and expertise through:
Integrated Research
We analyze opportunities across geographies, across fundamental and quantitative disciplines and across an organization’s entire capital structure to develop a fuller perspective on securities we select for our clients.
Global Collaboration
Our people, teams and compensation structure ensure collaboration so that our clients benefit from a shared, worldwide view of investing opportunities.
Active Risk Management
Every member of our investment team is responsible for managing risk and delivering to our clients the greatest possible return within each portfolio’s risk guidelines.
As a premier global investment manager with offices in Boston, Toronto, London, Mexico City, Sao Paulo, Singapore, Sydney, Hong Kong and Tokyo, MFS offers a broad range of mutual funds, separate accounts and retirement planning products. All the firm’s products are sold exclusively through financial intermediaries.
$425.6 Billion Assets Under Management as of 12/31/16
Investment account
W ClearBridge Variable Aggressive Growth Portfolio – Class I
W ClearBridge Variable Small Cap Growth Portfolio – Class I
W Western Asset Variable Global High Yield Bond Portfolio – Class I
W Matson Money Fixed Income VI Portfolio
W Matson Money International Equity VI Portfolio
W Matson Money U.S. Equity VI Portfolio
W MFS Global Equity Series – Initial Class
W MFS Growth Series – Initial Class
W MFS Massachusetts Investors Growth Stock Portfolio
W MFS Utilities Series – Initial Class
T:11”
B:11.25”

18 Asset Allocation
About the firm
Over 70 years in business
W Neuberger Berman is a private, independent, employee-owned investment manager.
W With more than 500 investment professionals and over 1,900 employees in total, Neuberger Berman has built a diverse team of individuals united in their commitment to client outcomes and investment excellence.
W Founded in 1939 Neuberger Berman manages a range of equity, fixed income, private equity and hedge fund strategies on behalf of institutions, advisors and individual investors worldwide.
$255 Billion Assets Under Management as of 12/31/16
Over 40 years in business
W PIMCO is a global investment management firm with a singular focus on preserving and enhancing investors’ assets.
W We manage investments for institutions, financial advisors and individuals. The institutions we serve include corporations, central banks, universities, endowments and foundations, and public and private pension and retirement plans. We also serve advisors and individuals set on personal financial goals, from preparing for retirement to funding higher education.
W PIMCO’s mission has been grounded in a holistic investment process designed to apply rigorous top-down and bottom-up analysis of inputs to identify investment opportunities and risks. Since our founding in Newport Beach, California, in 1971, we have grown into a team of more than 2,200 dedicated professionals, with offices in 11 countries and trading operations in North America, Europe and Asia. We have an established reputation of innovation, and we continue to evolve as a provider of investment solutions across all asset classes.
$1.47* Trillion Assets Under Management as of 12/31/16
* Effective March 31, 2012, PIMCO began reporting the assets managed on behalf of its parent’s affiliated companies as part of its assets under management. PIMCO manages $1.47 trillion in assets, including $1.09 trillion in third-party client assets as of December 31, 2016.
Over 130 years in business
W Principal Global Investors is a diversified asset management organization and a member of the Principal Financial Group® (“The Principal®”), a leading global financial institution. The Principal offers a wide range of financial products and services, with institutional asset management as part of its core business. The Principal was founded in 1879 and began managing retirement assets in 1941.
W As of December 31, 2016, Principal Global Investors has more than $411.1 billion* in assets under management and manages assets for institutions in over 70 countries, trading in daylight hours in every time zone around the world.
W Investment capabilities encompass a range of equity, fixed-income and real estate investments, as well as specialized investment strategies.
$591.6 Billion Assets Under Management as of 12/31/16
* As of December 31, 2016. Principal Global Investors is the asset management arm of the Principal Financial Group® (Principal®)¹ and includes the asset management operations of the following subsidiaries of Principal®: Principal Global Investors, LLC; Principal Real Estate Investors, LLC; Principal Enterprise Capital, LLC; Spectrum Asset Management, Inc.; Post Advisory Group, LLC; Columbus Circle Investors; Edge Asset Management, Inc.; Morley Financial Services Inc.; Finisterre Capital, LLP; Origin Asset Management, LLP; Principal Global Investors (Europe) Limited; Principal Global Investors (Singapore) Ltd.; Principal Global Investors (Australia) Ltd.; Principal Global Investors (Japan) Ltd.; Principal Global Investors (Hong Kong) Ltd. Marketing assets under management may include assets that are managed by Principal International for which Principal Global Investors provides, or may provide access to proprietary investment research, recommendations, model portfolios or other advisory related services or systems. Assets under management includes assets managed by investment professionals of Principal Global Investors under dual employee arrangements with other subsidiaries of Principal® and assets managed in accordance with investment advice provided by Principal Global Investors through the delivery of a model.
Investment account
W Neuberger Berman AMT Large Cap Value Portfolio – I Class
W Neuberger Berman AMT Mid Cap Intrinsic Value Portfolio – I Class
W PIMCO VIT All Asset Portfolio – Institutional Class
W PIMCO VIT Commodity Real Return Strategy Portfolio-Institutional Class
W PIMCO VIT Emerging Markets Bond Portfolio-Institutional Class
W PIMCO VIT Global Bond Portfolio (Unhedged) – Institutional Class
W PIMCO VIT Real Return Portfolio – Institutional Class
W PVC Equity Income Account – Class I
W PVC MidCap Account – Class I
Asset Allocation 19
About the firm
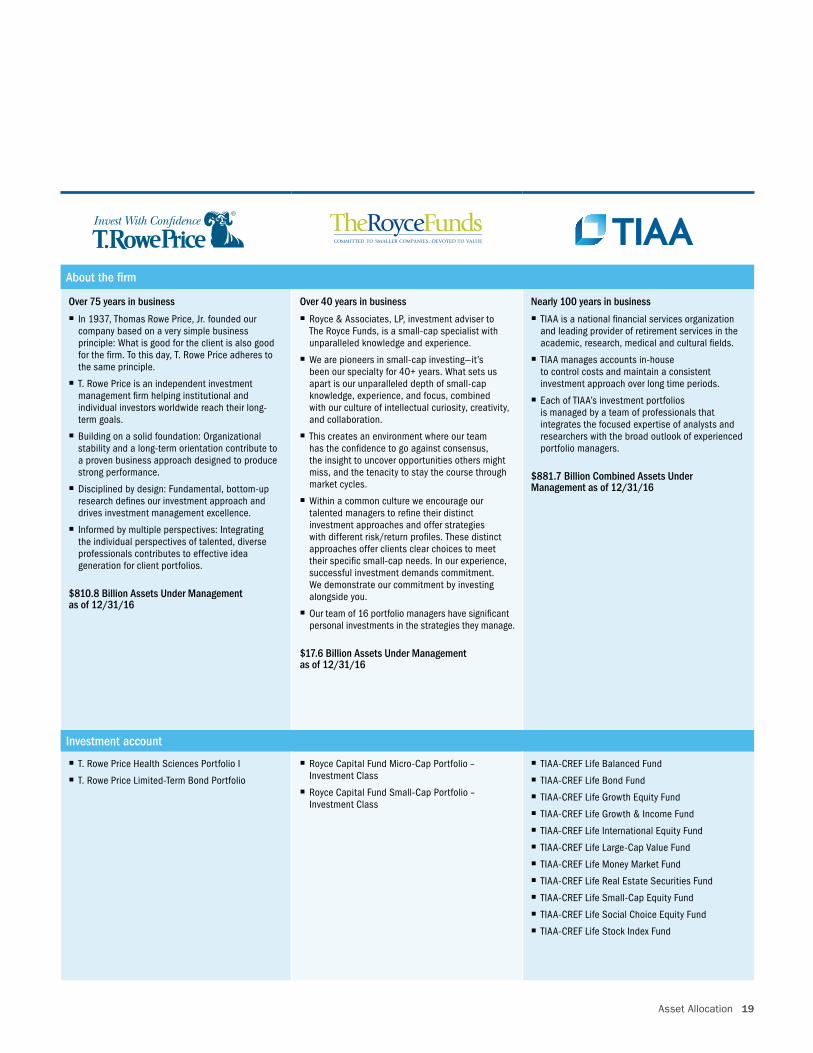
Over 75 years in business
W In 1937, Thomas Rowe Price, Jr. founded our company based on a very simple business principle: What is good for the client is also good for the firm. To this day, T. Rowe Price adheres to the same principle.
W T. Rowe Price is an independent investment management firm helping institutional and individual investors worldwide reach their long-term goals.
W Building on a solid foundation: Organizational stability and a long-term orientation contribute to a proven business approach designed to produce strong performance.
W Disciplined by design: Fundamental, bottom-up research defines our investment approach and drives investment management excellence.
W Informed by multiple perspectives: Integrating the individual perspectives of talented, diverse professionals contributes to effective idea generation for client portfolios.
$810.8 Billion Assets Under Management as of 12/31/16
Over 40 years in business
W Royce & Associates, LP, investment adviser to The Royce Funds, is a small-cap specialist with unparalleled knowledge and experience.
W We are pioneers in small-cap investing—it’s been our specialty for 40+ years. What sets us apart is our unparalleled depth of small-cap knowledge, experience, and focus, combined with our culture of intellectual curiosity, creativity, and collaboration.
W This creates an environment where our team has the confidence to go against consensus, the insight to uncover opportunities others might miss, and the tenacity to stay the course through market cycles.
W Within a common culture we encourage our talented managers to refine their distinct investment approaches and offer strategies with different risk/return profiles. These distinct approaches offer clients clear choices to meet their specific small-cap needs. In our experience, successful investment demands commitment. We demonstrate our commitment by investing alongside you.
W Our team of 16 portfolio managers have significant personal investments in the strategies they manage.
$17.6 Billion Assets Under Management as of 12/31/16
Nearly 100 years in business
W TIAA is a national financial services organization and leading provider of retirement services in the academic, research, medical and cultural fields.
W TIAA manages accounts in-house to control costs and maintain a consistent investment approach over long time periods.
W Each of TIAA’s investment portfolios is managed by a team of professionals that integrates the focused expertise of analysts and researchers with the broad outlook of experienced portfolio managers.
$881.7 Billion Combined Assets Under Management as of 12/31/16
Investment account
W T. Rowe Price Health Sciences Portfolio I
W T. Rowe Price Limited-Term Bond Portfolio
W Royce Capital Fund Micro-Cap Portfolio – Investment Class
W Royce Capital Fund Small-Cap Portfolio – Investment Class
W TIAA-CREF Life Balanced Fund
W TIAA-CREF Life Bond Fund
W TIAA-CREF Life Growth Equity Fund
W TIAA-CREF Life Growth & Income Fund
W TIAA-CREF Life International Equity Fund
W TIAA-CREF Life Large-Cap Value Fund
W TIAA-CREF Life Money Market Fund
W TIAA-CREF Life Real Estate Securities Fund
W TIAA-CREF Life Small-Cap Equity Fund
W TIAA-CREF Life Social Choice Equity Fund
W TIAA-CREF Life Stock Index Fund
T:11”
B:11.25”

20 Asset Allocation
About the firm
Nearly 40 years in business as the only client-owned mutual fund company in the world
W Founded on a simple but revolutionary idea—that a mutual fund company should be managed in the sole interest of its investors.
W Since the beginning in 1975, Vanguard is committed to putting the interests of investors first.
W For nearly four decades, structured in the United States as a “mutual” mutual fund company, owned by the Vanguard funds and their investors.
W Unique ownership structure and client-first philosophy has driven many distinctive business decisions that set them apart.
W Long-standing commitment to providing an exceptional value: outstanding performance and service at low costs.
W Grown to become one of the world’s largest investment management companies.
W Locations in the United States, Australia, the United Kingdom, Europe, Asia and the Americas.
$3.9 Trillion Assets Under Management as of 12/31/16
Over 40 years in business
W Voya Investment Management is the asset management arm of Voya Financial, a leader in retirement services and investing.
W Our investment platform has been carefully built to help meet the long-term needs and goals of our clients, supported by more than 200 investment professionals.
W Our deep understanding of managing risk exposure and capturing unrecognized investment potential through intense fundamental research and skilled portfolio construction has delivered a consistency of results across continuously evolving market cycles.
$217 Billion Assets Under Management as of 12/31/16
Investment account
W Vanguard VIF Capital Growth Portfolio
W Vanguard VIF Equity Index Portfolio
W Vanguard VIF High Yield Bond Portfolio
W Vanguard VIF Mid-Cap Index Portfolio
W Vanguard VIF REIT Index Portfolio
W Vanguard VIF Small Company Growth Portfolio
W Vanguard VIF Total Bond Market Index Portfolio
W VY Clarion Global Real Estate Portfolio – Class I

Why TIAA Life?
We make it easy for youWe’ll help you find the right way to address your needs
High ratings for financial strength22
We’re among the highest rated insurance companies in the United States
T:11”
B:11.25”

138791 141022224
713712_816772 A38473 (04/17)
22 For its stability, claims-paying ability and overall financial strength, TIAA-CREF Life Insurance Company is a member of one of only three insurance groups in the United States to hold the highest rating available to U.S. insurers from three of the four leading independent insurance company rating agencies. TIAA-CREF Life Insurance Company (TIAA Life) is a wholly owned subsidiary of Teachers Insurance and Annuity Association of America (TIAA). TIAA Life holds the following ratings as a result of its relationship with TIAA: A.M. Best (A++ as of 8/16), Fitch (AAA as of 2/17) and Standard & Poor’s (AA+ as of 11/16), and the second highest possible rating from Moody’s Investors Service (Aa1 as of 2/17). There is no guarantee that current ratings will be maintained. The financial strength ratings represent a company’s ability to meet policyholders’ obligations and claims and do not apply to variable annuities or any other product or service not fully backed by TIAA Life’s claims-paying ability. The ratings also do not apply to the safety or the performance of the variable accounts, which will fluctuate in value.
Please keep in mind that there are inherent risks associated with investing in securities. Investment products are not FDIC insured, may lose value and are not bank guaranteed. As with all securities, your accumulations can increase or decrease depending on how well the underlying investments perform over time. We do not guarantee the performance of the underlying investments. You should consider the investment objectives, risks, charges and expenses carefully before investing. Please also note the following:
– You could lose money by investing in the TIAA-CREF Life Money Market Fund. Although the Fund seeks to preserve the value of your investment at $1.00 per share, it cannot guarantee it will do so. An investment in the Fund is not insured or guaranteed by the Federal Deposit Insurance Corporation or any other government agency. The Fund’s sponsor has no legal obligation to provide support to the Fund, and you should not expect that the sponsor will provide financial support to the Fund at any time.
– As a result of recent regulatory changes, the TIAA-CREF Money Market Fund converted to a “government money market fund” on October 14, 2016. The account invests at least 99.5% of its total assets in cash, government securities and/or repurchase agreements that are collateralized fully by cash or government securities. Review the Fund’s prospectus for more information.
– Funds that invest in foreign securities are subject to special risks, including currency fluctuation and political and economic instability.
– Investing in noninvestment-grade securities presents special risks, including significantly higher interest rate and credit risks.
– Funds that invest in fixed-income securities are not guaranteed and are subject to interest rate, inflation and credit risks.
– Small-cap and mid-cap stocks may have limited marketability and may be subject to more abrupt or erratic market movements than large-cap stocks.
– Real estate securities are subject to various risks, including fluctuations in property values, higher expenses or lower income than expected, and potential environmental problems and liability.
– This brochure must be accompanied or preceded by a current prospectus for the product you purchased and the current prospectuses for the underlying funds.
Intelligent Life Variable Universal Life (VUL) and Intelligent Life Survivorship Variable Universal Life (SVUL) are flexible premium variable universal life insurance policies. The policies offer a choice of investments and an opportunity for the cash value and death benefit to grow based on the investment results of the investment options. The policy value and the death benefit may go up or down on any given day. Due to various charges associated with life insurance contracts, the policies are not suitable as short-term investments.
The Intelligent Variable Annuity is a variable deferred annuity. The annuity offers a choice of investments and the ability to accumulate funds tax deferred and then distributes funds as lifetime income or through other payment options.
Investment, insurance and annuity products are not FDIC insured, are not bank guaranteed, are not deposits, are not insured by any federal government agency, are not a condition to any banking service or activity, and may lose value.TIAA-CREF Individual & Institutional Services, LLC, member FINRA, distributes securities products. The Intelligent Variable Annuity, contract form series TCL-VA2; Intelligent Life Variable Universal Life Insurance, policy form series AM-SVUL.2 and AM-SVUL.3 (2008); and Intelligent Life Survivorship Variable Universal Life Insurance, policy form series AM-JVUL.3 (2008), are issued by TIAA-CREF Life Insurance Company (TIAA Life), a wholly owned subsidiary of Teachers Insurance and Annuity Association of America (TIAA). Each of the foregoing entities is solely responsible for its own financial condition and contractual obligations. Not available in all states.
©2017 TIAA-CREF Life Insurance Company (TIAA Life), 730 Third Avenue, New York, NY 10017
T:11”
B:11.25”