Place & Economy Services Finance and Performance Report (F ...
28
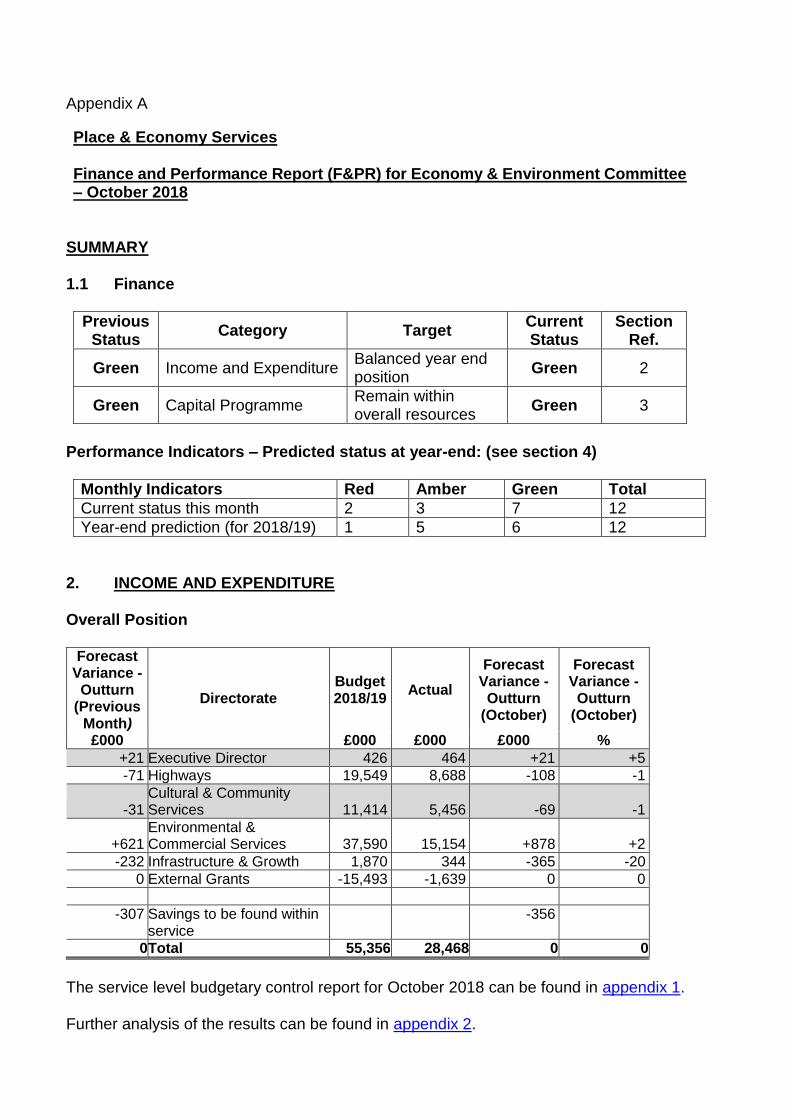
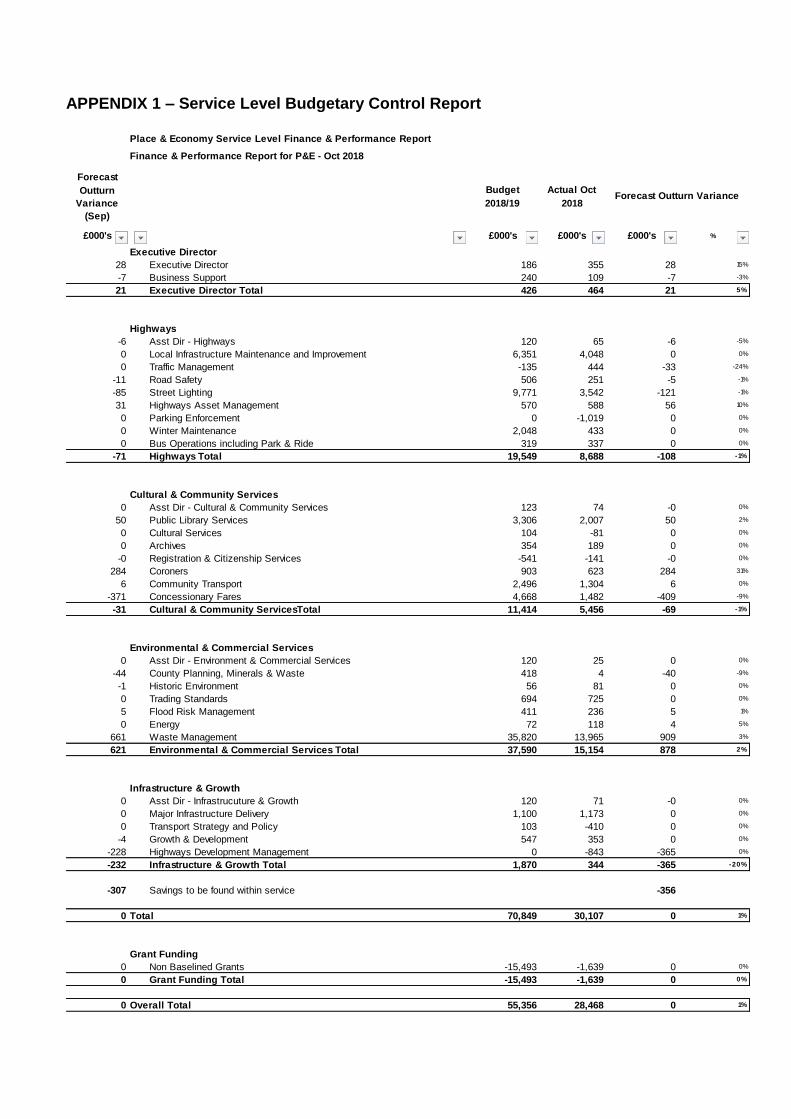
Appendix A Place & Economy Services Finance and Performance Report (F&PR) for Economy & Environment Committee – October 2018 SUMMARY 1.1 Finance Previous Status Category Target Current Status Section Ref. Green Income and Expenditure Balanced year end position Green 2 Green Capital Programme Remain within overall resources Green 3 Performance Indicators – Predicted status at year-end: (see section 4) Monthly Indicators Red Amber Green Total Current status this month 2 3 7 12 Year-end prediction (for 2018/19) 1 5 6 12 2. INCOME AND EXPENDITURE Overall Position Forecast Variance - Outturn (Previous Month) Directorate Budget 2018/19 Actual Forecast Variance - Outturn (October) Forecast Variance - Outturn (October) £000 £000 £000 £000 % +21 Executive Director 426 464 +21 +5 -71 Highways 19,549 8,688 -108 -1 -31 Cultural & Community Services 11,414 5,456 -69 -1 +621 Environmental & Commercial Services 37,590 15,154 +878 +2 -232 Infrastructure & Growth 1,870 344 -365 -20 0 External Grants -15,493 -1,639 0 0 -307 Savings to be found within service -356 0 Total 55,356 28,468 0 0 The service level budgetary control report for October 2018 can be found in appendix 1. Further analysis of the results can be found in appendix 2.
Transcript of Place & Economy Services Finance and Performance Report (F ...
Appendix A
Place & Economy Services Finance and Performance Report (F&PR) for Economy & Environment Committee – October 2018
SUMMARY 1.1 Finance
Previous Status
Category Target Current Status
Section Ref.
Green Income and Expenditure Balanced year end position
Green 2
Green Capital Programme Remain within overall resources
Green 3
Performance Indicators – Predicted status at year-end: (see section 4)
Monthly Indicators Red Amber Green Total
Current status this month 2 3 7 12
Year-end prediction (for 2018/19) 1 5 6 12
2. INCOME AND EXPENDITURE Overall Position
Forecast Variance - Outturn
(Previous Month)
Directorate Budget 2018/19
Actual
Forecast Variance - Outturn
(October)
Forecast Variance - Outturn
(October)
£000 £000 £000 £000 %
+21 Executive Director 426 464 +21 +5
-71 Highways 19,549 8,688 -108 -1
-31 Cultural & Community Services 11,414 5,456 -69 -1
+621
Environmental & Commercial Services 37,590 15,154
+878 +2
-232 Infrastructure & Growth 1,870 344 -365 -20
0 External Grants -15,493 -1,639 0 0
-307 Savings to be found within service
-356
0 Total 55,356 28,468 0 0
The service level budgetary control report for October 2018 can be found in appendix 1. Further analysis of the results can be found in appendix 2.
To ensure financial information is presented in a consistent way to all Committees a standardised format has now been applied to the summary tables and service level budgetary control reports included in each F&PR. The same format is also applied to the Integrated Resources and Performance Report (IRPR) presented to General Purposes Committee (GPC). The data shown provides the key information required to assess the financial position of the service and provide comparison to the previous month. Significant Issues
Waste Private Finance Initiative (PFI) Contract Contract changes that deliver full year savings totalling £1.3m have been identified however delays to reaching formal agreement with the contractor that will allow contract changes will result in a shortfall in delivered savings. £400,000 savings per year have been achieved but agreement to allow the remainder of the savings to commence has been delayed and it is unlikely this will be possible until December at the earliest (previously reported as November) resulting in a savings shortfall of approximately £909,000 this financial year. Until agreement is reached with the contractor on the contract changes the variable nature of the Mechanical and Biological Treatment (MBT) creates uncertainty in the forecast and actual performance could improve, resulting in a reduced overspend, or worsen, resulting in an increased overspend. Coroners The Coroners Service is projecting an overspend of £284k for Cambridgeshire, which is caused by a mixture of on-going workload pressure i.e. the number of cases and the complexity of cases increasing, and a need to reduce the backlog of cases built up over previous years. Concessionary Fares Concessionary fares are projected to underspend based on the final adjustment to spend in the last financial year and currently the initial indications are that this level of underspend will be achieved this year. This underspend will be used to help cover other pressures within Place & Economy. Highways Development Management Section 106 and section 38 fees have come in higher than expected for new developments and is expected to lead to an overachievement of income. However, this is an unpredictable income stream and the forecast outturn is updated regularly. Summary position Although not yet identified it is expected that savings/underspends will be found within Place & Economy to fund the current projected overspend.
2.3 Additional Income and Grant Budgeted this Period

(De minimis reporting limit = £30,000) There were no items above the de minimis reporting limit recorded in October 2018. A full list of additional grant income can be found in appendix 3. 2.4 Virements and Transfers to / from Reserves (including Operational Savings Reserve) (De minimis reporting limit = £30,000) There are no items above the de minimis reporting limit recorded in October 2018. A full list of virements made in the year to date can be found in appendix 4.

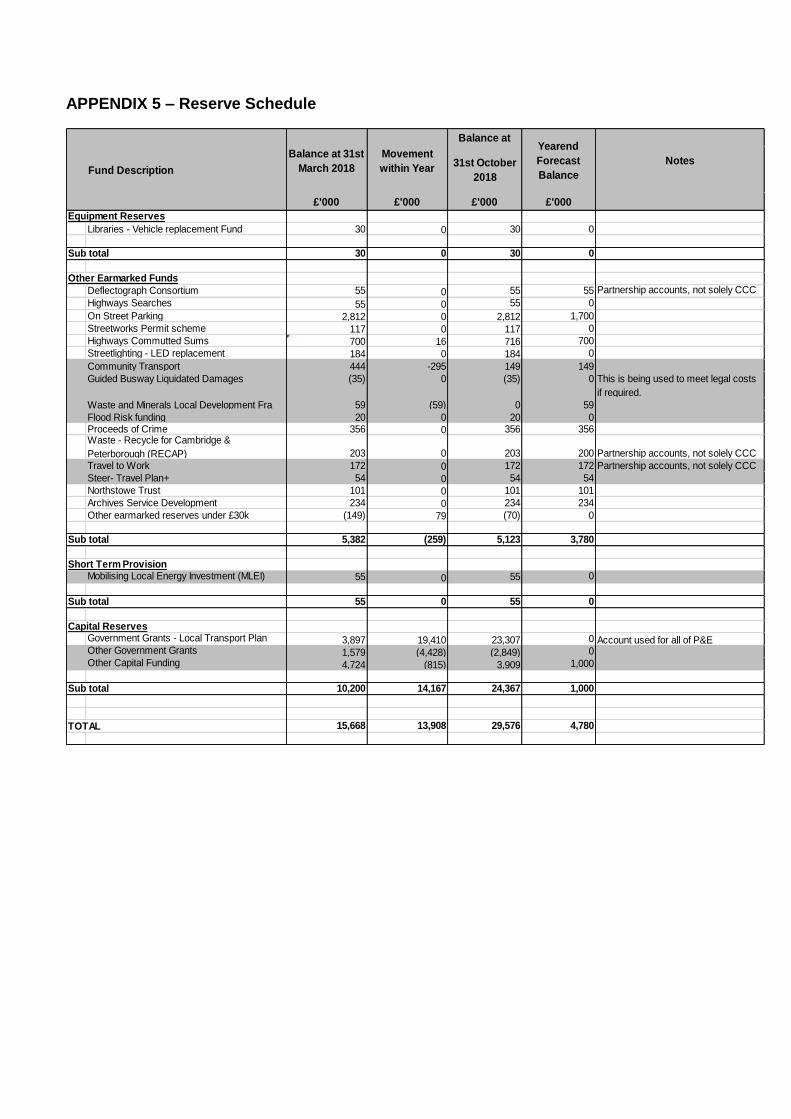
3. BALANCE SHEET 3.1 Reserves A schedule of the Service’s reserves can be found in appendix 5. 3.2 Capital Expenditure and Funding Expenditure Connecting Cambridgeshire Due to the nature of the contract with BT, the majority of the current costs are being picked up by the supplier as part of their private investment commitment. CCC costs are back ended and expenditure will not be incurred until 2019/20 and 2020/21. The total scheme cost is still £36.29m but forecast against the £6m 2018/19 budget has reduced to £1m. Funding Further grants have been awarded from the Department for Transport since the published business plan, these being Pothole grant funding 18/19 (£1.608m), a second tranche of Pothole grant funding (£0.807m) and further Safer Roads funding (£0.128m). All other schemes are funded as presented in the 2018/19 Business Plan. A detailed explanation of the position can be found in appendix 6.

4. PERFORMANCE 4.1 Introduction This report provides performance information for the suite of key Place & Economy (P&E) indicators for 2018/19. At this stage in the year, we are still reporting pre-2018/19 information for some indicators. New information for red, amber and green indicators is shown by Committee in Sections 4.2 to 4.4 below, with contextual indicators reported in Section 4.5. Further information is contained in Appendix 7. A new set of indicators has been prepared that will replace this set and this is the subject of a separate report to Committee in November.
Members have requested tree data and this is shown at the end of this report. It is more detailed than the high level Key Perfromance Indicators (KPI) data we usually present in the F&PR. When Members review the KPI’s in December they can advise if they want the high level summary data presented within the F&PR and/or they prefer the detailed data circulated separately. In addition, the Local Highways Initiatives programme update is attached. 4.2 Red Indicators (new information) This section covers indicators where 2018/19 targets are not expected to be achieved. Economy & Environment No new information this month. P&E Operational Indicators No new information this month. 4.3 Amber indicators (new information) This section covers indicators where there is some uncertainty at this stage as to whether or not year-end targets will be achieved. Economy & Environment No new information this month
P&E Operational Indicators No new information this month 4.4 Green Indicators (new information) The following indicators are currently on-course to achieve year-end targets. Economy & Environment Economic Development Additional jobs created – September 2016 to September 2017

The latest provisional figures from the Business Register and Employment Survey (BRES) show that 12,600 additional jobs were created between September 2015 and September 2016 compared with an increase of 6,300 for the same period in the previous year. This means that the 2016/17 target of +3,500 additional jobs has been achieved.
P&E Operational Indicators Freedom of Information (FOI) requests FOI requests - % responded to within 20 days (September 2018) 33 Freedom of Information requests were received during September 2018. Provisional figures show that 20 (60.6%) of these were responded to on time. This is a significant drop in performance from last month’s figure. 159 Freedom of Information requests have been received since April 2018 and 83.0% of these have been responded to on-time. This compares with 96.3% (out of 135) and 96.1% (out of 154) for the same period last year and the year before. This is below our target of 90% although within 10% of achieving the target.
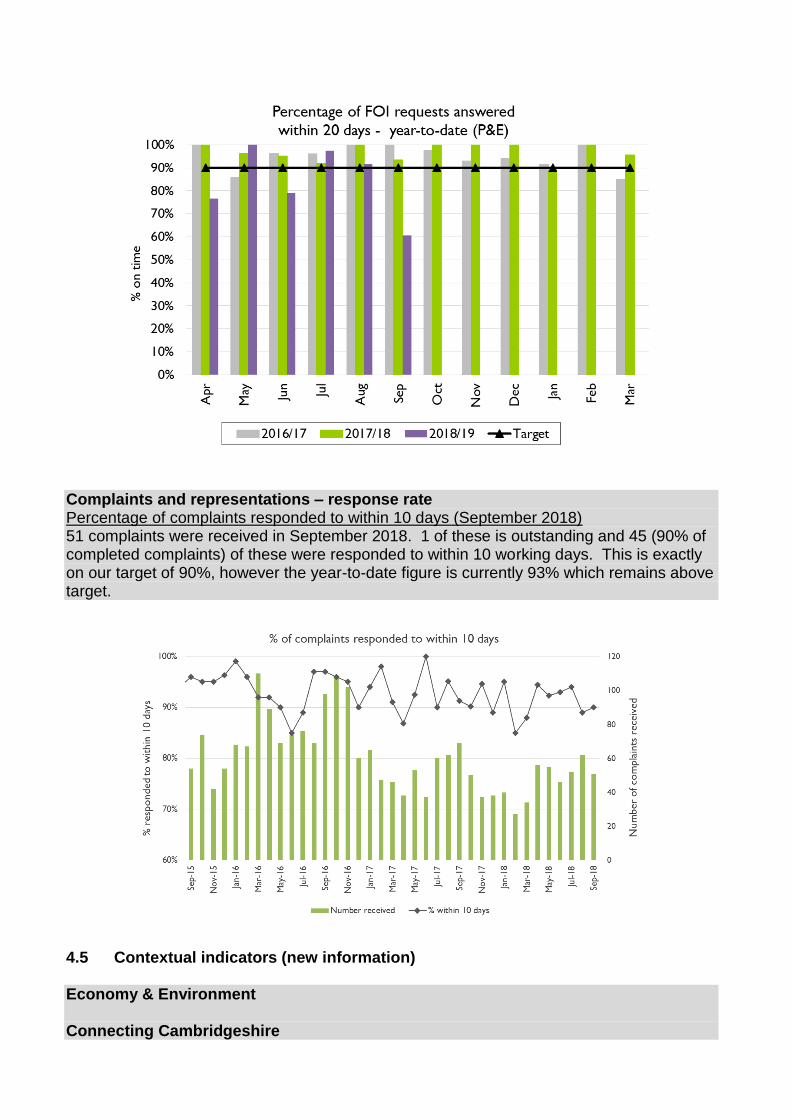
Complaints and representations – response rate Percentage of complaints responded to within 10 days (September 2018) 51 complaints were received in September 2018. 1 of these is outstanding and 45 (90% of completed complaints) of these were responded to within 10 working days. This is exactly on our target of 90%, however the year-to-date figure is currently 93% which remains above target.
4.5 Contextual indicators (new information) Economy & Environment Connecting Cambridgeshire

% of take-up in the intervention area as part of the superfast broadband rollout programme (to September 2018) Figures to the end of September 2018 show that the average take-up in the intervention area has increased by 1.6 percentage points since the last quarterly figure of 54.3% at the end of June 2018. The figure reported at the end of September last year was 48.5%.
Passenger Transport Guided Busway passenger numbers (September 2018) The Guided Busway carried 359,231 passengers in September 2018. This figure is 17,408 more than in August and is 2,261 more than during September 2017. In addition the 12-month rolling total of 4.19 million this month is higher than the figure for the same period last year of 3.90 million. There have now been over 25.1 million passengers since the Busway opened in August 2011.

APPENDIX 1 – Service Level Budgetary Control Report
Place & Economy Service Level Finance & Performance Report
Finance & Performance Report for P&E - Oct 2018
Forecast
Outturn
Variance
(Sep)
Budget
2018/19
Actual Oct
2018
£000's £000's £000's £000's %
Executive Director
28 Executive Director 186 355 28 15%
-7 Business Support 240 109 -7 -3%
21 Executive Director Total 426 464 21 5%
Highways
-6 Asst Dir - Highways 120 65 -6 -5%
0 Local Infrastructure Maintenance and Improvement 6,351 4,048 0 0%
0 Traffic Management -135 444 -33 -24%
-11 Road Safety 506 251 -5 -1%
-85 Street Lighting 9,771 3,542 -121 -1%
31 Highways Asset Management 570 588 56 10%
0 Parking Enforcement 0 -1,019 0 0%
0 Winter Maintenance 2,048 433 0 0%
0 Bus Operations including Park & Ride 319 337 0 0%
-71 Highways Total 19,549 8,688 -108 -1%
Cultural & Community Services
0 Asst Dir - Cultural & Community Services 123 74 -0 0%
50 Public Library Services 3,306 2,007 50 2%
0 Cultural Services 104 -81 0 0%
0 Archives 354 189 0 0%
-0 Registration & Citizenship Services -541 -141 -0 0%
284 Coroners 903 623 284 31%
6 Community Transport 2,496 1,304 6 0%
-371 Concessionary Fares 4,668 1,482 -409 -9%
-31 Cultural & Community ServicesTotal 11,414 5,456 -69 -1%
Environmental & Commercial Services
0 Asst Dir - Environment & Commercial Services 120 25 0 0%
-44 County Planning, Minerals & Waste 418 4 -40 -9%
-1 Historic Environment 56 81 0 0%
0 Trading Standards 694 725 0 0%
5 Flood Risk Management 411 236 5 1%
0 Energy 72 118 4 5%
661 Waste Management 35,820 13,965 909 3%
621 Environmental & Commercial Services Total 37,590 15,154 878 2%
Infrastructure & Growth
0 Asst Dir - Infrastrucuture & Growth 120 71 -0 0%
0 Major Infrastructure Delivery 1,100 1,173 0 0%
0 Transport Strategy and Policy 103 -410 0 0%
-4 Growth & Development 547 353 0 0%
-228 Highways Development Management 0 -843 -365 0%
-232 Infrastructure & Growth Total 1,870 344 -365 -20%
-307 Savings to be found within service -356
0 Total 70,849 30,107 0 1%
Grant Funding
0 Non Baselined Grants -15,493 -1,639 0 0%
0 Grant Funding Total -15,493 -1,639 0 0%
0 Overall Total 55,356 28,468 0 1%
Forecast Outturn Variance

APPENDIX 2 – Commentary on Forecast Outturn Position Number of budgets measured at service level that have an adverse/positive variance greater than 2% of annual budget or £100,000 whichever is greater.
Service
Current Budget for
2018/19
Actual Outturn Forecast
£’000 £’000
£’000 %
Public Library Services 3,306 2,007 +50 +2
A savings target of £50k relating to the Icon (self-service payment) system roll out within Libraries will not be achieved; this was a savings target set retrospectively as part of overall Council savings targets for automation.
Coroners 903 623 +284 +31
The Coroners Service is projecting an overspend of £284k for Cambridgeshire, which is caused by a mixture of on-going workload pressure i.e. the number of cases and the complexity of cases increasing, and a need to reduce the backlog of cases built up over previous years.
Community Transport 2,496 1,304 +6 0
Community Transport has pressures of £295k, which is due to the cost of former commercial routes now being subsidised; this can be covered in the short-term from earmarked reserves. It had already been agreed that £84k would be used from the community transport earmarked reserve for the former commercial routes. The Economy & Environment Committee has now agreed to continue to subsidise 19 routes until the end of the 2018/19 financial year, to be fully covered from reserves. In addition the Combined Authority has agreed to fund the continuation of the number 46 service and three further recently de-registered services to the end of the financial year, and has undertaken to provide further funding should additional de-registrations arise this financial year.
Concessionary Fares 4,668 1,482 -409 -9
The projected underspend is based on the final adjusted spend in the last financial year and currently the initial indications are that this level of underspend will be achieved this year. This underspend will be used to help cover other pressures within Place & Economy.
Waste Management 35,820 13,965 909 +3
Contract changes that deliver full year savings totalling £1.3m have been identified however delays to reaching formal agreement with the contractor that will allow contract changes will result in a shortfall in delivered savings. £400,000 savings per year have been achieved but agreement to allow the remainder of the savings to commence has been delayed and it is unlikely this will be possible until December at the earliest (previously reported as November) resulting in a savings shortfall of approximately £909,000 this financial year.
Until agreement is reached with the contractor on the contract changes the variable nature of the Mechanical and Biological Treatment (MBT) creates uncertainty in the forecast and actual performance could improve, resulting in a reduced overspend, or worsen, resulting in an increased overspend.
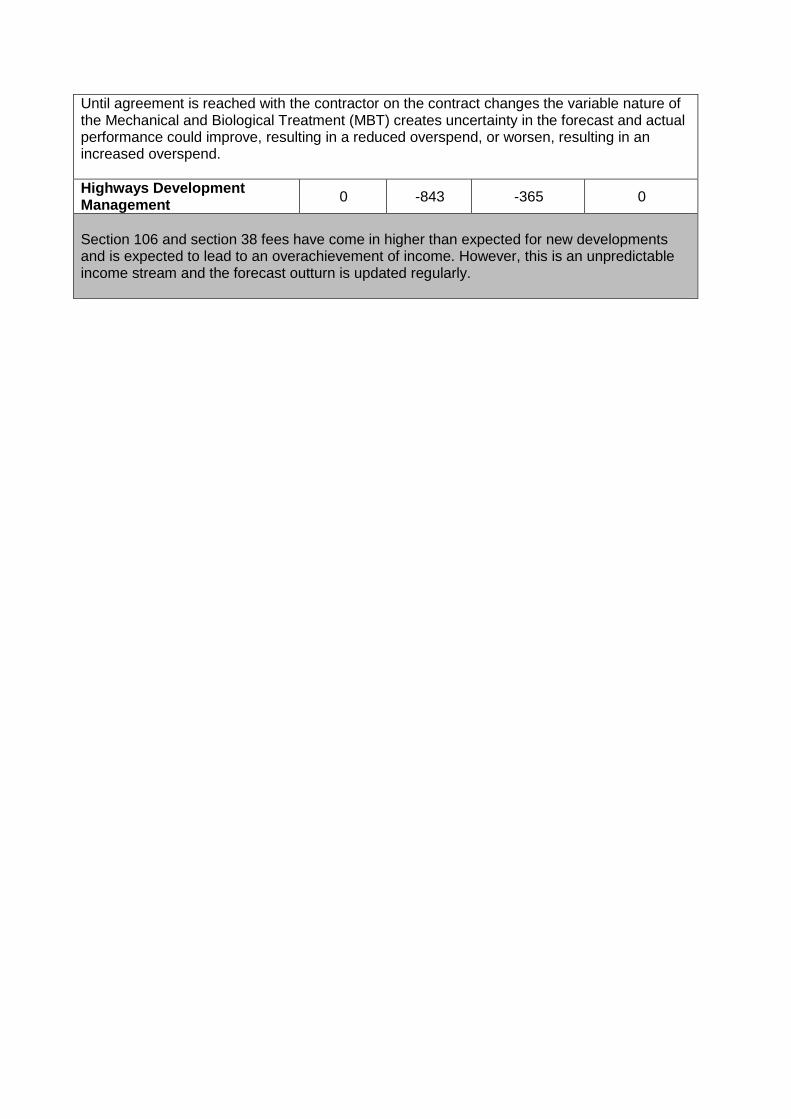
Highways Development Management
0 -843 -365 0
Section 106 and section 38 fees have come in higher than expected for new developments and is expected to lead to an overachievement of income. However, this is an unpredictable income stream and the forecast outturn is updated regularly.

APPENDIX 3 – Grant Income Analysis The table below outlines the additional grant income, which is not built into base budgets.
Grant Awarding Body Expected Amount
£’000
Grants as per Business Plan Various 29,108
Adjustment re Combined Authority levy -13,615
Non-material grants (+/- £30k) 0
Total Grants 2018/19 15,493

APPENDIX 4 – Virements and Budget Reconciliation
£’000 Notes
Budget as per Business Plan 41,428
Funding of former commercial bus routes from earmarked reserve
+84 Agreed in 2017/18
Further funding of former commercial bus routes from earmarked reserve
+211 Agreed in 2018/19
Transfer unspent Combined Authority contribution budget to CCC Finance Office budget to cover cost of Community Transport Audit investigation
-43
Transfer of income budget for rent of Grand Arcade shop from Libraries to Property services.
+50
Adjustment re Combined Authority levy +13,615 Levy only due on transport functions
Non-material virements (+/- £30k) +12
Current Budget 2018/19 55,356
APPENDIX 5 – Reserve Schedule
Balance at
Fund Description31st October
2018
£'000 £'000 £'000 £'000
Libraries - Vehicle replacement Fund 30 0 30 0
30 0 30 0
Deflectograph Consortium 55 0 55 55 Partnership accounts, not solely CCC
Highways Searches 55 0 55 0
On Street Parking 2,812 0 2,812 1,700
Streetworks Permit scheme 117 0 117 0
Highways Commutted Sums 700 16 716 700
Streetlighting - LED replacement 184 0 184 0
Community Transport 444 -295 149 149
Guided Busway Liquidated Damages (35) 0 (35) 0 This is being used to meet legal costs
if required.
Waste and Minerals Local Development Fra 59 (59) 0 59
Flood Risk funding 20 0 20 0Proceeds of Crime 356 0 356 356Waste - Recycle for Cambridge &
Peterborough (RECAP) 203 0 203 200 Partnership accounts, not solely CCC
Travel to Work 172 0 172 172 Partnership accounts, not solely CCC
Steer- Travel Plan+ 54 0 54 54
Northstowe Trust 101 0 101 101
Archives Service Development 234 0 234 234
Other earmarked reserves under £30k (149) 79 (70) 0
5,382 (259) 5,123 3,780
Mobilising Local Energy Investment (MLEI) 55 0 55 0
55 0 55 0
Government Grants - Local Transport Plan 3,897 19,410 23,307 0 Account used for all of P&EOther Government Grants 1,579 (4,428) (2,849) 0Other Capital Funding 4,724 (815) 3,909 1,000
10,200 14,167 24,367 1,000
TOTAL 15,668 13,908 29,576 4,780
Movement
within Year
Yearend
Forecast
Balance
Notes
Short Term Provision
Sub total
Balance at 31st
March 2018
Equipment Reserves
Sub total
Sub total
Other Earmarked Funds
Sub total
Capital Reserves
APPENDIX 6 – Capital Expenditure and Funding
Capital Expenditure
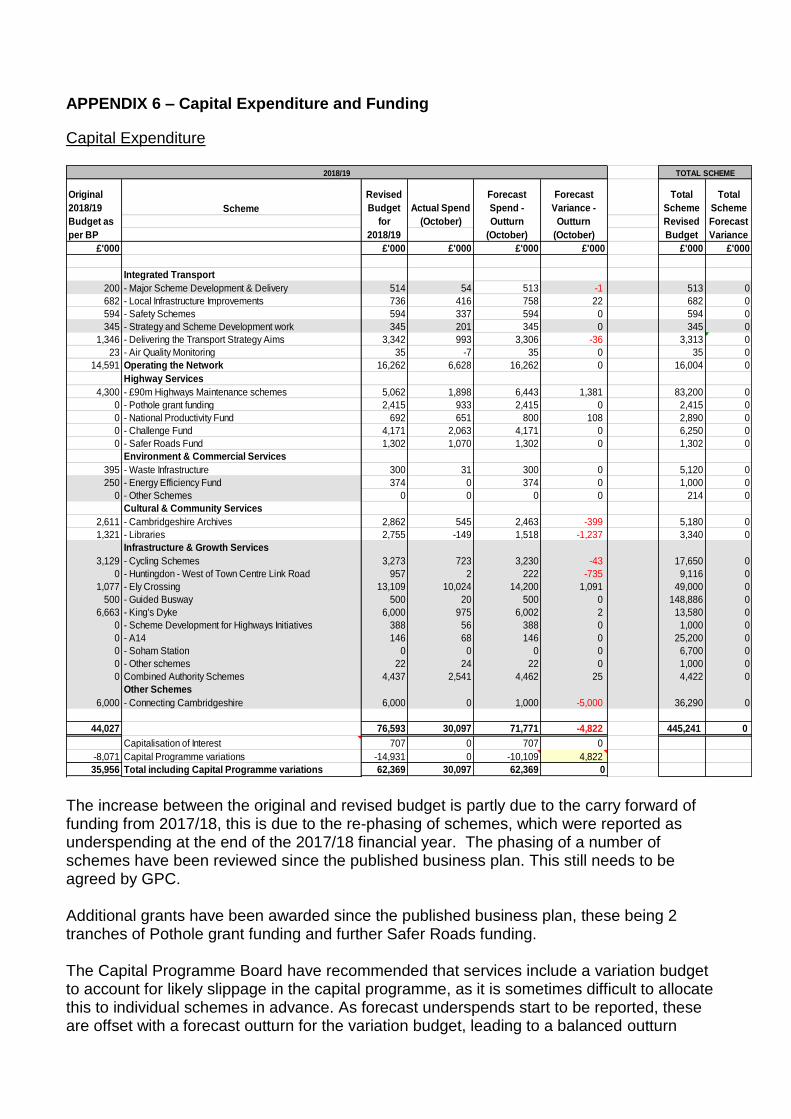
The increase between the original and revised budget is partly due to the carry forward of funding from 2017/18, this is due to the re-phasing of schemes, which were reported as underspending at the end of the 2017/18 financial year. The phasing of a number of schemes have been reviewed since the published business plan. This still needs to be agreed by GPC. Additional grants have been awarded since the published business plan, these being 2 tranches of Pothole grant funding and further Safer Roads funding. The Capital Programme Board have recommended that services include a variation budget to account for likely slippage in the capital programme, as it is sometimes difficult to allocate this to individual schemes in advance. As forecast underspends start to be reported, these are offset with a forecast outturn for the variation budget, leading to a balanced outturn
Scheme
£'000 £'000 £'000 £'000 £'000 £'000 £'000
Integrated Transport
200 - Major Scheme Development & Delivery 514 54 513 -1 513 0
682 - Local Infrastructure Improvements 736 416 758 22 682 0
594 - Safety Schemes 594 337 594 0 594 0
345 - Strategy and Scheme Development work 345 201 345 0 345 0
1,346 - Delivering the Transport Strategy Aims 3,342 993 3,306 -36 3,313 0
23 - Air Quality Monitoring 35 -7 35 0 35 0
14,591 Operating the Network 16,262 6,628 16,262 0 16,004 0
Highway Services
4,300 - £90m Highways Maintenance schemes 5,062 1,898 6,443 1,381 83,200 0
0 - Pothole grant funding 2,415 933 2,415 0 2,415 0
0 - National Productivity Fund 692 651 800 108 2,890 0
0 - Challenge Fund 4,171 2,063 4,171 0 6,250 0
0 - Safer Roads Fund 1,302 1,070 1,302 0 1,302 0
Environment & Commercial Services
395 - Waste Infrastructure 300 31 300 0 5,120 0
250 - Energy Efficiency Fund 374 0 374 0 1,000 0
0 - Other Schemes 0 0 0 0 214 0
Cultural & Community Services
2,611 - Cambridgeshire Archives 2,862 545 2,463 -399 5,180 0
1,321 - Libraries 2,755 -149 1,518 -1,237 3,340 0
Infrastructure & Growth Services
3,129 - Cycling Schemes 3,273 723 3,230 -43 17,650 0
0 - Huntingdon - West of Town Centre Link Road 957 2 222 -735 9,116 0
1,077 - Ely Crossing 13,109 10,024 14,200 1,091 49,000 0
500 - Guided Busway 500 20 500 0 148,886 0
6,663 - King's Dyke 6,000 975 6,002 2 13,580 0
0 - Scheme Development for Highways Initiatives 388 56 388 0 1,000 0
0 - A14 146 68 146 0 25,200 0
0 - Soham Station 0 0 0 0 6,700 0
0 - Other schemes 22 24 22 0 1,000 0
0 Combined Authority Schemes 4,437 2,541 4,462 25 4,422 0
Other Schemes
6,000 - Connecting Cambridgeshire 6,000 0 1,000 -5,000 36,290 0
44,027 76,593 30,097 71,771 -4,822 445,241 0
Capitalisation of Interest 707 0 707 0
-8,071 Capital Programme variations -14,931 0 -10,109 4,822
35,956 Total including Capital Programme variations 62,369 30,097 62,369 0
2018/19 TOTAL SCHEME
Original
2018/19
Budget as
per BP
Revised
Budget
for
2018/19
Actual Spend
(October)
Forecast
Spend -
Outturn
(October)
Forecast
Variance -
Outturn
(October)
Total
Scheme
Revised
Budget
Total
Scheme
Forecast
Variance

overall up to the point when slippage exceeds this budget. The allocations for these negative budget adjustments have been calculated and shown against the slippage forecast to date. £90m Highways Maintenance schemes The £90million funds the highway capital maintenance programme and underpins a three-year rolling programme that is reviewed and approved by members annually. The schemes in this programme are delivered through the highway service contract with Skanska and using the Eastern Highway Alliance framework. During the course of the year it is not uncommon to see changes to the list of projects to be delivered. This is due to a mixture of other more appropriate funding sources becoming available, issues arising from detailed design that require longer to resolve, opportunities to deliver greater efficiencies and value for money through increased coordination, resource availability and innovation. For the last 4 years the annual budget allocated from the £90m has been £6m and the programme of work to be delivered in year has been put together within this funding envelope. However the £6m budget for 2018/19 was reduced by £1.7m as part of the business planning process to account for expected savings from the Highways contract, leaving a works programme that exceeds the amount of money available. Whilst historically there is normally an underspend against the prudential borrowing programme, the reduced starting budget is resulting in the currently forecast overspend of £1.4m. Given some of the schemes are yet to complete the detailed design and construction stages, the expectation is that the forecast outturn will change further in the coming months, and as a result, this programme will be brought back into balance. Cambridgeshire Archives The revised spend figure in 2018/19 is based on a revised cashflow from the contractor. The scheme is still expected to spend to the total budget allocated. Libraries Library schemes funded by developer contributions will not commence until 2019/20, these include Cambourne Library and a new library at Darwin Green. Community Hub – Sawston Due to a number of planning issues, this scheme has been delayed.The scheme is now projected to be completed in 2019-20. Huntingdon West of Town Centre Link Road Land cost claims which were not resolved as anticipated in 2017/18 (only £553,000 of that year’s £1,510,000 budget was spent) are now expected to be resolved in 2018/19 or beyond. Land values are still under discussion between agents and no payments can be made until an agreement is reached, hence timescales for payment are uncertain. Ely Crossing

The Ely Southern Bypass road was opened to traffic on 31st October 2018 and the Viaduct Walkway is currently programmed for completion in mid-November. The estimated outturn cost of the scheme remains at £49m and the expenditure for the current financial year is forecast at £14.2m (i.e. £34.8m was spent prior to the 2018/19 financial year). King’s Dyke The detailed design proved there were considerable engineering challenges which add significant cost to the scheme. In addition, there are increases in land and statutory undertakers’ costs which have added to the revised forecast cost. As the costs become more robust, the Business Case was revised and the benefits of the scheme recalculated. The geometric design of the roundabouts will reduce journey times on the new route and the reassessment of current delays at the level crossing has shown longer delays than when the Benefit Cost Ratio (BCR) was initially calculated. Despite the increase in cost, there has been an uplift in the BCR value. The Business Case shows that along with the unquantified local benefits in supporting growth and accessibility, the scheme represents extremely high value for money. The Business Plan budget was £13.5m and the revised estimate is £29.98m which includes risk allowances and optimum bias. The Cambridgeshire and Peterborough Combined Authority (CPCA) agreed to meet the funding gap at the CPCA Board on 31st October 2018. Economy and Environment Committee approved awarding the contract and acquiring the necessary land at its meeting on 11th October to allow work to commence at the earliest opportunity. Utility diversions are scheduled to commence in December/January followed by the main construction activity in February / March, with completion expected in late 2020. S106 funded Cycling projects Detailed design is underway on the UK’s first Dutch style roundabout at Fendon Road/Queen Edith’s Way. There will be a number of public exhibitions held in the autumn ahead of work starting on site early in 2019, with scheme completion planned for June/July 2019. £550,000 of DfT Cycle Safety funding has been secured to give an overall lifetime project budget of £800,000. To date there is not much spend as costs for detailed design have not been billed as yet. There will be further consultation in early 2019 on proposals for Queen Edith’s Way and Cherry Hinton Road. Abbey-Chesterton Bridge The construction contract has now been let to Tarmac. It is forecast that the £3,028,000 budget will be spent this financial year. The contract will include the new bridge as well as Phase 1 of The Chisholm Trail, with completion planned for early 2020.

Connecting Cambridgeshire Due to the nature of the contract with BT, the majority of the costs are back ended and expenditure will not be incurred until 2019/20 and 2020/21. The total scheme cost is still £36.29m. Capital Funding
The increase between the original and revised budget is partly due to the carry forward of funding from 2017/18, this is due to the re-phasing of schemes, which were reported as underspending at the end of the 2017/18 financial year. The phasing of a number of schemes have been reviewed since the published business plan. Additional grants have been awarded since the published business plan, these being 2 tranches of Pothole grant funding and further Safer Roads funding.
Funding
Amount (£m)
Reason for Change
Revised Phasing (Specific Grant)
4.4 Rephasing of grant funding for King’s Dyke (£4.4m) from 2017/18, costs to be incurred in 2018/19.
Additional Funding (Section 106 & CIL)
2.0 Additional developer contributions to be used for a number of schemes (£0.7m). Roll forward of CIL funding for Hunts Link Road for outstanding land compensation costs (£1.0m).
Revised Phasing (Other Contributions)
-2.7 Revised phasing of King’s Dyke spend.
Additional Funding / Revised Phasing
6.5
Roll forward and additional Grant funding – National Productivity Fund (£0.7m), Challenge Fund (£1.1m), Safer Roads Fund (£1.3m), Cycle City Ambition Grant (£1.4m) and Pothole Action Fund (£2.4m).
Source of Funding
£'000 £'000 £'000 £'000
17,781 Local Transport Plan 17,801 17,801 0
373 Other DfT Grant funding 6,870 6,870 0
1,287 Other Grants 5,708 5,709 1
5,475 Developer Contributions 7,468 6,652 -816
8,170 Prudential Borrowing 24,912 20,856 -4,056
10,941 Other Contributions 13,834 13,883 49
44,027 76,593 71,771 -4,822
-8,071 Capital Programme variations -14,931 -14,931 0
35,956 Total including Capital Programme variations 61,662 56,840 -4,822
2018/19
Original
2018/19
Funding
Allocation
as per BP
Revised
Funding
for
2018/19
Forecast
Spend -
Outturn
(October)
Forecast
Funding
Variance -
Outturn
(October)

(DfT Grant)
Additional Funding / Revised Phasing (Prudential borrowing)
16.4
Additional funding required for increased costs for Ely Crossing (£9.2m). Rephasing of spend for Highways maintenance (£2.5m), Challenge Fund (£2.2m) and Sawston Community Hub (£1.4m)
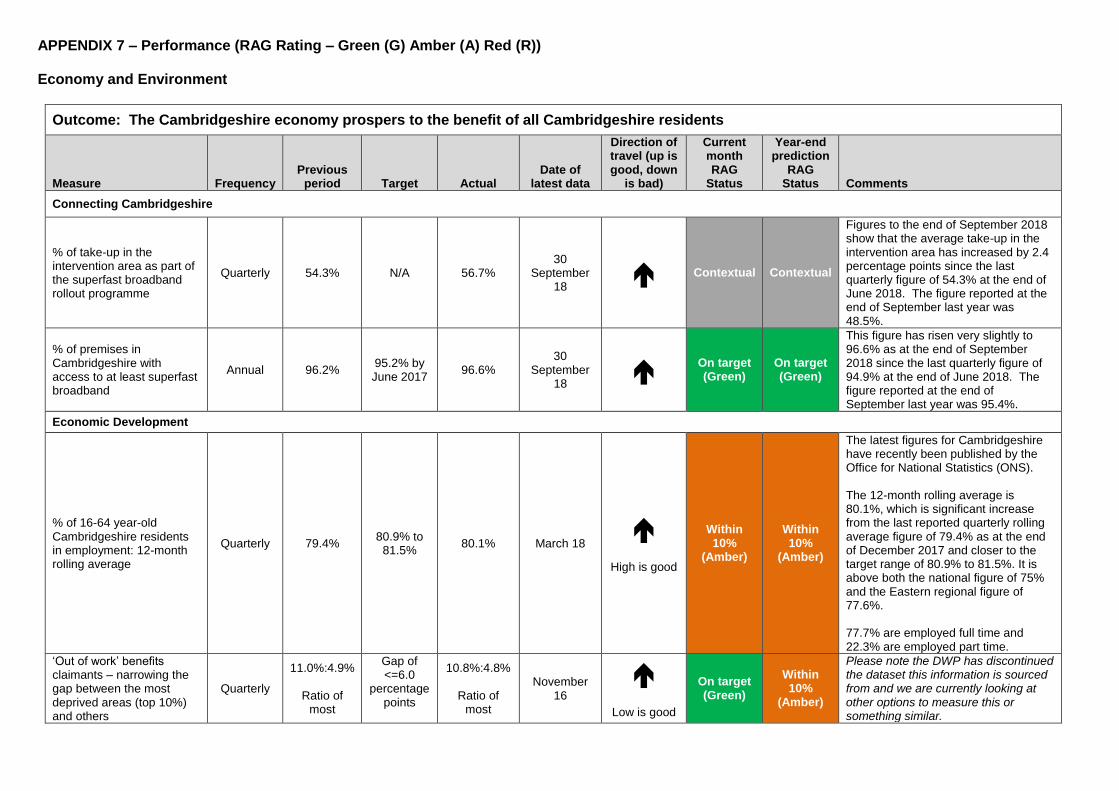
APPENDIX 7 – Performance (RAG Rating – Green (G) Amber (A) Red (R)) Economy and Environment
Outcome: The Cambridgeshire economy prospers to the benefit of all Cambridgeshire residents
Measure Frequency Previous
period Target Actual Date of
latest data
Direction of travel (up is good, down
is bad)
Current month RAG
Status
Year-end prediction
RAG Status Comments
Connecting Cambridgeshire
% of take-up in the intervention area as part of the superfast broadband rollout programme
Quarterly 54.3% N/A 56.7% 30
September 18
Contextual Contextual
Figures to the end of September 2018 show that the average take-up in the intervention area has increased by 2.4 percentage points since the last quarterly figure of 54.3% at the end of June 2018. The figure reported at the end of September last year was 48.5%.
% of premises in Cambridgeshire with access to at least superfast broadband
Annual 96.2% 95.2% by June 2017
96.6% 30
September 18
On target (Green)
On target (Green)
This figure has risen very slightly to 96.6% as at the end of September 2018 since the last quarterly figure of 94.9% at the end of June 2018. The figure reported at the end of September last year was 95.4%.
Economic Development
% of 16-64 year-old Cambridgeshire residents in employment: 12-month rolling average
Quarterly 79.4% 80.9% to
81.5% 80.1% March 18
High is good
Within 10%
(Amber)
Within 10%
(Amber)
The latest figures for Cambridgeshire have recently been published by the Office for National Statistics (ONS). The 12-month rolling average is 80.1%, which is significant increase from the last reported quarterly rolling average figure of 79.4% as at the end of December 2017 and closer to the target range of 80.9% to 81.5%. It is above both the national figure of 75% and the Eastern regional figure of 77.6%. 77.7% are employed full time and 22.3% are employed part time.
‘Out of work’ benefits claimants – narrowing the gap between the most deprived areas (top 10%) and others
Quarterly
11.0%:4.9%
Ratio of most
Gap of <=6.0
percentage points
10.8%:4.8%
Ratio of most
November 16
Low is good
On target (Green)
Within 10%
(Amber)
Please note the DWP has discontinued the dataset this information is sourced from and we are currently looking at other options to measure this or something similar.

Outcome: The Cambridgeshire economy prospers to the benefit of all Cambridgeshire residents
Measure Frequency Previous
period Target Actual Date of
latest data
Direction of travel (up is good, down
is bad)
Current month RAG
Status
Year-end prediction
RAG Status Comments
deprived areas
(Top 10%) to all other
areas
Gap of 6.1 percentage
points
Most deprived
areas (Top 10%)
Actual <=11.5%
deprived areas
(Top 10%) to all other
areas
Gap of 6.0 percentage
points
The 2016/17 target of <=11.5% is for the most deprived areas (top 10%). Latest figures published by the Department for Work and Pensions show that, in August 2016, 10.8% of people aged 16-64 in the most deprived areas of the County were in receipt of out-of-work benefits, compared with 4.8% of those living elsewhere in Cambridgeshire. The gap of 6.0 percentage points is lower than the last quarter and is currently achieving the target of <=6.5 percentage points.
Additional jobs created Annual +10,800
(Revised) +3,500
+6,800 (provisional)
30 September
17
High is good
On target (Green)
On target (Green)
The latest provisional figures from the Business Register and Employment Survey (BRES) show that 6,800 additional jobs were created between September 2016 and September 2017 compared with an increase of 10,800 for the same period in the previous year. This means that the 2017/18 target of +3,500 additional jobs has been achieved. This information is usually published late September/early October each year, for the previous year, by the Office for National Statistics (ONS) as part of the BRES Survey.
Passenger Transport

Outcome: The Cambridgeshire economy prospers to the benefit of all Cambridgeshire residents
Measure Frequency Previous
period Target Actual Date of
latest data
Direction of travel (up is good, down
is bad)
Current month RAG
Status
Year-end prediction
RAG Status Comments
Guided Busway passengers per month
Monthly 341,823 N/A 359,231 30
September 18
High is good
Contextual Contextual
The Guided Busway carried 359,231 passengers in September 2018. This figure is 17,408 more than in August and is 2,261 more than during September 2017. In addition the 12-month rolling total of 4.19 million this month is higher than the figure for the same period last year of 3.90 million. There have now been over 25.1 million passengers since the Busway opened in August 2011.
Local bus passenger journeys originating in the authority area
Annual Approx.
18.5 million 19 million
Approx. 18.7 million
2016/17
High is good
Within 10%
(Amber)
Within 10%
(Amber)
There were over 18.7 million bus passenger journeys originating in Cambridgeshire in 2016-7. This represents an increase of almost 2% from 2015-6; this growth can probably be attributed to the continued increase in passenger journeys on the guided busway. As predicted last year the target of 19 million bus passenger journeys was not achieved, but it still is anticipated that there is a chance of growth in the future through the City Deal and if so, this will take place in 2017-8 at the earliest.
Planning applications

Outcome: The Cambridgeshire economy prospers to the benefit of all Cambridgeshire residents
Measure Frequency Previous
period Target Actual Date of
latest data
Direction of travel (up is good, down
is bad)
Current month RAG
Status
Year-end prediction
RAG Status Comments
The percentage of County Matter planning applications determined within 13 weeks or within a longer time period if agreed with the applicant
Monthly 100% 100% 100% 30
September 18
High is good
On target (Green)
On target (Green)
8 County Matter planning applications have been received and determined on time since the beginning of the 2018/19 financial year. There were 3 other applications excluded from the County Matter figures. These were applications that required minor amendments or Environmental Impact Assessments (a process by which the anticipated effects on the environment of a proposed development is measured). 100% of these were determined on time.
Traffic and Travel
The average journey time per mile during the morning peak on the most congested routes
Annual 4 minutes
52 seconds 4 minutes
4 minutes 45 seconds
September 2016 to
August 2017
Low is good
Off target (Red)
Off target (Red)
At 4.45 minutes per mile, the latest figure for the average morning peak journey time per mile on key routes into urban areas in Cambridgeshire is better than the previous year’s figure of 4.52 minutes. The figure for Cambridge city is 5.29 minutes compared to the previous year’s figure of 5.44 minutes. The target for 2017/18 is to reduce this to 4 minutes per mile.

Outcome: People lead a healthy lifestyle and stay healthy for longer & The Cambridgeshire economy prospers to the benefit of all Cambridgeshire residents
Measure Frequency Previous
period Target Actual
Date of latest data
Direction of travel (up is good, down is
bad)
Current month RAG
Status
Year-end prediction
RAG Status Comments
Traffic and Travel
Growth in cycling from a 2004/05 average baseline
Annual 59%
increase 70%
increase 74%
increase 2017
High is good
On target (Green)
On target (Green)
There was a 10% increase in cycle trips in 2017* compared with 2016*. Overall growth from the 2004-05 average baseline is 74%, which is better than the Council's target. Cycling growth is measured by the overall increase across a number of automatic and manual count points located throughout Cambridgeshire, giving a large, robust sample. 2016 and 2017 data does not include data from the counties cycle ATCs as there is not complete data for these time periods due to a fault with the traffic counters in some of the locations. Work to fix and/or replace the faulty traffic counters is ongoing.

Outcome: People lead a healthy lifestyle and stay healthy for longer & The Cambridgeshire economy prospers to the benefit of all Cambridgeshire residents
Measure Frequency Previous
period Target Actual
Date of latest data
Direction of travel (up is good, down is
bad)
Current month RAG
Status
Year-end prediction
RAG Status Comments
% of adults who walk or cycle at least once a month – narrowing the gap between Fenland and others
Annual
Fenland = 81.1% Other
excluding Cambridge
= 89.4%
Fenland = 86.3%
Fenland = 73.7% Other
excluding Cambridge
= 80.6%
October 16
High is good
Within 10%
(Amber)
Within 10%
(Amber)
Latest figures published by the Department for Transport show that in 2015/16, 73.7% of Fenland residents walked or cycled at least once a month. This a reduction compared with 2014/2015 (81.1%). It is worth noting that because the indicator is based on a sample survey, the figure can vary from one survey period to the next, and the change since 2013/14 is not statistically significant. For instance the sample size for Fenland was 360 people and the sample size for the whole of Cambridgeshire was 2,323. Excluding Cambridge, the latest figure for the rest of the County is approximately 80.6%. The gap of 7.0 percentage points is less than the 204/15 gap of 8.3 percentage points. The 2012/13 baseline gap was 8.7 percentage points.

Place and Economy Operational Indicators
Outcome: Ensuring the majority of customers are informed, engaged and get what they need the first time they contact us
Measure Frequency Previous
period Target Actual Date of
latest data
Direction of travel (up is good, down
is bad)
Current month RAG
Status
Year-end prediction
RAG Status Comments
Place and Economy Operational Indicators
% of Freedom of Information requests answered within 20 days
Monthly 91.7% 90% 60.6% 30
September 18
High is good
Off target (Red)
Within 10%
(Amber)
33 Freedom of Information requests were received during September 2018. Provisional figures show that 20 (60.6%) of these were responded to on time. This is a significant drop in performance from last month’s figure. 159 Freedom of Information requests have been received since April 2018 and 83.0% of these have been responded to on-time. This compares with 96.3% (out of 135) and 96.1% (out of 154) for the same period last year and the year before. This is below our target of 90% although within 10% of achieving the target.
% of complaints responded to within 10 days
Monthly 89% 90% 90% 30
September 18
High is good
On target (Green)
On target (Green)
51 complaints were received in September 2018. 1 of these is outstanding and 45 (90% of completed complaints) of these were responded to within 10 working days. This is exactly on our target of 90%, however the year-to-date figure is currently 93% which remains above target.

Outcome: Having Councillors and officers who are equipped for the future
Measure Frequency Previous
period Target Actual
Date of latest data
Direction of travel (up is good, down
is bad)
Current month RAG
Status
Year-end prediction
RAG Status Comments
Place and Economy Operational Indicators
Staff Sickness - Days per full-time equivalent (f.t.e.) - 12-month rolling total. A breakdown of long-term and short-term sickness will also be provided.
Monthly 3.4 days per f.t.e.
6 days per f.t.e
3.6 days per
f.t.e.
31 March 2018
Low is good
On target (Green)
On target (Green)
The 12-month rolling average has increased slightly to at 3.6 days per full time equivalent (f.t.e.) and is still below (better than) the 6 day target. During March the total number of absence days within Place and Economy was 207 days based on 500 staff (f.t.e) working within the Service. The breakdown of absence shows that 137 days were short-term sickness and 70 days were long-term sickness. The launch of the new ERP Gold system has caused a delay in reports from this new data which means there is currently no data for the current financial year while new reports are written and tested.