PKA AIP / Årsrapport / Annual Report / 2014
48
M M X I V ANNUAL REPORT — 2014
-
Upload
pka-aip-as -
Category
Documents
-
view
233 -
download
3
description
PKA AIP / Årsrapport / Annual Report / 2014
Transcript of PKA AIP / Årsrapport / Annual Report / 2014

M M X I V
A N N U A L
R E P O R T
—
2 0 1 4

P K A A I P
A N N UA L R E P O R T
2 0 1 4 — M M X I V
PKA AIP A/S
Rosenborggade 1B
DK-1130 Copenhagen
Denmark
pkaaip.dk
Regarding charts on pages
17, 18, 19, 24, and 26
all numbers are calculated
using a fixed exchange rate
at the day of the commitment
for each investment.
Where figures are shown
as DKK (USD), the USD figures
are calculated using a
fixed exchange rate of 650.00.
Where figures are shown
as DKK (EUR), the EUR figures
are calculated using a
fixed exchange rate of 745.00.
Graphic design Wy
Printing Stenby Tryk


C O N T E N T S
7P K A A I P I N 2 0 1 4
A N D G O I N G F O R WA R D
The year 2014 at a glance
2014 in review and outlook for 2015
1 1 A B O U T
P K A A I P
Background
Organization
1 5P R I VAT E
F U N D S
PKA AIP 1 status
PKA AIP 2 strategy
PKA’s aggregate portfolio
2 9D I R E C T
I N F R A S T R U C T U R E
PKA AIP Direct 2012-2014
PKA AIP Direct 2015-2017
3 7A G G R E G AT E C O M M I T M E N T
O V E R V I E W
4 4G LO S S A RY
Contents 5

Courtesy of Anholt Offshore Wind Farm, DONG Energy
6

PKA AIP in 2014 and going forward
P K A A I P I N 2 0 1 4 A N D G O I N G F O R WA R D
7

T H E Y E A R 2 0 1 4 AT A G L A N C E
PKA AIP in 2014 and going forward
7
4
1
6PKA AIP was responsible for investing approximately
DKK 4 billion in funds and co-investments,
as well as approximately DKK 3 billion in direct
infrastructure assets.
PKA AIP was responsible for making four new co-
investments along with selected infrastructure and
private equity managers.
PKA AIP was chosen to perform asset management of
the Gode Wind 2 asset on behalf of an equity consortium
consisting of four Danish pension funds.
PKA AIP assisted PKA in making six commitments to
private equity funds across different geographies and
industries.
D K K B I L L I O N
C O - I N V E S T M E N T S
2PKA AIP advised PKA on two new direct investments:
Gemini Offshore Wind Farm in Holland and Gode Wind 2
Offshore Wind Farm in Germany.
D I R E C T C O M M I T M E N T S
4PKA AIP strengthened its organization by adding four
highly-skilled professionals to the team.
N E W T E A M M E M B E R S A S S E T M A N A G E M E N T A G R E E M E N T
F U N D C O M M I T M E N T S
8

2 0 1 4 I N R E V I E W A N D O U T LO O K F O R 2 0 1 5
The year 2014 was an exciting year for PKA AIP,
characterized by strong team developments and a solid
investment pace.
During the year, PKA AIP was responsible for
investing in excess of DKK 7 billion (USD 1.1 billion)
– more than in any single prior year. Approximately
DKK 4 billion was committed to private funds and
co-investments, while DKK 3 billion was invested
into direct infrastructure assets. Today, PKA AIP has
approximately DKK 38 billion (USD 5.8 billion) under
management, of which approximately DKK 32 billion
are in exposure to private funds and co-investments
and approximately DKK 6 billion are invested in direct
infrastructure assets.
The year 2014 marked the third year of operation
since the establishment of PKA AIP in April 2012.
During this period, the team has evolved from three
dedicated investment professionals to a broad-based
team of nine employees by the end of 2014. During the
year, PKA AIP strengthened its organization by adding
four highly-skilled professionals to the team across the
areas of office management, finance, fund investment,
and direct asset management. In order to accommo-
date current and future team expansions, PKA AIP
moved into a new office in March 2014, located in
central Copenhagen.
P R I VAT E F U N D S
The year 2014 was the final year of the commitment
period for PKA AIP 1. It was also the year that our efforts
to increase the capital deployed in co-investments
started to show significant traction, with 21% of 2014’s
total commitments going into co-investments.
Today, a total of DKK 11.6 billion (USD 1.8
billion) has been committed to 24 funds and seven
co-investments in PKA AIP 1. The program consists of
managers from PKA’s legacy portfolio and a number of
new strong managers that we are very pleased to have
partnered with. The carefully chosen commitments,
collectively, represent a promising portfolio, which
we expect to perform strongly over the decade.
The four co-investments that were made during
2014 represent a significant step up in terms of
number and value relative to previous years. This has
been achieved through a structured effort to increase
awareness about PKA’s co-investment appetite and
through an improved co-investment process, which
has enabled us to become sufficiently flexible and
efficient to match the process requirements of our
partners.
In 2014, the strong fundraising environment
from 2013 continued with significant capital coming
into the market. This has supported very short
fundraisings for top tier managers and has made it
increasingly difficult to get significant allocations
with the best performing managers. From our
perspective, the strong fundraising environment
has tempted a number of managers, facing easy
fundraisings, to increase fund sizes excessively. While
time may prove them right, we are concerned with
the inherent style drift and potential impairment of
investment discipline.
PKA AIP in 2014 and going forward
The year 2014 was an exciting
year for PKA AIP,
characterized by strong team
developments and a
solid investment pace.
9

PKA AIP in 2014 and going forward
D I R E C T I N F R A S T R U C T U R E
In 2014, PKA AIP continued its strategy of investing in
essential infrastructure in geographies with reliable
regulation and via long-term partner models with
strong alignment.
In May 2014, PKA AIP advised PKA in its commit-
ment to the Gemini Offshore Wind Farm - a project
which was recently awarded “European Wind Deal
of the Year” by Infrastructure Journal. PKA invested
EUR 120 million in the subordinated debt tranche in a
process where banks and financial investors provided
a debt financing package totaling approximately EUR
2.2 billion.
In September 2014, PKA AIP closed the second
direct infrastructure transaction of the year when
an equity consortium of four Danish pension funds
acquired 50% of the Gode Wind 2 Offshore Wind
Farm in Germany. PKA AIP advised PKA as the lead
investor in the consortium and was subsequently
chosen to perform asset management on behalf of the
consortium. The agreement is the first of its kind to
extend beyond the role of advisor to PKA, as PKA AIP
will actively manage the Gode Wind 2 asset on behalf
of four investors in order to maximize the investment
value. In order to cater for this new assignment,
PKA AIP further strengthened its organization in
the beginning of 2015 by adding a dedicated asset
manager.
The year 2014 saw a surge of capital into the
European infrastructure market from traditional
fund investors and an increasing number of direct
investors, thus continuing the trend from the year
before. In many cases, this capital found its way into
large coveted assets with a perceived low risk. The
result – according to other market participants –
has been a decoupling of the market, whereby core
infrastructure assets on one side have become more
competitive, while more complex assets have seen
a structuring premium included in the expected
returns. At PKA AIP, market developments are closely
monitored, and there is a continuous focus on retaining
pricing discipline throughout the investment process.
O U T LO O K F O R 2 0 1 5
PKA AIP expects to continue assisting PKA – and poten-
tially other institutional investors – in their efforts to
strengthen the focus on alternative investments.
In 2015, PKA AIP expects to make commitments
to private funds and co-investments in the amount
of DKK 4 billion. Commitments will be given to
managers with strong performances in a combination
of existing and new relationships. Within the direct
infrastructure space, PKA AIP expects to advise on one
to two investments worth DKK 2-3 billion.
The current investment strategy will continue to
apply with a focus on essential infrastructure assets
in Northern Europe. To facilitate these ambitious
investment programs, PKA AIP will continue to build
and strengthen its team during the course of 2015.
In 2015, PKA AIP expects to
make commitments to private
funds and co-investments in
the amount of DKK 4 billion.
10

Om PKA AIPAbout PKA AIP
A B O U T P K A A I P
11

About PKA AIP
B A C K G R O U N D
Since 2012, PKA AIP has assisted PKA in the field of
alternative investments through private funds,
and direct commitments in energy, as well as infra-
structure assets.
PKA is an administrative company that manages
and develops labor market pensions on behalf of three
independent pension funds with a total of approx-
imately 260,000 members within the social welfare
and health care sectors in Denmark. The total capital
amounts to approximately DKK 200 billion.
PKA has been active within private fund in-
vestments and direct investments in energy and
infrastructure assets since the 1990s. PKA AIP was
established in April 2012, as PKA chose to spin off the
administration of its alternative investment activities
into a separate entity.
PKA AIP was established to hive off the man-
agement of these alternative investments into an
independent unit for the purpose of:
• Strengthening and professionalizing the selection
and management of alternative investments;
• Reducing the costs of alternative investments
through increased co-investing with funds, as
well as direct investing in selected energy and
infrastructure assets;
• Creating a framework for achieving premium
returns relative to investing in publicly listed
assets; and
• Creating greater transparency and meeting added
regulatory requirements applied to alternative
investments.
PKA AIP manages PKA’s investments in private
funds and co-investments, as well as PKA’s existing
portfolio – in total, 118 funds and co-investments. PKA
AIP also manages PKA’s direct investments in energy
and infrastructure assets, and hence manages four
existing offshore wind farm investments on behalf of
PKA.
PKA and PKA AIP recently concluded a manage-
ment agreement for 2015-2017, under which PKA AIP
is to advise on commitments totaling approximately
DKK 13 billion into private equity funds and co-in-
vestments, as well as approximately DKK 7-8 billion
directly into infrastructure assets.
Since 2012, PKA AIP has
assisted PKA in the field
of alternative investments
through private funds,
co-investments, and direct
commitments in energy, as
well as infrastructure assets.
12
About PKA AIP
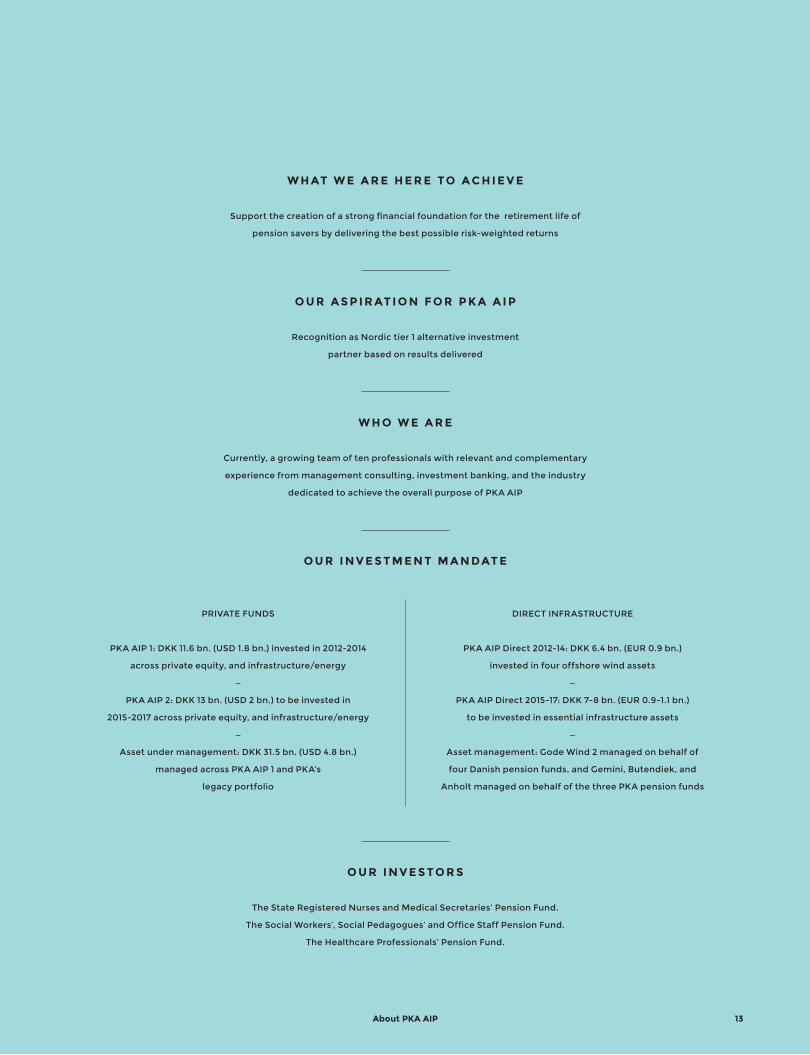
O U R I N V E S TO R S
The State Registered Nurses and Medical Secretaries’ Pension Fund.
The Social Workers’, Social Pedagogues’ and Office Staff Pension Fund.
The Healthcare Professionals’ Pension Fund.
O U R I N V E S T M E N T M A N DAT E
PRIVATE FUNDS
PKA AIP 1: DKK 11.6 bn. (USD 1.8 bn.) invested in 2012-2014
across private equity, and infrastructure/energy
—
PKA AIP 2: DKK 13 bn. (USD 2 bn.) to be invested in
2015-2017 across private equity, and infrastructure/energy
—
Asset under management: DKK 31.5 bn. (USD 4.8 bn.)
managed across PKA AIP 1 and PKA’s
legacy portfolio
DIRECT INFRASTRUCTURE
PKA AIP Direct 2012-14: DKK 6.4 bn. (EUR 0.9 bn.)
invested in four offshore wind assets
—
PKA AIP Direct 2015-17: DKK 7-8 bn. (EUR 0.9-1.1 bn.)
to be invested in essential infrastructure assets
—
Asset management: Gode Wind 2 managed on behalf of
four Danish pension funds, and Gemini, Butendiek, and
Anholt managed on behalf of the three PKA pension funds
W H AT W E A R E H E R E TO A C H I E V E
Support the creation of a strong financial foundation for the retirement life of
pension savers by delivering the best possible risk-weighted returns
O U R A S P I R AT I O N F O R P K A A I P
Recognition as Nordic tier 1 alternative investment
partner based on results delivered
W H O W E A R E
Currently, a growing team of ten professionals with relevant and complementary
experience from management consulting, investment banking, and the industry
dedicated to achieve the overall purpose of PKA AIP
13
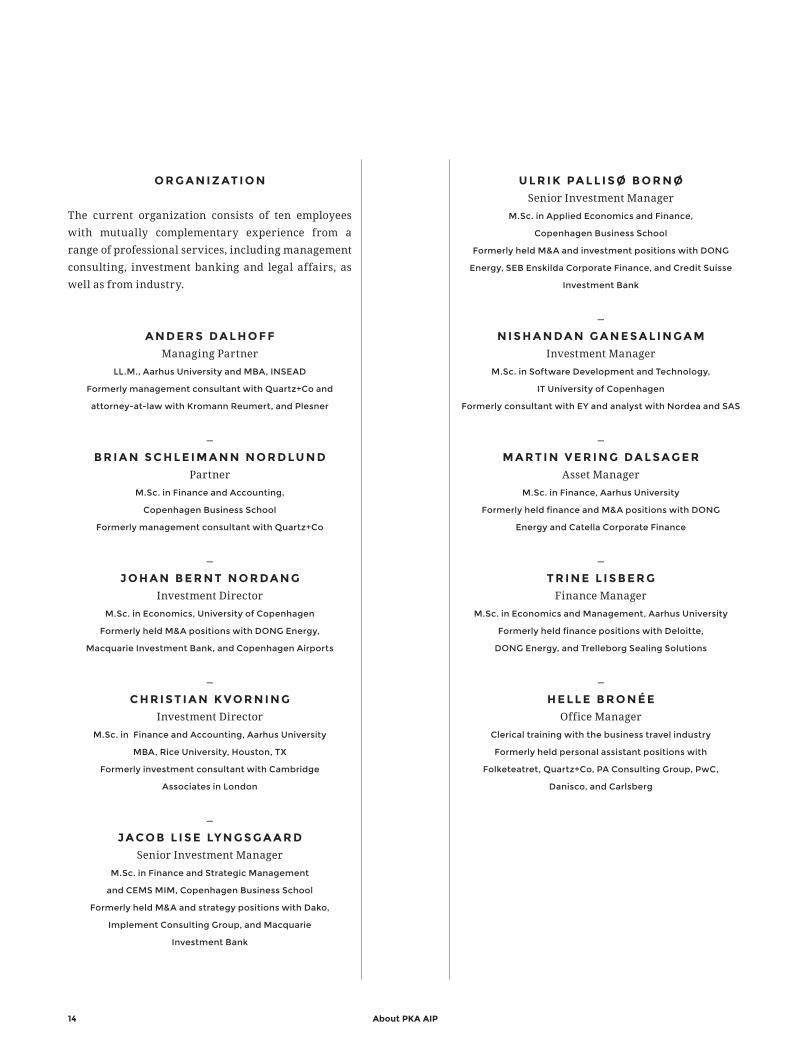
O R G A N I Z AT I O N
The current organization consists of ten employees
with mutually complementary experience from a
range of professional services, including management
consulting, investment banking and legal affairs, as
well as from industry.
A N D E R S DA L H O F F
Managing Partner
LL.M., Aarhus University and MBA, INSEAD
Formerly management consultant with Quartz+Co and
attorney-at-law with Kromann Reumert, and Plesner
—
B R I A N S C H L E I M A N N N O R D L U N D
Partner
M.Sc. in Finance and Accounting,
Copenhagen Business School
Formerly management consultant with Quartz+Co
—
J O H A N B E R N T N O R DA N G
Investment Director
M.Sc. in Economics, University of Copenhagen
Formerly held M&A positions with DONG Energy,
Macquarie Investment Bank, and Copenhagen Airports
—
C H R I S T I A N K V O R N I N G
Investment Director
M.Sc. in Finance and Accounting, Aarhus University
MBA, Rice University, Houston, TX
Formerly investment consultant with Cambridge
Associates in London
—
J A C O B L I S E LY N G S G A A R D
Senior Investment Manager
M.Sc. in Finance and Strategic Management
and CEMS MIM, Copenhagen Business School
Formerly held M&A and strategy positions with Dako,
Implement Consulting Group, and Macquarie
Investment Bank
U L R I K PA L L I S Ø B O R N Ø
Senior Investment Manager
M.Sc. in Applied Economics and Finance,
Copenhagen Business School
Formerly held M&A and investment positions with DONG
Energy, SEB Enskilda Corporate Finance, and Credit Suisse
Investment Bank
—
N I S H A N DA N G A N E S A L I N G A M
Investment Manager
M.Sc. in Software Development and Technology,
IT University of Copenhagen
Formerly consultant with EY and analyst with Nordea and SAS
—
M A R T I N V E R I N G DA L S A G E R
Asset Manager
M.Sc. in Finance, Aarhus University
Formerly held finance and M&A positions with DONG
Energy and Catella Corporate Finance
—
T R I N E L I S B E R G
Finance Manager
M.Sc. in Economics and Management, Aarhus University
Formerly held finance positions with Deloitte,
DONG Energy, and Trelleborg Sealing Solutions
—
H E L L E B R O N É E
Office Manager
Clerical training with the business travel industry
Formerly held personal assistant positions with
Folketeatret, Quartz+Co, PA Consulting Group, PwC,
Danisco, and Carlsberg
About PKA AIP14

Private funds
P R I VAT E F U N D S
15

Private funds
P K A A I P 1 S TAT U S
P R O G R A M R E V I E W
The PKA AIP 1 mandate of DKK 11.9 billion (USD
1.8 billion) has been deployed from 2012-2014. The
mandate covers commitments to private funds and co-
investments within two asset classes: private equity
and infrastructure/energy.
With the new commitments made during 2014,
total commitments in PKA AIP 1 reached DKK 11.6
billion. The program consists of 31 commitments of
which seven are co-investments. In terms of value, 10%
of the commitment has been given to co-investments.
For 2014 alone, co-investments made up 21% of the
committed value.
Of the total commitments, 68% has been
committed to private equity, followed by 17% to
energy, 11% to infrastructure and 4% to agriculture.
The majority of the commitments (53%) are with funds
focused on investing in the US and Canada, while 20%
are with European funds. 16% are invested in funds
with a global mandate, which include funds focusing
on emerging markets or US/EU strategies.
With the new commitments
made during 2014, total
commitments in PKA AIP 1
reached DKK 11.6 billion.
Courtesy of Peak 10, GI Partners Fund IV
16

Private funds
B R E A K D O W N O F C O M M I T M E N T S
BY A S S E T C L A S S
B R E A K D O W N O F C O M M I T M E N T S
BY I N V E S T M E N T F O C U S
4% Africa
16% Global
20% Europe
4% Australia
17% Energy
4% Agriculture
11% Infrastructure
4% Asia
68% Private Equity
53% US/Canada
17

Private funds
Out of the DKK 11.6 billion in commitments to PKA AIP
1, DKK 4.1 billon has been called corresponding to 34%
of the program and 35% of the actual commitments
given.
The total value of the program amounts to DKK
4.3 billion, of which DKK 4.0 billion is the current
market value, and DKK 0.3 billion has been distributed.
In total, this corresponds to a TVPI of 1.05.
While PKA AIP 1 is now fully committed, many of the
funds in the portfolio are still immature, and three
had not yet drawn their first capital as 2014 ended.
Although it is still too early to evaluate performance,
we are satisfied with the progress of the program and
note that with 35% of commitments already paid-in,
the investment pace is well above the market median
(benchmarked to the FoF index).
P K A A I P I N V E S T M E N T P R O G R A M
DKK billion
11.611.9
4.1 4.3
4.0
0.3
Paid-in capital
Commitments given
Programme
Distributed
Market value
Total value created
PIC0.35
TVPI1.05
18
Private funds
I N V E S T M E N T S I N 2 0 1 4
During the final commitment year of PKA AIP 1, six
new fund commitments and four co-investments
were made by PKA within the mandate. In total,
commitments worth DKK 3.8 billion were made
during 2014, including a commitment extension to
Trackmanager (DKK 0.1 billion).
N E W C O M M I T M E N T S M A D E I N P K A A I P D U R I N G 2 0 1 4
DKK million
382H.I.G. Middle Market LBO Fund II
721HGGC Fund II
442Comvest Partner V
166Star West Generation
89PPC Industries
550GI Partners Fund IV
441Abraaj Africa Fund III
516Exponent Fund III
95EV Offshore Limited
299SSI
Funds Co-investments
19
F U N D C O M M I T M E N T S
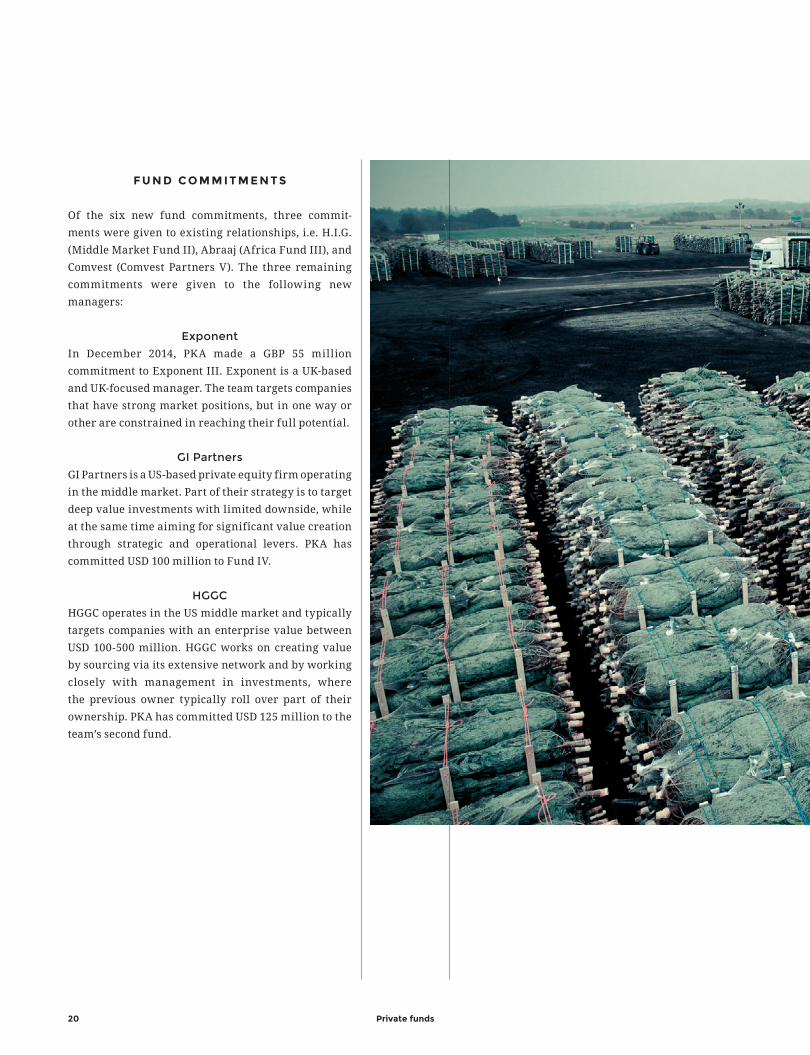
Of the six new fund commitments, three commit-
ments were given to existing relationships, i.e. H.I.G.
(Middle Market Fund II), Abraaj (Africa Fund III), and
Comvest (Comvest Partners V). The three remaining
commitments were given to the following new
managers:
Exponent
In December 2014, PKA made a GBP 55 million
commitment to Exponent III. Exponent is a UK-based
and UK-focused manager. The team targets companies
that have strong market positions, but in one way or
other are constrained in reaching their full potential.
GI Partners
GI Partners is a US-based private equity firm operating
in the middle market. Part of their strategy is to target
deep value investments with limited downside, while
at the same time aiming for significant value creation
through strategic and operational levers. PKA has
committed USD 100 million to Fund IV.
HGGC
HGGC operates in the US middle market and typically
targets companies with an enterprise value between
USD 100-500 million. HGGC works on creating value
by sourcing via its extensive network and by working
closely with management in investments, where
the previous owner typically roll over part of their
ownership. PKA has committed USD 125 million to the
team’s second fund.
Private funds20
C O - I N V E S T M E N T S
PKA committed to four co-investments during 2014.
The commitments, which include both the initial
funding and capital set-aside for future add-ons
and expansions, correspond to 21% of the total
commitments to private funds during 2014.
EV Offshore
EV Offshore designs and develops cameras for the
oil and gas industry in the UK and internationally.
EV uses well-known technologies and applies them
in the oil and gas industry with its own down-hole
video technology. With the use of in-house research
and engineering capabilities, EV designs camera
systems to work 10,000 meters below the surface in
environments up to 175° C and 15,000 psi in all areas
of the world. PKA committed GBP 10.0 million in
November 2014 alongside Dunedin Fund III.
PPC Industries
PPC Industries is a leading extruder and converter
of polyethylene bags, films, and tubing for food
and industrial packaging applications. PPC is a
manufacturer, which includes extrusion, converting,
and printing processes. PPC has two main facilities in
the US and Costa Rica. PKA committed USD 15 million
in November 2014 along with Kohlberg Fund VII.
SSI
SSI is a global provider of technology enabled data
collection services and survey research. The customer
base includes market research firms, consulting
firms, and end-clients including corporate users. The
company has 25 offices across 18 countries. PKA co-
invested in SSI shortly after the commitment to HGGC
Fund II.
Star West Generation
Star West Generation (SWG) is a 1.7 GW portfolio,
consisting of five gas-fired power generation plants
located in Arizona and California, which operate
within the Arizona, New Mexico, Southern Nevada,
and Southern California power markets. PKA
committed USD 30 million to SWG in February 2014
along with Highstar Capital Fund IV.
Private funds
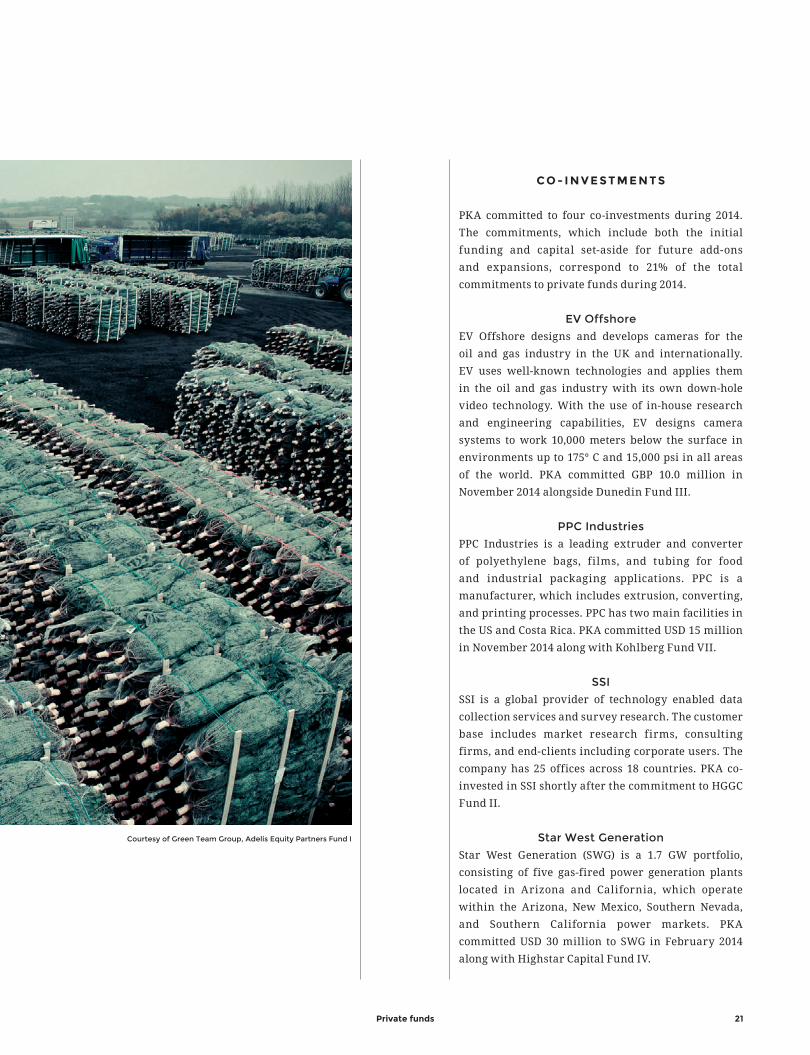
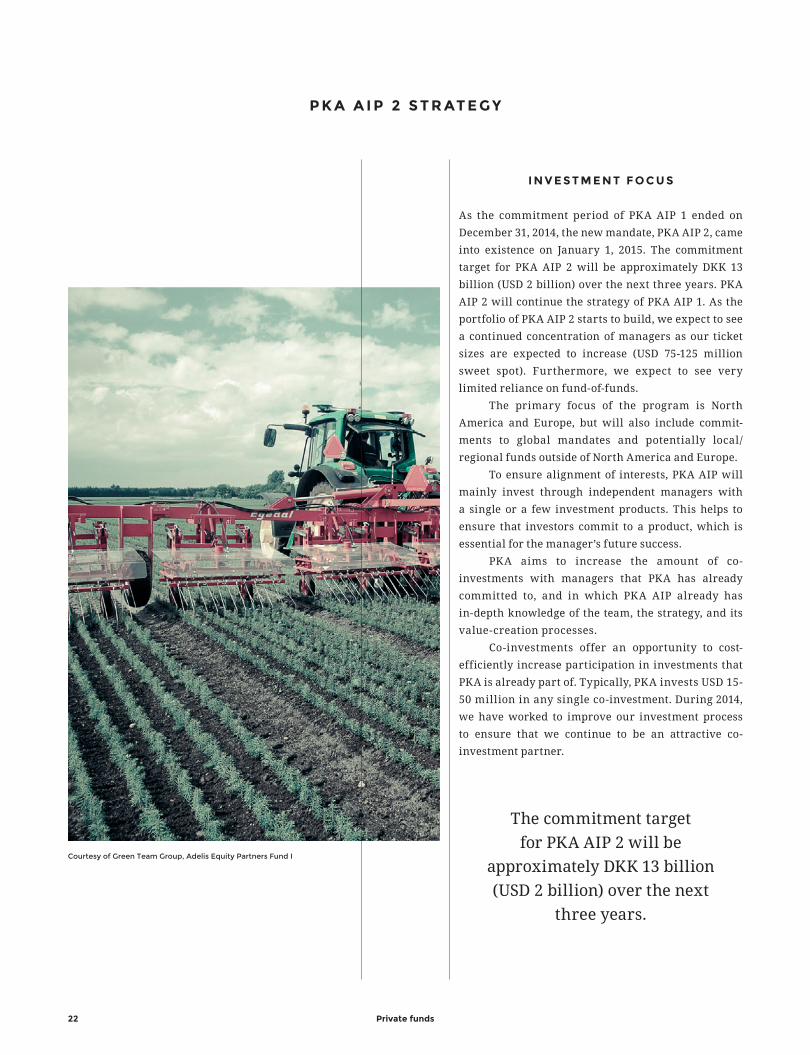
Courtesy of Green Team Group, Adelis Equity Partners Fund I
21
P K A A I P 2 S T R AT E G Y
I N V E S T M E N T F O C U S
As the commitment period of PKA AIP 1 ended on
December 31, 2014, the new mandate, PKA AIP 2, came
into existence on January 1, 2015. The commitment
target for PKA AIP 2 will be approximately DKK 13
billion (USD 2 billion) over the next three years. PKA
AIP 2 will continue the strategy of PKA AIP 1. As the
portfolio of PKA AIP 2 starts to build, we expect to see
a continued concentration of managers as our ticket
sizes are expected to increase (USD 75-125 million
sweet spot). Furthermore, we expect to see very
limited reliance on fund-of-funds.
The primary focus of the program is North
America and Europe, but will also include commit-
ments to global mandates and potentially local/
regional funds outside of North America and Europe.
To ensure alignment of interests, PKA AIP will
mainly invest through independent managers with
a single or a few investment products. This helps to
ensure that investors commit to a product, which is
essential for the manager’s future success.
PKA aims to increase the amount of co-
investments with managers that PKA has already
committed to, and in which PKA AIP already has
in-depth knowledge of the team, the strategy, and its
value-creation processes.
Co-investments offer an opportunity to cost-
efficiently increase participation in investments that
PKA is already part of. Typically, PKA invests USD 15-
50 million in any single co-investment. During 2014,
we have worked to improve our investment process
to ensure that we continue to be an attractive co-
investment partner.
The commitment target
for PKA AIP 2 will be
approximately DKK 13 billion
(USD 2 billion) over the next
three years.
Private funds
Courtesy of Green Team Group, Adelis Equity Partners Fund I
22
P R I VAT E E Q U I T Y
Commitments to new managers in PKA AIP 2 will
generally be given to mid-sized funds with total
commitments of USD 0.5-2.0 billion for the purpose
of: (i) achieving a professional, institutional product
without undue reliance on specific individuals; and
(ii) enabling PKA to invest at least DKK 400 million
per fund. In many cases, companies targeted by funds
in this segment are of a size, which is suitable for
expansion during the ownership period to make them
attractive targets of strategic acquisitions by major
competitors. Also, with this, a strong preference for
funds taking controlling interests exists.
PKA invests in private equity funds with a
proven, strong track record and a realized return
outperforming both competing funds and listed
companies.
It is essential that the funds can demonstrate
a controllable and repeatable ability to create value
by optimizing the portfolio companies and creating
growth.
I N F R A S T R U C T U R E
A N D E N E R G Y
The investment strategy for infrastructure and energy
funds will typically target funds larger than USD 500
million.
The funds must have one or more strategic and
operational value creation angles to their invest-
ments so as to generate an attractive return. It is also
essential that the strategy builds on initiatives that are
controllable and can be reproduced in future.
Private funds 23
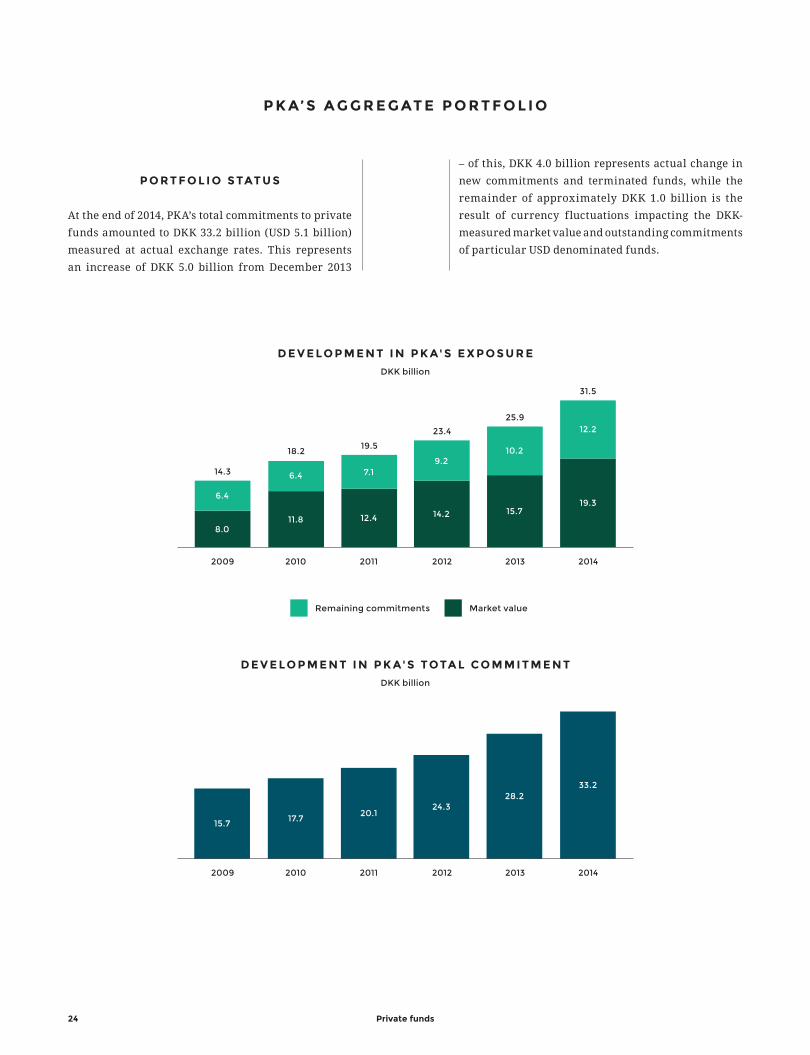
P K A’ S A G G R E G AT E P O R T F O L I O
P O R T F O L I O S TAT U S
At the end of 2014, PKA’s total commitments to private
funds amounted to DKK 33.2 billion (USD 5.1 billion)
measured at actual exchange rates. This represents
an increase of DKK 5.0 billion from December 2013
– of this, DKK 4.0 billion represents actual change in
new commitments and terminated funds, while the
remainder of approximately DKK 1.0 billion is the
result of currency fluctuations impacting the DKK-
measured market value and outstanding commitments
of particular USD denominated funds.
D E V E LO P M E N T I N P K A' S TOTA L C O M M I T M E N T
DKK billion
D E V E LO P M E N T I N P K A' S E X P O S U R E
DKK billion
2010 20122009 2011 2013
15.7 17.720.1
24.328.2
33.2
2014
2010 20122009 2011 2013
8.011.8 12.4 14.2 15.7
6.4
6.4 7.19.2
10.2
14.3
18.219.5
23.4
25.9
2014
19.3
12.2
31.5
Remaining commitments Market value
Private funds24

Private funds
The total exposure of the portfolio amounted to
DKK 31.5 billion (USD 4.8 billion) – up DKK 5.6 billion
since last year. Of the total exposure, DKK 19.3 billion
(USD 3.0 billion) was the market value of the invest-
ments, while DKK 12.2 billion (USD 1.9 billion) were
the outstanding commitments. Of the total market
value, 53% is attributed to private equity, and 49% are
with funds or co-investments focused on the US.
Courtesy of Peak 10, GI Partners Fund IV
25

Private funds
B R E A K D O W N O F M A R K E T VA L U E
BY A S S E T C L A S S
B R E A K D O W N O F M A R K E T VA L U E
BY I N V E S T M E N T F O C U S
3% Latin America
6% Asia
19% Global
19% Europe
20% Timber
2% Australia
13% Infrastructure
3% Agriculture
12% Energy
2% Africa
53% Private Equity
49% US/Canada
26
Private funds
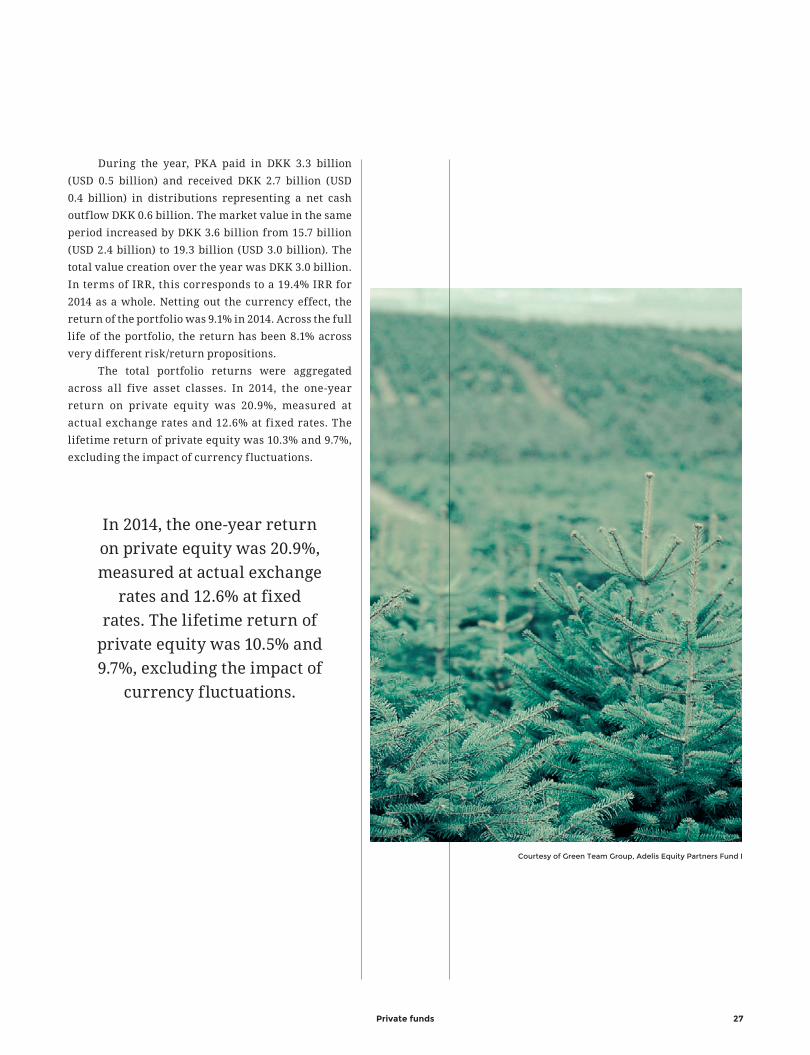
During the year, PKA paid in DKK 3.3 billion
(USD 0.5 billion) and received DKK 2.7 billion (USD
0.4 billion) in distributions representing a net cash
outflow DKK 0.6 billion. The market value in the same
period increased by DKK 3.6 billion from 15.7 billion
(USD 2.4 billion) to 19.3 billion (USD 3.0 billion). The
total value creation over the year was DKK 3.0 billion.
In terms of IRR, this corresponds to a 19.4% IRR for
2014 as a whole. Netting out the currency effect, the
return of the portfolio was 9.1% in 2014. Across the full
life of the portfolio, the return has been 8.1% across
very different risk/return propositions.
The total portfolio returns were aggregated
across all five asset classes. In 2014, the one-year
return on private equity was 20.9%, measured at
actual exchange rates and 12.6% at fixed rates. The
lifetime return of private equity was 10.3% and 9.7%,
excluding the impact of currency fluctuations.
In 2014, the one-year return
on private equity was 20.9%,
measured at actual exchange
rates and 12.6% at fixed
rates. The lifetime return of
private equity was 10.5% and
9.7%, excluding the impact of
currency fluctuations.
Courtesy of Green Team Group, Adelis Equity Partners Fund I
27
Private funds
Courtesy of Peak 10, GI Partners Fund IV
28

Direct infrastructure
D I R E C T I N F R A S T R U C T U R E
29

Direct infrastructure
P K A A I P D I R E C T 2 0 1 2 - 2 0 1 4
P R O G R A M R E V I E W
The PKA AIP Direct 2012-2014 program covers the
direct energy and infrastructure investments made
by PKA until the end of 2014.
Since PKA’s investment in Anholt Offshore
Wind Farm in 2011, PKA has steadily increased its
direct investment focus on long-life assets with stable,
predictable income. Allocations to infrastructure
have allowed PKA to provide its members with solid
and attractive yields in the current low interest rate
environment.
During the mandate period 2012-2014, PKA
AIP has added three offshore wind investments to
PKA’s portfolio, making for a total of four offshore
wind farms. The portfolio is well diversified across
different wind capture areas and subsidy regimes,
and all assets use state-of-the-art components in order
to maximize production yield.
Courtesy of Anholt Offshore Wind Farm, DONG Energy
30

Direct infrastructure
Anholt
2013
Siemens 3.6 MW-120
Monopile
DONG Energy
Butendiek
2015
Siemens 3.6 MW-120
Monopile
Multi contract
Gode Wind 2
2016
Siemens 6.0 MW-154
Monopile
DONG Energy
Gemini
2017
Siemens 4.0 MW-130
Monopile
Siemens / Van Oord
Asset
Commercial Operation Date
Wind Turbine Generator
Foundation structure
Main contractor(s)
P O R T F O L I O O F D I R E C T I N F R A S T R U C T U R E I N V E S T M E N T S
C O M M I T M E N T S TO D I R E C T I N F R A S T R U C T U R E 2 0 1 2 - 2 0 1 4
EUR million
338
846
2011Anholt
2012—
2013Butendiek
2014 Gemini / Gode Wind 2
Total
120 288
100
As of December 31, 2014, PKA’s direct
commitments to energy and infrastructure
assets totaled approximately EUR 850 million,
split across PKA’s four offshore wind assets.
31

Direct infrastructure
I N V E S T M E N T S
During 2014, PKA made commitments to two direct
infrastructure assets: the Gemini Offshore Wind Farm
in Holland and the Gode Wind 2 Offshore Wind Farm
in Germany. Along with Butendiek Offshore Wind
Farm and Anholt Offshore Wind Farm, PKA now holds
interests in four offshore wind assets.
G O D E W I N D 2
O F F S H O R E W I N D FA R M
Asset overview
PKA invested in its second German offshore wind
project, Gode Wind 2, in September of 2014. Gode
Wind 2 is located in the North Sea, approximately
45 km from the German coastline, and will consist
of 42 turbines when completed in the spring of
2016. The project will benefit from the latest wind
turbine technology available in the market with the
6 MW turbine from Siemens Wind Power – giving
a total nameplate capacity of 252 MW. The turbines
are equipped with the latest gearless solution – the
direct drive technology and rotors with a span of 154
meters in diameter. Gode Wind 2 is expected to supply
CO2-free electricity corresponding to the annual
consumption of some 260,000 German households.
The wind farm will have its operational base in
the harbor town of Norddeich. Gode Wind 2 is the first
of two phases and will be the neighbor of Gode Wind 1,
once this project is completed in 2016.
Investment characteristics
The institutional investor consortium consisting of
PKA, Industriens Pension, Lægernes Pensionskasse,
and Lærernes Pension invested EUR 582 million for
a 50% stake in Gode Wind 2. DONG Energy holds the
remaining 50% ownership stake. DONG Energy is
acting as the turn-key contractor of the project and
takes the full construction risk for the project. The
investor consortium has also engaged DONG Energy
as the operator and service provider for the first 15
years of operation. DONG Energy is currently a market
leader in offshore wind projects and has a long, proven
track record from several German, UK, and Danish
projects. Gode Wind 2 benefits from a strong wind
regime, which combined with a government-backed
fixed price subsidy for approximately the first 10
years, will generate a stable, high cash flow.
PKA AIP has been engaged to lead and perform
active asset management for the investor consortium
of the Gode Wind 2 project throughout the construction
phase and will continue when the asset is operational.
During 2014, PKA made
commitments to two direct
infrastructure assets: the
Gemini Offshore Wind Farm
in Holland and the Gode
Wind 2 Offshore Wind Farm
in Germany.
32
Asset progress in 2014
The planning and construction of Gode Wind 2 has
reached several important milestones during 2014. The
project has secured the necessary permits and signed
all major supplier contracts. Furthermore, fabrication
of many of the wind farm’s major components is
progressing as planned. The project also has a binding
agreement with the local grid operator – Tennet – to
deliver the necessary infrastructure in order to deliver
electricity from the wind farm to the shore. During
2014, the project’s main offshore converter platform is
close to completion, and fabrication of foundations has
started and is following the planned schedule. Finally,
the site has been completely cleared from all identified
underwater objects which will allow the installation
of cables and foundations.
In 2015, the project will commence the large
offshore installation activities; initially, with the
installation of foundations and thereafter, with
the array cables, offshore substation, and the park
will finally be completed with the installation and
commissioning of the wind turbines.
G E M I N I
O F F S H O R E W I N D FA R M
Asset overview
PKA entered into the financing consortium of the off-
shore wind project Gemini in May of 2014. With 150
Siemens 4.0 MW turbines, the Gemini Offshore Wind
Farm will be one of the largest wind farms in the world
in terms of size and production. The site is located in
the Dutch part of the North Sea, 85 km north of the
coast of Groningen and benefits from a strong wind
resource. Once completed in 2017, the wind farm will
supply CO2-free electricity corresponding to the an-
nual consumption of some 785,000 Dutch households.
The developer of the project is Typhoon Offshore,
who has contracted Van Oord and Siemens Wind Pow-
er on turn-key contracts for delivering the balance
of plant and turbines for the wind farm. The project
has also engaged Siemens as the operator and service
provider for the first 15 years of operation. Gemini
is owned by Northland Power Income Fund (60%),
Siemens (20%), Van Oord (10.0%), and HVG (10.0%).
Investment characteristics
PKA joined, along with a number of banks and financial
investors, a financing consortium, which has provided
a total debt financing facility of approximately EUR
2.2 billion to the Gemini project.
PKA has provided a junior debt facility of EUR
120 million. The facility has a tenor of approximately
17 years and will provide a high, secure coupon rate
in this period due to the revenue stream coming
principally from the government-backed subsidy
system for the first 15 years. Aside from PKA,
Northland Power Income Fund has provided a junior
debt facility of EUR 80 million. A number of financial
institutions have provided the senior debt facility,
including the European Investment Bank, EKF, Euler
Hermes, and Delcredere|Ducroire.
Asset progress in 2014
The Gemini project saw good progress in 2014. Fabri-
cation of key components is well underway, including
fabrication of the land cable, foundations, topsides for
both offshore substations, export cables, and other
electrical components. Furthermore, the project com-
menced the horizontal drillings for the export cable.
The project expects the commercial operation of
all turbines by 2017.
B U T E N D I E K
O F F S H O R E W I N D FA R M
Asset overview
PKA invested in the Butendiek Offshore Wind Farm
in 2013. Butendiek Offshore Wind Farm is located in
the North Sea on the German-Danish border, 32 km
off the island of Sylt. The wind farm will consist of 80
Siemens 3.6 MW turbines resulting in a total capacity
of 288 MW.
The wind farm is being built by the German
developer, WPD, and a number of subcontractors
during the period 2013-2015. Once in full operation,
the wind farm is expected to produce CO2-free energy
to cover the annual consumption of 370,000 households
for 25 years.
Direct infrastructure 33

Direct infrastructure
Investment characteristics
PKA invested approximately EUR 100 million in equity
for a 22.5% ownership interest. Co-investors Siemens
Financial Services, Marguerite Infrastructure Fund,
and Industriens Pension also acquired a 22.5% interest
each. WPD, the project developer, holds the remaining
10.0%. The total equity investment amounts to EUR
450 million. In addition to the equity investments, the
project has obtained external project financing from
commercial banks and various credit institutions,
including EKF, the Danish export credit agency.
External financing amounts to EUR 850 million for
total construction costs of approximately EUR 1.3
billion.
Butendiek is PKA’s first investment involving
external project financing. This is also the first time
PKA has assumed a construction risk in its direct
infrastructure investment program. The project is
expected to have an attractive, balanced risk/return
profile – in part due to the comprehensive insurance
package and guarantees, which addresses a number of
the construction risks. Due to the production profile
and the fixed tariff during the subsidy period, the
return is expected to have low correlation with the
general market.
Asset progress in 2014
The construction of the wind farm has shown
significant progress throughout the year with only
a minor delay to some of the components. Highlights
have been the full installation of all 80 foundations
and transition pieces, the installation of the offshore
substation, and completion of all the inner-array
cables. The installation of the wind turbine generators
has been slightly behind schedule, which was also the
case with the external grid provided by Tennet.
The first power was produced in February 2015,
and the park is expected to be in full operation by July
2015.
A N H O LT
O F F S H O R E W I N D FA R M
Asset overview
PKA invested in the Anholt Offshore Wind Farm
in 2011. Located between Jutland and the island of
Anholt, this is Denmark’s largest offshore wind farm.
It has a nameplate capacity of 400 MW and consists of
111 3.6 MW turbines.
The wind farm was built during 2012 and 2013.
It is expected to supply CO2-free power corresponding
to the annual consumption of some 400,000 Danish
households, equal to about 4.0% of Denmark’s power
consumption. DONG Energy developed the project and
currently operates the wind farm.
Investment characteristics
PKA invested EUR 338 million in return for a 20%
interest in the overall project. Other investors in the
project are PensionDanmark (30%) and DONG Energy
(50%). There is no external project financing.
The project has a scheduled duration of up to 25
years and is expected to generate stable annual returns
throughout that period. Due to the production profile
and the fixed tariffs during the subsidy period, the
investment return is expected to have low correlation
with the general market.
Asset progress in 2014
The construction of Anholt Offshore Wind Farm took
place from 2011-2013, and since the middle of 2013,
the asset has been in full commercial operation. The
asset concluded its first full year of operation in 2014.
For the year as a whole, asset output was firmly above
expectations owing to solid average wind speeds and
strong wind farm availability.
On September 30, 2014, a failure occurred on the
export cable managed by Energinet.dk. The failure
was quickly located, and the grid connection was
reestablished on October 6, 2014. Anholt Offshore Wind
Farm has been compensated for direct production
losses during the period where no grid was available.
34
P K A A I P D I R E C T 2 0 1 5 - 2 0 1 7
I N V E S T M E N T
F O C U S
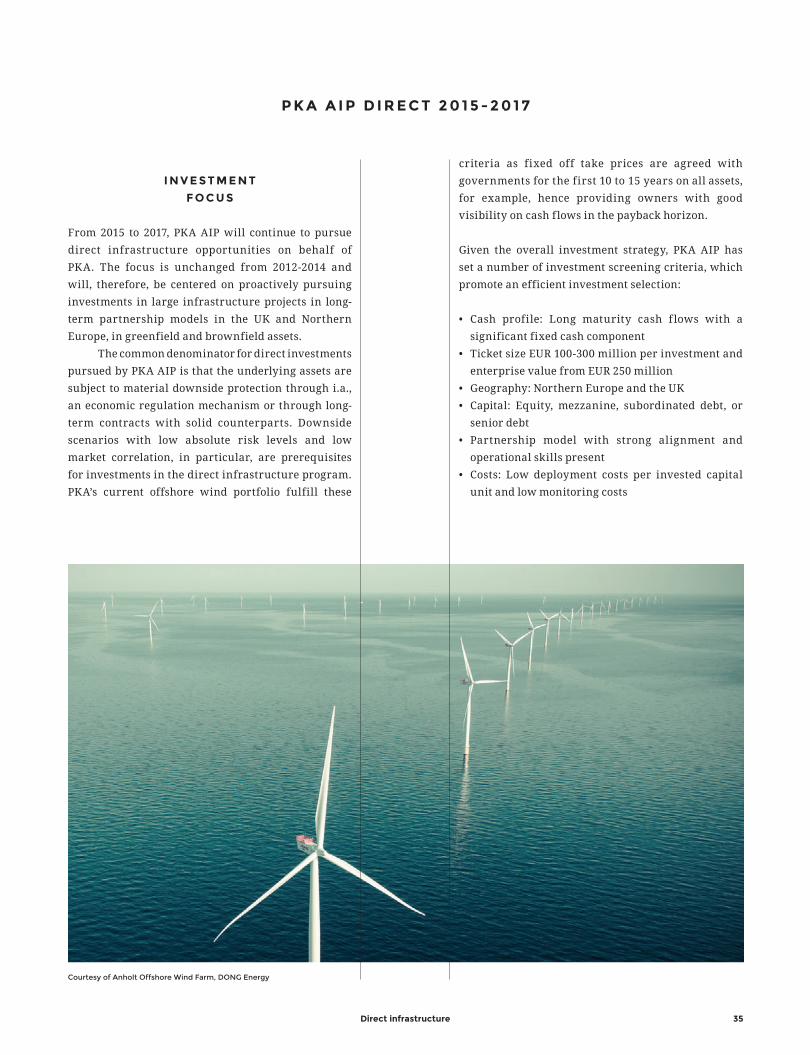
From 2015 to 2017, PKA AIP will continue to pursue
direct infrastructure opportunities on behalf of
PKA. The focus is unchanged from 2012-2014 and
will, therefore, be centered on proactively pursuing
investments in large infrastructure projects in long-
term partnership models in the UK and Northern
Europe, in greenfield and brownfield assets.
The common denominator for direct investments
pursued by PKA AIP is that the underlying assets are
subject to material downside protection through i.a.,
an economic regulation mechanism or through long-
term contracts with solid counterparts. Downside
scenarios with low absolute risk levels and low
market correlation, in particular, are prerequisites
for investments in the direct infrastructure program.
PKA’s current offshore wind portfolio fulfill these
criteria as fixed off take prices are agreed with
governments for the first 10 to 15 years on all assets,
for example, hence providing owners with good
visibility on cash flows in the payback horizon.
Given the overall investment strategy, PKA AIP has
set a number of investment screening criteria, which
promote an efficient investment selection:
• Cash profile: Long maturity cash f lows with a
significant fixed cash component
• Ticket size EUR 100-300 million per investment and
enterprise value from EUR 250 million
• Geography: Northern Europe and the UK
• Capital: Equity, mezzanine, subordinated debt, or
senior debt
• Partnership model with strong alignment and
operational skills present
• Costs: Low deployment costs per invested capital
unit and low monitoring costs
Direct infrastructure
Courtesy of Anholt Offshore Wind Farm, DONG Energy
35

Direct infrastructure
E X P E C T E D C O M M I T M E N T S TO D I R E C T I N F R A S T R U C T U R E 2 0 1 5 - 2 0 1 7
EUR million
1.000
2015
2016
2017
Total
333
333
333
PKA AIP seeks investments in projects with like-
minded investors and prefers consortia with strong
operational partners, who are aligned in the financial
performance of the project.
Typically, PKA targets a 20-49% shareholding,
and will not take a lead ownership role in the invest-
ment, which is instead handled by a significant co-
owner with strong operational skills and involvement.
Although offshore wind has been the sole invest-
ment theme during 2012-2014, the 2015-2017 mandate
will likely include additional essential infrastruc-
ture assets with similar cash flow characteristics and
downside protection.
As part of the newly concluded management
agreement covering 2015-2017, PKA AIP expects to
advise PKA on investments of approximately EUR
300-350 million per year directly into energy and
infrastructure assets. By the end of 2017, PKA is
expected to hold approximately EUR 1.85 billion of
energy and infrastructure assets.
As part of the newly concluded management
agreement covering 2015-2017, PKA AIP
expects to advise PKA on investments
of approximately EUR 300-350 million per year
directly into energy and infrastructure assets.
36
Aggregate commitment overview
A G G R E G AT E C O M M I T M E N T O V E R V I E W
37
Aggregate commitment overview
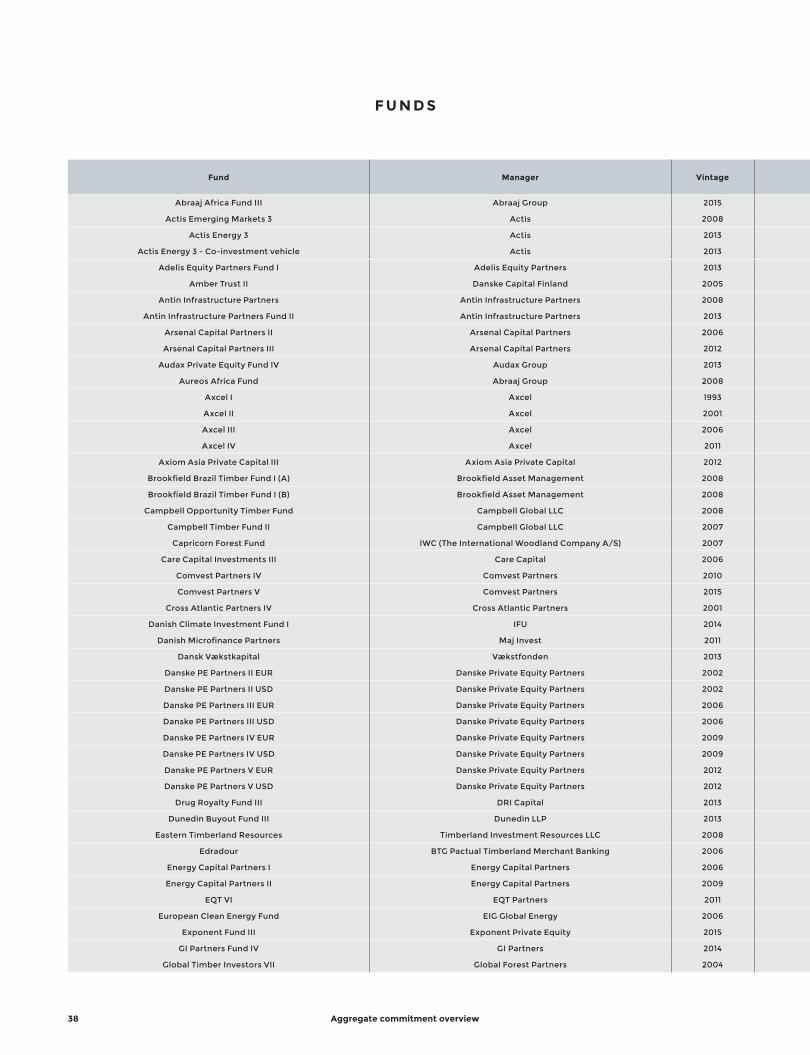
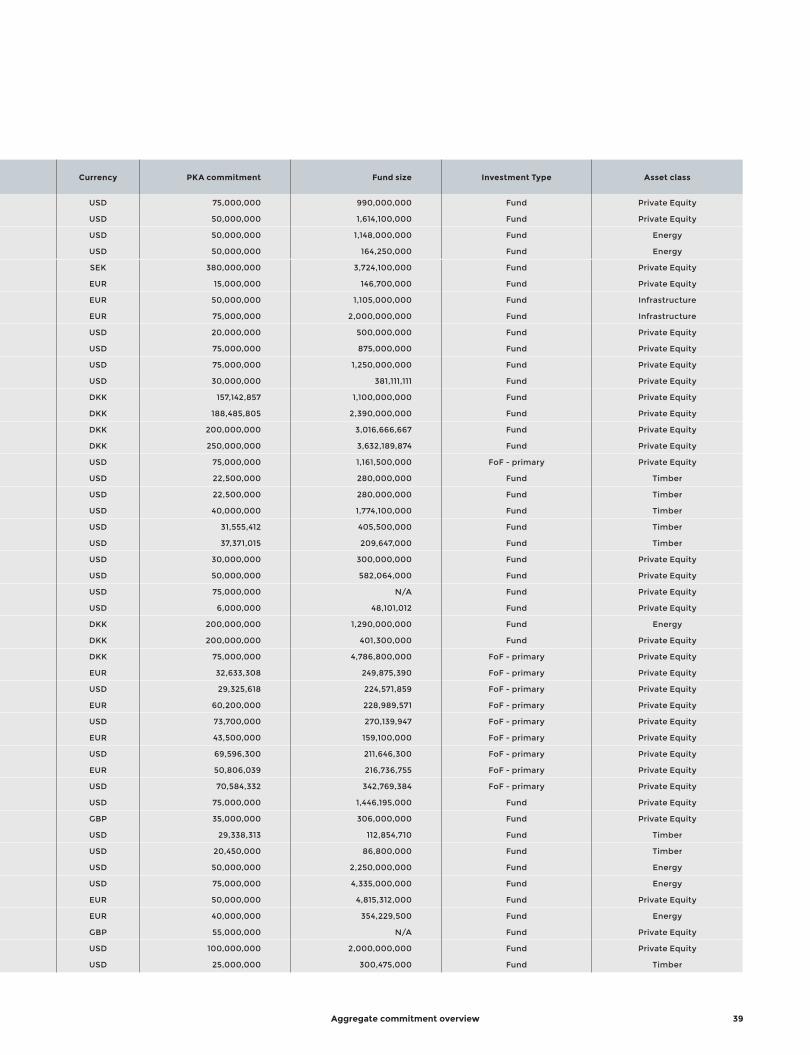
Fund Manager Vintage Currency PKA commitment Fund size Investment Type Asset class
Abraaj Africa Fund III Abraaj Group 2015 USD 75,000,000 990,000,000 Fund Private Equity
Actis Emerging Markets 3 Actis 2008 USD 50,000,000 1,614,100,000 Fund Private Equity
Actis Energy 3 Actis 2013 USD 50,000,000 1,148,000,000 Fund Energy
Actis Energy 3 - Co-investment vehicle Actis 2013 USD 50,000,000 164,250,000 Fund Energy
Adelis Equity Partners Fund I Adelis Equity Partners 2013 SEK 380,000,000 3,724,100,000 Fund Private Equity
Amber Trust II Danske Capital Finland 2005 EUR 15,000,000 146,700,000 Fund Private Equity
Antin Infrastructure Partners Antin Infrastructure Partners 2008 EUR 50,000,000 1,105,000,000 Fund Infrastructure
Antin Infrastructure Partners Fund II Antin Infrastructure Partners 2013 EUR 75,000,000 2,000,000,000 Fund Infrastructure
Arsenal Capital Partners II Arsenal Capital Partners 2006 USD 20,000,000 500,000,000 Fund Private Equity
Arsenal Capital Partners III Arsenal Capital Partners 2012 USD 75,000,000 875,000,000 Fund Private Equity
Audax Private Equity Fund IV Audax Group 2013 USD 75,000,000 1,250,000,000 Fund Private Equity
Aureos Africa Fund Abraaj Group 2008 USD 30,000,000 381,111,111 Fund Private Equity
Axcel I Axcel 1993 DKK 157,142,857 1,100,000,000 Fund Private Equity
Axcel II Axcel 2001 DKK 188,485,805 2,390,000,000 Fund Private Equity
Axcel III Axcel 2006 DKK 200,000,000 3,016,666,667 Fund Private Equity
Axcel IV Axcel 2011 DKK 250,000,000 3,632,189,874 Fund Private Equity
Axiom Asia Private Capital III Axiom Asia Private Capital 2012 USD 75,000,000 1,161,500,000 FoF - primary Private Equity
Brookfield Brazil Timber Fund I (A) Brookfield Asset Management 2008 USD 22,500,000 280,000,000 Fund Timber
Brookfield Brazil Timber Fund I (B) Brookfield Asset Management 2008 USD 22,500,000 280,000,000 Fund Timber
Campbell Opportunity Timber Fund Campbell Global LLC 2008 USD 40,000,000 1,774,100,000 Fund Timber
Campbell Timber Fund II Campbell Global LLC 2007 USD 31,555,412 405,500,000 Fund Timber
Capricorn Forest Fund IWC (The International Woodland Company A/S) 2007 USD 37,371,015 209,647,000 Fund Timber
Care Capital Investments III Care Capital 2006 USD 30,000,000 300,000,000 Fund Private Equity
Comvest Partners IV Comvest Partners 2010 USD 50,000,000 582,064,000 Fund Private Equity
Comvest Partners V Comvest Partners 2015 USD 75,000,000 N/A Fund Private Equity
Cross Atlantic Partners IV Cross Atlantic Partners 2001 USD 6,000,000 48,101,012 Fund Private Equity
Danish Climate Investment Fund I IFU 2014 DKK 200,000,000 1,290,000,000 Fund Energy
Danish Microfinance Partners Maj Invest 2011 DKK 200,000,000 401,300,000 Fund Private Equity
Dansk Vækstkapital Vækstfonden 2013 DKK 75,000,000 4,786,800,000 FoF - primary Private Equity
Danske PE Partners II EUR Danske Private Equity Partners 2002 EUR 32,633,308 249,875,390 FoF - primary Private Equity
Danske PE Partners II USD Danske Private Equity Partners 2002 USD 29,325,618 224,571,859 FoF - primary Private Equity
Danske PE Partners III EUR Danske Private Equity Partners 2006 EUR 60,200,000 228,989,571 FoF - primary Private Equity
Danske PE Partners III USD Danske Private Equity Partners 2006 USD 73,700,000 270,139,947 FoF - primary Private Equity
Danske PE Partners IV EUR Danske Private Equity Partners 2009 EUR 43,500,000 159,100,000 FoF - primary Private Equity
Danske PE Partners IV USD Danske Private Equity Partners 2009 USD 69,596,300 211,646,300 FoF - primary Private Equity
Danske PE Partners V EUR Danske Private Equity Partners 2012 EUR 50,806,039 216,736,755 FoF - primary Private Equity
Danske PE Partners V USD Danske Private Equity Partners 2012 USD 70,584,332 342,769,384 FoF - primary Private Equity
Drug Royalty Fund III DRI Capital 2013 USD 75,000,000 1,446,195,000 Fund Private Equity
Dunedin Buyout Fund III Dunedin LLP 2013 GBP 35,000,000 306,000,000 Fund Private Equity
Eastern Timberland Resources Timberland Investment Resources LLC 2008 USD 29,338,313 112,854,710 Fund Timber
Edradour BTG Pactual Timberland Merchant Banking 2006 USD 20,450,000 86,800,000 Fund Timber
Energy Capital Partners I Energy Capital Partners 2006 USD 50,000,000 2,250,000,000 Fund Energy
Energy Capital Partners II Energy Capital Partners 2009 USD 75,000,000 4,335,000,000 Fund Energy
EQT VI EQT Partners 2011 EUR 50,000,000 4,815,312,000 Fund Private Equity
European Clean Energy Fund EIG Global Energy 2006 EUR 40,000,000 354,229,500 Fund Energy
Exponent Fund III Exponent Private Equity 2015 GBP 55,000,000 N/A Fund Private Equity
GI Partners Fund IV GI Partners 2014 USD 100,000,000 2,000,000,000 Fund Private Equity
Global Timber Investors VII Global Forest Partners 2004 USD 25,000,000 300,475,000 Fund Timber
F U N D S
38
Aggregate commitment overview
Fund Manager Vintage Currency PKA commitment Fund size Investment Type Asset class
Abraaj Africa Fund III Abraaj Group 2015 USD 75,000,000 990,000,000 Fund Private Equity
Actis Emerging Markets 3 Actis 2008 USD 50,000,000 1,614,100,000 Fund Private Equity
Actis Energy 3 Actis 2013 USD 50,000,000 1,148,000,000 Fund Energy
Actis Energy 3 - Co-investment vehicle Actis 2013 USD 50,000,000 164,250,000 Fund Energy
Adelis Equity Partners Fund I Adelis Equity Partners 2013 SEK 380,000,000 3,724,100,000 Fund Private Equity
Amber Trust II Danske Capital Finland 2005 EUR 15,000,000 146,700,000 Fund Private Equity
Antin Infrastructure Partners Antin Infrastructure Partners 2008 EUR 50,000,000 1,105,000,000 Fund Infrastructure
Antin Infrastructure Partners Fund II Antin Infrastructure Partners 2013 EUR 75,000,000 2,000,000,000 Fund Infrastructure
Arsenal Capital Partners II Arsenal Capital Partners 2006 USD 20,000,000 500,000,000 Fund Private Equity
Arsenal Capital Partners III Arsenal Capital Partners 2012 USD 75,000,000 875,000,000 Fund Private Equity
Audax Private Equity Fund IV Audax Group 2013 USD 75,000,000 1,250,000,000 Fund Private Equity
Aureos Africa Fund Abraaj Group 2008 USD 30,000,000 381,111,111 Fund Private Equity
Axcel I Axcel 1993 DKK 157,142,857 1,100,000,000 Fund Private Equity
Axcel II Axcel 2001 DKK 188,485,805 2,390,000,000 Fund Private Equity
Axcel III Axcel 2006 DKK 200,000,000 3,016,666,667 Fund Private Equity
Axcel IV Axcel 2011 DKK 250,000,000 3,632,189,874 Fund Private Equity
Axiom Asia Private Capital III Axiom Asia Private Capital 2012 USD 75,000,000 1,161,500,000 FoF - primary Private Equity
Brookfield Brazil Timber Fund I (A) Brookfield Asset Management 2008 USD 22,500,000 280,000,000 Fund Timber
Brookfield Brazil Timber Fund I (B) Brookfield Asset Management 2008 USD 22,500,000 280,000,000 Fund Timber
Campbell Opportunity Timber Fund Campbell Global LLC 2008 USD 40,000,000 1,774,100,000 Fund Timber
Campbell Timber Fund II Campbell Global LLC 2007 USD 31,555,412 405,500,000 Fund Timber
Capricorn Forest Fund IWC (The International Woodland Company A/S) 2007 USD 37,371,015 209,647,000 Fund Timber
Care Capital Investments III Care Capital 2006 USD 30,000,000 300,000,000 Fund Private Equity
Comvest Partners IV Comvest Partners 2010 USD 50,000,000 582,064,000 Fund Private Equity
Comvest Partners V Comvest Partners 2015 USD 75,000,000 N/A Fund Private Equity
Cross Atlantic Partners IV Cross Atlantic Partners 2001 USD 6,000,000 48,101,012 Fund Private Equity
Danish Climate Investment Fund I IFU 2014 DKK 200,000,000 1,290,000,000 Fund Energy
Danish Microfinance Partners Maj Invest 2011 DKK 200,000,000 401,300,000 Fund Private Equity
Dansk Vækstkapital Vækstfonden 2013 DKK 75,000,000 4,786,800,000 FoF - primary Private Equity
Danske PE Partners II EUR Danske Private Equity Partners 2002 EUR 32,633,308 249,875,390 FoF - primary Private Equity
Danske PE Partners II USD Danske Private Equity Partners 2002 USD 29,325,618 224,571,859 FoF - primary Private Equity
Danske PE Partners III EUR Danske Private Equity Partners 2006 EUR 60,200,000 228,989,571 FoF - primary Private Equity
Danske PE Partners III USD Danske Private Equity Partners 2006 USD 73,700,000 270,139,947 FoF - primary Private Equity
Danske PE Partners IV EUR Danske Private Equity Partners 2009 EUR 43,500,000 159,100,000 FoF - primary Private Equity
Danske PE Partners IV USD Danske Private Equity Partners 2009 USD 69,596,300 211,646,300 FoF - primary Private Equity
Danske PE Partners V EUR Danske Private Equity Partners 2012 EUR 50,806,039 216,736,755 FoF - primary Private Equity
Danske PE Partners V USD Danske Private Equity Partners 2012 USD 70,584,332 342,769,384 FoF - primary Private Equity
Drug Royalty Fund III DRI Capital 2013 USD 75,000,000 1,446,195,000 Fund Private Equity
Dunedin Buyout Fund III Dunedin LLP 2013 GBP 35,000,000 306,000,000 Fund Private Equity
Eastern Timberland Resources Timberland Investment Resources LLC 2008 USD 29,338,313 112,854,710 Fund Timber
Edradour BTG Pactual Timberland Merchant Banking 2006 USD 20,450,000 86,800,000 Fund Timber
Energy Capital Partners I Energy Capital Partners 2006 USD 50,000,000 2,250,000,000 Fund Energy
Energy Capital Partners II Energy Capital Partners 2009 USD 75,000,000 4,335,000,000 Fund Energy
EQT VI EQT Partners 2011 EUR 50,000,000 4,815,312,000 Fund Private Equity
European Clean Energy Fund EIG Global Energy 2006 EUR 40,000,000 354,229,500 Fund Energy
Exponent Fund III Exponent Private Equity 2015 GBP 55,000,000 N/A Fund Private Equity
GI Partners Fund IV GI Partners 2014 USD 100,000,000 2,000,000,000 Fund Private Equity
Global Timber Investors VII Global Forest Partners 2004 USD 25,000,000 300,475,000 Fund Timber
39

Fund Manager Vintage Currency PKA commitment Fund size Investment Type Asset class
Global Timber Investors VIII Institutional Investors Global Forest Partners 2007 USD 35,000,000 700,100,000 Fund Timber
Goldman Sachs PEP 2004 Goldman Sachs Private Equity Group (AIMS) 2004 USD 100,000,000 1,186,000,000 FoF - primary Private Equity
Goldman Sachs PEP 2005 Goldman Sachs Private Equity Group (AIMS) 2005 USD 50,000,000 1,474,000,000 FoF - primary Private Equity
GreenGold Equity Fund Romania I GreenGold Asset Management 2008 EUR 25,000,000 53,291,615 Fund Timber
GreenWood Tree Farm Fund GreenWood Resources Inc 2007 USD 36,363,636 210,000,000 Fund Timber
H.I.G. Bioventures II H.I.G. Capital 2012 USD 50,000,000 256,140,119 Fund Private Equity
H.I.G. Middle Market LBO Fund II H.I.G. Capital 2014 USD 70,000,000 1,789,200,000 Fund Private Equity
Hancock Timberland VII Hancock Timber Resource Group 2005 USD 10,000,000 631,920,000 Fund Timber
Hancock Timberland VIII Hancock Timber Resource Group 2006 USD 35,000,000 552,800,000 Fund Timber
Hancock Viking Global Timber Fund Hancock Timber Resource Group 2004 USD 28,799,362 123,701,955 Fund Timber
HGGC Fund II HGGC 2014 USD 125,000,000 1,327,000,000 Fund Private Equity
Highstar Capital III Oaktree Capital Management 2007 USD 100,000,000 1,739,222,222 Fund Infrastructure
Highstar Capital IV Oaktree Capital Management 2011 USD 75,000,000 820,166,680 Fund Infrastructure
IFU Investment Partners IFU 2012 DKK 125,000,000 250,000,000 Fund Private Equity
ISQ Global Fund I Squared Capital 2014 USD 125,000,000 3,000,000,000 Fund Infrastructure
Kohlberg Investors VII Kohlberg & Co. 2012 USD 50,000,000 1,596,849,998 Fund Private Equity
Landmark Equity Partners XIV Landmark Partners 2008 USD 50,000,000 1,997,242,424 FoF - secondary Private Equity
Landmark Equity Partners XV Landmark Partners 2013 USD 50,000,000 3,250,000,000 FoF - secondary Private Equity
Latin American Fund I BTG Pactual Timberland Merchant Banking 2010 USD 11,989,525 99,513,054 Fund Timber
LD Equity 2 Maj Invest 2005 DKK 317,000,000 2,998,650,000 Fund Private Equity
LD Equity 3 Maj Invest 2007 DKK 155,000,000 706,900,000 Fund Private Equity
LD Invest Vietnam Maj Invest 2009 DKK 100,000,000 404,340,000 Fund Private Equity
Lindsay Goldberg III Lindsay Goldberg LLC 2008 USD 70,000,000 4,680,850,000 Fund Private Equity
LS Power Equity Partners II LS Power 2007 USD 45,000,000 3,085,000,000 Fund Energy
Macquarie European Infrastructure II Macquarie Group 2006 EUR 25,000,000 4,634,841,727 Fund Infrastructure
Morgan Stanley Infrastructure Partners Morgan Stanley Infrastructure Partners 2008 USD 178,000,000 4,003,270,000 Fund Infrastructure
New Energy Solutions I New Energy Solutions Partners 2002 DKK 75,000,000 385,500,000 Fund Private Equity
New Energy Solutions II New Energy Solutions Partners 2007 EUR 25,000,000 109,070,000 Fund Private Equity
Odin Equity Partners I Odin Equity Partners 2005 DKK 197,570,349 1,094,191,919 Fund Private Equity
Odin Equity Partners II Odin Equity Partners 2008 DKK 152,429,651 1,416,656,426 Fund Private Equity
Odyssey Investment Partners Fund V Odyssey Investment Partners 2014 USD 50,000,000 2,000,000,000 Fund Private Equity
Panda Power Fund II Panda Power Funds 2013 USD 100,000,000 610,000,000 Fund Energy
Pantheon Global Secondary Fund II Pantheon Ventures 2004 USD 40,000,000 676,900,000 FoF - secondary Private Equity
Partners Group Direct Investments 2006 Partners Group AG 2006 EUR 40,000,000 510,050,000 Fund Private Equity
Partners Group Secondary 2004 Partners Group AG 2004 EUR 35,000,000 428,535,354 FoF - secondary Private Equity
Partners Group Secondary 2006 Partners Group AG 2006 EUR 60,000,000 1,009,910,960 FoF - secondary Private Equity
Partners Group Secondary 2008 Partners Group AG 2007 EUR 50,000,000 2,500,000,000 FoF - secondary Private Equity
PENM I Private Equity New Markets K/S 2007 DKK 297,000,000 423,450,000 Fund Private Equity
PENM II Private Equity New Markets K/S 2008 DKK 247,500,000 689,850,000 Fund Private Equity
PENM III Private Equity New Markets K/S 2012 USD 48,100,000 143,700,000 Fund Private Equity
Pickwick Forest BTG Pactual Timberland Merchant Banking 2005 USD 26,000,000 69,912,609 Fund Timber
Resilience Fund III Resilience Capital Partners 2011 USD 50,000,000 222,500,000 Fund Private Equity
Riverstone Global Energy and Power Fund V Riverstone Holdings LLC 2012 USD 100,000,000 7,713,575,000 Fund Energy
RMK Select Timberland Investment Fund I BTG Pactual Timberland Merchant Banking 2004 USD 20,000,000 164,000,000 Fund Timber
RMK Select Timberland Investment Fund II BTG Pactual Timberland Merchant Banking 2007 USD 30,000,000 162,800,000 Fund Timber
SilverStreet Private Equity Strategies SilverStreet Capital 2010 USD 50,000,000 201,953,100 Fund Agriculture
SK Capital Partners III SK Capital Partners 2011 USD 50,000,000 500,000,000 Fund Private Equity
SLM Australia Livestock SLM Partners 2012 AUD 75,000,000 75,750,000 Fund Agriculture
Aggregate commitment overview
F U N D S ( C O N T I N U E D)
40

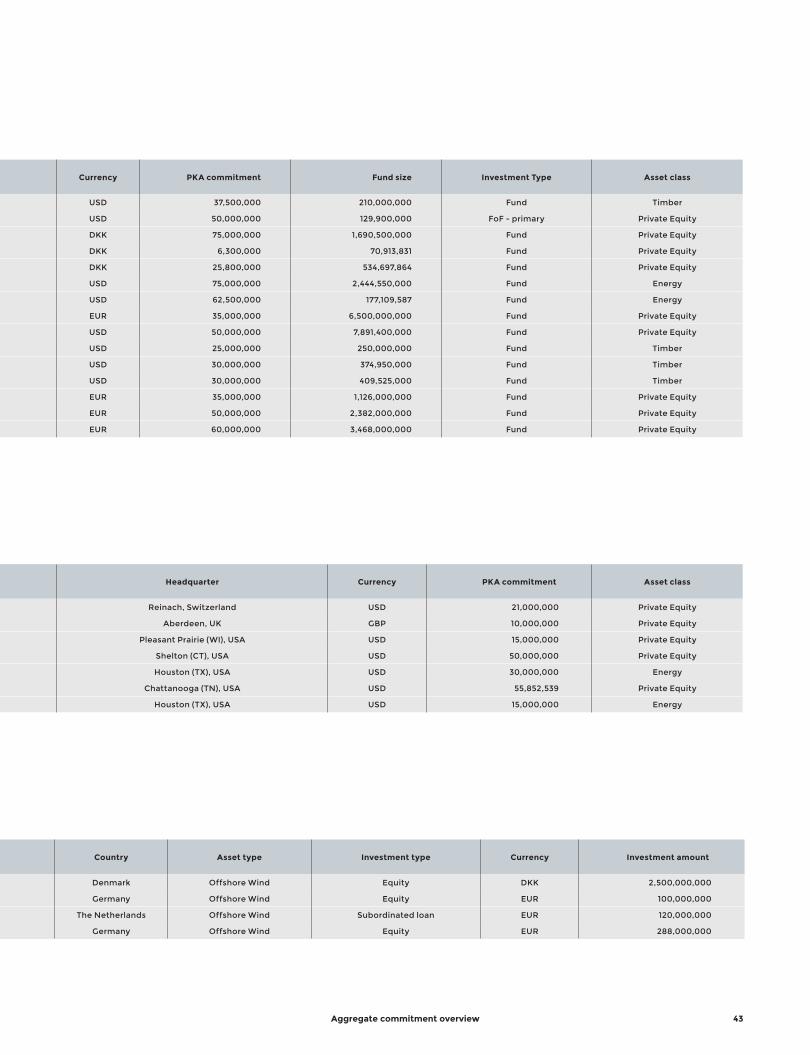
Fund Manager Vintage Currency PKA commitment Fund size Investment Type Asset class
Global Timber Investors VIII Institutional Investors Global Forest Partners 2007 USD 35,000,000 700,100,000 Fund Timber
Goldman Sachs PEP 2004 Goldman Sachs Private Equity Group (AIMS) 2004 USD 100,000,000 1,186,000,000 FoF - primary Private Equity
Goldman Sachs PEP 2005 Goldman Sachs Private Equity Group (AIMS) 2005 USD 50,000,000 1,474,000,000 FoF - primary Private Equity
GreenGold Equity Fund Romania I GreenGold Asset Management 2008 EUR 25,000,000 53,291,615 Fund Timber
GreenWood Tree Farm Fund GreenWood Resources Inc 2007 USD 36,363,636 210,000,000 Fund Timber
H.I.G. Bioventures II H.I.G. Capital 2012 USD 50,000,000 256,140,119 Fund Private Equity
H.I.G. Middle Market LBO Fund II H.I.G. Capital 2014 USD 70,000,000 1,789,200,000 Fund Private Equity
Hancock Timberland VII Hancock Timber Resource Group 2005 USD 10,000,000 631,920,000 Fund Timber
Hancock Timberland VIII Hancock Timber Resource Group 2006 USD 35,000,000 552,800,000 Fund Timber
Hancock Viking Global Timber Fund Hancock Timber Resource Group 2004 USD 28,799,362 123,701,955 Fund Timber
HGGC Fund II HGGC 2014 USD 125,000,000 1,327,000,000 Fund Private Equity
Highstar Capital III Oaktree Capital Management 2007 USD 100,000,000 1,739,222,222 Fund Infrastructure
Highstar Capital IV Oaktree Capital Management 2011 USD 75,000,000 820,166,680 Fund Infrastructure
IFU Investment Partners IFU 2012 DKK 125,000,000 250,000,000 Fund Private Equity
ISQ Global Fund I Squared Capital 2014 USD 125,000,000 3,000,000,000 Fund Infrastructure
Kohlberg Investors VII Kohlberg & Co. 2012 USD 50,000,000 1,596,849,998 Fund Private Equity
Landmark Equity Partners XIV Landmark Partners 2008 USD 50,000,000 1,997,242,424 FoF - secondary Private Equity
Landmark Equity Partners XV Landmark Partners 2013 USD 50,000,000 3,250,000,000 FoF - secondary Private Equity
Latin American Fund I BTG Pactual Timberland Merchant Banking 2010 USD 11,989,525 99,513,054 Fund Timber
LD Equity 2 Maj Invest 2005 DKK 317,000,000 2,998,650,000 Fund Private Equity
LD Equity 3 Maj Invest 2007 DKK 155,000,000 706,900,000 Fund Private Equity
LD Invest Vietnam Maj Invest 2009 DKK 100,000,000 404,340,000 Fund Private Equity
Lindsay Goldberg III Lindsay Goldberg LLC 2008 USD 70,000,000 4,680,850,000 Fund Private Equity
LS Power Equity Partners II LS Power 2007 USD 45,000,000 3,085,000,000 Fund Energy
Macquarie European Infrastructure II Macquarie Group 2006 EUR 25,000,000 4,634,841,727 Fund Infrastructure
Morgan Stanley Infrastructure Partners Morgan Stanley Infrastructure Partners 2008 USD 178,000,000 4,003,270,000 Fund Infrastructure
New Energy Solutions I New Energy Solutions Partners 2002 DKK 75,000,000 385,500,000 Fund Private Equity
New Energy Solutions II New Energy Solutions Partners 2007 EUR 25,000,000 109,070,000 Fund Private Equity
Odin Equity Partners I Odin Equity Partners 2005 DKK 197,570,349 1,094,191,919 Fund Private Equity
Odin Equity Partners II Odin Equity Partners 2008 DKK 152,429,651 1,416,656,426 Fund Private Equity
Odyssey Investment Partners Fund V Odyssey Investment Partners 2014 USD 50,000,000 2,000,000,000 Fund Private Equity
Panda Power Fund II Panda Power Funds 2013 USD 100,000,000 610,000,000 Fund Energy
Pantheon Global Secondary Fund II Pantheon Ventures 2004 USD 40,000,000 676,900,000 FoF - secondary Private Equity
Partners Group Direct Investments 2006 Partners Group AG 2006 EUR 40,000,000 510,050,000 Fund Private Equity
Partners Group Secondary 2004 Partners Group AG 2004 EUR 35,000,000 428,535,354 FoF - secondary Private Equity
Partners Group Secondary 2006 Partners Group AG 2006 EUR 60,000,000 1,009,910,960 FoF - secondary Private Equity
Partners Group Secondary 2008 Partners Group AG 2007 EUR 50,000,000 2,500,000,000 FoF - secondary Private Equity
PENM I Private Equity New Markets K/S 2007 DKK 297,000,000 423,450,000 Fund Private Equity
PENM II Private Equity New Markets K/S 2008 DKK 247,500,000 689,850,000 Fund Private Equity
PENM III Private Equity New Markets K/S 2012 USD 48,100,000 143,700,000 Fund Private Equity
Pickwick Forest BTG Pactual Timberland Merchant Banking 2005 USD 26,000,000 69,912,609 Fund Timber
Resilience Fund III Resilience Capital Partners 2011 USD 50,000,000 222,500,000 Fund Private Equity
Riverstone Global Energy and Power Fund V Riverstone Holdings LLC 2012 USD 100,000,000 7,713,575,000 Fund Energy
RMK Select Timberland Investment Fund I BTG Pactual Timberland Merchant Banking 2004 USD 20,000,000 164,000,000 Fund Timber
RMK Select Timberland Investment Fund II BTG Pactual Timberland Merchant Banking 2007 USD 30,000,000 162,800,000 Fund Timber
SilverStreet Private Equity Strategies SilverStreet Capital 2010 USD 50,000,000 201,953,100 Fund Agriculture
SK Capital Partners III SK Capital Partners 2011 USD 50,000,000 500,000,000 Fund Private Equity
SLM Australia Livestock SLM Partners 2012 AUD 75,000,000 75,750,000 Fund Agriculture
Aggregate commitment overview 41

Fund Manager Vintage Currency PKA commitment Fund size Investment Type Asset class
Southern Cone Timber Holdings BTG Pactual Timberland Merchant Banking 2005 USD 37,500,000 210,000,000 Fund Timber
Spur Ventures III Spur Capital Partners 2008 USD 50,000,000 129,900,000 FoF - primary Private Equity
Sunstone Biomed Venture III SunStone Capital A/S 2001 DKK 75,000,000 1,690,500,000 Fund Private Equity
Sunstone Biomedical Venture Annex II SunStone Capital A/S 2004 DKK 6,300,000 70,913,831 Fund Private Equity
Sunstone Biomedical Venture Annex III SunStone Capital A/S 2004 DKK 25,800,000 534,697,864 Fund Private Equity
Tenaska Power Fund II Tenaska Capital Management LLC 2008 USD 75,000,000 2,444,550,000 Fund Energy
The Energy and Fertilizer Investment Fund K/S Maj Invest 2013 USD 62,500,000 177,109,587 Fund Energy
The Fourth Cinven fund Cinven Partners LLP 2007 EUR 35,000,000 6,500,000,000 Fund Private Equity
Thomas H. Lee Parallel Fund VI Thomas H. Lee Partners 2006 USD 50,000,000 7,891,400,000 Fund Private Equity
Timbervest Crossover Partners II Timbervest 2008 USD 25,000,000 250,000,000 Fund Timber
Timbervest Partners II Timbervest 2007 USD 30,000,000 374,950,000 Fund Timber
Timbervest Partners III Timbervest 2010 USD 30,000,000 409,525,000 Fund Timber
Triton Fund II Triton Partners 2006 EUR 35,000,000 1,126,000,000 Fund Private Equity
Triton Fund III Triton Partners 2009 EUR 50,000,000 2,382,000,000 Fund Private Equity
Triton Fund IV Triton Partners 2013 EUR 60,000,000 3,468,000,000 Fund Private Equity
Aggregate commitment overview
C O - I N V E S T M E N T S
Fund Manager Vintage Headquarter Currency PKA commitment Asset class
Archroma SK Capital 2013 Reinach, Switzerland USD 21,000,000 Private Equity
EV Offshore Ltd. Dunedin LLP 2014 Aberdeen, UK GBP 10,000,000 Private Equity
PPC Industries, Inc. Kohlberg & Company 2014 Pleasant Prairie (WI), USA USD 15,000,000 Private Equity
SSI HGGC 2014 Shelton (CT), USA USD 50,000,000 Private Equity
Star West Generation Highstar Capital 2014 Houston (TX), USA USD 30,000,000 Energy
TractManager Arsenal Capital Partners 2013 Chattanooga (TN), USA USD 55,852,539 Private Equity
UTEX Industries Riverstone 2013 Houston (TX), USA USD 15,000,000 Energy
D I R E C T I N V E S T M E N T S
Direct investment Developer(s)/Operator(s) Investment year Country Asset type Investment type Currency Investment amount
Anholt Offshore Wind Farm DONG Energy 2011 Denmark Offshore Wind Equity DKK 2,500,000,000
Butendiek Offshore Wind Park wpd/Siemens 2012 Germany Offshore Wind Equity EUR 100,000,000
Gemini Northland Power Inc./Siemens 2014 The Netherlands Offshore Wind Subordinated loan EUR 120,000,000
Gode Wind 2 DONG Energy 2014 Germany Offshore Wind Equity EUR 288,000,000
F U N D S ( C O N T I N U E D)
42
Fund Manager Vintage Currency PKA commitment Fund size Investment Type Asset class
Southern Cone Timber Holdings BTG Pactual Timberland Merchant Banking 2005 USD 37,500,000 210,000,000 Fund Timber
Spur Ventures III Spur Capital Partners 2008 USD 50,000,000 129,900,000 FoF - primary Private Equity
Sunstone Biomed Venture III SunStone Capital A/S 2001 DKK 75,000,000 1,690,500,000 Fund Private Equity
Sunstone Biomedical Venture Annex II SunStone Capital A/S 2004 DKK 6,300,000 70,913,831 Fund Private Equity
Sunstone Biomedical Venture Annex III SunStone Capital A/S 2004 DKK 25,800,000 534,697,864 Fund Private Equity
Tenaska Power Fund II Tenaska Capital Management LLC 2008 USD 75,000,000 2,444,550,000 Fund Energy
The Energy and Fertilizer Investment Fund K/S Maj Invest 2013 USD 62,500,000 177,109,587 Fund Energy
The Fourth Cinven fund Cinven Partners LLP 2007 EUR 35,000,000 6,500,000,000 Fund Private Equity
Thomas H. Lee Parallel Fund VI Thomas H. Lee Partners 2006 USD 50,000,000 7,891,400,000 Fund Private Equity
Timbervest Crossover Partners II Timbervest 2008 USD 25,000,000 250,000,000 Fund Timber
Timbervest Partners II Timbervest 2007 USD 30,000,000 374,950,000 Fund Timber
Timbervest Partners III Timbervest 2010 USD 30,000,000 409,525,000 Fund Timber
Triton Fund II Triton Partners 2006 EUR 35,000,000 1,126,000,000 Fund Private Equity
Triton Fund III Triton Partners 2009 EUR 50,000,000 2,382,000,000 Fund Private Equity
Triton Fund IV Triton Partners 2013 EUR 60,000,000 3,468,000,000 Fund Private Equity
Aggregate commitment overview
Fund Manager Vintage Headquarter Currency PKA commitment Asset class
Archroma SK Capital 2013 Reinach, Switzerland USD 21,000,000 Private Equity
EV Offshore Ltd. Dunedin LLP 2014 Aberdeen, UK GBP 10,000,000 Private Equity
PPC Industries, Inc. Kohlberg & Company 2014 Pleasant Prairie (WI), USA USD 15,000,000 Private Equity
SSI HGGC 2014 Shelton (CT), USA USD 50,000,000 Private Equity
Star West Generation Highstar Capital 2014 Houston (TX), USA USD 30,000,000 Energy
TractManager Arsenal Capital Partners 2013 Chattanooga (TN), USA USD 55,852,539 Private Equity
UTEX Industries Riverstone 2013 Houston (TX), USA USD 15,000,000 Energy
Direct investment Developer(s)/Operator(s) Investment year Country Asset type Investment type Currency Investment amount
Anholt Offshore Wind Farm DONG Energy 2011 Denmark Offshore Wind Equity DKK 2,500,000,000
Butendiek Offshore Wind Park wpd/Siemens 2012 Germany Offshore Wind Equity EUR 100,000,000
Gemini Northland Power Inc./Siemens 2014 The Netherlands Offshore Wind Subordinated loan EUR 120,000,000
Gode Wind 2 DONG Energy 2014 Germany Offshore Wind Equity EUR 288,000,000
43
G LO S S A RY
AA L P H A
Expresses the component of a return that cannot
be explained by general market volatility
—
A LT E R N AT I V E I N V E S T M E N T S
Investment in non-listed assets or companies
—
A N C H O R I N V E S TO R
One or more investors driving an investment process and
typically holding most of the investment
BB E TA
Expresses the component of a return that can be
explained by general market volatility
CC O - I N V E S T M E N T
Investment made directly in a business in partnership
with a fund the investor is already invested in
—
C O M M E R C I A L O P E R AT I O N DAT E
( C O D)
Date for full operation of the wind farm where all
wind turbine generators have been commissioned
DD I R E C T I N V E S T M E N T
Investment made directly in an asset
—
D P I
Distributions to paid-in; measure of total
distributions divided by paid-in capital
EE X P O S U R E
Sum of accumulated remaining commitment
and market value
FF O U N DAT I O N
Lowest part of the wind generating structure used to
ground and stabilize the wind turbine generator
—
F U N D - O F - F U N D S
A fund investing in other private funds
—
F U N D C O M M I T M E N T
Obligation to provide capital to future
investments in a fund
Glossary44

II R R
Internal Rate of Return; expresses the average
annual return on a given investment
—
I T D
Investment to date
MM W
Megawatt; measure of the production capacity
of a power generation asset
NN A M E P L AT E C A PA C I T Y
The intended maximum output of an offshore
wind farm; also known as “installed capacity.”
PPA I D - I N C A P I TA L
Capital called against a commitment
to a private fund
—
P I C
Paid-in to commitment; measure of total paid-in
capital divided by total committed capital
—
P M E
Public market equivalent; measure of the return on one
or more listed investments with similar profiles
TT R A C K R E C O R D
A fund’s historical record of investments
and related returns
—
T V P I
Total value to paid-in; measure of current market value
plus sum of distributions divided by paid-in capital
VV I N TA G E Y E A R
The year that a fund receives its initial
infusion of capital
WW I N D T U R B I N E
G E N E R ATO R ( W T G )
Generating unit that converts energy from
wind into electrical power
Glossary 45


PKA AIP A/S · Rosenborggade 1B
DK-1130 Copenhagen · Denmark — pkaaip.dk