PJ MSJ
95
Trademark Trial and Appeal Board Electronic Filing System. http://estta.uspto.gov ESTTA Tracking number: ESTTA263329 Filing date: 01/28/2009 IN THE UNITED STATES PATENT AND TRADEMARK OFFICE BEFORE THE TRADEMARK TRIAL AND APPEAL BOARD Proceeding 91185180 Party Plaintiff Peter H.Johnson Correspondence Address Brennan C. Swain Jeffer Mangels Butler & Marmaro LLP 1900 Avenue of the Stars, 7th Floor Los Angeles, CA 90067 UNITED STATES [email protected] Submission Motion for Summary Judgment Filer's Name Jessica C. Bromall Filer's e-mail [email protected] Signature /jessica c. bromall/ Date 01/28/2009 Attachments Motion for Summary Judgment.pdf ( 94 pages )(3627415 bytes )
-
Upload
frank-herrera -
Category
Documents
-
view
2.560 -
download
2
Transcript of PJ MSJ

Trademark Trial and Appeal Board Electronic Filing System. http://estta.uspto.gov
ESTTA Tracking number: ESTTA263329Filing date: 01/28/2009
IN THE UNITED STATES PATENT AND TRADEMARK OFFICEBEFORE THE TRADEMARK TRIAL AND APPEAL BOARD
Proceeding 91185180
Party PlaintiffPeter H.Johnson
CorrespondenceAddress
Brennan C. SwainJeffer Mangels Butler & Marmaro LLP1900 Avenue of the Stars, 7th FloorLos Angeles, CA 90067UNITED [email protected]
Submission Motion for Summary Judgment
Filer's Name Jessica C. Bromall
Filer's e-mail [email protected]
Signature /jessica c. bromall/
Date 01/28/2009
Attachments Motion for Summary Judgment.pdf ( 94 pages )(3627415 bytes )

5718997v1
IN THE UNITED STATES PATENT AND TRADEMARK OFFICEBEFORE THE TRADEMARK TRIAL AND APPEAL BOARD
TATUAJE CIGARS INC.,
Opposer,
v.
NICARAGUA TOBACCO IMPORTS,INC.,
Applicant.
Opposition No. 91/185,180
Application Serial No.: 77/359,141
Mark: TATTOO
Published for Opposition: May 20, 2008
Atty. Ref. No.: 68692-0003
Commissioner for TrademarksP.O. Box 1451Alexandria, VA 22313-1451
OPPOSER'S MOTION FOR SUMMARY JUDGMENT
Opposer Tatuaje Cigars, Inc. ("Opposer"), through its undersigned counsel,
hereby moves pursuant to Rule 56 of the Federal Rules of Civil Procedure and 37 C.F.R. 2.127
of the Trademark Rules of Practice of entry of summary judgment in its favor and against
applicant Nicaragua Tobacco Imports, Inc. ("Applicant").
MEMORANDUM OF POINTS AND AUTHORITIES
I. INTRODUCTION
Opposer is a well-established and well-respected member of the cigar industry. More
than four years ago, Opposer began building his TATUAJE brand of cigars. In thatshort period
of time, he has gained the respect of the industry and his TUTUAJE brand cigars havebeen
honored as some of the best cigars in the country.
Looking to trade on Opposer's goodwill, Applicant seeks to obtain rights to use the word
"TATTOO", which word is the English equivalent of Opposer's mark TATUAJE, as a trademark
for his own brand of cigars and cigar-related products.

5718997v1
2
Based on the uncontroverted facts set forth below, as a matter of law, Applicant's
proposed trademark TATTOO for cigars and cigar-related accessories isconfusingly similar to
Opposer's trademark TATUAJE, also for cigars and cigar-related accessories. No genuine issue
of material fact exists with respect to this issue.
For this and all the other reasons set forth below, Opposer is entitled to judgment asa
matter of law and Applicant's application should be rejected.
II. STATEMENT OF FACTS
A. Opposer Owns the Trademark TATUAJE
Opposer Tatuaje Cigars, Inc. is in the business of selling cigars and cigar related
accessories throughout the United States. SeeDeclaration of Peter H. Johnson, filed
concurrently herewith ("Johnson Decl.") ¶ 3. Since at least as early as May27, 2003, Opposer
and its predecessor in interest, founder Peter H. Johnson, have used the mark TATUAJEto
identify Opposer's cigars. Id.
Opposer's TATUAJE cigars were first released in 2003. Id.Shortly after being
introduced into the market, Opposer's TATUAJE cigars garnered recognition in the cigar
community. Seeid. at ¶ 4 & Exh. B. After only a year, TATUAJE cigars were recognized as
one of the best cigars of the year byCigar Aficionado magazine. Id.at ¶ 5 & Exh. C.
Committed to excellence, TATUAJE brand cigars have appeared on the top25 list nearly every
year since 2004. Seeid. at ¶ 6 & Exhs. D - F.
Opposer's TATUAJE mark is also the subject of U.S. Trademark Registration
No. 2,836,665, filed on April 27, 2004. Id.at ¶ 2, Exh. A. Opposer's registration is valid and
subsisting. Id.As noted in Opposer's registration, TATUAJE is the Spanish word for "tattoo."
Id.; see alsoDeclaration of Brennan C. Swain ("Swain Decl.") ¶ 2, Exh. H.

5718997v1
3
B. Applicant's Conduct
On December 25, 2007, more than four years after Opposer's TATUAJE brand launched,
Applicant filed intent-to-use application Serial No. 77,359,141 for the mark TATTOOfor use in
connection with cigars, cigarettes, and cigarillos, as well as a variety of cigar-related accessories.
SeeApplication Serial No. 77/359,141.
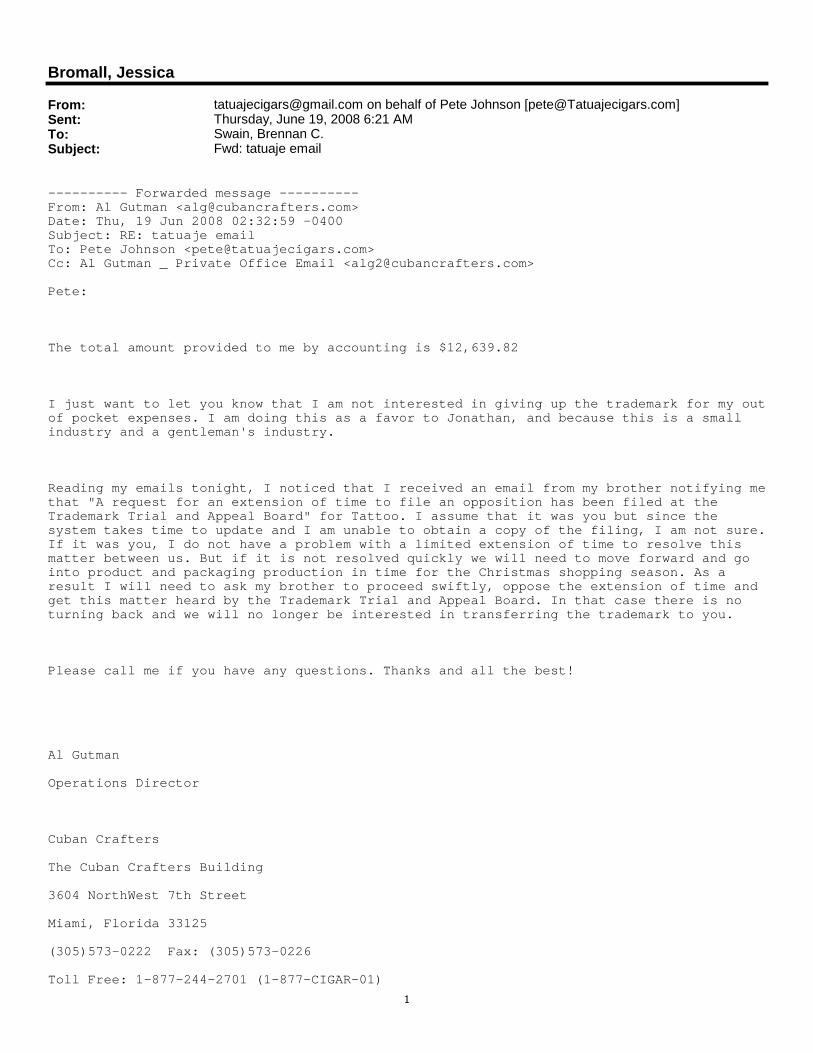
As Applicant acknowledges in its correspondence with Opposer and Opposer's counsel,
the cigar industry "is a small industry and a gentleman's industry." SeeJohnson Decl., ¶ 9,
Exh. I. Accordingly, prior to initiating the instant the proceeding and filing the instant motion,
Opposer and its counsel have made repeated efforts to resolve this dispute informally. When he
became aware of Applicant's application, Mr. Johnson contacted Applicant personally,informed
it of Opposer's rights in the mark TATUAJE, and its English equivalent, TATTOO, and
requested that Applicant withdraw the application. Id.at ¶ 8.
Prior to filing its application for TATTOO, Applicant had constructive knowledgeof
Opposer's rights in the mark TATUAJE and, as a player in the admittedly smallworld that forms
the cigar industry, it is a virtual certainty that Applicant had actual knowledge of Opposer's
rights as well. Further, review of Applicant's website suggests that Applicantis not currently
using the alleged mark "TATTOO", nor is there any evidence that Applicant hasever used the
mark "TATTOO." Seeid. at ¶ 9. Nonetheless, in response to Mr. Johnson's communication,
Applicant refused to withdraw the application unless Opposer paid it more than ten thousand
dollars in compensation. Id.at ¶ 9, Exh. I.
After receiving Applicant's response, Opposer's counsel sent a more formal
communication to Applicant, again outlining Opposer's rights in the mark TATUAJE and its
English equivalent TATTOO, and again requesting that Applicant withdraw its application.

5718997v1
4
Swain Decl., ¶ 3, Exh. J. Again, Applicant refused to withdraw its applicationand Opposer had
not choice but to proceed with the instant Opposition proceeding. Id.
Opposer again attempted to reach an informal resolution prior to filing this motion.
During the discovery conference in this matter, held on Thursday, September 18, 2008,Opposer
advised Applicant of its intent to bring a motion for summary judgment. Id.at ¶ 4, Exh. K. In a
further attempt at resolving this matter without the time or expense of further proceedings, the
parties agreed to exchange cases they would rely one to support their respective positions. See
id. Pursuant to this agreement, on Monday, September 22, 2008, Opposer sent two cases to
Applicant. Id. In contravention of its agreement, Applicant neither provided any cases to
Opposer, nor did it provide any response at all to Opposer's September 22, 2008 email. Id.
Opposer was left with no choice but to proceed with the instant motion.
III. ARGUMENT
A. Summary Judgment Standard
Summary judgment should be granted where the moving party establishes that thereare
no genuine issues of material fact and that he or she is entitled to judgment asa matter of law.
Fed. R. Civ. Pro. 56. Anderson v. Liberty Lobby, Inc., 477 U.S. 242, 247-248 (1986). Upon the
moving party'sprima facie showing of entitlement to summary relief, the non-moving party may
not rest on mere denials or conclusory assertions, but rather must present specific factsshowing a
genuine issue for trial. Celotex Corp. v. Catrett, 477 U.S. 317, 322-23 (1986). In determining
whether there is a genuine issue of material fact which would preclude the grant of summary
judgment, the Board must look to the controlling substantive law. Anderson, 477 U.S. at 248.
Summary judgment is a favored method of adjudicatinginter partes proceedings as the
Board considers it a "salutary method of disposition designed 'to secure the just, speedy and
inexpensive determination of every action.' " Sweats Fashions v. Pannill Knitting Co., 4

5718997v1
5
U.S.P.Q.2d 1793, 1795 (Fed. Cir. 1987) (Court affirmed Board's grant of summary judgment
dismissing opposition because there was no genuine issue of material fact as to likelihood of
confusion); see alsoPure Gold, Inc. v. Suntex (U.S.A.), Inc., 222 U.S.P.Q. 741, 744 (Fed. Cir.
1984) (summary judgment "is to be encouraged ininter partes cases before the Trademark Trial
and Appeal Board").
B. Applicant is Entitled to Summary Judgment on its Claim Under Section 2(d)
In order to prevail upon its Section 2(d) claim, Opposer must establish: 1) that it isthe
owner of valid trademark rights in its TATUAJE Mark; and 2) that Applicant' suse of its
proposed TATTOO mark is likely to cause confusion with Opposer's TATUAJE Mark. E.g.,
Calvin Klein Industries, Inc. v. Calvins Pharmaceuticals, Inc., 8 U.S.P.Q.2d 1269, 1270
(T.T.A.B. 1988). For the reasons set forth below, there are no genuine issues of material fact as
to either element of Opposer's Section 2(d) claim, and judgment should be entered thereon as a
matter of law.
1. Opposer is the Owner of the Trademark TATUAJE
Opposer is the owner of rights in the trademark TATUAJE for use in connection with
cigars (the "TATUAJE Mark"). Trademark rights are created by use of a mark to identify one's
goods. E.g., Sengoku Works Ltd. v. RMC Intern., Ltd., 96 F.3d 1217, 1219 (9th Cir. 1996), as
modified, 97 F.3d 1460 (9th Cir. 1996) ("To acquire ownership of a trademark . . . the party
claiming ownership must have been the first to actually use the mark in the sale of goods or
services."); Hydro-Dynamics, Inc. v. George Putnam & Co., Inc., 811 F.2d 1470, 1473 (Fed. Cir.
1987) (“[T]rademark rights in the United States are acquired by such adoption and use . . . .”).
Opposer, and/or its predecessor in interest, have been using the TATUAJE mark to identify its
cigars since at least as early as May 27, 2005, long prior December 25, 2007, the filingdate of
Applicant's application. SeeJohnson Decl., ¶¶ 3-7, Exhs. B-G.

5718997v1
6
Furthermore, Opposer owns federal trademark registration number 2,836,665, issued on
April 27, 2004, for TATUAJE in connection with cigars in International Class 34 (the " '665
Reg."). Id.at ¶ 2, Exh. A. The '665 Reg. constitutesprima facie evidence of the validity of
Opposer's TATUAJE mark and of Opposer's exclusive right to use the mark on the goods
specified in the registration. 15 U.S.C. §§ 1057(b) & 1115(a).
Opposer's ownership of the TATUAJE Mark is undisputed.
2. Applicant's Use of the Mark TATTOO Is Likely to Cause ConsumerConfusion
In determining whether consumer confusion is likely to result from the registration and
use of a proposed mark, the Board should consider a number of factors including,inter alia, the
similarity of the respective marks, the relatedness of the respective goods, and the marketing
channels and consumers of the respective goods. In re DuPont DeNemours & Co., 476 F.2d
1356, 1361, 177 U.S.P.Q. 563, 567 (C.C.P.A. 1973). Any one of the factors listed maybe
dominant in any given case, depending upon the evidence of record. In re Dixie Restaurants,
Inc., 105 F.3d 1405, 41 U.S.P.Q. 2d 1531, 1533 (Fed. Cir. 1997). In this case, the following
factors are the most relevant: similarity of the marks, similarity of thegoods, and similarity of
trade channels of the goods. In re Dakin’s Miniatures Inc., 59 U.S.P.Q. 2d 1593 (T.T.A.B.
1999); TMEP §§1207.01 et seq.
a. Similarity of the Marks
Perhaps the single most important factor in analyzing likelihood of confusion is the
similarity or dissimilarity of marks at issue. See, e.g., Ford Motor Company v. Summit Motor
Products, Inc., 930 F.2d 277, 293, 18 U.S.P.Q.2d 1417, 1430 (3d Cir.), cert. denied sub nom.,
Altran Corporation v. Ford Motor Company, 502 U.S. 939 (1991). In determining similarity, the
marks at issue must be compared in their entireties, including with respect to sight, sound, and

5718997v1
7
connotation. SeeIn re E.I DuPont DeNemours & Co., 476 F.2d at 1361, 177 U.S.P.Q. at 567.
Similarity as to one element (i.e., sight, sound or connotation) may be sufficient to deem the
marks similar.
i. Marks are Identical in Connotation
Under the doctrine of foreign equivalents, Opposer's mark TATUAJE and Applicant's
mark TATTOO are identicalin connotation.
The doctrine of foreign equivalents provides that "foreign words from common, modern
languages are translated into English to determine similarity of connotation with English words
in a likelihood of confusion analysis." In re La Peregrina Ltd., 86 U.S.P.Q. 2d 1645, 1647
(T.T.A.B. 2008). See alsoD.C. Comics v. Pan American Grain Mfg. Co., 77 U.S.P.Q. 2d 1220,
1225 (T.T.A.B. 2005); Palm Bay Import, Inc. v. Veuve Clicquot Ponsardin Maison Fondee En
1772, 396 F.3d 1369, 73 U.S.P.Q. 2d 1689, 1692 (Fed. Cir. 2005).
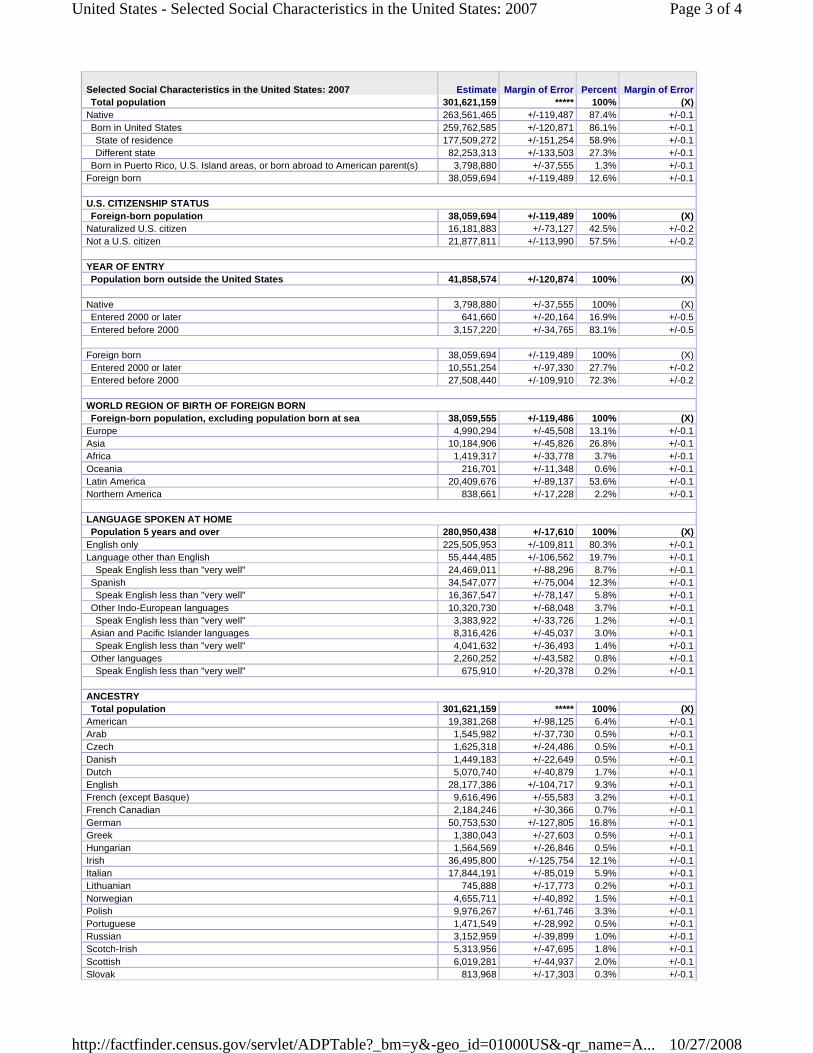
It is indisputable that "tattoo" is the English equivalent of the Spanish word "tatuaje."
Swain Decl. ¶ 2, Exh. H. Opposer submits that Spanish is the most common language inthe
United States after English, with more than 30 million people speaking Spanishas their primary
language. Seeid. at ¶ 5, Exh. L. Furthermore, logic dictates that there are numerous Spanish
speaking people who, although fluent, do not speak Spanish as their primary language,e.g.,
children of Spanish-speaking immigrants. Additionally, Spanish is by far the most widely-taught
non-English language in U.S. secondary schools and institutes of higher education. Seeid. at ¶¶
6-7, Exhs. M-N.
As a result of the foregoing, it is likely that a significant portion of Americanconsumers
would stop and translate Opposer's mark into its English equivalent. In fact, the T.T.A.B. has
recently recognized that the Spanish language is spoken or understood by an appreciable number
of U.S. consumers who also speak or understand English, and that consumers encountering a

5718997v1
8
Spanish word in the market place are likely to translate it. In re La Peregrina, 86 U.S.P.Q. 2d at
1648-1650. Accordingly, the T.T.A.B. concluded that "there is no question that Spanish is a
common, modern language. According to the evidence submitted by the Examining Attorney,
Spanish is the second most common languages in the United States after English, with up to 30
million Spanish-speaking people in this country." Id.at 1648. The T.T.A.B. went on to say that
"it is clear that, by any standard, the Spanish language is spoken or understood by an appreciable
number of U.S. consumers who also speak or understand English." Id.
The translated meaning of TATUAJE is not obscure. It follows that an appreciable
number of U.S. consumers are likely to translate TATUAJE into its English equivalent.
Accordingly, under the doctrine of foreign equivalents, Opposer's mark TATUAJEand
Applicant's mark TATTOO are identical in connotation. This alone is sufficient to support a
finding that the marks are similar.
ii. Marks Are Similar in Sight and Sound
In addition to the fact that the marks are identical in connotation, they are similar in sight
and sound as well. To begin, the first syllables of each mark - "tat" - are identical in both sight
and sound. The second syllables of each mark, are identical in sound. In other words, when
pronounced, Applicant's mark is identical in sound to the first two syllables of Opposer's mark.
In fact, the only difference in the manner in which the two words are pronounced, isthe addition
of the two extra syllables - "a-je" - at the end of Opposer's mark.
3. Similarity of the Goods: Applicant's Goods are Identical to Opposer's
Applicant's and Opposer's goods need not be identical in order to determine that there isa
likelihood of confusion - "the inquiry is whether the goods are related, not identical." The issue
is not whether the goods will be confused with each other, but rather whether the public will be
confused about their source." TMEP 1207.01(a)(i); Safety-Kleen Corp. v. Dresser Indus., Inc.,

5718997v1
9
518 F.2d 1399, 186 U.S.P.Q. 476, 480 (C.C.P.A. 1975). The question is whether "the goods or
services of the applicant and the registrant are so related that the circumstances surrounding their
marketing are such that they are likely to be encountered by the same persons under
circumstances that would give rise to the mistaken belief that they originatefrom the same
source." On-line Careline Inc. v. America Online Inc., 229 F.3d 1080, 56 U.S.P.Q. 2d 1471
(Fed. Cir. 2000).
Here, however, the issue is not that complicated - Applicant's and Opposer's goods are
identical.
Opposer has a federal registration for TATUAJE in connection with cigars in
International Class 34. Applicant also uses the mark TATUAJE in connection withashtrays,
cigar lighters, and cigar cutters. Johnson Decl., ¶ 7, Exh. G.
Applicant proposes to use the mark TATTOO in connection with cigars, cigarettes, and
cigarillos, as well as cigar and cigarette boxes, cigar bands, cigar cases, cigar cutters, cigar
holders, cigar humidifiers, cigar lighters, and cigar tubes. SeeApp. Serial No. 77/359,141.
Many of the goods in connection with which Applicant proposes to use its mark are
identical to Opposer's goods,e.g., cigars, cigar lighters, and cigar cutters. Applicant's remaining
goods are cigar-related accessories, and as such, are clearly related toOpposer's goods.
4. Similarity of Channels of Trade: Channels are Identical
Opposer uses its mark in connection with cigars and cigar-related accessories. Applicant
proposes to use its mark in connection with cigar and cigar-related accessories. As neither
Opposer nor Applicant have placed any limitations with respect to channels of trade, it is proper
to presume that the goods identified in their applications will move in all normalchannels of
trade, and that they will be available to all classes of purchasers. In re JumpDesigns, LLC, 80
U.S.P.Q. 2d 1370, 1374 (T.T.A.B. 2006); TMEP 1207.01(a)(iii). As Applicant's and Opposer's

5718997v1
10
goods are in part identical and in part extremely similar, the presumption leads to the conclusion
that Applicant's and Opposer's goods will be sold in the same channels of trade, in thesame
stores, to the same consumers.
IV. CONCLUSION
For all the foregoing reasons, Opposer's Motion for Summary Judgment against
Applicant should be granted, and Applicant's registration should be refused.
Dated: January 28, 2009 /S/ JESSICA C. BROMALL
Brennan C. SwainRod S. BermanJessica C. BromallJEFFER, MANGELS, BUTLER & M ARMARO LLP1900 Avenue of the Stars, Seventh FloorLos Angeles, CA 90067(310) 203-8080E-mail: [email protected]
Attorneys for Opposer Tatuaje Cigars, Inc.

5811250v1
IN THE UNITED STATES PATENT AND TRADEMARK OFFICEBEFORE THE TRADEMARK TRIAL AND APPEAL BOARD
TATUAJE CIGARS INC.,
Opposer,
v.
NICARAGUA TOBACCO IMPORTS,INC.,
Applicant.
Opposition No. 91/185,180
Application Serial No.: 77/359,141
Mark: TATTOO
Published for Opposition: May 20, 2008
Atty. Ref. No.: 68692-0003
Commissioner for TrademarksP.O. Box 1451Alexandria, VA 22313-1451
DECLARATION OF PETER H. JOHNSON IN SUPPORT OF OPPOSER'S MOTION
FOR SUMMARY JUDGMENT
I, PETER H. JOHNSON, declare as follows:
1. I am the owner of opposer Tatuaje Cigars, Inc. ("Opposer"). I have personal
knowledge of the facts set forth herein and, if called as a witness, could and would competently
testify thereto. I submit this Declaration in support of Opposer's Motion for Summary Judgment.
2. I am the original registrant of U.S. Trademark Reg. 2,836,665 for TATUAJE for
use in connection with cigars in International Class 34 (the "TATUAJE Reg."). On or about
June 25, 2008, I assigned the foregoing registration, as well as the business and goodwill
associated therewith to Opposer. The assignment was recorded with the UnitedStates Patent and
Trademark Office on July 9, 2008. Attached hereto as Exhibit A are two true andcorrect copies
of Opposer's TATUAJE Reg. showing the current status of and title to the registration.
3. Opposer is in the business of selling cigars and cigar related accessories
throughout the United States. I began using the TATUAJE mark to identify my cigars at least as

5811250v1
2
early as May 27, 2003, and I and/or Opposer have been using the mark in connection with cigars
continuously ever since.
4. TATUAJE cigars are hand-made premium cigars made in the Cuban tradition. I
worked hard with my associates to ensure that TATUAJE cigars are of the highest quality. The
first production of TATUAJE cigars was released in 2003. Shortly thereafter,our efforts were
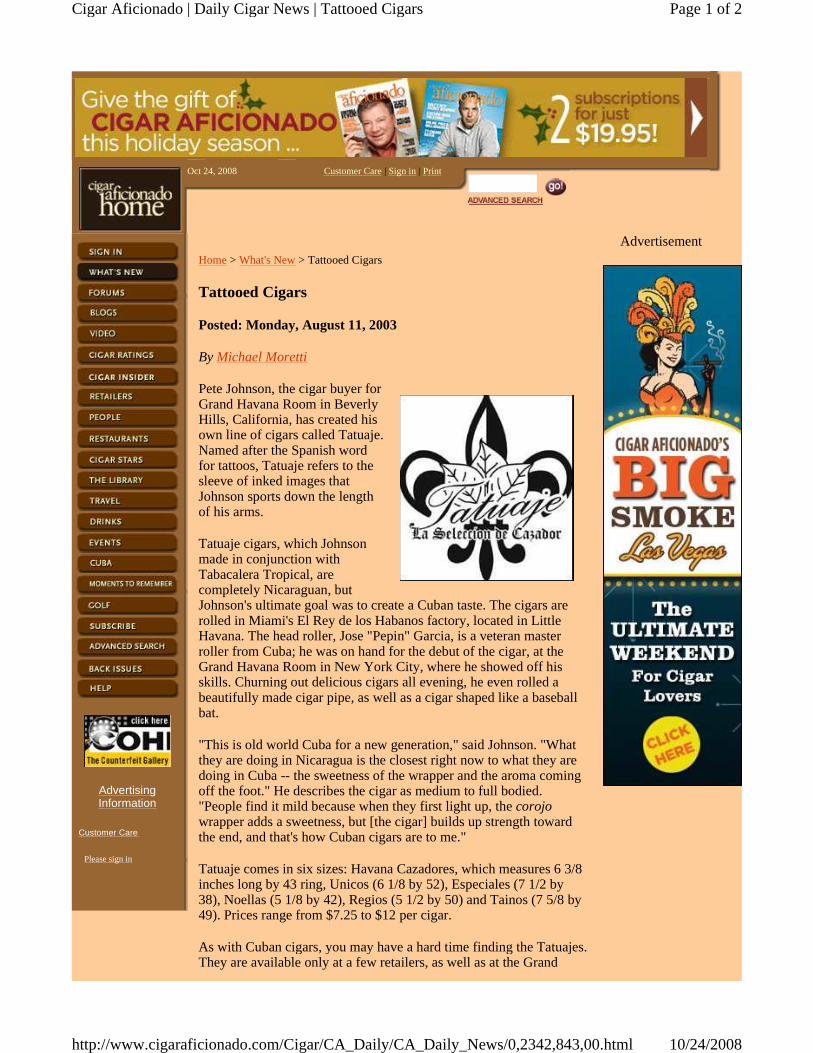
rewarded. Mere months after their release, TATUAJE cigars were recognized by Cigar
Aficionado Magazine. Attached hereto as Exhibit B is a true and correct copyof an article that
was originally posted on cigarafficionado.com on August 11, 2003 and was printed on October
24, 2008.
5. Each year, Cigar Aficionado Magazine selects the 25 best cigars of the year. In
2004, Cigar Aficionado Magazine selected a TATUAJE brand cigar as the 25th best cigar of the
year. Attached hereto as Exhibit C is a true and correct copy of the 2004 Top 25article, which
was printed on October 24, 2008.
6. A TATUAJE brand cigar has appeared on Cigar Aficionado Magazine's Top 25
list numerous times, ranking 4, 9, and 15 in 2005, 2006, and 2007 respectively. Attached hereto
as Exhibits D, E, and F are copies of the Top 25 articles from 2005, 2006, and 2007,
respectively, each of which was printed on October 24, 2008.
7. In addition to cigars, Opposer also uses the TATUAJE mark in connection with
cigar lighters, cigar cutters, ashtrays, as well as a variety of promotional items, including hats
and t-shirts. Attached hereto as Exhibit G is a true and correct copy of an internet print-out
showing goods for sale bearing the TATUAJE mark.
8. TATUAJE is the Spanish word for "tattoo." Accordingly, when I discovered
applicant Nicaragua Tobacco Imports, Inc.'s ("Applicant's") application for registration of

5811249v1
IN THE UNITED STATES PATENT AND TRADEMARK OFFICEBEFORE THE TRADEMARK TRIAL AND APPEAL BOARD
TATUAJE CIGARS INC.,
Opposer,
v.
NICARAGUA TOBACCO IMPORTS,INC.,
Applicant.
Opposition No. 91/185,180
Application Serial No.: 77/359,141
Mark: TATTOO
Published for Opposition: May 20, 2008
Atty. Ref. No.: 68692-0003
Commissioner for TrademarksP.O. Box 1451Alexandria, VA 22313-1451
DECLARATION OF BRENNAN C. SWAIN IN SUPPORT OF OPPOSER'S MOTION
FOR SUMMARY JUDGMENT
I, BRENNAN C. SWAIN, declare as follows:
1. I am an attorney duly licensed to practice law in the state of California.I am an
associate attorney at the law firm of Jeffer, Mangels, Butler & Marmaro LLP ("JMBM"), counsel
of record for opposer Tatuaje Cigars Inc. ("Opposer"). I have personal knowledge of the facts
set forth herein and, if called as a witness, could and would competently testify thereto. I submit
this Declaration in support of Opposer's Motion for Summary Judgment.
2. Attached hereto as Exhibit H, are true and correct copies of print outs from the
internet also showing the English meaning of the Spanish word TATUAJE.
3. Attached hereto as Exhibit J is a true and correct copy of an email I sent to
Applicant on June 23, 2008, requesting that Applicant withdraw the application. Applicant
refused to withdraw the application.


EXHIBIT A


EXHIBIT B
Oct 24, 2008 Customer Care| Sign in| Print
AdvertisingInformation
Customer Care
Please sign in
Home> What's New> Tattooed Cigars
Tattooed Cigars
Posted: Monday, August 11, 2003
By Michael Moretti
Pete Johnson, the cigar buyer forGrand Havana Room in BeverlyHills, California, has created hisown line of cigars called Tatuaje.Named after the Spanish wordfor tattoos, Tatuaje refers to thesleeve of inked images thatJohnson sports down the lengthof his arms.
Tatuaje cigars, which Johnsonmade in conjunction withTabacalera Tropical, arecompletely Nicaraguan, butJohnson's ultimate goal was to create a Cuban taste. The cigars arerolled in Miami's El Rey de los Habanos factory, located in LittleHavana. The head roller, Jose "Pepin" Garcia, is a veteran masterroller from Cuba; he was on hand for the debut of the cigar, at theGrand Havana Room in New York City, where he showed off hisskills. Churning out delicious cigars all evening, he even rolled abeautifully made cigar pipe, as well as a cigar shaped like a baseballbat.
"This is old world Cuba for a new generation," said Johnson. "Whatthey are doing in Nicaragua is the closest right now to what they aredoing in Cuba -- the sweetness of the wrapper and the aroma comingoff the foot." He describes the cigar as medium to full bodied."People find it mild because when they first light up, thecorojowrapper adds a sweetness, but [the cigar] builds up strength towardthe end, and that's how Cuban cigars are to me."
Tatuaje comes in six sizes: Havana Cazadores, which measures 6 3/8inches long by 43 ring, Unicos (6 1/8 by 52), Especiales (7 1/2 by38), Noellas (5 1/8 by 42), Regios (5 1/2 by 50) and Tainos (7 5/8 by49). Prices range from $7.25 to $12 per cigar.
As with Cuban cigars, you may have a hard time finding the Tatuajes.They are available only at a few retailers, as well as at the Grand
Advertisement
Page1 of 2Cigar Aficionado | Daily Cigar News | Tattooed Cigars
10/24/2008http://www.cigaraficionado.com/Cigar/CA_Daily/CA_Daily_News/0,2342,843,00.html

Havana Rooms in New York City and Beverly Hills. This is a"boutique production," said Johnson, "I keep them in small orders sothat they don't rush the production since there are only six rollers."He expects to make about 6,000 cigars for each production and about30,000 cigars a year.
Not that Johnson isn't thinking big. Two limited-edition Tatuaje linesare planned for the future, he said: TheCojonu, or "monsterblend," (6 1/2 by 52, retailing for $13.00), set to hit shelves ina weekand theGran Gener (date and measurements not yet specified).These two lines will be so strong that they "would be a novelty cigarthat just true smokers will smoke," said Johnson. More on that tocome.
Also in Cigar News:
God of Fire Dinner Raises More Than $57,000 for Charity(10/17/2008)Smoking Ban Takes Effect in Atlantic City (10/16/2008)Perdomo Elected to Miami Lakes Council (10/15/2008)Gran Habano Family Part Ways (10/14/2008)Davidoff Acquires Camacho (10/13/2008)Padrón Creates Inexpensive Sampler (10/10/2008)Public Welcome at Fuente Grand Havana Room Dinner inNYC (10/10/2008)D.C. Chef Works With Smoke (10/09/2008)Christie's Auction Features Rare Cubans, Recent Cigars(10/08/2008)
Cigar of the Week:
Hot Tip: Inside the Box-Pressed
Search the 'What's New' Archive
Sign in | What's New | Forums | Cigar Ratings | Retailers | Restaurants | People | Cigar StarsThe Library | Travel | Drinks | The Good Life | Events | Subscribe | Back Issues
Cigar Aficionado RSS FeedCopyright ©2008 CigarAficionado.com
All Rights Reserved.If you're concerned about privacy, click here.
Page2 of 2Cigar Aficionado | Daily Cigar News | Tattooed Cigars
10/24/2008http://www.cigaraficionado.com/Cigar/CA_Daily/CA_Daily_News/0,2342,843,00.html

EXHIBIT C

Oct 24, 2008 Sign in | Print | Site Map
AdvertisingInformation
Please sign in
Home> What's New> Top 25 Home for 2004> No. 25
It's rare to find a cigar made by hand in the United Statesand rarer still to find a great one. Expensive labor and alimited number of trained cigarmakers have caused mostAmerican-based cigarmakers to leave for offshore factoriesor to automate. That's one of the reasons the Tatuaje brandis so interesting. It's a very small brand, made in a smallMiami factory, but the real draw here is the quality of thecigars, made from a rich blend of Nicaraguan tobaccos.These are medium- to full-bodied smokes, made for theseasoned smoker. The Especiales size—7 inches by a slim38 ring—is modeled after Cuba's Cohiba Lancero andTrinidad Fundadore. Good now, these gran panetelas arelikely to become great with age. If only there were more.
MADE BY: El Rey de los Habanos for Pete JohnsonFACTORY LOCATION: United StatesWRAPPER: NicaraguaBINDER: NicaraguaFILLER: NicaraguaPRICE: $9.752004 PRODUCTION: 5,000RATING: 90
NEXT CIGAR > >
2524 23 22 21 20 19 18 17 16 15 14 13 12 11 10 9 8 7 6 54 3 2 1
Top 25 Archives
Advertisement
Sign in | What's New | Forums | Cigar Ratings | Retailers | Restaurants | People | Cigar StarsThe Library | Travel | Drinks | The Good Life | Events | Subscribe | Back Issues
Cigar Aficionado RSS FeedCopyright ©2008 Cigar Aficionado Online
All Rights Reserved.If you're concerned about privacy, click here.
Page1 of 1Cigar Aficionado | Top 25 | 2004
10/24/2008http://www.cigaraficionado.com/Cigar/CA_Top_25/Top_25_Display/0,4320,2004_25,00...

EXHIBIT D

Oct 24, 2008 Sign in| Print | Site Map
AdvertisingInformation
Please sign in
Home> What's New> Top 25 Home for 2005> No. 4
El Rey de los Habanos is easy to miss. The narrow cigarfactory is located on Miami's historic Calle Ocho, or 8thStreet, and it has only about a dozen rolling tables, about 10of which are occupied by Spanish-speaking Cuban rollerswho carefully craft dark cigars with impeccable precision.This is the home of the Tatuaje brand. The factory doesn'tmake many Tatuajes -- the facility is small to begin with, andTatuaje isn't the only brand made here -- but those that arecreated are intensely flavorful, made with three-seam caps inthe style of Cuban cigars and packed with hearty, leatheryNicaraguan leaf that gives them a most Cubanesque flavor.The Taino, a 7 5/8 by 49 cigar, is particularly exceptional,with earthy, spicy flavors and a full body.
MADE BY: El Rey de los Habanos, Havana CellarsFACTORY LOCATION: U.S.A.WRAPPER: NicaraguaBINDER: NicaraguaFILLER: NicaraguaPRICE: $12.002005 PRODUCTION: 7,400RATING: 93
NEXT CIGAR > >
25 24 23 22 21 20 19 18 17 16 15 14 13 12 11 10 9 8 7 6 543 2 1
Top 25 Archives
Advertisement
Sign in | What's New | Forums | Cigar Ratings | Retailers | Restaurants | People | Cigar StarsThe Library | Travel | Drinks | The Good Life | Events | Subscribe | Back Issues
Cigar Aficionado RSS FeedCopyright ©2008 Cigar Aficionado Online
All Rights Reserved.If you're concerned about privacy, click here.
Page1 of 1Cigar Aficionado | Top 25 | 2005
10/24/2008http://www.cigaraficionado.com/Cigar/CA_Top_25/Top_25_Display/0,4320,2005_4,00....

EXHIBIT E

Oct 24, 2008 Sign in | Print | Site Map
AdvertisingInformation
Please sign in
Home> What's New> Top 25 Home for 2006> No. 9
The Tatuaje brand is only two years old, yet it has becomeone of the hottest boutique cigar brands in America. Createdby cigar retailer Pete Johnson, who is known as Tattoo Peteby many in the cigar industry, the brand gets its name fromthe Spanish word for "tattoo" and is carefully crafted frompowerful yet elegant Nicaraguan tobaccos in the tiny El Reyde los Habanos factory in Little Havana. Only about a dozenrollers work at the factory, which makes other brands as well,so there are only about 250,000 Tatuajes made per year.Johnson is now making a less expensive version inNicaragua. The Tatuaje Cabinet Noella, a beautifully madecorona, measures 5 1/8 by 42 ring. It's among the smallest ofTatuajes, but like good, small Cuban cigars this smoke ispacked with flavor. It's rich, spicy and strong, with anunderlying elegance.
MADE BY: El Rey de los Habanos, Havana CellarsFACTORY LOCATION: MiamiWRAPPER: NicaraguaBINDER: NicaraguaFILLER: NicaraguaPRICE: $7.502006 PRODUCTION: 27,525RATING: 92
NEXT CIGAR > >
25 24 23 22 21 20 19 18 17 16 15 14 13 12 11 10 98 7 6 54 3 2 1
Top 25 Archives
Advertisement
Sign in | What's New | Forums | Cigar Ratings | Retailers | Restaurants | People | Cigar StarsThe Library | Travel | Drinks | The Good Life | Events | Subscribe | Back Issues
Cigar Aficionado RSS FeedCopyright ©2008 Cigar Aficionado Online
All Rights Reserved.If you're concerned about privacy, click here.
Page1 of 1Cigar Aficionado | Top 25 | 2006
10/24/2008http://www.cigaraficionado.com/Cigar/CA_Top_25/Top_25_Display/0,4320,2006_9,00....

EXHIBIT F

Oct 24, 2008 Sign in | Print | Site Map
AdvertisingInformation
Please sign in
Home> What's New> Top 25 Home for 2007> No. 15
Sometimes you just need a powerful corona to make yourday right, and it's hard to find a better choice than theTatuaje Havana VI Angeles. This 4 5/8-inch x 42-ring cigar iscrammed with strong black cherry, spice and leather, and thefinish is a mile long. We found it the strongest of the six-sizeHavana VI line, and our favorite of the bunch.
Original Tatuajes, which were made in Miami, are hard tofind, given their limited production. Havana VIs, the "redlabel" versions, are made in Nicaragua and easier to find.They're also cheaper, thanks to the lower cost of labor inNicaragua. As with all Tatuajes, these are made by Jose"Pepin" Garcia.
MADE BY: Tabacalera Cubana S.A.FACTORY LOCATION: NicaraguaWRAPPER: NicaraguaBINDER: NicaraguaFILLER: NicaraguaPRICE: $5.502007 PRODUCTION: 49,000RATING: 92
NEXT CIGAR > >
25 24 23 22 21 20 19 18 17 16 15 14 13 12 11 10 9 8 7 6 54 3 2 1
Top 25 Archives
Advertisement
Sign in | What's New | Forums | Cigar Ratings | Retailers | Restaurants | People | Cigar StarsThe Library | Travel | Drinks | The Good Life | Events | Subscribe | Back Issues
Cigar Aficionado RSS FeedCopyright ©2008 Cigar Aficionado Online
All Rights Reserved.If you're concerned about privacy, click here.
Page1 of 1Cigar Aficionado | Top 25 | 2007
10/24/2008http://www.cigaraficionado.com/Cigar/CA_Top_25/Top_25_Display/0,4320,2007_15,00...

EXHIBIT G

About Us
Shipping / Returns
Humidified Shipping
You are here: Home > SWAG
Show off your favorite brands with SWAG! In popular culture, the term swag now usually
refers to promotional items or gifts that are given away by companies or organizations,
but let's face it - the best things are rarely free! We may from time to time come across
SWAG that is meant to be passed on for free, but these items for sale are specially'branded' accessories that are worth much more than their retail prices!
Sort By: Most Popular
Page of 210 per page 1
Tatuaje Mens T-Shirt
List Price: $25.00
Our Price: $25.00
Tatuaje Mens T-Shirt
Tatuaje Girls T-Shirt
List Price: $20.00
Our Price: $20.00
Tatuaje Girls T-Shirt
Tatuaje Mens Polo Shirt
List Price: $35.00
Our Price: $35.00
Tatuaje Mens Polo Shirt
Tatuaje Girls Tank
List Price: $20.00
Our Price: $20.00
Tatuaje Girls Tank
Tatuaje Girls Booty Shorts
Page1 of 3New Havana Cigars- the Online Humidor
10/27/2008http://www.newhavanacigars.com/SearchResults.asp

List Price: $17.50
Our Price: $17.50
Tatuaje Girls Booty Shorts
Tatuaje Ashtray
List Price: $34.95
Our Price: $34.95 No Longer Available
Limited Edition Tatuaje Ashtray
Tatuaje Table Lighter by Lotus
List Price: $60.00
Our Price: $49.95
You Save $10.05!
Tatuaje Lotus Table Lighter
Tatuaje Fleur Sterling 925 Pin
List Price: $15.00
Our Price: $15.00
Tatuaje Fleur Sterling 925 Pin
The Buzz Cut Cigar Cutter by Tatuaje
List Price: $13.00
Our Price: $12.00
You Save $1.00!
The Buzz Cut Cigar Cutter by Tatuaje
Tatuaje Skull Warmer
List Price: $25.00
Our Price: $25.00
Tatuaje Skull Warmer
Page2 of 3New Havana Cigars- the Online Humidor
10/27/2008http://www.newhavanacigars.com/SearchResults.asp

Special Offer:
Sign up for our Newsletterand receive special
promotions
Join Now
TransactionProcessing
newhavanacigars.com
1183 Chesapeake Ave.
Columbus, OH 43212
614-486-2822
Company Info | Product Index | Category Index | Help | Terms of Use
Copyright © 2008 New Havana Cigars LLC. All Rights Reserved.
Sell Online with Volusion.
About Us Privacy Policy Send Us Feedback Bookmark Us
Page3 of 3New Havana Cigars- the Online Humidor
10/27/2008http://www.newhavanacigars.com/SearchResults.asp

EXHIBIT H

Results for 'tatuaje'
Spanish English
tatuaje tattoo
New search
SpanishLooking for Spanish? Find exactly what you want today.Yahoo.com
Learn SpanishLearn Spanish with professional podcast lessons andonline toolsSpanishPod.com
Turkish ArabicFind more sources/options for Turkish Arabicwww.webcrawler.com
Learn Japanese In 30 daysHow To Learn Japanese In 30 days Learn To SpeakJapanese Languagewww.learn-japanese.com
Page1 of 1Online Dictionary Search Results
12/29/2008http://www.freedict.com/onldict/onldict.php

Contact Help Favorites Tell a friend NewsletterEnglishTranslation Dictionary Conjugation More...
Free dictionary online: English, Spanish, French, Italian, Chinese, German, Russian translations, definitions, synonyms...
tatuaje
Spanish-English
English-Spanish
Other Dictionary
Collaborative dictionary
Spanish Conjugation
English Definitions
English Conjugation
English Synonyms
English for learners
Computer Spanish-English
Reverso Mobile
tatuar
tauca
taumaturgia
taumaturgo
Ads by Google
Free Tattoo DesignsLooking for your perfect Tattoo? View 1000's of Tattoo Designs now.TattooSelector.net
Tattoo ShopsLos Angeles Tattoo Shops & Body Piercing - Safe, Custom Designs.LosAngeles.YellowPages.com
Tattoo pictures200,000+ Shoes. Search Visually. Find Tattoo pictures you Like.www.like.com/shoes/
New user: Sign upExisting user: Login
Collaborative
Dictionary ?
Ads by Google
Everytattoo.comA forum for the tattoo
community
to share tattoos and
ask questions.www.everytattoo.com
Tribal Black TattoosFind more
sources/options for
Tribal Black Tattooswww.webcrawler.com
Tattoo freeLooking for tattoos and
piercings?
We carry a variety of
tools.UnimaxSupply.com
Tattoo Design ParlorAccess Quality Tattoo
Ideas,
Pictures & Tattoo Flash
Designswww.TattooDesignParlor.com
Chinese TattoosMore Bling for Less Ka-
Ching!
Discover Chinese
Tattoos.Shopzilla.com
"Collins Spanish Dictionary 8th edition published in 2005 © William Collins Sons & Co Ltd 1971, 1988 © HarperCollins Publishers 1992, 1993, 1996, 1997, 2000, 2003, 2005"
Contact | Newsletter | News | Company | Conditions of use | Help (?)
Text translation | Web Page Translation | French translation | Spanish translation | Italian translation | German translation | Russian translation | Chinese translation
Reverso Dictionary, Dictionnaire, Diccionario, WörterbuchFrench Dictionary | Spanish Dictionary | German Dictionary | Russian Dictionary | Chinese Dictionary | Italian Dictionary | Portuguese Dictionary | Learn English | English definition | English
Synonym | Medical dictionary French English | Medical dictionary English French | Computer dictionary French English | Computer dictionary English French | Computer dictionary Spanish
English | Computer dictionary English Spanish | Business dictionary French English | Business dictionary English French
Reverso Conjugation, Conjugaison, Conjugación, KonjugationEnglish verb conjugation | French verb conjugation | Spanish verb conjugation | German verb conjugation
Recommended links:Free: Learn English, French and other languages
Reverso offers you access to a spanish translation, definition and synonym dictionary for tatuaje and thousands of other words. You can complete the translation and definition of tatuaje
given by the Spanish - English Collins dictionary by looking at other Spanish dictionaries : Wikipedia, Lexilogos, Maria Moliner, Espasa Calpe, Grijalbo, Larousse, Wordreference, Oxford,
Collins dictionaries ...
Conditions of Use ©2008 Softissimo. All rights reserved.
Search also in:
See also:
Translation Spanish - English Collins Dictionary
tatuaje sm
1 (=dibujo) tattoo
2 (=acto) tattooing
Page1 of 1Translation tatuaje in the Spanish-English Collins dictionary
12/29/2008http://dictionary.reverso.net/spanish-english/tatuaje

Home Dictionary Forums Idioms Grammar Blog Tools Daily Word Help
Copyright © 2003-2007 Tomísimo [Compliant: xhtml css]Domain name from www.GoDaddy.com. Hosted with Dreamhost.
Search for words
in Spanish or English
Searching 63,823 entries
Hit S to go to the searchbox without using your
mouse more
tatuaje
Dictionary Search
Mobile Dictionary
TELL ME MORE - Free 2nd Day Shippping - Spanish language
software.
Tatuaje
Copyright ©2008 by Tomisimo.org. All rights reserved.
Tomisimo Forums
Find related threads on the Spanish and English language forums.
Look up tatuaje on RAE.esLook up tatuaje on MerriamWebster.comLook up tatuaje on Dictionary.com
Spanish English
tatuaje NM tattoo N
tatuáje tattoo
tatuajes tattoos
tatuaje Dictionary Search
Search
Web tomisimo.org
Spanish DictionaryQuickly Find Spanis Translation Service
Providers in Our Directory.
Search... Dictionary
Open in new window
Welcome, Guest • Login • Register
Add dictionary search to Explorer
X
ESPAÑOL
Page1 of 1Tatuaje
12/29/2008http://www.tomisimo.org/dictionary/spanish_english/tatuaje

EXHIBIT I
1
Bromall, Jessica
From: [email protected] on behalf of Pete Johnson [[email protected]]Sent: Thursday, June 19, 2008 6:21 AMTo: Swain, Brennan C.Subject: Fwd: tatuaje email
---------- Forwarded message ----------From: Al Gutman <[email protected]>Date: Thu, 19 Jun 2008 02:32:59 -0400Subject: RE: tatuaje emailTo: Pete Johnson <[email protected]>Cc: Al Gutman _ Private Office Email <[email protected] om>
Pete:
The total amount provided to me by accounting is $12,639.82
I just want to let you know that I am not interested in giving up the trademark for my outof pocket expenses. I am doing this as a favor to Jonathan, and because this is a smallindustry and a gentleman's industry.
Reading my emails tonight, I noticed that I received an email from my brother notifying methat "A request for an extension of time to file an opposition has been filed at theTrademark Trial and Appeal Board" for Tattoo. I assume that i t was you but since thesystem takes time to update and I am unable to obtain a copy of t he filing, I am not sure.If it was you, I do not have a problem with a limited extension o f time to resolve thismatter between us. But if it is not resolved quickly we will ne ed to move forward and gointo product and packaging production in time for the Christ mas shopping season. As aresult I will need to ask my brother to proceed swiftly, oppos e the extension of time andget this matter heard by the Trademark Trial and Appeal Board . In that case there is noturning back and we will no longer be interested in transferr ing the trademark to you.
Please call me if you have any questions. Thanks and all the be st!
Al Gutman
Operations Director
Cuban Crafters
The Cuban Crafters Building
3604 NorthWest 7th Street
Miami, Florida 33125
(305)573-0222 Fax: (305)573-0226
Toll Free: 1-877-244-2701 (1-877-CIGAR-01)

2
www.cubancrafters.com
_____
From: [email protected] [mailto:tatuajecigars@g mail.com] On Behalf Of Pete JohnsonSent: Wednesday, June 18, 2008 7:56 PMTo: [email protected]: tatuaje email
--Pete JohnsonTatuaje Cigars Inc.Los Angeles - Miami - Esteli - Baez
http://www.tatuajecigars.com
--Pete JohnsonTatuaje Cigars Inc.Los Angeles - Miami - Esteli - Baez
http://www.tatuajecigars.com

EXHIBIT J

1
Bromall, Jessica
From: Swain, Brennan C.Sent: Monday, June 23, 2008 4:45 PMTo: [email protected]: Papp, SusanSubject: Your use of the mark TATTOO (68692-0003)
Dear Al:
We represent Tatuaje Cigars, Inc, the owner of U.S. Trademar k Registration No. 2,836,665(to be recorded shortly) for the mark TATUAJE in connection w ith cigars (the "'665registration"). I understand that you have filed a trademar k application for the markTATTOO in connection with cigars and related products. As yo u also likely know, and asstated in the '665 registration, TATUAJE is Spanish for TATT OO. Therefore, our clientalready owns trademark rights in the mark TATTOO and is not in terested in paying you for amark he already has rights in. We believe that the Trademark O ffice erred in allowingyour mark to be published for opposition, and, if you are not w illing to abandon yourapplication immediately, we will move forward with the oppo sition and file for summaryjudgment, which we believe will be granted, as soon as possib le.
Furthermore, you indicated in your e-mail to our client that if this matter was notresolved quickly you would "move forward and go into product and packaging production intime for the Christmas shopping season." We strongly recomm end that you do not do thisand that you obtain legal advice regarding the risks you woul d be taking if you proceed touse the TATTOO mark.
Therefore, we demand that you abandon your trademark applic ation for TATTOO.
Please contact or have your attorney contact me within 5 days to let me know that youagree to this demand.
Please note that this letter does not constitute a complete s tatement of our client'srights, all of which are expressly reserved.
Regards,Brennan Swain_______________________________________
Brennan C. Swain forJMBM | Jeffer, Mangels, Butler & Marmaro LLP 1900 Avenue of th e Stars, 7th Floor LosAngeles, California 90067
(310) 785-5308 Direct(310) 203-0567 [email protected]
This e-mail message and any attachments are confidential an d may be attorney-clientprivileged. Dissemination, distribution or copying of thi s message or attachments withoutproper authorization is strictly prohibited. If you are not the intended recipient,please notify JMBM immediately by telephone or by e-mail, an d permanently delete theoriginal, and destroy all copies, of this message and all att achments. For furtherinformation, please visit JMBM.com.Circular 230 Disclosure: To assure compliance with Treasur y Department rules governing taxpractice, we hereby inform you that any advice contained her ein (including in anyattachment) (1) was not written or intended to be used, and ca nnot be used, by you or anytaxpayer for the purpose of avoiding any penalties that may b e imposed on you or anytaxpayer and (2) may not be used or referred to by you or any oth er person in connectionwith promoting, marketing or recommending to another perso n any transaction or matteraddressed herein.
---------- Forwarded message ----------

2
From: Al Gutman <[email protected]>Date: Thu, 19 Jun 2008 02:32:59 -0400Subject: RE: tatuaje emailTo: Pete Johnson <[email protected]>Cc: Al Gutman _ Private Office Email <[email protected] om>
Pete:
The total amount provided to me by accounting is $12,639.82
I just want to let you know that I am not interested in giving up the trademark for my outof pocket expenses. I am doing this as a favor to Jonathan, and because this is a smallindustry and a gentleman's industry.
Reading my emails tonight, I noticed that I received an email from my brother notifying methat "A request for an extension of time to file an opposition has been filed at theTrademark Trial and Appeal Board" for Tattoo. I assume that i t was you but since thesystem takes time to update and I am unable to obtain a copy of t he filing, I am not sure.If it was you, I do not have a problem with a limited extension o f time to resolve thismatter between us. But if it is not resolved quickly we will ne ed to move forward and gointo product and packaging production in time for the Christ mas shopping season. As aresult I will need to ask my brother to proceed swiftly, oppos e the extension of time andget this matter heard by the Trademark Trial and Appeal Board . In that case there is noturning back and we will no longer be interested in transferr ing the trademark to you.
Please call me if you have any questions. Thanks and all the be st!
Al Gutman
Operations Director
Cuban Crafters
The Cuban Crafters Building
3604 NorthWest 7th Street
Miami, Florida 33125
(305)573-0222 Fax: (305)573-0226
Toll Free: 1-877-244-2701 (1-877-CIGAR-01)
www.cubancrafters.com

EXHIBIT K

1
Bromall, Jessica
From: Swain, Brennan C.Sent: Monday, September 22, 2008 11:34 AMTo: Jose Gutman; Jeff GiuntaCc: Berman, Rod S.; Papp, Susan; Court ServicesSubject: Opposition No. 91185180 (Our Ref. 68692-0003)
Attachments: 20080922093624_BCS.PDF; 20080922093639_BCS.PDF
Gentlemen:
Pursuant to our discussion last Thursday, attached are some of the cases we intend to rely on in our motion for summaryjudgment. In light of these cases, we again request that your application be dismissed immediately with prejudice. Youindicated that, in reply to our submission of cases, you would provide us with the precedent you intend to rely on. If we donot hear from you by Thursday, September 25, 2008 we intend to proceed with the preparation and filing of the motion forsummary judgment. We look forward to receiving by the 25th your reasoning as to why summary judgment isinappropriate and your cases in support thereof. As you will recall, you advised us that you would promptly provide suchreasoning and precedent as you acknowledged that the Board appreciated such exchanges prior to the filing of motions.
Regards,Brennan_______________________________________
Brennan C. Swain forJMBM | Jeffer, Mangels, Butler & Marmaro LLP1900 Avenue of the Stars, 7th FloorLos Angeles, California 90067
(310) 785-5308 Direct(310) 203-0567 [email protected]
This e-mail message and any attachments are confidential and may be attorney-client privileged. Dissemination,distribution or copying of this message or attachments without proper authorization is strictly prohibited. If you are not theintended recipient, please notify JMBM immediately by telephone or by e-mail, and permanently delete the original, anddestroy all copies, of this message and all attachments. For further information, please visit JMBM.com.
Circular 230 Disclosure: To assure compliance with Treasury Department rules governing tax practice, we hereby informyou that any advice contained herein (including in any attachment) (1) was not written or intended to be used, and cannotbe used, by you or any taxpayer for the purpose of avoiding any penalties that may be imposed on you or any taxpayer and(2) may not be used or referred to by you or any other person in connection with promoting, marketing or recommending toanother person any transaction or matter addressed herein.
20080922093624_B
CS.PDF
20080922093639_B
CS.PDF


EXHIBIT L
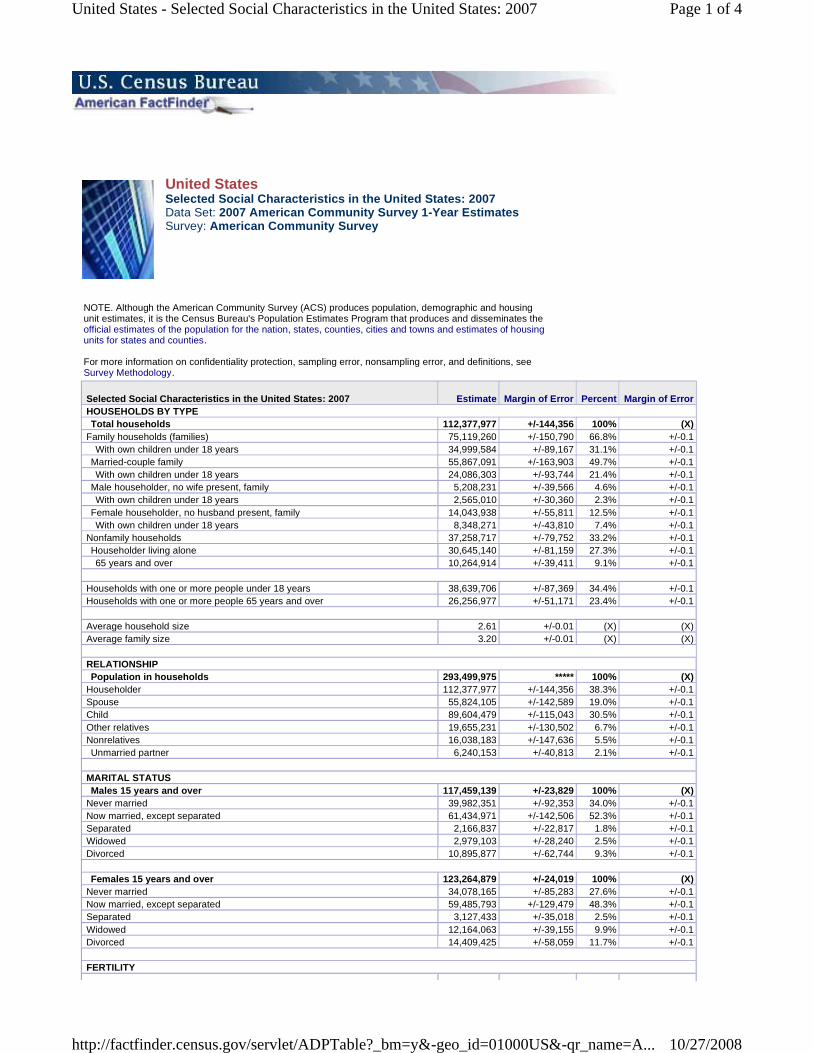
United StatesSelected Social Characteristics in the United States: 2007Data Set: 2007 American Community Survey 1-Year EstimatesSurvey: American Community Survey
NOTE. Although the American Community Survey (ACS) produces population, demographic and housingunit estimates, it is the Census Bureau's Population Estimates Program that produces and disseminates theofficial estimates of the population for the nation, states, counties, cities and towns and estimates of housingunits for states and counties.
For more information on confidentiality protection, sampling error, nonsampling error, and definitions, seeSurvey Methodology.
HOUSEHOLDS BY TYPETotal households 112,377,977 +/-144,356 100% (X)
Family households (families) 75,119,260 +/-150,790 66.8% +/-0.1With own children under 18 years 34,999,584 +/-89,167 31.1% +/-0.1
Married-couple family 55,867,091 +/-163,903 49.7% +/-0.1With own children under 18 years 24,086,303 +/-93,744 21.4% +/-0.1
Male householder, no wife present, family 5,208,231 +/-39,566 4.6% +/-0.1With own children under 18 years 2,565,010 +/-30,360 2.3% +/-0.1
Female householder, no husband present, family 14,043,938 +/-55,811 12.5% +/-0.1With own children under 18 years 8,348,271 +/-43,810 7.4% +/-0.1
Nonfamily households 37,258,717 +/-79,752 33.2% +/-0.1Householder living alone 30,645,140 +/-81,159 27.3% +/-0.165 years and over 10,264,914 +/-39,411 9.1% +/-0.1
Households with one or more people under 18 years 38,639,706 +/-87,369 34.4% +/-0.1Households with one or more people 65 years and over 26,256,977 +/-51,171 23.4% +/-0.1
Average household size 2.61 +/-0.01 (X) (X)Average family size 3.20 +/-0.01 (X) (X)
RELATIONSHIPPopulation in households 293,499,975 ***** 100% (X)
Householder 112,377,977 +/-144,356 38.3% +/-0.1Spouse 55,824,105 +/-142,589 19.0% +/-0.1Child 89,604,479 +/-115,043 30.5% +/-0.1Other relatives 19,655,231 +/-130,502 6.7% +/-0.1Nonrelatives 16,038,183 +/-147,636 5.5% +/-0.1Unmarried partner 6,240,153 +/-40,813 2.1% +/-0.1
MARITAL STATUSMales 15 years and over 117,459,139 +/-23,829 100% (X)
Never married 39,982,351 +/-92,353 34.0% +/-0.1Now married, except separated 61,434,971 +/-142,506 52.3% +/-0.1Separated 2,166,837 +/-22,817 1.8% +/-0.1Widowed 2,979,103 +/-28,240 2.5% +/-0.1Divorced 10,895,877 +/-62,744 9.3% +/-0.1
Females 15 years and over 123,264,879 +/-24,019 100% (X)Never married 34,078,165 +/-85,283 27.6% +/-0.1Now married, except separated 59,485,793 +/-129,479 48.3% +/-0.1Separated 3,127,433 +/-35,018 2.5% +/-0.1Widowed 12,164,063 +/-39,155 9.9% +/-0.1Divorced 14,409,425 +/-58,059 11.7% +/-0.1
FERTILITY
Selected Social Characteristics in the United States: 2007 Estimate Margin of Error Percent Margin of Error
Page1 of 4United States- Selected Social Characteristics in the United States: 2007
10/27/2008http://factfinder.census.gov/servlet/ADPTable?_bm=y&-geo_id=01000US&-qr_name=A...

Number of women 15 to 50 years old who had a birth in the past 12 months 4,183,633 +/-31,097 100% (X)Unmarried women (widowed, divorced, and never married) 1,401,567 +/-23,757 33.5% +/-0.5Per 1,000 unmarried women 36 +/-1 (X) (X)
Per 1,000 women 15 to 50 years old 55 +/-1 (X) (X)Per 1,000 women 15 to 19 years old 27 +/-1 (X) (X)Per 1,000 women 20 to 34 years old 104 +/-1 (X) (X)Per 1,000 women 35 to 50 years old 23 +/-1 (X) (X)
GRANDPARENTSNumber of grandparents living with own grandchildren under 18 years 6,210,076 +/-52,193 100% (X)
Responsible for grandchildren 2,514,256 +/-30,212 40.5% +/-0.3Years responsible for grandchildrenLess than 1 year 574,405 +/-13,261 9.2% +/-0.21 or 2 years 589,611 +/-15,449 9.5% +/-0.23 or 4 years 420,459 +/-11,704 6.8% +/-0.25 or more years 929,781 +/-17,663 15.0% +/-0.3
Characteristics of grandparents responsible for own grandchildren under 18 yearsWho are female 62.9% +/-0.3 (X) (X)Who are married 70.5% +/-0.5 (X) (X)
SCHOOL ENROLLMENTPopulation 3 years and over enrolled in school 79,329,527 +/-74,725 100% (X)
Nursery school, preschool 4,913,688 +/-36,461 6.2% +/-0.1Kindergarten 4,028,537 +/-34,845 5.1% +/-0.1Elementary school (grades 1-8) 32,160,255 +/-47,241 40.5% +/-0.1High school (grades 9-12) 17,433,099 +/-40,626 22.0% +/-0.1College or graduate school 20,793,948 +/-65,104 26.2% +/-0.1
EDUCATIONAL ATTAINMENTPopulation 25 years and over 197,892,369 +/-69,080 100% (X)
Less than 9th grade 12,575,318 +/-60,229 6.4% +/-0.19th to 12th grade, no diploma 18,098,125 +/-76,284 9.1% +/-0.1High school graduate (includes equivalency) 59,658,315 +/-131,598 30.1% +/-0.1Some college, no degree 38,522,312 +/-114,599 19.5% +/-0.1Associate's degree 14,704,788 +/-69,816 7.4% +/-0.1Bachelor's degree 34,364,477 +/-111,059 17.4% +/-0.1Graduate or professional degree 19,969,034 +/-81,430 10.1% +/-0.1
Percent high school graduate or higher 84.5% +/-0.1 (X) (X)Percent bachelor's degree or higher 27.5% +/-0.1 (X) (X)
VETERAN STATUSCivilian population 18 years and over 226,715,104 +/-30,886 100% (X)
Civilian veterans 22,892,086 +/-54,670 100% (X)
DISABILITY STATUS OF THE CIVILIAN NONINSTITUTIONALIZED POPULATIONPopulation 5 years and over 275,748,779 +/-22,633 100% (X)
With a disability 41,199,423 +/-96,260 14.9% +/-0.1
Population 5 to 15 years 44,461,573 +/-43,616 100% (X)With a disability 2,758,236 +/-28,729 6.2% +/-0.1
Population 16 to 64 years 195,020,523 +/-47,423 100% (X)With a disability 23,706,208 +/-72,002 12.2% +/-0.1
Population 65 years and over 36,266,683 +/-18,704 100% (X)With a disability 14,734,979 +/-45,124 40.6% +/-0.1
RESIDENCE 1 YEAR AGOPopulation 1 year and over 297,545,149 +/-27,662 100% (X)
Same house 250,025,832 +/-282,315 84.0% +/-0.1Different house in the U.S. 45,705,642 +/-271,016 15.4% +/-0.1Same county 28,005,700 +/-205,974 9.4% +/-0.1Different county 17,699,942 +/-114,821 5.9% +/-0.1Same state 10,193,075 +/-87,035 3.4% +/-0.1Different state 7,506,867 +/-63,665 2.5% +/-0.1
Abroad 1,813,675 +/-40,239 0.6% +/-0.1
PLACE OF BIRTH
Selected Social Characteristics in the United States: 2007 Estimate Margin of Error Percent Margin of Error
Page2 of 4United States- Selected Social Characteristics in the United States: 2007
10/27/2008http://factfinder.census.gov/servlet/ADPTable?_bm=y&-geo_id=01000US&-qr_name=A...
Total population 301,621,159 ***** 100% (X)Native 263,561,465 +/-119,487 87.4% +/-0.1Born in United States 259,762,585 +/-120,871 86.1% +/-0.1State of residence 177,509,272 +/-151,254 58.9% +/-0.1Different state 82,253,313 +/-133,503 27.3% +/-0.1
Born in Puerto Rico, U.S. Island areas, or born abroad to American parent(s) 3,798,880 +/-37,555 1.3% +/-0.1Foreign born 38,059,694 +/-119,489 12.6% +/-0.1
U.S. CITIZENSHIP STATUSForeign-born population 38,059,694 +/-119,489 100% (X)
Naturalized U.S. citizen 16,181,883 +/-73,127 42.5% +/-0.2Not a U.S. citizen 21,877,811 +/-113,990 57.5% +/-0.2
YEAR OF ENTRYPopulation born outside the United States 41,858,574 +/-120,874 100% (X)
Native 3,798,880 +/-37,555 100% (X)Entered 2000 or later 641,660 +/-20,164 16.9% +/-0.5Entered before 2000 3,157,220 +/-34,765 83.1% +/-0.5
Foreign born 38,059,694 +/-119,489 100% (X)Entered 2000 or later 10,551,254 +/-97,330 27.7% +/-0.2Entered before 2000 27,508,440 +/-109,910 72.3% +/-0.2
WORLD REGION OF BIRTH OF FOREIGN BORNForeign-born population, excluding population born at sea 38,059,555 +/-119,486 100% (X)
Europe 4,990,294 +/-45,508 13.1% +/-0.1Asia 10,184,906 +/-45,826 26.8% +/-0.1Africa 1,419,317 +/-33,778 3.7% +/-0.1Oceania 216,701 +/-11,348 0.6% +/-0.1Latin America 20,409,676 +/-89,137 53.6% +/-0.1Northern America 838,661 +/-17,228 2.2% +/-0.1
LANGUAGE SPOKEN AT HOMEPopulation 5 years and over 280,950,438 +/-17,610 100% (X)
English only 225,505,953 +/-109,811 80.3% +/-0.1Language other than English 55,444,485 +/-106,562 19.7% +/-0.1
Speak English less than "very well" 24,469,011 +/-88,296 8.7% +/-0.1Spanish 34,547,077 +/-75,004 12.3% +/-0.1Speak English less than "very well" 16,367,547 +/-78,147 5.8% +/-0.1
Other Indo-European languages 10,320,730 +/-68,048 3.7% +/-0.1Speak English less than "very well" 3,383,922 +/-33,726 1.2% +/-0.1
Asian and Pacific Islander languages 8,316,426 +/-45,037 3.0% +/-0.1Speak English less than "very well" 4,041,632 +/-36,493 1.4% +/-0.1
Other languages 2,260,252 +/-43,582 0.8% +/-0.1Speak English less than "very well" 675,910 +/-20,378 0.2% +/-0.1
ANCESTRYTotal population 301,621,159 ***** 100% (X)
American 19,381,268 +/-98,125 6.4% +/-0.1Arab 1,545,982 +/-37,730 0.5% +/-0.1Czech 1,625,318 +/-24,486 0.5% +/-0.1Danish 1,449,183 +/-22,649 0.5% +/-0.1Dutch 5,070,740 +/-40,879 1.7% +/-0.1English 28,177,386 +/-104,717 9.3% +/-0.1French (except Basque) 9,616,496 +/-55,583 3.2% +/-0.1French Canadian 2,184,246 +/-30,366 0.7% +/-0.1German 50,753,530 +/-127,805 16.8% +/-0.1Greek 1,380,043 +/-27,603 0.5% +/-0.1Hungarian 1,564,569 +/-26,846 0.5% +/-0.1Irish 36,495,800 +/-125,754 12.1% +/-0.1Italian 17,844,191 +/-85,019 5.9% +/-0.1Lithuanian 745,888 +/-17,773 0.2% +/-0.1Norwegian 4,655,711 +/-40,892 1.5% +/-0.1Polish 9,976,267 +/-61,746 3.3% +/-0.1Portuguese 1,471,549 +/-28,992 0.5% +/-0.1Russian 3,152,959 +/-39,899 1.0% +/-0.1Scotch-Irish 5,313,956 +/-47,695 1.8% +/-0.1Scottish 6,019,281 +/-44,937 2.0% +/-0.1Slovak 813,968 +/-17,303 0.3% +/-0.1
Selected Social Characteristics in the United States: 2007 Estimate Margin of Error Percent Margin of Error
Page3 of 4United States- Selected Social Characteristics in the United States: 2007
10/27/2008http://factfinder.census.gov/servlet/ADPTable?_bm=y&-geo_id=01000US&-qr_name=A...

Subsaharan African 2,702,367 +/-54,820 0.9% +/-0.1Swedish 4,340,436 +/-41,188 1.4% +/-0.1Swiss 1,018,853 +/-20,715 0.3% +/-0.1Ukrainian 970,667 +/-21,898 0.3% +/-0.1Welsh 1,920,993 +/-27,340 0.6% +/-0.1West Indian (excluding Hispanic origin groups) 2,478,797 +/-40,755 0.8% +/-0.1
Selected Social Characteristics in the United States: 2007 Estimate Margin of Error Percent Margin of Error
Source: U.S. Census Bureau, 2007 American Community Survey
Data are based on a sample and are subject to sampling variability. The degree of uncertainty for an estimate arising from sampling variability isrepresented through the use of a margin of error. The value shown here is the 90 percent margin of error. The margin of error can be interpreted roughlyas providing a 90 percent probability that the interval defined by the estimate minus the margin of error and the estimate plus the margin of error (thelower and upper confidence bounds) contains the true value. In addition to sampling variability, the ACS estimates are subject to nonsampling error (for adiscussion of nonsampling variability, see Accuracy of the Data). The effect of nonsampling error is not represented in these tables.
Notes:·Ancestry listed in this table refers to the total number of people who responded with a particular ancestry; for example, the estimate given for Russianrepresents the number of people who listed Russian as either their first or second ancestry. This table lists only the largest ancestry groups; see theDetailed Tables for more categories. Race and Hispanic origin groups are not included in this table because official data for those groups come from theRace and Hispanic origin questions rather than the ancestry question (see Demographic Table).·The Census Bureau introduced a new skip pattern for the disability questions in the 2003 ACS questionnaire. This change mainly affected two individualitems -- go-outside-home disability and employment disability -- and the recode for disability status, which includes the two items. Accordingly,comparisons of data from 2003 or later with data from prior years are not recommended for the relevant questions. For more information, see the ACSSubject Definitions for Disability.·Data for year of entry of the native population reflect the year of entry into the U.S. by people who were born in Puerto Rico, U.S. Island Areas or bornoutside the U.S. to a U.S. citizen parent and who subsequently moved to the U.S.·While the 2007 American Community Survey (ACS) data generally reflect the December 2006 Office of Management and Budget (OMB) definitions ofmetropolitan and micropolitan statistical areas; in certain instances the names, codes, and boundaries of the principal cities shown in ACS tables maydiffer from the OMB definitions due to differences in the effective dates of the geographic entities. The 2007 Puerto Rico Community Survey (PRCS) datagenerally reflect the December 2005 Office of Management and Budget (OMB) definitions of metropolitan and micropolitan statistical areas; in certaininstances the names, codes, and boundaries of the principal cities shown in PRCS tables may differ from the OMB definitions due to differences in theeffective dates of the geographic entities.·Estimates of urban and rural population, housing units, and characteristics reflect boundaries of urban areas defined based on Census 2000 data.Boundaries for urban areas have not been updated since Census 2000. As a result, data for urban and rural areas from the ACS do not necessarilyreflect the results of ongoing urbanization.
Explanation of Symbols:1. An '**' entry in the margin of error column indicates that either no sample observations or too few sample observations were available to compute astandard error and thus the margin of error. A statistical test is not appropriate.2. An '-' entry in the estimate column indicates that either no sample observations or too few sample observations were available to compute an estimate,or a ratio of medians cannot be calculated because one or both of the median estimates falls in the lowest interval or upper interval of an open-endeddistribution.3. An '-' following a median estimate means the median falls in the lowest interval of an open-ended distribution.4. An '+' following a median estimate means the median falls in the upper interval of an open-ended distribution.5. An '***' entry in the margin of error column indicates that the median falls in the lowest interval or upper interval of an open-ended distribution. Astatistical test is not appropriate.6. An '*****' entry in the margin of error column indicates that the estimate is controlled. A statistical test for sampling variability is not appropriate.7. An 'N' entry in the estimate and margin of error columns indicates that data for this geographic area cannot be displayed because the number ofsample cases is too small.8. An '(X)' means that the estimate is not applicable or not available. Selected migration, earnings, and income data are not available for certaingeographic areas due to problems with group quarters data collection and imputation. See Errata Note #44 for details.
The letters PDF or symbol indicate a document is in the Portable Document Format (PDF). To view the file you willneed the Adobe® Acrobat® Reader, which is available for free from the Adobe web site.
Page4 of 4United States- Selected Social Characteristics in the United States: 2007
10/27/2008http://factfinder.census.gov/servlet/ADPTable?_bm=y&-geo_id=01000US&-qr_name=A...

EXHIBIT M

0%2+9%+) 789(= %8 9ò7ò ∋300)+)7 %2( 92−:)67−8−)7
0ΕΡΚΨΕΚΙ ΙΡςΣΠΠΘΙΡΞΩ ςΜΩΙ ïíû ϑςΣΘ îððîå %ςΕΦΜΓô ΨΤ ïîéûôΛΜΞΩ ýïð ΣΡ ΞΛΙ ΘΣΩΞ ΩΞΨΗΜΙΗ ΠΜΩΞå %ΩΜΕΡ ΠΕΡΚΨΕΚΙ ΩΞΨΗ] ΚςΣ[Ω ΩΜΚΡΜϑΜΓΕΡΞΠ]
ø2Ι[ =ΣςΟô 2=÷ óó −ΡΞΙςΙΩΞ ΜΡ ΠΕΡΚΨΕΚΙ ΩΞΨΗ] ΕΞ %ΘΙςΜΓΕΡ ΓΣΠΠΙΚΙΩ ΕΡΗ ΨΡΜΖΙςΩΜΞΜΙΩ ΛΕΩΜΡΓςΙΕΩΙΗ ΦςΣΕΗΠ] ΕΡΗ ΩΜΚΡΜϑΜΓΕΡΞΠ] ΩΜΡΓΙ îððîô ΕΓΓΣςΗΜΡΚ ΞΣ Ε ΓΣΘΤςΙΛΙΡΩΜΖΙ ΡΙ[ΩΨςΖΙ]ô )ΡςΣΠΠΘΙΡΞΩ ΜΡ 0ΕΡΚΨΕΚΙΩ 3ΞΛΙς 8ΛΕΡ )ΡΚΠΜΩΛ ΜΡ 9ΡΜΞΙΗ 7ΞΕΞΙΩ −ΡΩΞΜΞΨΞΜΣΡΩ Σϑ,ΜΚΛΙς )ΗΨΓΕΞΜΣΡô ∗ΕΠΠ îððêô ςΙΠΙΕΩΙΗ ΞΣΗΕ] Φ] ΞΛΙ 1ΣΗΙςΡ 0ΕΡΚΨΕΚΙ %ΩΩΣΓΜΕΞΜΣΡ Σϑ%ΘΙςΜΓΕ ø10%÷ ΕΡΗ ϑΨΡΗΙΗ Φ] ΞΛΙ 9ΡΜΞΙΗ 7ΞΕΞΙΩ (ΙΤΕςΞΘΙΡΞ Σϑ )ΗΨΓΕΞΜΣΡò 8ΛΙ ΩΨςΖΙ]ϑΣΨΡΗ ΩΜΚΡΜϑΜΓΕΡΞ ΜΡΓςΙΕΩΙΩ ΜΡ ΙΡςΣΠΠΘΙΡΞΩ ΜΡ ΡΙΕςΠ] ΕΠΠ Σϑ ΞΛΙ ΘΣΩΞ ΤΣΤΨΠΕς ΠΕΡΚΨΕΚΙΩΩΞΨΗΜΙΗ ΣΡ %ΘΙςΜΓΕΡ ΓΣΠΠΙΚΙ ΓΕΘΤΨΩΙΩò 0ΕΡΚΨΕΚΙ ΙΡςΣΠΠΘΙΡΞΩ ΣΡ 9ΡΜΞΙΗ 7ΞΕΞΙΩΓΕΘΤΨΩΙΩ ΕςΙ ΕΞ ΞΛΙΜς ΛΜΚΛΙΩΞ ΩΜΡΓΙ ΞΛΙ ïçêð 10% ΩΨςΖΙ]ò
−ΡΞΙςΙΩΞ ΜΡ ΠΕΡΚΨΕΚΙ ΩΞΨΗ] ΛΕΩ ΦΙΙΡ ΜΡΓςΙΕΩΜΡΚ ΩΞΙΕΗΜΠ] ΩΜΡΓΙ ïççèò ;ΛΜΠΙ ΞΛΙ ΩΞΨΗ] ΣϑΞΛΙ ΘΣΩΞ ΤΣΤΨΠΕς ΠΕΡΚΨΕΚΙΩô 7ΤΕΡΜΩΛô ∗ςΙΡΓΛô ΕΡΗ +ΙςΘΕΡô ΓΣΡΞΜΡΨΙΩ ΞΣ ΚςΣ[ ΕΡΗΞΣΚΙΞΛΙς ςΙΤςΙΩΙΡΞΩ ΘΣςΙ ΞΛΕΡ éðû Σϑ ΠΕΡΚΨΕΚΙ ΙΡςΣΠΠΘΙΡΞΩô ΞΛΙΜς ΗΣΘΜΡΕΡΓΙ ΜΩ ΩΠΣ[Π]ΗΙΓςΙΕΩΜΡΚ ΜΡ ΞΛΙ ϑΕΓΙ Σϑ ΚςΣ[ΜΡΚ ΜΡΞΙςΙΩΞ ΜΡ ΠΕΡΚΨΕΚΙΩ ΩΨΓΛ ΕΩ %ςΕΦΜΓ øΨΤ ïîéû÷ô∋ΛΜΡΙΩΙ øΨΤ ëïû÷ô ΕΡΗ /ΣςΙΕΡ øΨΤ íéû÷ò )ΡςΣΠΠΘΙΡΞΩ ΜΡ %ΘΙςΜΓΕΡ 7ΜΚΡ 0ΕΡΚΨΕΚΙΜΡΓςΙΕΩΙΗ ΡΙΕςΠ] íðû ϑςΣΘ îððîô ΘΕΟΜΡΚ ΜΞ ΞΛΙ ϑΣΨςΞΛ ΘΣΩΞ ΩΞΨΗΜΙΗ ΠΕΡΚΨΕΚΙ ΣΡ ΓΣΠΠΙΚΙΓΕΘΤΨΩΙΩô ΩΠΜΚΛΞΠ] ΕΛΙΕΗ Σϑ −ΞΕΠΜΕΡò
8ΛΙ ΘΣςΙ ΞΛΕΡ ΗΣΨΦΠΜΡΚ Σϑ %ςΕΦΜΓ ΙΡςΣΠΠΘΙΡΞΩ ΘΣΖΙΗ ΞΛΙ 1ΜΗΗΠΙ )ΕΩΞΙςΡ ΠΕΡΚΨΕΚΙ ΣΡΞΣΞΛΙ ΞΣΤ ïð ΘΣΩΞ ΩΞΨΗΜΙΗ ΠΜΩΞ ϑΣς ΞΛΙ ϑΜςΩΞ ΞΜΘΙò 8ΛΙ ΡΨΘΦΙς Σϑ ΜΡΩΞΜΞΨΞΜΣΡΩ Σϑ ΛΜΚΛΙςΠΙΕςΡΜΡΚ ΣϑϑΙςΜΡΚ %ςΕΦΜΓ ΛΕΩ ΡΙΕςΠ] ΗΣΨΦΠΙΗ ΩΜΡΓΙ ΞΛΙ ΠΕΩΞ ΩΨςΖΙ]ô ϑςΣΘ îêì ΜΡ îððî ΞΣìêê %ςΕΦΜΓ ΤςΣΚςΕΘΩ ΣϑϑΙςΙΗ ΜΡ îððêò
♥8ΛΜΩ ΩΜΚΡΜϑΜΓΕΡΞ ΚςΣ[ΞΛ ΜΡ ΠΕΡΚΨΕΚΙ ΩΞΨΗ]ô ΕΡΗ ΞΛΙ ΗΜΖΙςΩΜΞ] Σϑ ΠΕΡΚΨΕΚΙΩ ΦΙΜΡΚ ΩΞΨΗΜΙΗôΜΩ ΖΙς] ΚΣΣΗ ΡΙ[Ω ϑΣς ΙΗΨΓΕΞΜΣΡ ΜΡ ΞΛΙ 9ΡΜΞΙΗ 7ΞΕΞΙΩô♠ ΩΕΜΗ 6ΣΩΙΘΕς] +ò ∗ΙΕΠô Ι∴ΙΓΨΞΜΖΙΗΜςΙΓΞΣς Σϑ ΞΛΙ 10%ò ♥7ΞΨΗΙΡΞΩ ΜΡΓςΙΕΩΜΡΚΠ] ΩΙΙ ΞΛΙΜς ϑΨΞΨςΙΩ ΞΕΟΜΡΚ ΤΠΕΓΙ ΜΡ ΕΘΨΠΞΜΠΜΡΚΨΕΠ [ΣςΠΗô ΕΡΗ ΞΛΙ] [ΕΡΞ ΠΕΡΚΨΕΚΙ ΤςΙΤΕςΕΞΜΣΡ ΞΣ ΛΙΠΤ ΞΛΙΘ ϑΨΡΓΞΜΣΡ ΜΡ ΞΛΕΞ[ΣςΠΗò 7ΞΨΗΙΡΞΩ ςΙΓΣΚΡΜ⊥Ι ΞΛΕΞ ΛΕΖΜΡΚ ΞΛΙ ΕΦΜΠΜΞ] ΞΣ ϑΨΡΓΞΜΣΡ ΕΓςΣΩΩ ΓΨΠΞΨςΙΩ ΕΡΗΠΕΡΚΨΕΚΙΩ ΜΩ ΕΡ ΙΡΣςΘΣΨΩ ΕΗΖΕΡΞΕΚΙò♠
8ΛΙ ΡΙ[ 10% ΩΨςΖΙ] ΜΡΓΠΨΗΙΩ ΗΕΞΕ ϑςΣΘ îôéçë ΓΣΠΠΙΚΙΩ ΕΡΗ ΨΡΜΖΙςΩΜΞΜΙΩ ΘΙΕΩΨςΜΡΚΙΡςΣΠΠΘΙΡΞΩ ΜΡ ΞΛΙ ΩΞΨΗ] Σϑ îïç ΠΕΡΚΨΕΚΙΩ ΣΞΛΙς ΞΛΕΡ )ΡΚΠΜΩΛô ϑςΣΘ ΞΛΙ ΘΣΩΞ ΤΣΤΨΠΕςôΜΡΓΠΨΗΜΡΚ 7ΤΕΡΜΩΛô ∗ςΙΡΓΛ ΕΡΗ +ΙςΘΕΡô ΞΣ ΠΙΩΩ ΓΣΘΘΣΡΠ] ΩΞΨΗΜΙΗ ΠΕΡΚΨΕΚΙΩ ΩΨΓΛ ΕΩ2ΕΖΕΝΣô ∗ΕςΩΜô ΕΡΗ ;ΙΠΩΛò
1ΣΗΙςΡ 0ΕΡΚΨΕΚΙ %ΩΩΣΓΜΕΞΜΣΡ Σϑ %ΘΙςΜΓΕ îê &ςΣΕΗ[Ε]ô íςΗ ϑΠΣΣς 2Ι[ =ΣςΟô 2= ïðððìóïéèç êìê ëéêóëððð [[[òΘΠΕòΣςΚ
∗Σς −ΘΘΙΗΜΕΞΙ 6ΙΠΙΕΩΙæ 8ΨΙΩΗΕ]ô ïí 2ΣΖΙΘΦΙς îððé
∗Σς ΘΣςΙ ΜΡϑΣςΘΕΞΜΣΡ ΤΠΙΕΩΙ ΓΣΡΞΕΓΞ ΞΛΙ ΣϑϑΜΓΙ ΣϑΞΛΙ 10% Ι∴ΙΓΨΞΜΖΙ ΗΜςΙΓΞΣς ΕΞ êìê ëéêóëïðîò
2); 10% 796:)= 7,3;7 7−+2−∗−∋%28 −2∋6)%7)7 −2 ∗36)−+2

î
+ΠΣΦΕΠ (ΙΖΙΠΣΤΘΙΡΞΩ 1Ε] %ϑϑΙΓΞ 0ΕΡΚΨΕΚΙ ∋ΛΣΜΓΙΩ
8ςΙΡΗΩ ΜΡ ΠΕΡΚΨΕΚΙ ΙΡςΣΠΠΘΙΡΞΩ ΕΤΤΙΕς ΞΣ ΘΜςςΣς ΩΜΚΡΜϑΜΓΕΡΞ ΡΕΞΜΣΡΕΠ ΕΡΗ ΚΠΣΦΕΠΗΙΖΙΠΣΤΘΙΡΞΩô ΜΡΓΠΨΗΜΡΚ ΞΛΙ ςΜΩΙ Σϑ %ΩΜΕΡ ΙΓΣΡΣΘΜΙΩô ΞΛΙ ΩΞΙΕΗ] ΜΡΓςΙΕΩΙ Σϑ 7ΤΕΡΜΩΛóΩΤΙΕΟΜΡΚ ςΙΩΜΗΙΡΞΩ ΜΡ ΞΛΙ 9ΡΜΞΙΗ 7ΞΕΞΙΩô ΕΡΗ ΓΣΡΓΙςΡΩ ΕΦΣΨΞ ΞΛΙ ΚΕΤΩ ΜΡ ΨΡΗΙςΩΞΕΡΗΜΡΚΦΙΞ[ΙΙΡ )ΡΚΠΜΩΛó ΕΡΗ %ςΕΦΜΓóΩΤΙΕΟΜΡΚ ΩΣΓΜΙΞΜΙΩò
∗ςΣΘ îððî ΞΣ îððêô ΞΛΙ ΙΡςΣΠΠΘΙΡΞΩ ΜΡ ïï Σϑ ΞΛΙ ïë ΘΣΩΞ ΤΣΤΨΠΕς ΠΕΡΚΨΕΚΙΩ ΚςΙ[ ϑΕΩΞΙςΞΛΕΡ ΞΛΙ ΣΖΙςΕΠΠ êòîû ΜΡΓςΙΕΩΙ ΜΡ ΞΛΙ ΡΨΘΦΙς Σϑ ΓΣΠΠΙΚΙ ΩΞΨΗΙΡΞΩ ΗΨςΜΡΚ ΞΛΕΞ ΤΙςΜΣΗò8ΛΙ ΘΣΩΞ ΤΣΤΨΠΕς ΠΕΡΚΨΕΚΙΩ ΣΡ ΓΣΠΠΙΚΙ ΓΕΘΤΨΩΙΩ ΜΡ ϑΕΠΠ îððê [ΙςΙæ
0ΕΡΚΨΕΚΙ )ΡςΣΠΠΘΙΡΞΩ û Σϑ %ΠΠ 0ΕΡΚΨΕΚΙ −ΡΓςΙΕΩΙ ΩΜΡΓΙ îððî)ΡςΣΠΠΘΙΡΞΩ
ï÷ 7ΤΕΡΜΩΛ èîîôçèë ëîòîû õ ïðòíûî÷ ∗ςΙΡΓΛ îðêôìîê ïíòïû õ îòîûí÷ +ΙςΘΕΡ çìôîêì êòðû õ íòëûì÷ %ΘΙςΜΓΕΡ 7ΜΚΡ0ΕΡΚΨΕΚΙ éèôèîç ëòðû õ îçòéû
ë÷ −ΞΕΠΜΕΡ éèôíêè ëòðû õ îîòêûê÷ .ΕΤΕΡΙΩΙ êêôêðë ìòîû õ îéòëûé÷ ∋ΛΜΡΙΩΙ ëïôëèî íòíû õ ëïòðûè÷ 0ΕΞΜΡ íîôïçï îòðû õ éòçûç÷ 6ΨΩΩΜΕΡ îìôèìë ïòêû õ íòçûïð÷ %ςΕΦΜΓ îíôçéì ïòëû õïîêòëûïï÷ %ΡΓΜΙΡΞ +ςΙΙΟ îîôèìç ïòìû õ ïîòïûïî÷ &ΜΦΠΜΓΕΠ ,ΙΦςΙ[ ïìôïìð ðòçû ó ðòíûïí÷ 4ΣςΞΨΚΨΙΩΙ ïðôîêé ðòéû õ îîòìûïì÷ 1ΣΗΙςΡ ,ΙΦςΙ[ çôêïî ðòêû õ ïïòëûïë÷ /ΣςΙΕΡ éôïìë ðòëû õ íéòïû
8ΛΙ 10% ΩΨςΖΙ] ΕΠΩΣ ϑΣΨΡΗ Ε íïòîû ΜΡΓςΙΕΩΙ ΜΡ ΞΛΙ ΡΨΘΦΙς Σϑ ΠΕΡΚΨΕΚΙΩ ΣΨΞΩΜΗΙ ΞΛΙΞΣΤ ïë øΟΡΣ[Ρ ΕΩ ΠΙΩΩ ΓΣΘΘΣΡΠ] ΞΕΨΚΛΞ ΠΕΡΚΨΕΚΙΩô Σς 0∋80Ω÷ ΦΙΜΡΚ ΣϑϑΙςΙΗ ϑΣς ΩΞΨΗ]ò8ΛΙΩΙ 0∋80Ω ΜΡΓΠΨΗΙ ΠΕΡΚΨΕΚΙΩ ΩΨΓΛ ΕΩ 7[ΕΛΜΠΜô 4ΙςΩΜΕΡô ,ΜΡΗΜô ΕΡΗ ∋ΕΞΕΠΕΡò % ΞΣΞΕΠ Σϑîðì 0∋80Ω [ΙςΙ ΣϑϑΙςΙΗ ϑΣς ΩΞΨΗ] ΣΡ %ΘΙςΜΓΕΡ ΓΕΘΤΨΩΙΩ ΜΡ îððêô ΨΤ ϑςΣΘ ïêî ΣϑϑΙςΙΗΜΡ îððîò 8ΛΙ ΠΕςΚΙΩΞ ΜΡΓςΙΕΩΙΩ ΜΡ 0∋80Ω [ΙςΙ ϑΣΨΡΗ ΜΡ 1ΜΗΗΠΙ )ΕΩΞΙςΡ ΕΡΗ %ϑςΜΓΕΡΠΕΡΚΨΕΚΙΩô [ΛΙςΙ ΙΡςΣΠΠΘΙΡΞΩ ΚςΙ[ Φ] ëëòçû ΦΙΞ[ΙΙΡ îððî ΕΡΗ îððêò
9ΡΜΞΙΗ 7ΞΕΞΙΩ 0ΕΡΚΨΕΚΙ 7ΞΨΗ] 7ΞΜΠΠ ∗Ες 7ΛΣςΞ Σϑ ,ΜΩΞΣςΜΓ ,ΜΚΛΩ
;ΛΜΠΙ ΜΡΞΙςΙΩΞ ΜΡ ΠΕΡΚΨΕΚΙ ΩΞΨΗ] ΜΩ ΛΜΚΛô ΞΛΙ ΓΨςςΙΡΞ ςΕΞΙ Σϑ èòê ΠΕΡΚΨΕΚΙ ΓΣΨςΩΙΙΡςΣΠΠΘΙΡΞΩ ΤΙς ïðð ΞΣΞΕΠ ΩΞΨΗΙΡΞ ΙΡςΣΠΠΘΙΡΞΩ ΜΩ ΩΞΜΠΠ [ΙΠΠ ΩΛΣςΞ Σϑ ΞΛΙ ïçêë ςΕΞΙ Σϑ ïêòëΠΕΡΚΨΕΚΙ ΓΣΨςΩΙ ΙΡςΣΠΠΘΙΡΞΩ ΤΙς ïðð ΞΣΞΕΠ ΩΞΨΗΙΡΞ ΙΡςΣΠΠΘΙΡΞΩô [ΛΜΓΛ [ΕΩ ΞΛΙ ΛΜΚΛΙΩΞςΕΞΙ ςΙΓΣςΗΙΗ ΜΡ ΞΛΙ ϑΣςΞ]óΙΜΚΛΞ ]ΙΕςΩ ΞΛΕΞ ΞΛΙ 10% ΛΕΩ ΓΣΡΗΨΓΞΙΗ ΞΛΜΩ ΩΨςΖΙ]ò
∗Σς ΞΛΙ ϑΜςΩΞ ΞΜΘΙô ΞΛΙ îððê 10% ΩΨςΖΙ] ΕΠΩΣ ΓΣΘΤΕςΙΗ ΙΡςΣΠΠΘΙΡΞ ϑΜΚΨςΙΩ ϑΣςΜΡΞςΣΗΨΓΞΣς] øϑΜςΩΞó ΕΡΗ ΩΙΓΣΡΗó]ΙΕς÷ ΖΙςΩΨΩ ΕΗΖΕΡΓΙΗ ΠΕΡΚΨΕΚΙ ΩΞΨΗ]ò 7ΞΨΗΙΡΞΩ ΕςΙ

í
ΡΙΕςΠ] ϑΜΖΙ ΞΜΘΙΩ ΘΣςΙ ΠΜΟΙΠ] ΞΣ ΦΙ ΙΡςΣΠΠΙΗ ΜΡ Ε ϑΜςΩΞó Σς ΩΙΓΣΡΗó]ΙΕς ΓΣΨςΩΙ ΞΛΕΡ ΜΡΕΗΖΕΡΓΙΗ ΠΕΡΚΨΕΚΙ ΩΞΨΗ]ò ;ΛΜΠΙ ΜΡΓςΙΕΩΜΡΚ ΡΨΘΦΙςΩ ΕΡΗ ΤςΣΤΣςΞΜΣΡΩ Σϑ ΩΞΨΗΙΡΞΩ ΕςΙΞΕΟΜΡΚ ΜΡΞςΣΗΨΓΞΣς] ΠΕΡΚΨΕΚΙ ΓΠΕΩΩΙΩô ΞΛΙ ΘΕΝΣςΜΞ] ΗΣ ΡΣΞ ΤΨςΩΨΙ ΞΛΙ ΕΗΖΕΡΓΙΗ ΩΞΨΗ]ΡΙΓΙΩΩΕς] ΞΣ ΕΓΛΜΙΖΙ ϑΠΨΙΡΓ]ò
♥;Ι ΕςΙ ΩΞΜΠΠ Ε ΠΣΡΚ [Ε] ϑςΣΘ Ε ΚΣΠΗΙΡ ΕΚΙ Σϑ ΠΕΡΚΨΕΚΙ ΩΞΨΗ]ô [ΛΙΡ ϑΠΨΙΡΓ] ΜΡ ϑΣςΙΜΚΡΠΕΡΚΨΕΚΙΩ ΜΩ ΩΙΙΡ ΕΩ Ε ΟΙ] ΤΕςΞ Σϑ Ε ΓΣΠΠΙΚΙ ΙΗΨΓΕΞΜΣΡô♠ ΡΣΞΙΗ 1ΜΓΛΕΙΠ ,ΣΠΥΨΜΩΞôΤςΙΩΜΗΙΡΞ Σϑ ΞΛΙ 10%ò ♥,ΜΚΛΙς ΙΗΨΓΕΞΜΣΡ ΞΣΗΕ] ΜΩ ΣϑϑΙςΜΡΚ ΩΞΨΗΙΡΞΩ ΘΣςΙ ΕςΙΕΩ Σϑ ΩΞΨΗ]ôΠΜΟΙ ΜΡϑΣςΘΕΞΜΣΡ ΞΙΓΛΡΣΠΣΚ]ò ;Ι ΕςΙ ΙΡΓΣΨςΕΚΙΗ ΞΣ ΩΙΙ ΞΛΕΞ ΜΡ ΞΛΜΩ ΩΞΜΘΨΠΕΞΜΡΚΙΗΨΓΕΞΜΣΡΕΠ ΙΡΖΜςΣΡΘΙΡΞô ΩΞΨΗΙΡΞΩ ΕςΙ ΜΡΓςΙΕΩΜΡΚΠ] ςΙΓΣΚΡΜ⊥ΜΡΚ ΞΛΙ ΜΘΤΣςΞΕΡΓΙ ΣϑΠΕΡΚΨΕΚΙ ΩΞΨΗ]ò♠
1ΙΞΛΣΗΣΠΣΚ]
8ΛΙ ΩΨςΖΙ] ςΙΤΣςΞΩ ΜΡϑΣςΘΕΞΜΣΡ ϑςΣΘ ççòèû øîôéçë÷ Σϑ ΞΛΙ îôèðï ΕΓΓςΙΗΜΞΙΗô ΡΣΞóϑΣςóΤςΣϑΜΞô %%óô &%óô 1%óô ΕΡΗ 4Λ(óΚςΕΡΞΜΡΚ ΓΣΠΠΙΚΙΩ ΕΡΗ ΨΡΜΖΙςΩΜΞΜΙΩ ΜΡ ΞΛΙ 9ΡΜΞΙΗ 7ΞΕΞΙΩΞΛΕΞ ςΙΚΨΠΕςΠ] ΞΙΕΓΛ ΠΕΡΚΨΕΚΙΩò 6ΙΚΜΩΞςΕςΩ ΕΡΗ ΣΞΛΙς ΩΓΛΣΣΠ ςΙΤςΙΩΙΡΞΕΞΜΖΙΩ [ΙςΙΓΣΡΞΕΓΞΙΗ Φ] ΞΛΙ 10% Φ] ΘΕΜΠô ΞΙΠΙΤΛΣΡΙô ΕΡΗ ΙóΘΕΜΠò 8ΛΙ 10% ΗΕΞΕΦΕΩΙ [ΕΩΩΨΤΤΠΙΘΙΡΞΙΗ [ΜΞΛ ΜΡϑΣςΘΕΞΜΣΡ ϑςΣΘ ΞΛΙ 2ΕΞΜΣΡΕΠ ∋ΙΡΞΙς ϑΣς )ΗΨΓΕΞΜΣΡ 7ΞΕΞΜΩΞΜΓΩ ΞΣΙΡΩΨςΙ ΞΛΕΞ ΕΠΠ ΙΠΜΚΜΦΠΙ ΜΡΩΞΜΞΨΞΜΣΡΩ [ΙςΙ ΕΓΓΣΨΡΞΙΗ ϑΣςò 6ΙΩΤΣΡΩΙΩ ΓΕΘΙ ϑςΣΘ çêê Ξ[Σó]ΙΕς ΓΣΠΠΙΚΙΩ ΕΡΗ ïôèîç ϑΣΨςó]ΙΕς ΜΡΩΞΜΞΨΞΜΣΡΩò
8ΛΙ ΩΨςΖΙ] ΘΙΕΩΨςΙΩ ΙΡςΣΠΠΘΙΡΞΩô ΡΣΞ ΞΛΙ ΡΨΘΦΙς Σϑ ΩΞΨΗΙΡΞΩ ΩΞΨΗ]ΜΡΚ Ε ΠΕΡΚΨΕΚΙΣΞΛΙς ΞΛΕΡ )ΡΚΠΜΩΛò 7ΜΡΓΙ ΣΡΙ ΩΞΨΗΙΡΞ ΘΕ] ΙΡςΣΠΠ ΜΡ ΘΣςΙ ΞΛΕΡ ΣΡΙ ΠΕΡΚΨΕΚΙ ΓΣΨςΩΙô ΕΩΜΡΚΠΙ ΩΞΨΗΙΡΞ ΘΕ] ΦΙ ΓΣΨΡΞΙΗ ΘΣςΙ ΞΛΕΡ ΣΡΓΙò 8ΛΙ ςΕΞΜΣ Σϑ ΠΕΡΚΨΕΚΙ ΓΣΨςΩΙΙΡςΣΠΠΘΙΡΞΩ ΞΣ ΞΣΞΕΠ ΩΞΨΗΙΡΞΩ ΜΩô ΛΣ[ΙΖΙςô Ε ϑΜΚΨςΙ ΞΛΕΞô ΣΖΙς ΞΜΘΙô ΓΕΡ ΩΙςΖΙ ΕΩ ΕΡΜΘΤΣςΞΕΡΞ ΜΡΗΜΓΕΞΣς Σϑ ΩΞΨΗΙΡΞ ΜΡΞΙςΙΩΞ ΜΡ ΞΛΙ ΩΞΨΗ] Σϑ ΠΕΡΚΨΕΚΙΩò
%ΦΣΨΞ ΞΛΙ 1ΣΗΙςΡ 0ΕΡΚΨΕΚΙ %ΩΩΣΓΜΕΞΜΣΡ
∗ΣΨΡΗΙΗ ΜΡ ïèèíô ΞΛΙ 1ΣΗΙςΡ 0ΕΡΚΨΕΚΙ %ΩΩΣΓΜΕΞΜΣΡ Σϑ %ΘΙςΜΓΕ ΤςΣΖΜΗΙΩ ΣΤΤΣςΞΨΡΜΞΜΙΩϑΣς ΜΞΩ ΘΙΘΦΙςΩ ΞΣ ΩΛΕςΙ ΞΛΙΜς ΩΓΛΣΠΕςΠ] ϑΜΡΗΜΡΚΩ ΕΡΗ ΞΙΕΓΛΜΡΚ Ι∴ΤΙςΜΙΡΓΙΩ [ΜΞΛΓΣΠΠΙΕΚΨΙΩ ΕΡΗ ΞΣ ΗΜΩΓΨΩΩ ΞςΙΡΗΩ ΜΡ ΞΛΙ ΕΓΕΗΙΘ]ò ∗Σς ΣΖΙς Ε ΛΨΡΗςΙΗ ]ΙΕςΩô ΘΙΘΦΙςΩΛΕΖΙ [ΣςΟΙΗ ΞΣ ΩΞςΙΡΚΞΛΙΡ ΞΛΙ ΩΞΨΗ] ΕΡΗ ΞΙΕΓΛΜΡΚ Σϑ ΠΕΡΚΨΕΚΙ ΕΡΗ ΠΜΞΙςΕΞΨςΙò 10%ΘΙΘΦΙςΩ ΩΨΩΞΕΜΡ ΣΡΙ Σϑ ΞΛΙ ϑΜΡΙΩΞ ΤΨΦΠΜΩΛΜΡΚ ΤςΣΚςΕΘΩ ΜΡ ΞΛΙ ΛΨΘΕΡΜΞΜΙΩò
8ΛΙ 10% 0ΕΡΚΨΕΚΙ 1ΕΤ ø[[[òΘΠΕòΣςΚñΘΕΤΧΘΕΜΡ÷ ΕΡΗ ΜΞΩ (ΕΞΕ ∋ΙΡΞΙς ΤςΣΖΜΗΙΜΡϑΣςΘΕΞΜΣΡ ΕΦΣΨΞ ΘΣςΙ ΞΛΕΡ ìéôðððôððð ΤΙΣΤΠΙ ΜΡ ΞΛΙ 9ΡΜΞΙΗ 7ΞΕΞΙΩ [ΛΣ ΩΤΙΕΟΠΕΡΚΨΕΚΙΩ ΣΞΛΙς ΞΛΕΡ )ΡΚΠΜΩΛ ΕΞ ΛΣΘΙò
8ΛΙ 10% [ΙΙΟΠ] ςΕΗΜΣ ΤςΣΚςΕΘô ;ΛΕΞ←Ω ΞΛΙ ;ΣςΗ#ô ΓΕΡ ΦΙ ΛΙΕςΗ ΣΡ ΘΣςΙ ΞΛΕΡ ïêðςΕΗΜΣ ΩΞΕΞΜΣΡΩ ΕΓςΣΩΩ ΞΛΙ 9ΡΜΞΙΗ 7ΞΕΞΙΩò 8ΛΙ îððé 10% %ΡΡΨΕΠ ∋ΣΡΖΙΡΞΜΣΡ [ΜΠΠ ΦΙ ΛΙΠΗΜΡ ∋ΛΜΓΕΚΣô îé♣íð (ΙΓΙΘΦΙςò
∗Σς ΘΣςΙ ΜΡϑΣςΘΕΞΜΣΡ ΕΦΣΨΞ ΞΛΙ 10%ô ΤΠΙΕΩΙ ΖΜΩΜΞ ΣΨς ;ΙΦ ΩΜΞΙ ø[[[òΘΠΕòΣςΚ÷ò
ý ý ý

EXHIBIT N

IN SEPTEMBER 2003 the MLA finished compiling
the figures from its fall 2002 survey of foreign lan-
guage enrollments in United States institutions of
higher education. This latest survey is the twentieth
in a series conducted since 1958 with the support of
grants from the United States Department of Educa-
tion (or from its predecessor, the United States Office
of Education). The following report presents fall 2002
enrollments for individual languages and examines
trends through time.
Using procedures developed for previous surveys,
the MLA sent a questionnaire to the registrars of
2,781 two- and four-year institutions, soliciting infor-
mation on credit-bearing enrollments for fall 2002 in
all language courses other than English. Although
the instructions on the questionnaire made it clear
that the survey was seeking information on all lan-
guage courses offered on the campuses of these insti-
tutions, the MLA has no way of knowing whether
the registrars in all cases provided complete informa-
tion. The questionnaire was not mailed until mid-
October 2002, to ensure that the figures provided
would be final (or nearly so) rather than preliminary.
A second mailing was sent in early December, a third
in mid-February 2003, and a series of follow-up tele-
phone calls was begun in April.
All but 12 of the institutions receiving the initial
survey mailing, or 99.6%, eventually responded—the
highest response rate in the history of the MLA’s enroll-
ment surveys. Among the 2,769 respondents, 2,519, or
91.0%, reported having fall 2002 enrollments in at least
one language other than English. Of the responses,
1,068, or 38.6%, are from two-year colleges, and 1,701
are from four-year institutions. No language courses
other than English were offered by 7.6% of the four-
year institutions and 11.3% of the two-year colleges.
This year for the first time, survey participants
were able to respond on the World Wide Web us-
ing an interface designed for the collection of the
survey data. Of the responses monitored and en-
tered into our database, 28.7% were made on the
Web site, 50.9% were made on a return postcard,
and 20.4% were made in follow-up phone calls.
The Web site was designed to tell us whether en-
rollments had been previously reported for an insti-
tution and for what specific languages. This feature
helped make the survey more accurate, ensuring a
higher level of consistency in the data reported by
the participating institutions, whose particular indi-
vidual respondents change from survey to survey.
The user-friendly design of the Web interface also
made it easier for the MLA survey administrator
to keep track of additional information about lan-
guage offerings. It instantly displayed comparisons
between the numbers of programs offered in 1998
and those being reported for 2002. This display led
to follow-up questions about the addition and sub-
traction of specific language offerings and about
the reasons for those changes. For example, we
asked institutions that reported enrollments in a
specific language in 1998 but not in 2002 whether
the language was still listed in the catalog; those
that had enrollments in a language in 2002 but not
in 1998 were asked if they were reporting about a
new program.
Foreign Language Enrollmentsin United States Institutions ofHigher Education, Fall 2002
Elizabeth B. Welles
ADFL Bulletin, Vol. 35, Nos. 2–3, Winter-Spring 2004
© 2004 by the association of departments of foreign languages
The author is former Director of Foreign Language Programs
and ADFL at the Modern Language Association.

8 • Foreign Language Enrollments in United States Institutions of Higher Education, Fall 2002
Fall 2002 Enrollments
Tables 1a and 1b compare the fall 2002 enroll-
ments in the fifteen most commonly taught lan-
guages with those in 1998, the year of the most
recent previous survey. In table 1a, the languages are
listed in descending order of fall 2002 enrollment
totals; in table 1b they are listed alphabetically. The
tables also show an aggregate count for the 147
other languages for which enrollment data were
reported in 2002. Enrollments for those other lan-
guages appear in table 8. As tables 1a and 1b show,
the total of foreign language enrollments for 2002
exceeded that for 1998 by 17.0%. It is the highest
total recorded since the beginning of the MLA sur-
veys (see fig. 1).
The list of the fifteen more commonly taught lan-
guages shows clear groupings: Spanish is far ahead;
then come French and German; then Italian, Amer-
ican Sign Language (ASL), and Japanese; then
Chinese, Latin, Russian, and ancient Greek; then
biblical Hebrew, Arabic, Modern Hebrew, Portu-
guese, and Korean. For the first time since 1968, all
show increases in enrollments. ASL’s increase at
432.2% is more than four times that of any other
language. Next is Arabic at 92.3%; biblical Hebrew
at 55.9%; Italian at 29.6%; Japanese, Chinese, an-
cient Greek, Modern Hebrew, and Portuguese at
between 20% and 30%; and Spanish, Latin, and Ko-
rean at between 10% and 17%. French, German,
and Russian showed an increase under 3% and thus
can be said to have had stable enrollments from
1998 to 2002.
Foreign Language Enrollments by Undergraduates
in Two- and Four-Year Colleges and by Graduates
in Universities
Tables 2a and 2b show enrollments of undergradu-
ate and graduate students; two-year and four-year
institutions further define the undergraduate popula-
tion. Undergraduate enrollments at four-year institu-
tions, which had declined 6.2% from 1990 to 1995,
rose 4.6% in 1998 and rose another 11.8% in 2002;
they are now 9.8% more than the previous high in
1990. Graduate enrollments declined 15.2% from
1995 to 1998 but increased 11.9% from 1998 to 2002.
They have fluctuated in a range of 5,000 students
since 1983 and have not yet returned to the high of
1974 (see table 2c).
Foreign language enrollments in two-year colleges
underwent a growth spurt of 40.2% between 1986
and 1990 and have risen continuously since: 3.6% in
1995, 8.8% in 1998, and 36.0% in 2002. The student
population in two-year colleges increased 12.0% from
1986 to 1990 and 4.8% between 1990 and 1995, de-
creased 0.1% between 1995 and 1998, and increased
8.6% between 1998 and 2002.1 Of the 1,068 two-year
colleges included in our survey, 947 reported enroll-
ments in 2002 (37.6% of all institutions), accounting
for 45.6% of the total growth for all enrollments re-
gardless of level or institution type. From 1998 to
2002, Spanish increased 22.9%, almost twice the in-
crease in Spanish for the total survey. Spanish now
represents 63.0% of all two-year college language en-
rollments, a drop from 1998 when it represented
69.7%. Community college enrollments in ASL,
which accounted for 78.9% of the overall ASL total
in 1995 and 61.3% in 1998, increased by 457.6% be-
tween 1998 and 2002 and now represent 64.2% of the
overall ASL total.
Tables 3a and 3b show the regional distribution of
language study in the United States. Whereas total
enrollments and four-year and graduate enrollments
are highest in the Northeast, Midwest, and South
Atlantic regions, two-year college enrollments are
overwhelmingly on the Pacific Coast. Appendix A
shows sixteen languages and their enrollments by
region. The study of Italian and Hebrew resides pri-
marily in the Northeast. The study of the Asian lan-
guages Chinese, Japanese, Korean, and Vietnamese
takes place primarily on the Pacific Coast. The study
of Spanish is fairly evenly distributed nationally,
with slightly higher concentrations found in the Mid-
west and South Atlantic. Arabic is also very evenly
distributed, with an enrollment concentration of
about 21% in the four most populated regions of the
United States.

Elizabeth B. Welles • 9
Table 1a
Fall 1998 and 2002 Foreign Language Enrollments
in United States Institutions of Higher Education
(Languages in Descending Order of 2002 Totals)
Percentage
Language 1998 2002 Change
Spanish 656,590 746,267 13.7
French 199,064 201,979 1.5
German 89,020 91,100 2.3
Italian 49,287 63,899 29.6
American Sign
Language 11,420 60,781 432.2
Japanese 43,141 52,238 21.1
Chinese 28,456 34,153 20.0
Latin 26,145 29,841 14.1
Russian 23,791 23,921 0.5
Ancient Greek 16,402 20,376 24.2
Biblical Hebrew 9,099 14,183 55.9
Arabic 5,505 10,584 92.3
Modern Hebrew 6,734 8,619 28.0
Portuguese 6,926 8,385 21.1
Korean 4,479 5,211 16.3
Other languages 17,771 25,716 44.7
Total 1,193,830 1,397,253 17.0
Table 1b
Fall 1998 and 2002 Foreign Language Enrollments
in United States Institutions of Higher Education
(Languages in Alphabetical Order)
Percentage
Language 1998 2002 Change
American Sign
Language 11,420 60,781 432.2
Arabic 5,505 10,584 92.3
Chinese 28,456 34,153 20.0
French 199,064 201,979 1.5
German 89,020 91,100 2.3
Ancient Greek 16,402 20,376 24.2
Biblical Hebrew 9,099 14,183 55.9
Modern Hebrew 6,734 8,619 28.0
Italian 49,287 63,899 29.6
Japanese 43,141 52,238 21.1
Korean 4,479 5,211 16.3
Latin 26,145 29,841 14.1
Portuguese 6,926 8,385 21.1
Russian 23,791 23,921 0.5
Spanish 656,590 746,267 13.7
Other languages 17,771 25,716 44.7
Total 1,193,830 1,397,253 17.0
Figure 1
Foreign Language Enrollments by Year, Excluding Latin and Ancient Greek
1,400,000
1,300,000
1,200,000
1,100,000
1,000,000
900,000
800,000
700,000
600,000
500,000
1960 1965 1968 1970 1972 1974 1977 1980 1983 1986 1990 1995 1998 2002
608,749
975,777
1,073,097
963,930
897,077922,439
1,138,880
1,347,036
1,151,283
1,067,217
960,588
883,222
1,096,603
877,691
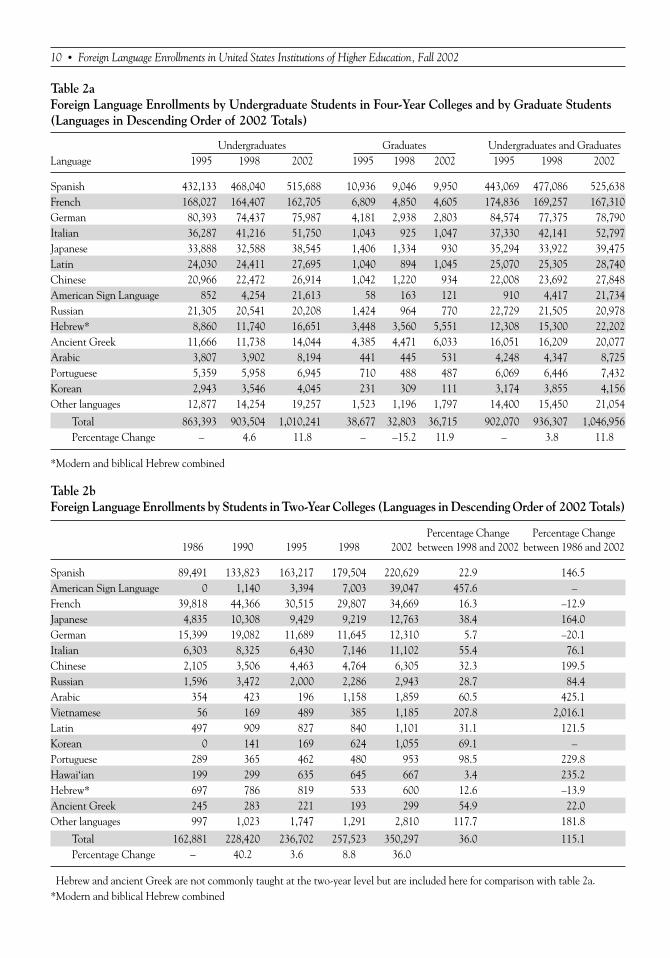
10 • Foreign Language Enrollments in United States Institutions of Higher Education, Fall 2002
Table 2a
Foreign Language Enrollments by Undergraduate Students in Four-Year Colleges and by Graduate Students
(Languages in Descending Order of 2002 Totals)
Undergraduates Graduates Undergraduates and Graduates
Language 1995 1998 2002 1995 1998 2002 1995 1998 2002
Spanish 432,133 468,040 515,688 10,936 9,046 9,950 443,069 477,086 525,638
French 168,027 164,407 162,705 6,809 4,850 4,605 174,836 169,257 167,310
German 80,393 74,437 75,987 4,181 2,938 2,803 84,574 77,375 78,790
Italian 36,287 41,216 51,750 1,043 925 1,047 37,330 42,141 52,797
Japanese 33,888 32,588 38,545 1,406 1,334 930 35,294 33,922 39,475
Latin 24,030 24,411 27,695 1,040 894 1,045 25,070 25,305 28,740
Chinese 20,966 22,472 26,914 1,042 1,220 934 22,008 23,692 27,848
American Sign Language 852 4,254 21,613 58 163 121 910 4,417 21,734
Russian 21,305 20,541 20,208 1,424 964 770 22,729 21,505 20,978
Hebrew* 8,860 11,740 16,651 3,448 3,560 5,551 12,308 15,300 22,202
Ancient Greek 11,666 11,738 14,044 4,385 4,471 6,033 16,051 16,209 20,077
Arabic 3,807 3,902 8,194 441 445 531 4,248 4,347 8,725
Portuguese 5,359 5,958 6,945 710 488 487 6,069 6,446 7,432
Korean 2,943 3,546 4,045 231 309 111 3,174 3,855 4,156
Other languages 12,877 14,254 19,257 1,523 1,196 1,797 14,400 15,450 21,054
Total 863,393 903,504 1,010,241 38,677 32,803 36,715 902,070 936,307 1,046,956
Percentage Change – 4.6 11.8 – –15.2 11.9 – 3.8 11.8
*Modern and biblical Hebrew combined
Table 2b
Foreign Language Enrollments by Students inTwo-Year Colleges (Languages in Descending Order of 2002 Totals)
Percentage Change Percentage Change
1986 1990 1995 1998 2002 between 1998 and 2002 between 1986 and 2002
Spanish 89,491 133,823 163,217 179,504 220,629 22.9 146.5
American Sign Language 0 1,140 3,394 7,003 39,047 457.6 –
French 39,818 44,366 30,515 29,807 34,669 16.3 –12.9
Japanese 4,835 10,308 9,429 9,219 12,763 38.4 164.0
German 15,399 19,082 11,689 11,645 12,310 5.7 –20.1
Italian 6,303 8,325 6,430 7,146 11,102 55.4 76.1
Chinese 2,105 3,506 4,463 4,764 6,305 32.3 199.5
Russian 1,596 3,472 2,000 2,286 2,943 28.7 84.4
Arabic 354 423 196 1,158 1,859 60.5 425.1
Vietnamese 56 169 489 385 1,185 207.8 2,016.1
Latin 497 909 827 840 1,101 31.1 121.5
Korean 0 141 169 624 1,055 69.1 –
Portuguese 289 365 462 480 953 98.5 229.8
Hawai‘ian 199 299 635 645 667 3.4 235.2
Hebrew* 697 786 819 533 600 12.6 –13.9
Ancient Greek 245 283 221 193 299 54.9 22.0
Other languages 997 1,023 1,747 1,291 2,810 117.7 181.8
Total 162,881 228,420 236,702 257,523 350,297 36.0 115.1
Percentage Change – 40.2 3.6 8.8 36.0
Hebrew and ancient Greek are not commonly taught at the two-year level but are included here for comparison with table 2a.
*Modern and biblical Hebrew combined

Elizabeth B. Welles • 11
Table 2c
Total Foreign Language Enrollments by Student
Status, 1974–2002
Students in Students in
Two-Year Four-Year Graduate
Colleges Colleges Students
1974 154,466 750,277 41,892
1983 164,411 769,444 35,158
1986 162,881 807,084 33,269
1990 228,420 920,092 35,628
1995 236,702 863,393 38,677
1998 257,523 903,504 32,803
2002 350,297 1,010,241 36,715
Table 3a
United States Geographic Distribution of 2002
Language Enrollments
Percentage
Number of National
Northeast 302,875 21.7
Midwest 304,366 21.8
South Atlantic 293,736 21.0
South Central 138,884 9.9
Rocky Mountain 104,323 7.5
Pacific Coast 253,069 18.1
National (total) 1,397,253 100.0
Table 3b
United States Geographic Distribution of 2002 Language Enrollments by Level
Two-Year Percentage Four-Year Percentage Percentage
Colleges of National Colleges of National Graduate of National
Northeast 45,360 12.9 249,018 24.6 8,497 23.1
Midwest 45,648 13.0 250,162 24.8 8,556 23.3
South Atlantic 54,891 15.7 230,377 22.8 8,468 23.1
South Central 36,759 10.5 98,696 9.8 3,429 9.3
Rocky Mountain 36,037 10.3 66,134 6.5 2,152 5.9
Pacific Coast 131,602 37.6 115,854 11.5 5,613 15.3
National (total) 350,297 100.0 1,010,241 100.0 36,715 100.0
States included in each region:
Northeast: CT, DE, MA, ME, NH, NJ, NY, PA, RI, VT
Midwest: IA, IL, IN, KS, MI, MN, MO, ND, NE, OH, SD, WI
South Atlantic: AL, DC, FL, GA, KY, MD, NC, SC, TN, VA, WV
South Central: AR, LA, MS, OK, TX
Rocky Mountain: AZ, CO, ID, MT, NM, NV, UT, WY
Pacific Coast: AK, CA, HI, OR, WA
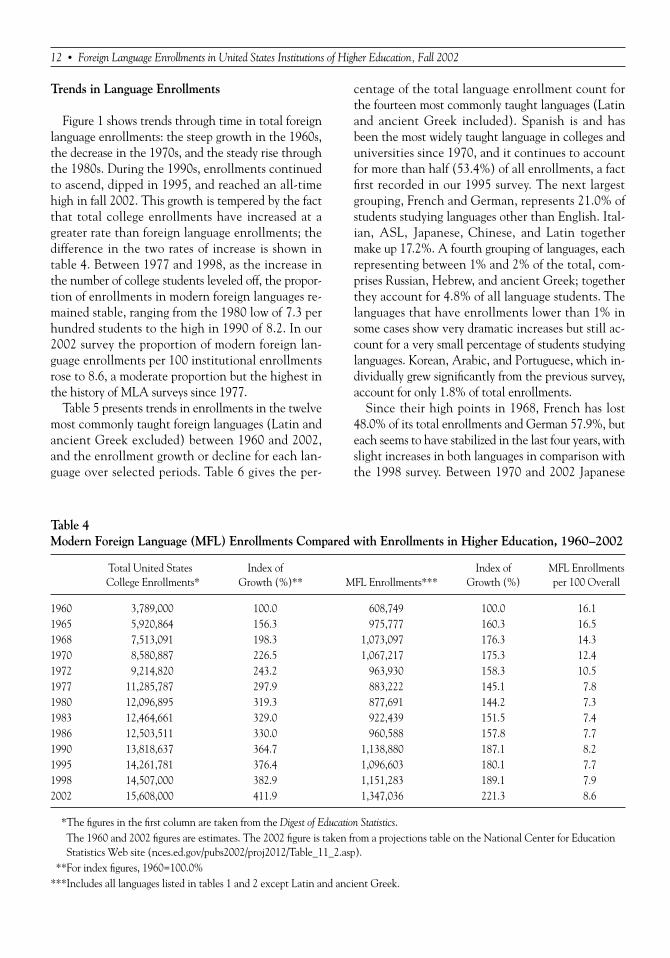
Trends in Language Enrollments
Figure 1 shows trends through time in total foreign
language enrollments: the steep growth in the 1960s,
the decrease in the 1970s, and the steady rise through
the 1980s. During the 1990s, enrollments continued
to ascend, dipped in 1995, and reached an all-time
high in fall 2002. This growth is tempered by the fact
that total college enrollments have increased at a
greater rate than foreign language enrollments; the
difference in the two rates of increase is shown in
table 4. Between 1977 and 1998, as the increase in
the number of college students leveled off, the propor-
tion of enrollments in modern foreign languages re-
mained stable, ranging from the 1980 low of 7.3 per
hundred students to the high in 1990 of 8.2. In our
2002 survey the proportion of modern foreign lan-
guage enrollments per 100 institutional enrollments
rose to 8.6, a moderate proportion but the highest in
the history of MLA surveys since 1977.
Table 5 presents trends in enrollments in the twelve
most commonly taught foreign languages (Latin and
ancient Greek excluded) between 1960 and 2002,
and the enrollment growth or decline for each lan-
guage over selected periods. Table 6 gives the per-
centage of the total language enrollment count for
the fourteen most commonly taught languages (Latin
and ancient Greek included). Spanish is and has
been the most widely taught language in colleges and
universities since 1970, and it continues to account
for more than half (53.4%) of all enrollments, a fact
first recorded in our 1995 survey. The next largest
grouping, French and German, represents 21.0% of
students studying languages other than English. Ital-
ian, ASL, Japanese, Chinese, and Latin together
make up 17.2%. A fourth grouping of languages, each
representing between 1% and 2% of the total, com-
prises Russian, Hebrew, and ancient Greek; together
they account for 4.8% of all language students. The
languages that have enrollments lower than 1% in
some cases show very dramatic increases but still ac-
count for a very small percentage of students studying
languages. Korean, Arabic, and Portuguese, which in-
dividually grew significantly from the previous survey,
account for only 1.8% of total enrollments.
Since their high points in 1968, French has lost
48.0% of its total enrollments and German 57.9%, but
each seems to have stabilized in the last four years, with
slight increases in both languages in comparison with
the 1998 survey. Between 1970 and 2002 Japanese
12 • Foreign Language Enrollments in United States Institutions of Higher Education, Fall 2002
Table 4
Modern Foreign Language (MFL) Enrollments Compared with Enrollments in Higher Education, 1960–2002
Total United States Index of Index of MFL Enrollments
*College Enrollments* **Growth (%)** ***MFL Enrollments*** Growth (%) per 100 Overall
1960 3,789,000 100.0 608,749 100.0 16.1
1965 5,920,864 156.3 975,777 160.3 16.5
1968 7,513,091 198.3 1,073,097 176.3 14.3
1970 8,580,887 226.5 1,067,217 175.3 12.4
1972 9,214,820 243.2 963,930 158.3 10.5
1977 11,285,787 297.9 883,222 145.1 7.8
1980 12,096,895 319.3 877,691 144.2 7.3
1983 12,464,661 329.0 922,439 151.5 7.4
1986 12,503,511 330.0 960,588 157.8 7.7
1990 13,818,637 364.7 1,138,880 187.1 8.2
1995 14,261,781 376.4 1,096,603 180.1 7.7
1998 14,507,000 382.9 1,151,283 189.1 7.9
2002 15,608,000 411.9 1,347,036 221.3 8.6
***The figures in the first column are taken from the Digest of Education Statistics.
***The 1960 and 2002 figures are estimates. The 2002 figure is taken from a projections table on the National Center for Education
Statistics Web site (nces.ed.gov/pubs2002/proj2012/Table_11_2.asp).
***For index figures, 1960=100.0%
***Includes all languages listed in tables 1 and 2 except Latin and ancient Greek.

Elizabeth B. Welles • 13
Table 5
Enrollments in the Twelve Leading Foreign Languages (Excluding Latin and Ancient Greek) in Selected
Years, with Percentage Changes
Enrollments
1960 1970 1980 1990 1995 1998 2002
Spanish 178,689 389,150 379,379 533,944 606,286 656,590 746,267
French 228,813 359,313 248,361 272,472 205,351 199,064 201,979
German 146,116 202,569 126,910 133,348 96,263 89,020 91,100
Italian 11,142 34,244 34,791 49,699 43,760 49,287 63,899
American Sign Language – – – 1,602 4,304 11,420 60,781
Japanese 1,746 6,620 11,506 45,717 44,723 43,141 52,238
Chinese 1,844 6,238 11,366 19,490 26,471 28,456 34,153
Russian 30,570 36,189 23,987 44,626 24,729 23,791 23,921
Hebrew* 3,834 16,567 19,429 12,995 13,127 15,833 22,802
Arabic 541 1,333 3,466 3,475 4,444 5,505 10,584
Portuguese 1,033 5,065 4,894 6,211 6,531 6,926 8,385
Korean 168 101 374 2,286 3,343 4,479 5,211
Total 604,496 1,057,389 864,463 1,125,865 1,079,332 1,133,512 1,321,320
Percentage Changes between Surveys
1960–70 1970–80 1980–90 1990–95 1995–98 1998–2002
Spanish 117.8 –2.5 40.7 13.5 8.3 13.7
French 57.0 –30.9 9.7 –24.6 –3.1 1.5
German 38.6 –37.3 5.1 –27.8 –7.5 2.3
Italian 207.3 1.6 42.9 –11.9 12.6 29.6
American Sign Language – – – 168.7 165.3 432.2
Japanese 279.2 73.8 297.3 –2.2 –3.5 21.1
Chinese 238.3 82.2 71.5 35.8 7.5 20.0
Russian 18.4 –33.7 86.0 –44.6 –3.8 0.5
Hebrew* 332.1 17.3 –33.1 1.0 20.6 44.0
Arabic 146.4 160.0 0.3 27.9 23.9 92.3
Portuguese 390.3 –3.4 26.9 5.2 6.0 21.1
Korean –39.9 270.3 511.2 46.2 34.0 16.3
Total 74.9 –18.2 30.2 –4.1 5.0 16.6
*Modern and biblical Hebrew totals combined
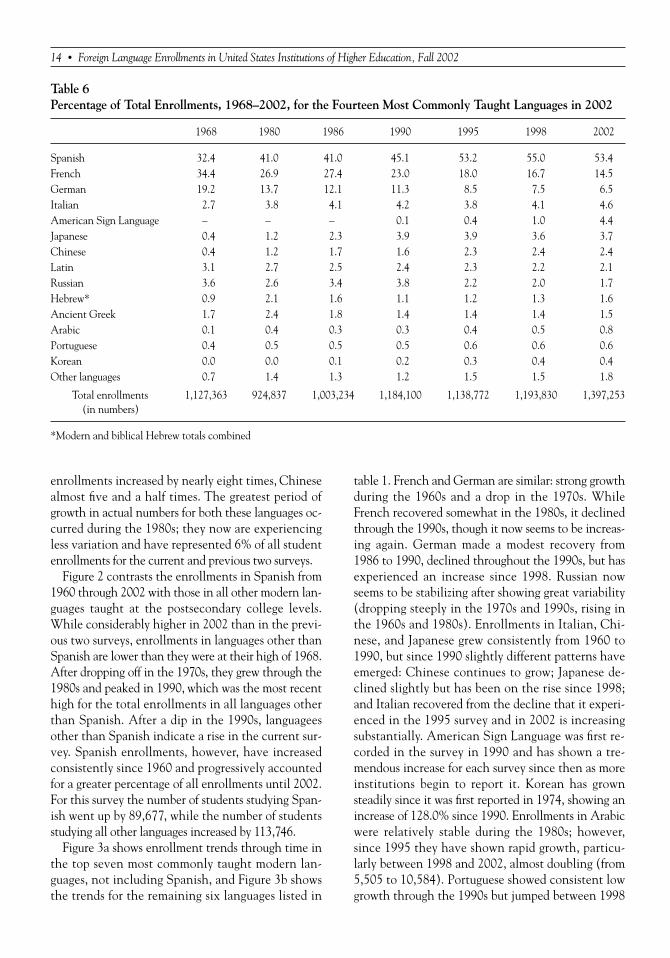
enrollments increased by nearly eight times, Chinese
almost five and a half times. The greatest period of
growth in actual numbers for both these languages oc-
curred during the 1980s; they now are experiencing
less variation and have represented 6% of all student
enrollments for the current and previous two surveys.
Figure 2 contrasts the enrollments in Spanish from
1960 through 2002 with those in all other modern lan-
guages taught at the postsecondary college levels.
While considerably higher in 2002 than in the previ-
ous two surveys, enrollments in languages other than
Spanish are lower than they were at their high of 1968.
After dropping off in the 1970s, they grew through the
1980s and peaked in 1990, which was the most recent
high for the total enrollments in all languages other
than Spanish. After a dip in the 1990s, languagees
other than Spanish indicate a rise in the current sur-
vey. Spanish enrollments, however, have increased
consistently since 1960 and progressively accounted
for a greater percentage of all enrollments until 2002.
For this survey the number of students studying Span-
ish went up by 89,677, while the number of students
studying all other languages increased by 113,746.
Figure 3a shows enrollment trends through time in
the top seven most commonly taught modern lan-
guages, not including Spanish, and Figure 3b shows
the trends for the remaining six languages listed in
table 1. French and German are similar: strong growth
during the 1960s and a drop in the 1970s. While
French recovered somewhat in the 1980s, it declined
through the 1990s, though it now seems to be increas-
ing again. German made a modest recovery from
1986 to 1990, declined throughout the 1990s, but has
experienced an increase since 1998. Russian now
seems to be stabilizing after showing great variability
(dropping steeply in the 1970s and 1990s, rising in
the 1960s and 1980s). Enrollments in Italian, Chi-
nese, and Japanese grew consistently from 1960 to
1990, but since 1990 slightly different patterns have
emerged: Chinese continues to grow; Japanese de-
clined slightly but has been on the rise since 1998;
and Italian recovered from the decline that it experi-
enced in the 1995 survey and in 2002 is increasing
substantially. American Sign Language was first re-
corded in the survey in 1990 and has shown a tre-
mendous increase for each survey since then as more
institutions begin to report it. Korean has grown
steadily since it was first reported in 1974, showing an
increase of 128.0% since 1990. Enrollments in Arabic
were relatively stable during the 1980s; however,
since 1995 they have shown rapid growth, particu-
larly between 1998 and 2002, almost doubling (from
5,505 to 10,584). Portuguese showed consistent low
growth through the 1990s but jumped between 1998
14 • Foreign Language Enrollments in United States Institutions of Higher Education, Fall 2002
Table 6
Percentage of Total Enrollments, 1968–2002, for the Fourteen Most Commonly Taught Languages in 2002
1968 1980 1986 1990 1995 1998 2002
Spanish 32.4 41.0 41.0 45.1 53.2 55.0 53.4
French 34.4 26.9 27.4 23.0 18.0 16.7 14.5
German 19.2 13.7 12.1 11.3 8.5 7.5 6.5
Italian 2.7 3.8 4.1 4.2 3.8 4.1 4.6
American Sign Language – – – 0.1 0.4 1.0 4.4
Japanese 0.4 1.2 2.3 3.9 3.9 3.6 3.7
Chinese 0.4 1.2 1.7 1.6 2.3 2.4 2.4
Latin 3.1 2.7 2.5 2.4 2.3 2.2 2.1
Russian 3.6 2.6 3.4 3.8 2.2 2.0 1.7
Hebrew* 0.9 2.1 1.6 1.1 1.2 1.3 1.6
Ancient Greek 1.7 2.4 1.8 1.4 1.4 1.4 1.5
Arabic 0.1 0.4 0.3 0.3 0.4 0.5 0.8
Portuguese 0.4 0.5 0.5 0.5 0.6 0.6 0.6
Korean 0.0 0.0 0.1 0.2 0.3 0.4 0.4
Other languages 0.7 1.4 1.3 1.2 1.5 1.5 1.8
Total enrollments 1,127,363 924,837 1,003,234 1,184,100 1,138,772 1,193,830 1,397,253
(in numbers)
*Modern and biblical Hebrew totals combined

and 2002 (from 6,926 to 8,385). Enrollments in He-
brew and Greek have shown similar curves since their
high counts in 1974, though Hebrew’s growth has
been steadier since 1990. Through the 1990s, Greek
hovered in the 16,000s but in 2002 jumped to over
20,000. The net gain between 1998 and 2002 of 48
institutions reporting Greek perhaps accounts for this
growth (see table 7a). The 2002 count for Latin is the
highest in the history of the survey, showing a healthy
jump after enrollments dropped during the mid and
late 1990s from the previous high in 1990.
Information gathered about the differences between
the programs that reported in 1998 and those that re-
ported in 2002 revealed some interesting trends. The
data based only on responses from those institutions re-
porting in 1998 showed smaller increases generally than
those reporting overall in 2002 (table 7b); in three lan-
guages there were decreases. This difference should not
be taken as an indication of what the enrollment figures
might have been if the response rate in 2002 had been
the same as that in 1998 (97.4%). It is doubtful that a
2.2% increase in respondents would have changed the
picture significantly. The comparison of the 1998 and
2002 institutional figures (table 7a) is particularly useful
for explaining the enormous growth of ASL: the bulk of
the increase occurred through the reporting of institu-
tions that had not responded previously.
ASL enrollments rose from 1,602 in 1990 to 4,304
in 1995 and then to 11,420 in 1998, increases of
168.7% and 165.3%. Besides student interest, the in-
crease recorded in 2002 also has to do with a change in
the nature of our survey. For over thirty years we have
elicited enrollment data on less commonly taught lan-
guages by requesting information about “other lan-
guages” rather than listing them individually on the
survey form. Through the 1998 survey, ASL was in this
category, but with the enrollments reported in that
survey it joined the list of the more commonly taught
languages, then numbering fifteen. As a result, in 2002
ASL was among the fifteen languages about which we
explicitly requested information. Many institutions
that had not reported their existing ASL programs in
1998 did so in this survey. If these institutions had pre-
viously reported their existing ASL enrollments, the
remarkable growth in ASL in the current survey might
have been more evenly spread out across the three sur-
veys from the 1990s. But it is also notable that 187
new programs were created between 1998 and 2002
(see table 1 in appendix B) to meet growing demand.
French, German, and Russian enrollment data from
the 1998 respondents alone show decreases, while
the overall enrollments in these languages were
slightly up. For Arabic, Chinese, and Italian there is
also a considerable rise in the number of institutions
Elizabeth B. Welles • 15
Figure 2
Enrollments in Spanish Compared with Those in All Other Languages, except Latin and Ancient Greek, by Year
430,060
178,689
364,870379,379
533,944
490,317 494,693
600,769
411,293
708,227
498,312
549,295
604,936 606,286
656,590
746,267Other Modern Languages
Spanish
800,000
700,000
600,000
500,000
400,000
300,000
200,000
100,000
0
1960 1968 1980 1986 1990 1995 1998 2002

16 • Foreign Language Enrollments in United States Institutions of Higher Education, Fall 2002
Figure 3a
Enrollments in the Top Seven Modern Languages, Not Including Spanish, in Selected Years
Russian
Chinese
Japanese
*ASL
Italian
German
French
0 50,000 100,000 150,000 200,000 250,000 300,000 350,000 400,000
23,92123,79124,729
44,62633,961
23,98740,696
30,570
34,15328,456
26,47119,490
16,89111,366
5,0611,844
52,23843,14144,72345,717
23,45411,506
4,3241,746
60,78111,420
4,3041,602
63,89949,287
43,76049,699
40,94534,791
30,35911,142
91,10089,020
96,263133,348
121,022126,910
216,263146,116
201,979199,064
205,351272,472
275,328248,361
388,096228,813
20021998199519901986198019681960
*1960, 1968, 1980, 1986 figures for ASL not available.

Elizabeth B. Welles • 17
Figure 3b
Enrollments in Six Less Commonly Taught Languages in Selected Years
Korean
Portuguese
Arabic
*Hebrew
Ancient Greek
Latin
0 5,000 10,000 15,000 20,000 25,000 30,000
5,2114,479
3,3432,286
875365
8,3856,926
6,5316,211
5,0714,846
10,5845,505
4,4443,4753,4173,387
22,80215,833
13,12712,995
15,63019,429
20,37616,402
16,27216,401
17,60822,111
29,84126,14525,897
28,17825,03825,035
200219981995199019861980
*Modern and biblican Hebrew combined

reporting over 1998. Tables 1 and 2 of appendix B
show that in undergraduate programs new offerings
account for the gains notably in Arabic (74), ASL (as
noted, 187), and Chinese (84). In most cases the
number of new offerings since 1998 is larger than the
number of programs no longer offered, except in Rus-
sian, where 59 programs were discontinued and 28 es-
tablished, and in German, where 60 programs were
discontinued and 39 established.
Less Commonly Taught Languages
During the 1960s, languages we now call less com-
monly taught (LCTLs) were designated “critical” or
“strategic” by government entities and the MLA. Be-
fore 1986, the seven most commonly taught lan-
guages in United States colleges and universities were
Latin, ancient Greek, French, German, Italian, Rus-
sian, and Spanish. By the 1986 survey, however, Japa-
nese became the seventh most commonly taught
language, and by 1998 it had moved up to fifth place;
it now stands in sixth place, behind American Sign
Language. Chinese was the sixth most commonly
taught language in 1995 and is now the seventh.
Table 8 provides information about enrollment data
by level of program (two-year, four-year, graduate) for
the 147 languages composing the other-languages cate-
gory of tables 1, 2, and 6. (In table 8, of the 162 lan-
guages listed, 137 were taught in 1998, and 147 were
taught in 2002.) There are 7.3% more languages in
which students enrolled than were reported for 1998;
34 are indigenous to Europe, 38 to the Middle East or
Africa, 41 to Asia or the Pacific and 34 to North or
South America. Table 9 shows the proportion of enroll-
ments for these different language groups. These num-
bers have not changed significantly since 1998, except
for languages indigenous to Asia or the Pacific, of
which 11 were added in 2002 to the 30 reported in
1998. Of these Asian languages, Vietnamese stands out
as the largest gainer of the LCTLs with enrollments of
2,236, for a total increase of 148.7%. At the two-year
level, Vietnamese went from 385 students in 1998 to
1,185 in 2002; at the four-year level, it grew from 491 to
1,003. Hindi also shows remarkable growth at 72.1%,
up to 1,430 in 2002 from 831 in 1998. One LCTL of
Middle Eastern origin—Aramaic, and one of African
origin—Swahili, now have enrollments over 1,500 and
appear to be gaining rapidly (Tables 8 and 10a).
North and South American native languages have
experienced considerable expansion since the previ-
ous survey, as shown in the enrollments for the lead-
ing sixteen of these languages in 2002 (table 10b).
18 • Foreign Language Enrollments in United States Institutions of Higher Education, Fall 2002
Table 7a
Comparison of Numbers of Institutions Reporting
Undergraduate Enrollments in the Top Fifteen
Foreign Languages in 1998 and 2002
Net Gain
1998 2002 or Loss
Spanish 2,166 2,279 113
French 1,668 1,701 33
German 1,192 1,163 –29
Italian 531 606 75
American Sign Language 116 552 436
Japanese 683 696 13
Chinese 416 489 73
Latin 526 561 35
Russian 497 441 –56
Ancient Greek 518 566 48
Biblical Hebrew 194 226 32
Arabic 157 233 76
Modern Hebrew 150 163 13
Portuguese 143 175 32
Korean 76 91 15
Table 7b
Language Enrollments in Fall 1998 and in Fall
2002 for Those Institutions Responding in 1998
Percentage
1998 2002 Change
Spanish 656,590 710,347 8.2
French 199,064 191,996 –3.6
German 89,020 86,545 –2.8
Italian 49,287 58,774 19.2
American Sign
Language 11,420 13,486 18.1
Japanese 43,141 48,258 11.9
Chinese 28,456 30,701 7.9
Latin 26,145 27,006 3.3
Russian 23,791 22,438 –5.7
Ancient Greek 16,402 17,520 6.8
Biblical Hebrew 9,099 10,212 12.2
Arabic 5,505 7,720 40.2
Modern Hebrew 6,734 7,179 6.6
Portuguese 6,926 7,057 1.9
Korean 4,479 4,730 5.6
Total 1,176,059 1,243,969 5.8

Table 8
Enrollments in 162 Less Commonly Taught Languages, 1998 and 2002
Enrollments in Undergraduate Graduate
Two-Year Colleges Enrollments Enrollments Total
Language Status 1998 2002 1998 2002 1998 2002 1998 2002
Afrikaans 0 0 72 13 0 0 72 13
Akan 0 0 13 5 0 0 13 5
Akkadian 0 0 9 24 93 71 102 95
Albanian 0 0 1 10 0 0 1 10
Alutiiq 0 0 1 10 0 0 1 10
Amharic 0 0 7 12 0 3 7 15
Anishinabe + 0 6 0 18 0 0 0 24
Apache + 0 20 0 0 0 0 0 20
Aramaic 0 36 1,071 1,261 59 389 1,130 1,686
Arapahoe 4 112 0 0 0 0 4 112
Armenian 80 318 233 278 12 11 325 607
Assiniboine 5 12 0 0 0 0 5 12
Assyro-Babylonian – 0 0 3 0 1 0 4 0
Athabaskan 0 0 10 14 0 0 10 14
Aymara – 0 0 1 0 1 0 2 0
Bambara 0 0 28 10 0 1 28 11
Basque 0 0 5 46 0 3 5 49
Bemba – 0 0 1 0 0 0 1 0
Bengali 0 0 31 50 4 4 35 54
Blackfoot 40 41 0 0 0 0 40 41
Bulgarian 0 0 7 17 4 3 11 20
Burmese 0 0 31 46 3 3 34 49
Cambodian + 0 0 0 5 0 0 0 5
Cantonese 0 47 39 128 0 5 39 180
Catalan 0 0 6 31 3 4 9 35
Cebuano + 0 0 0 7 0 0 0 7
Chagatai – 0 0 0 0 2 0 2 0
Chamorro + 0 0 0 11 0 0 0 11
Cherokee 28 7 147 111 0 0 175 118
Cheyenne + 0 0 0 1 0 0 0 1
Chichewa 0 0 0 0 2 2 2 2
Chinese, Classical 0 0 31 56 1 18 32 74
Choctaw 0 0 83 63 0 0 83 63
Coptic 0 0 0 2 3 9 3 11
Cree – 0 0 1 0 0 0 1 0
Croatian 0 0 1 15 0 1 1 16
Crow Indian 0 55 5 0 4 0 9 55
Czech 5 1 159 291 30 29 194 321
Dakota/Lakota 46 17 286 589 2 4 334 610
Danish 0 0 145 189 6 2 151 191
Dari + 0 28 0 13 0 0 0 41
Deg Xinag 0 0 7 9 0 0 7 9
Dutch 0 0 260 357 28 18 288 375
Egyptian 0 0 13 16 39 31 52 47
Eskimo 0 0 46 99 0 0 46 99
Estonian 0 0 6 13 2 3 8 16
Ethiopic – 0 0 2 0 1 0 3 0
Farsi + 0 20 0 64 0 1 0 85
A plus sign in the Status column signifies a new program; a minus sign signifies a discontinued program.
No sign means that the program continues.
Elizabeth B. Welles • 19

Table 8 (continued)
Enrollments in Undergraduate Graduate
Two-Year Colleges Enrollments Enrollments Total
Language Status 1998 2002 1998 2002 1998 2002 1998 2002
Finnish 2 6 103 151 9 5 114 162
Fula + 0 0 0 0 0 1 0 1
Gaelic, Scottish 0 0 47 4 3 0 50 4
Galician 0 0 0 0 6 5 6 5
Georgian 0 0 0 1 1 1 1 2
Greek, Modern 19 11 553 736 74 57 646 804
Gujarati 0 0 32 20 1 0 33 20
Gwich’in 0 0 0 18 2 0 2 18
Haitian Creole 0 0 116 121 8 7 124 128
Hausa 0 0 36 38 7 2 43 40
Hawai‘ian 645 667 1,344 1,014 18 6 2,007 1,687
Hindi 0 0 767 1,374 64 56 831 1,430
Hindi-Urdu 0 0 417 393 31 34 448 427
Hittite 0 0 0 0 8 1 8 1
Hmong 2 89 13 194 0 0 15 283
Hungarian 0 0 53 97 5 5 58 102
Icelandic 0 0 2 12 0 0 2 12
Igbo + 0 0 0 9 0 0 0 9
Ilocano 0 0 171 91 0 0 171 91
Indonesian 0 0 177 180 46 45 223 225
Inupiaq 0 24 22 27 0 0 22 51
Iranian 0 0 77 92 3 10 80 102
Irish 13 0 252 659 13 46 278 705
Irish, Modern + 0 0 0 8 0 0 0 8
Irish, Old 0 0 35 0 13 3 48 3
Japanese, Classical + 0 0 0 8 0 11 0 19
Kannada 0 0 2 2 0 0 2 2
Kazakh 0 0 1 8 0 8 1 16
Khmer 0 0 14 20 0 0 14 20
Kikuyu + 0 0 0 0 0 2 0 2
Kiowa 0 0 49 77 0 0 49 77
Koyukon 0 0 7 6 0 0 7 6
Kutenai + 0 20 0 0 0 0 0 20
Latvian 0 0 12 8 0 0 12 8
Lingala 0 0 35 78 0 1 35 79
Lithuanian 0 0 37 54 14 5 51 59
Luganda 0 0 9 13 0 0 9 13
Macedonian 0 0 0 1 5 2 5 3
Malay 0 0 1 1 1 3 2 4
Malayalam 0 0 28 20 0 0 28 20
Manchu – 0 0 1 0 6 0 7 0
Mandingo + 0 0 0 1 0 0 0 1
Maori 0 0 18 25 0 0 18 25
Marathi 0 0 6 0 0 2 6 2
Menominee 13 13 0 0 0 0 13 13
Meru – 0 0 1 0 0 0 1 0
Mohawk 0 0 16 29 0 0 16 29
Mongolian 0 0 4 27 2 8 6 35
A plus sign in the Status column signifies a new program; a minus sign signifies a discontinued program.
No sign means that the program continues.
20 • Foreign Language Enrollments in United States Institutions of Higher Education, Fall 2002

Table 8 (continued)
Enrollments in Undergraduate Graduate
Two-Year Colleges Enrollments Enrollments Total
Language Status 1998 2002 1998 2002 1998 2002 1998 2002
Muskogee (Creek) 0 6 85 126 0 0 85 132
Nahuatl – 0 0 0 0 1 0 1 0
Navajo 169 526 127 257 1 0 297 783
Ndebele, Zimbabwe – 0 0 7 0 0 0 7 0
Nepali 0 0 94 11 6 0 100 11
Nez Perce + 0 0 0 9 0 0 0 9
Norse 0 0 4 2 1 9 5 11
Norwegian 0 0 638 772 2 5 640 777
Ojibwa 31 40 219 230 1 0 251 270
Omaha – 19 0 0 0 0 0 19 0
Oromo + 0 0 0 0 0 1 0 1
Pali 0 0 0 0 1 11 1 11
Papago 27 36 5 13 0 0 32 49
Pashto + 0 10 0 4 0 0 0 14
Persian 233 308 317 680 64 129 614 1,117
Pilipino + 0 236 0 213 0 0 0 449
Pima 11 9 0 0 0 0 11 9
Polish 22 80 703 935 47 38 772 1,053
Punjabi 0 0 30 99 2 0 32 99
Quechua 0 0 53 43 5 8 58 51
Romanian 0 0 83 120 9 6 92 126
Sahaptin – 0 0 10 0 0 0 10 0
Salish + 0 56 0 0 0 0 0 56
Samoan 0 0 207 201 0 0 207 201
Sanskrit 0 0 275 329 88 158 363 487
Serbian 0 0 22 20 15 16 37 36
Serbo-Croatian 76 133 66 175 12 34 154 342
Setswana 0 0 19 10 0 0 19 10
Shona 0 0 7 2 0 2 7 4
Shoshoni 0 0 8 16 0 0 8 16
Sinhala – 0 0 1 0 0 0 1 0
Sinhalese + 0 0 0 1 0 0 0 1
Slavic, Old Church 0 0 7 9 23 0 30 9
Slovak 0 0 24 31 1 5 25 36
Sumerian 0 0 0 3 13 19 13 22
Swahili 1 47 1,199 1,483 41 63 1,241 1,593
Swati + 0 0 0 0 0 2 0 2
Swedish 0 0 678 727 6 9 684 736
Syriac 0 0 11 2 30 29 41 31
Tagalog 428 404 362 287 4 2 794 693
Tahitian 0 0 19 20 0 0 19 20
Taiwanese + 0 0 0 34 0 13 0 47
Tamil 0 0 41 89 4 25 45 114
Telugu 0 0 11 3 0 0 11 3
Thai 17 16 240 302 15 12 272 330
Tibetan 0 0 59 43 21 35 80 78
Tibetan, Classical + 0 0 0 8 0 20 0 28
Tlingit 0 0 17 108 0 0 17 108
A plus sign in the Status column signifies a new program; a minus sign signifies a discontinued program.
No sign means that the program continues.
Elizabeth B. Welles • 21

22 • Foreign Language Enrollments in United States Institutions of Higher Education, Fall 2002
Table 8 (continued)
Enrollments in Undergraduate Graduate
Two-Year Colleges Enrollments Enrollments Total
Language Status 1998 2002 1998 2002 1998 2002 1998 2002
Tonga 0 0 33 43 0 0 33 43
Turkic 0 0 15 15 0 6 15 21
Turkish 15 13 166 240 37 61 218 314
Twi 0 0 33 75 1 4 34 79
Ugaritic 0 0 0 0 33 14 33 14
Uighur – 0 0 1 0 1 0 2 0
Ukrainian 0 0 34 107 6 19 40 126
Urdu 0 0 22 140 13 12 35 152
Uzbek 0 7 0 5 4 11 4 23
Vietnamese 385 1,185 491 1,003 23 48 899 2,236
Welsh 0 0 16 30 1 2 17 32
Welsh, Early + 0 0 0 2 0 4 0 6
Wolof 0 0 43 73 0 1 43 74
Xhosa + 0 0 0 34 0 0 0 34
Yaqui – 12 0 0 0 0 0 12 0
Yiddish 0 0 324 414 14 24 338 438
Yoruba 0 0 64 76 5 0 69 76
Yup’ik 0 0 55 10 0 0 55 10
Zulu 0 0 63 70 5 2 68 72
Total 2,348 4,662 14,227 19,257 1,196 1,797 17,771 25,716
Continued programs 122
New programs 25
Discontinued programs 15
Total other languages 162
A plus sign in the Status column signifies a new program; a minus sign signifies a discontinued program.
No sign means that the program continues.
Table 9
Enrollments in Less Commonly Taught Languages, by Region of Origin, 1998 and 2002
1998 2002
Languages Enrollments Percentage Languages Enrollments Percentage
Europe 32 4,126 23.2 34 6,636 25.8
Middle East and Africa 39 5,353 30.1 38 6,373 24.8
Asia and Pacific 30 4,477 25.2 41 7,996 31.1
North and South America 37 3,815 21.5 34 4,711 18.3
Total 138 17,771 100.0 147 25,716 100.0

Elizabeth B. Welles • 23
Table 10a
Enrollments in Sixteen Leading Asian or Pacific Languages in Selected Years, with Percentage Change
Change from
Language 1974 1980 1986 1990 1995 1998 2002 1998 to 2002 (%)
Vietnamese 29 74 175 327 1,010 899 2,236 148.7
Hindi 313 197 300 306 694 831 1,430 72.1
Tagalog 122 263 88 146 680 794 693 –12.7
Sanskrit 384 265 250 251 377 363 487 34.2
Pilipino 203 –0 132 196 –0 –0 449 NA
Hindi-Urdu 161 76 101 125 263 448 427 –4.7
Thai 71 80 108 192 278 272 330 21.3
Hmong – – – 13 170 15 283 1,786.7
Indonesian 121 127 156 222 256 223 225 0.9
Samoan 0 18 56 69 179 207 201 –2.9
Cantonese 42 36 111 83 33 39 180 361.5
Urdu 41 23 49 90 88 35 152 334.3
Tamil 33 25 36 35 55 45 114 153.3
Punjabi 0 0 1 8 42 32 99 209.4
Ilocano 58 17 28 72 146 171 91 –46.8
Tibetan 61 56 50 75 67 80 78 –2.5
Total 1,639 1,257 1,641 2,210 4,338 4,454 7,475
Percentage change – –23.3 30.5 34.7 96.3 2.7 67.8
Table 10b
Enrollments in Sixteen Leading Native American Languages in Selected Years, with Percentage Change
Change from
Language 1974 1980 1986 1990 1995 1998 2002 1998 to 2002 (%)
Hawai‘ian 570 610 441 913 1,890 2,007 1,687 –15.9
Navajo 587 225 273 186 832 297 783 163.6
Dakota/Lakota 112 109 168 158 465 334 610 82.6
Ojibwa 95 84 184 231 321 251 270 7.6
Muskogee (Creek) 20 0 0 0 0 85 132 55.3
Cherokee 15 29 22 57 73 175 118 –32.6
Arapahoe 0 0 15 15 9 4 112 2,700.0
Tlingit 0 5 0 0 0 17 108 535.3
Eskimo 0 0 0 0 0 46 99 115.2
Kiowa 0 0 0 0 0 49 77 57.1
Choctaw 12 0 0 8 0 83 63 –24.1
Salish 0 0 0 0 0 0 56 NA
Crow Indian 0 16 14 21 38 9 55 511.1
Inupiaq 30 0 32 48 0 22 51 131.8
Quechua 29 23 17 37 41 58 51 –12.1
Papago 15 0 0 5 39 32 49 53.1
Total 1,485 1,101 1,166 1,679 3,708 3,469 4,321
Percentage change – –25.9 5.9 44.0 120.8 –6.4 24.6

24 • Foreign Language Enrollments in United States Institutions of Higher Education, Fall 2002
Following national trends, enrollments dipped in
1980 and began to climb slowly through the rest of
the decade: a 5.1% increase from 1980 to 1986;
48.2% from 1986 to 1990; and, much more steeply,
119.6% from 1990 to 1995. Despite a slight decline of
–8.5% from 1995 to 1998, these languages have in-
creased since 1998 by 24.6% and have almost tripled
since 1974. Though it has lost some enrollments,
Hawai‘ian still has the largest total enrollment (39%)
of the top sixteen Native American languages taught;
however Navajo and Dakota-Lakota made impressive
gains of 163.6% and 82.6%, respectively.
The 2002 statistics on enrollments in foreign lan-
guages in United States institutions of higher educa-
tion show that trends established in previous surveys
are continuing: Spanish is still the language chosen by
most students who study languages and is becoming
ever more significant in the undergraduate curriculum.
While the number of students studying other languages
is slightly less than half the total, these students are
pursuing a greater variety of languages. Some of the
more commonly taught languages—French, German,
and Russian—do not enjoy the enrollments they did
during the 1970s but now have become stable or have
increased slightly. While the 17.0% increase in total
language enrollments (table 1) is substantial,2 the pro-
portion of modern foreign language (MFL) enroll-
ments to every 100 institutional enrollments (table 4)
has remained relatively constant over the years. The
current proportion of 8.6 MFL enrollments per hun-
dred institutional enrollments should be taken as a
good sign, not only because it is the highest since 1972
but also because the college population grew at a faster
pace between the last two surveys than it had during
the surveys of 1990, 1995, and 1998. The index of
growth for institutional enrollments, showing increases
in college student population since 1960, rose by
11.7% between 1990 and 1995, by 6.5% between 1995
and 1998, by 29.0% between 1998 and 2002. Consid-
ering that growth, the 0.7% increase in MFL enroll-
ments per hundred institutional enrollments for the
2002 survey is significant: foreign language enrollments
are keeping pace with and improving slightly in rela-
tion to the increase in the college student population.
Notes
The author wishes to thank Michael Pisapia, the project re-
search assistant who collected the data; Richard Brod, former
MLA director of special projects and founding director of
ADFL; and MLA staff members David Goldberg and Natalia
Lusin. The author is particularly indebted to Natalia Lusin, who
verified and corrected the data.1These figures are taken from the 2002 Digest of Educational
Statistics, published by the National Center for Education Sta-
tistics. Projections for 2002 enrollments can be found at
nces.ed.gov//pubs2002/proj2012/table_16.asp and nces.ed.gov//
pubs2002/proj2012/table_18.asp.2This percentage gain is the largest since 1990. Gains and
losses of total enrollments in previous years are: –1.4% in 1970,
–9.2% in 1972, –6.2% in 1974, –1.4% in 1977, –0.9% in 1980,
4.5% in 1983, 3.9% in 1986, 18% in 1990, –3.8% in 1995,
4.8% in 1998.

Elizabeth B. Welles • 25
Appendix ARegional Comparison of 2002 Undergraduate Enrollments in Sixteen Leading Languages
South South Rocky Pacific National
Language Northeast Midwest Atlantic Central Mountain Coast (Total)
Spanish 143,587 157,214 167,090 87,819 58,837 121,770 736,317
Percentage of national 19.5 21.4 22.7 11.9 8.0 16.5 100.0
French 46,540 44,680 48,065 19,088 11,452 27,549 197,374
Percentage of national 23.6 22.6 24.4 9.7 5.8 14.0 100.0
German 16,580 27,456 18,870 6,702 6,634 12,055 88,297
Percentage of national 18.8 31.1 21.4 7.6 7.5 13.7 100.0
Italian 26,192 10,459 9,350 2,813 3,101 10,937 62,852
Percentage of national 41.7 16.6 14.9 4.5 4.9 17.4 100.0
American Sign Language 8,818 11,613 7,744 4,989 6,882 20,614 60,660
Percentage of national 14.5 19.1 12.8 8.2 11.3 34.0 100.0
Japanese 9,132 9,980 6,582 2,320 4,023 19,271 51,308
Percentage of national 17.8 19.5 12.8 4.5 7.8 37.6 100.0
Chinese 8,822 5,166 4,228 1,431 1,933 11,639 33,219
Percentage of national 26.6 15.6 12.7 4.3 5.8 35.0 100.0
Latin 6,127 7,197 7,200 3,736 1,688 2,848 28,796
Percentage of national 21.3 25.0 25.0 13.0 5.9 9.9 100.0
Russian 6,034 5,198 4,159 1,442 2,289 4,029 23,151
Percentage of national 26.1 22.5 18.0 6.2 9.9 17.4 100.0
Greek 2,111 4,128 3,750 1,982 780 1,592 14,343
Percentage of national 14.7 28.8 26.1 13.8 5.4 11.1 100.0
Biblical Hebrew 5,732 1,242 1,132 357 135 452 9,050
Percentage of national 63.3 13.7 12.5 3.9 1.5 5.0 100.0
Arabic 2,184 2,219 2,246 652 692 2,060 10,053
Percentage of national 21.7 22.1 22.3 6.5 6.9 20.5 100.0
Modern Hebrew 4,091 1,491 1,207 280 339 793 8,201
Percentage of national 49.9 18.2 14.7 3.4 4.1 9.7 100.0
Portuguese 2,202 1,250 1,886 516 1,244 800 7,898
Percentage of national 27.9 15.8 23.9 6.5 15.8 10.1 100.0
Korean 1,147 592 393 152 323 2,493 5,100
Percentage of national 22.5 11.6 7.7 3.0 6.3 48.9 100.0
Vietnamese 113 45 97 117 36 1,780 2,188
Percentage of national 5.2 2.1 4.4 5.3 1.6 81.4 100.0

Appendix BStatus of Foreign Language Offerings at Institutions That Reported UndergraduateEnrollments in Fall 1998 or Fall 2002 but Not in Both
Table B1
Institutions Reporting Enrollments in 2002 but Not in 1998
New Offerings Language Available in 1998 Status Not
Language since 1998 but No Enrollments Reported Reported Total
Spanish 38 36 145 219
French 49 70 83 202
German 39 50 38 127
Italian 49 40 37 126
American Sign Language 187 24 240 451
Japanese 67 22 25 114
Chinese 84 24 20 128
Latin 25 62 21 108
Russian 28 24 13 65
Ancient Greek 20 48 49 117
Biblical Hebrew 20 33 38 91
Arabic 74 12 17 103
Modern Hebrew 13 7 15 35
Portuguese 35 13 8 56
Korean 11 10 4 25
Table B2
Institutions Reporting Enrollments in 1998 but Not in 2002
Discontinued Language Available in 2002 Status Not
Language Offerings since 1998 but No Enrollments Reported Reported Total
Spanish 3 13 90 106
French 46 69 54 169
German 60 62 34 156
Italian 16 24 11 51
American Sign Language 4 9 2 15
Japanese 40 34 26 100
Chinese 16 25 14 55
Latin 13 45 15 73
Russian 59 38 24 121
Ancient Greek 10 40 19 69
Biblical Hebrew 6 40 13 59
Arabic 8 11 8 27
Modern Hebrew 7 10 5 22
Portuguese 6 13 5 24
Korean 4 4 2 10
Reasons for lack of enrollments include changes in student demand, lack of faculty availability, courses offered on a staggered schedule,
or a combination of these reasons. This category includes languages listed in the course catalogue but having no reported enrollments.
The New Offerings column is for languages newly listed and offered at an institution since 1998. The Discontinued Offerings column
is for languages that are no longer listed in the catalog, though they were available in 1998.
26 • Foreign Language Enrollments in United States Institutions of Higher Education, Fall 2002

5811249v1
3
CERTIFICATE OF SERVICE
It is hereby certified that a copy of the foregoing OPPOSER'S MOTION FOR
SUMMARY JUDGMENT, DECLARATION OF PETER H. JOHNSON IN SUPPORT OF
OPPOSER'S MOTION FOR SUMMARY JUDGMENT, and DECLARATION OF BRENNAN
C. SWAIN IN SUPPORT OF OPPOSER'S MOTION FOR SUMMARY JUDGMENT, have
been sent by U.S. mail to the attorney of record for Applicant:
Jose GutmanFleit, Gibbons, Gutman, Bongini, PL551 N.W. 77th StreetBoca Raton, FL 33487
Dated: January 28, 2009 __________________________________
Michelle Boothby