
Hot film surface heat flux measurement to an impinging air jet

HAL Id: hal-00822034https://hal.archives-ouvertes.fr/hal-00822034
Submitted on 13 May 2013
HAL is a multi-disciplinary open accessarchive for the deposit and dissemination of sci-entific research documents, whether they are pub-lished or not. The documents may come fromteaching and research institutions in France orabroad, or from public or private research centers.
L’archive ouverte pluridisciplinaire HAL, estdestinée au dépôt et à la diffusion de documentsscientifiques de niveau recherche, publiés ou non,émanant des établissements d’enseignement et derecherche français ou étrangers, des laboratoirespublics ou privés.
PIV measurements of an air jet impinging on an openrotor-stator system
Thien Nguyen, Julien Pellé, Souad Harmand, Sébastien Poncet
To cite this version:Thien Nguyen, Julien Pellé, Souad Harmand, Sébastien Poncet. PIV measurements of an air jetimpinging on an open rotor-stator system. Experiments in Fluids, Springer Verlag (Germany), 2012,53, pp.401-412. 10.1007/s00348-012-1298-0. hal-00822034

Experiments in Fluids manuscript No.(will be inserted by the editor)
PIV measurements of an air jet impinging on an open rotor-stator
system
Nguyen T.D. · Pelle J. · Harmand S. · Poncet S.
Received: date / Accepted: date
Abstract The current work experimentally investigates the flow characteristics of an air jet impinging on
an open rotor-stator system with a low non-dimensional spacing, G = 0.02, and with a very low aspect
ratio, e/D = 0.25. The rotational Reynolds numbers varied from 0.33 × 10⁵ to 5.32 × 10⁵, while the jet
Reynolds numbers ranged from 17.2×10³ to 43×103. Particle image velocimetry (PIV) measurements were
taken along the entire disk diameter in three axial planes. From the obtained PIV velocity fields, the flow
statistics were computed. A recirculation flow region, which was centered at the impingement point and
possessed high turbulence intensities, was observed. Local peaks in root-mean-square fluctuating velocity
distributions appeared in the recirculation region and near the periphery, respectively. Proper orthogonal
decomposition (POD) analysis was applied to the cases of the jet impinging on the rotor with and without
rotation to reveal the coherent structures in the jet region.
Keywords open rotor-stator · PIV · impinging jet
Nomenclature
〈.〉 time-averaged operator
ν kinematic viscosity of air (m2/s)
Ω rotational speed (rpm)
ω rotational speed (rad/s)
Cw = Q/ (νRext), mass flow rate coefficient
G = e/Rext, non-dimensional spacing
Nguyen T.D.() · Pelle J. · Harmand S.
Universite Lille Nord de France, F-59000 Lille, France
UVHC, TEMPO, F-59313 Valenciennes, France
E-mail: [email protected]
Poncet S.
M2P2, UMR 6181 CNRS-Aix-Marseille Universite
13451 Marseille, France

2 Nguyen T.D. et al.
Nr = Uj/ (ΩRext), rotation parameter
ReΩ = ΩR2ext/ν, rotational Reynolds number
Rej = DUj/ν, jet Reynolds number
∆t sampling interval (s)
D jet diameter (m)
e gap spacing between the rotor and stator (m)
Q mass flow rate (m3/s)
r radius (m)
Rext radius of rotor (m)
u′
r, u′
θ fluctuating radial and tangential velocities (m/s)
Uj mean jet velocity (m/s)
ur, uθ radial and tangential velocities (m/s)
x, y, z horizontal, vertical and axial directions
1 Introduction
An effective cooling system is nearly always required for any rotating machinery. In this paper, we specially
consider the rotating machinery, which consists of rotating disk systems. Such systems are commonly seen
in many engineering applications, such as alternators, gas turbine engines, car break disks, computer disk
drives, rotational air cleaners, evaporators, etc. The rotating disk systems used in these applications usually
are the cases of flows between a rotating disk (rotor) and a stationary disk (stator), closed cavities of gas
turbines formed by two disks and cylindrical surfaces, a rotating disk in an infinite resting fluid, co-rotating
or counter-rotating parallel disks with and without radial, axial through flows in a gap between them, etc.
A specific engineering application of the rotating disk systems considered in this study is the alternator
that can be found in modern wind generators of the power production industry. Wind power has recently
become as a renewable or “green” source of energy to alter fossil fuels but efforts are required to reduce
the costs of wind generators and increase the energy generated per aerogenerator. Attempting to increase
the generator efficiency, industrialists have developed the modern wind generators, which normally consist
of discoidal rotor-stator systems. These systems do not use gears allowing the generators to operate at low
rotational speeds and reducing energy losses. The reference case chosen for this study was a wind generator
that has been established in the north of France. This wind generator has a radius of 3 m and is able to
deliver 750 kW with a maximum rotational speed of 25 rpm. With an aim toward more power production,
engineers need to solve the problem of ineffective cooling due to high electrical losses dissipated for a relative
low rotational speed. An improvement on the cooling of discoidal rotor-stator alternators could be obtained
by using air jet impingement.
Air jet impingement is an attractive cooling mechanism that is widely used in rotating disk systems.
There have been numerous studies on a jet impinging on a rotating surface. For example, by using a
laser Doppler velocimetric method, Brodersen and Metzger (1992) studied the detailed structures of the
turbulent velocity fields resulting from the interaction between a jet impinging on a rotating disk. They

PIV measurements of an air jet impinging on an open rotor-stator system 3
found that the jet penetrated very deeply into the wall boundary layer and the jet expanded against the
direction of disk rotation, even at locations close to the disk. Using a hot-wire anemometer to measure mean
velocity distributions and Reynolds stresses, Itoh and Okada (1998) investigated the effects of wall rotation
for a radial wall jet impinging on a rotating disk. In this work, they studied the flow with a rotational
Reynolds number ReΩ = 6 × 10⁵, a non-dimensional gap spacing G = e/Rext = 0.01 and an aspect ratio
e/D = 1.5. The authors found that the radial component of turbulence intensity was scarcely affected by
the disk rotation, while the integral length scale of the turbulence was significantly reduced by the effects of
rotation. Owen and Rogers (1989) experimentally studied the flow and heat transfer for a turbulent flow in
a rotor-stator configuration with a central opening and no airflow imposed in the air gap. In their work, the
authors showed that boundary layers developed on the rotor and the stator at values of G between 0.01 and
0.06, then explained the distributions of mean Nusselt number on the free disk. Recently, Poncet et al (2005)
studied the turbulent flow inside an annular rotor-stator cavity, for which the experimental configuration
was G = 0.036, with and without a superimposed throughflow. Their numerical calculations were validated
by two-component laser Doppler anemometer (LDA) measurements. However, those studies were done on
a confined rotor-stator configuration with an axial outlet. In order to introduce a new cooling solution for
practical applications of rotating disk systems, Pelle and Harmand (2009) experimentally studied the local
heat transfer between the rotor surface and the air gap of an open rotor-stator system in which an air jet
passed through a hole in the stator and impinged on the rotor. The authors showed the advantage of adding
a jet impinging on the center of the rotor, which was in a significant increase in the heat transfer near
the jet region. However, the flow characteristic inside such an open rotor-stator configuration is not fully
understood due to the lack of available data.
The objective of this paper is to investigate the flow characteristics of an air jet impinging on an open
rotor-stator configuration with a low non-dimensional spacing (G = 0.02) and a very low aspect ratio
(e/D = 0.25). Rotational Reynolds numbers varied from 0.33 × 10⁵ to 5.32 × 10⁵, while jet Reynolds
numbers ranged from 17.2× 10³ to 43 × 103. In this study, we obtained particle image velocimetry (PIV)
measurements at three axial planes for the entire disk diameter. The open rotor-stator system and PIV
experimental setup are presented in section 2. In section 3, the obtained PIV results are compared with
those obtained by LDA measurements and numerical simulation reported in Poncet et al (2005). In order
to reveal the most dominant flow structures, which play an important role in the flow dynamics and heat
transfer, proper orthogonal decomposition (POD) is applied to the PIV velocity fields obtained near the jet.
In section 4, a brief review of the POD technique and the results from the flow decomposition are presented.
2 Experimental study
2.1 Rotor-stator experimental configuration
Figure 1 shows the experimental configuration of the jet impinging on the open rotor-stator system. The
x and y coordinates respectively represent the horizontal and vertical directions in the PIV measurement
plane, which is perpendicular to the jet axis denoted by z. The origin of the coordinate system is at the

4 Nguyen T.D. et al.
Fig. 1 Open rotor-stator experimental rig (above) and PIV experimental setup (below).
center of the rotor. We note here three parameters that govern the characteristics of the flow: the non-
dimensional spacing G, the rotational Reynolds number ReΩ and the jet Reynolds number Rej , defined
as
G = e/Rext, (1)
ReΩ = ΩR2
ext/ν, (2)
Rej = DUj/ν, (3)
where e is the gap spacing between the rotor and stator, ν is the kinematic viscosity of air, Rext is the radius
of the rotor (Rext = 310 mm), D is the diameter of the impinging jet (D = 26 mm) and Uj is the mean air
jet velocity. In the present experiment, the rotating disk (rotor) was connected to a rotating shaft and its
rotational speed was controlled by a frequency regulator. Three rotational speeds of Ω = 50, 400 and 800
rpm, corresponding to the rotational Reynolds numbers of ReΩ = 0.33 × 10⁵, 2.66 × 10⁵ and 5.32 × 10⁵,
respectively, were considered. The stationary disk (stator), which was constructed of transparent plexiglass
with a thickness of 10 mm and a radius of 320 mm, was placed at a distance of e = 6.5 mm from the rotor,
yielding a non-dimensional spacing G = 0.02. A hole was made at the center of the stator and was connected

PIV measurements of an air jet impinging on an open rotor-stator system 5
to a centrifugal blower to form the air jet. Air from the blower flowed through the hole in the stator, after
which the air flow impinged on the rotating surface of the rotor and interacted with the boundary layer,
and then rapidly convected along the radial direction. The mean air jet velocities were Uj = 10, 15 and 25
m/s, yielding jet Reynolds numbers of Rej = 17.2× 10³, 25.8× 10³ and 43× 103, respectively.
2.2 PIV experimental setup
The PIV system consisted of a New Wave Nd:YAG laser (TSI Inc.) with an articulated light arm, a digital
charge couple device (CCD) camera, a synchroniser and a computer. The Nikkor camera lens had a 105-mm
focal length and an f/5.6 aperture. Each laser beam of the double-pulsed laser was capable of 200 mJ/pulse
at a wavelength of 532 nm. These beams were adjusted by a cylindrical and a spherical lens to form a
1-mm-thick laser sheet. In the rotor-stator experiment, the impinging jet possessed a three-dimensional
structure that produced particle displacements normal to the light sheet. These displacements make the
out-of-plane lost of pairs significant such that the signal strength of the correlation peak obtained from cross-
correlation calculations strongly diminishes. As a result, the possibility of seeking a valid peak reduces. We
have employed two methods suggested by Raffel et al (2007) to overcome this difficulty. These methods
were to choose an appropriate thickness of the laser sheet and the time interval between the recordings
to accommodate the out-of-plane motion for a given pulse delay. The laser sheet thickness was therefore
optimised to be thin enough to generate adequate particle intensity but thick enough to reduce the loss of
particle image pairs. An olive oil droplet generator (TSI 9307) generated particles with a mean diameter of
1 µm to seed the inlet of the centrifugal blower. The TSI PowerView Plus 4MP camera with a resolution
of 2048× 2048 pixels and a pixel size of 7.4× 7.4 µm2 captured PIV images and directly sent them to the
computer. A LaserPulse (TSI Model 610035) synchroniser controlled the synchronisation between the lasers
and camera. Depending on the jet velocity and the rotational speed, the time interval between the first and
the second exposures varied from 15 to 150 µs, yielding maximum particle displacements of 6 pixels.
In this flow configuration, we performed PIV measurements along the axial direction in three planes
defined by z1/e = 0.23 (near the rotor), z2/e = 0.53 (the middle plane) and z3/e = 0.84 (near the stator).
At each axial plane, PIV images were separately captured at three different regions with similar flow
conditions to cover the rotor radius. Specifically, the PIV measurements of regions 1, 2 and 3 covered the
flow regions in the x − y plane with x/(−Rext) ranging from 0.04 to 0.37, 0.38 to 0.71, and 0.72 to 1,
respectively. For the specific values of ReΩ and Rej , a sequence of 500 image pairs was recorded during
each run with a sampling rate of 1 Hz. We denote by ∆t the corresponding sampling interval of 1 s. For the
region near the jet, nondimensionalised by the mean jet velocity Uj and by the jet diameter D, this interval
becomes ∆t×Uj/D, with values ranging from 380 to 960. For the outer region, the sampling interval can be
nondimensionalised by the rotational speed Ω and the jet diameter D, which is the largest-scale structure
of the flow, or the rotor radius Rext. The former interval is ∆t ×πΩRext
30D, ranging from 62 to 998, and
the latter interval is ∆t ×πΩRext
30Rext, ranging from 5.2 to 83. In all cases, the nondimensionalised sampling
interval shows that the particles travel a very long distance compared to the largest-scale structure of the

6 Nguyen T.D. et al.
flow or the rotor radius. Therefore, the velocity fields obtained from the PIV image pairs are statistically
independent.
Image acquisition and image processing were performed with TSI Insight TM 3G software (version 9.1).
The seeding density was adjusted to yield an average of 12 particle images in an interrogation window of
32× 32 pixels. We analysed the digital PIV images by using a recursive Nyquist rectangular grid algorithm
with two iterations. This algorithm started with an interrogation window of 64× 64 pixels and ended with
an interrogation window of 32 × 32 pixels. Both iterations had a 50% window overlap, yielding the final
number of 110× 110 vectors. The first iteration initially computed the particle displacements, which were
then used to shift the interrogation window in the second iteration. In both of the iterations, vectors were
computed from the correlation map with a Gaussian peak fit (Raffel et al, 2007) for sub-pixel accuracy, and
were validated by the signal-to-noise ratio of 1.5. The final step was to apply a median filter (Westerweel,
1994) and a standard deviation filter to remove spurious vectors, and then fill in the blanks by interpolation.
For all the tests, the percentage of bad vectors, which was calculated as the average over the number
of PIV velocity fields, was about 2%. The uncertainties in the PIV velocity measurements were estimated
to be less than 9% of the mean jet velocity in region 1 and typically less than 4% and 6% in regions 2
and 3, respectively. The corresponding overall standard deviations of velocity in region 1, 2 and 3 were
6%, 2% and 4%, respectively, of the mean jet velocity. The uncertainty calculation was based on the error
analysis developed by Coleman and Steele (1995); this error analysis was previously applied to PIV velocity
measurements by Gui et al (2001) and by Murray and Ukeiley (2007).
3 Results from PIV measurements
3.1 Comparisons with LDA measurement and RSM simulation
In this section, we first compare the PIV results with those from the two-component laser Doppler anemome-
ter (LDA) measurements and numerical simulation by Poncet et al (2005). This simulation was based on
one-point statistical modelling using a low-Reynolds-number, second-order, full stress transport closure, or
Reynolds Stress Model (RSM). Note that these experimental and numerical configurations are the most
currently available and compatible with our test configuration. The LDA measurements and RSM simula-
tion were done with a confined rotor-stator configuration and an axial outlet. In both the experiment and
simulation, a central hub was connected to the rotor and a fixed shroud enclosed the space between rotor
and stator. The parameters of the PIV measurements, LDA experiments and RSM simulation are listed in
table 1. The mass flow rate coefficient is defined by Cw = Q/ (νRext). In our experiment, this coefficient was
Cw = −2830, corresponding to the maximum jet velocity Uj = 25 m/s. The rotation parameter, defined by
Nr = Uj/ (ΩRext), and the ratio of ΩD/Uj are almost equal for the PIV and LDA experiments and RSM
simulation.
The radial ur and tangential uθ velocity components measured at three radial locations: r/Rext =
0.44, 0.56, and 0.8, were considered in the comparisons among the PIV and LDA measurements and the
RSM simulation. In the PIV results, statistics of ur and uθ were computed and spatially averaged along

PIV measurements of an air jet impinging on an open rotor-stator system 7
0 0.2 0.4 0.6 0.8 1
0
0.1
0.2
0.3
r/Rext
〈ur〉/
Ωr
0 0.2 0.4 0.6 0.8 1
0
0.1
0.2
0.3
r/Rext
〈uθ〉/
Ωr
(a) Near the stator
0 0.2 0.4 0.6 0.8 1
0
0.1
0.2
0.3
r/Rext
〈ur〉/
Ωr
0 0.2 0.4 0.6 0.8 1
0
0.1
0.2
0.3
r/Rext
〈uθ〉/
Ωr
(b) Middle plane
0 0.2 0.4 0.6 0.8 1
0
0.1
0.2
0.3
r/Rext
〈ur〉/
Ωr
0 0.2 0.4 0.6 0.8 1
0
0.1
0.2
0.3
r/Rext
〈uθ〉/
Ωr
(c) Near the rotor
Fig. 2 Comparison of the mean velocity obtained by PIV ( ), LDA (⊓⊔) and RSM () at different axial planes, (a) near
the stator, (b) middle plane, (c) near the rotor.
these three radii. Figure 2 shows the comparisons of the mean radial 〈ur〉 and tangential 〈uθ〉 velocities
obtained from the three axial planes: near the stator, the middle plane and near the rotor. Figure 3 shows
the turbulence intensities√
〈u′2r 〉,
√
〈u′2
θ 〉 and 〈u′
ru′
θ〉 of the PIV and LDA measurements and the RSM
simulation. These values were nondimensionalised by the local rotational speed, Ωr, at the same radial
points. Relative differences between the statistics, i.e. mean velocity and Reynolds stress components, of
PIV and LDA measurements, and those of PIV measurement and RSM simulation were calculated as
δ =1
3
3∑
zi=1
∣
∣
∣
∣
Szi,PIV − Szi,LDA/RSM
Szi,PIV
∣
∣
∣
∣
, (4)
where Szi,PIV is the statistics of PIV measurement, Szi,LDA/RSM is the statistics of LDA measurement
or RSM simulation, respectively, and zi stands for the measurement planes in the axial direction. Figure 4
shows the calculated relative differences from the statistics of the PIV and LDA measurements and RSM
Table 1 Parameters of PIV, LDA experiments and RSM simulation.
ReΩ Cw Nr G Configuration
PIV 5.3× 10⁵ −2830 0.0053 0.02 Open rotor-stator
LDA (Poncet et al, 2005) 106 −5929 0.0059 0.036 Shrouded rotor-stator
RSM (Poncet et al, 2005) 106 −5929 0.0059 0.036 Shrouded rotor-stator

8 Nguyen T.D. et al.
0 0.2 0.4 0.6 0.8 10
0.05
0.1
r/Rext
√
〈u′2 r〉/
Ωr
0 0.2 0.4 0.6 0.8 10
0.05
0.1
r/Rext
√
〈u′2 θ〉/
Ωr
0 0.2 0.4 0.6 0.8 1−1
−0.5
0
0.5
r/Rext
〈u′ ru′ θ〉/
(Ωr)
2
(a) Near the stator
0 0.2 0.4 0.6 0.8 10
0.05
0.1
r/Rext
√
〈u′2 r〉/
Ωr
0 0.2 0.4 0.6 0.8 10
0.05
0.1
r/Rext
√
〈u′2 θ〉/
Ωr
0 0.2 0.4 0.6 0.8 1−1
−0.5
0
0.5
r/Rext
〈u′ ru′ θ〉/
(Ωr)
2
(b) Middle plane
0 0.2 0.4 0.6 0.8 10
0.05
0.1
r/Rext
√
〈u′2 r〉/
Ωr
0 0.2 0.4 0.6 0.8 10
0.05
0.1
r/Rext
√
〈u′2 θ〉/
Ωr
0 0.2 0.4 0.6 0.8 1−1
−0.5
0
0.5
r/Rext
〈u′ ru′ θ〉/
(Ωr)
2
(c) Near the rotor
Fig. 3 Comparison of the turbulence intensities obtained by PIV ( ), LDA (⊓⊔) and RSM () at different axial planes,
(a) near the stator, (b) middle plane, (c) near the rotor
0.4 0.6 0.80
0.2
0.4
0.6
0.8
1
r/Rext
δ
0.4 0.6 0.80
0.2
0.4
0.6
0.8
1
r/Rext
δ
δ〈ur〉/Ωr δ〈uθ〉/Ωr δ〈u′2r〉/Ωr δ〈u′2
θ〉/Ωr
(a) (b)Fig. 4 Relative differences between the statistics of (a) PIV and LDA, (b) PIV and RSM.
simulation. Relative differences corresponding to the 〈u′
ru′
θ〉 component are not shown due to the major
discrepancies among the PIV, LDA and RSM results obtained near the rotor. In the mid-radius region,
the flow is centrifugal yielding 〈ur〉/Ωr > 0 for all the axial planes and 〈uθ〉/Ωr ≃ 0 near the stator. At
the radial location r/R = 0.44, a reason for the relative differences of 〈uθ〉 could be the averaged-volume
property of the PIV technique, which is characterised by the laser thickness and the interrogation window
size (1× 2 × 2 mm3). This volume is not small enough compared to the boundary layer thickness and the
small gap between the rotor and the stator. In the outer region r/R > 0.7, Poncet et al (2005) showed two
boundary layers separated by a rotating core. The flow was centripetal near the stator, yielding 〈ur〉/Ωr < 0,
and was centrifugal near the rotor, yielding 〈ur〉/Ωr > 0. Such flow structure, however, was not observed in
our PIV experiments without the shroud for ReΩ = 5.3× 10⁵ and Rej = 43× 103. The fixed shroud then

PIV measurements of an air jet impinging on an open rotor-stator system 9
probably yielded a significant difference for the 〈ur〉/Ωr at the radial location r/R = 0.8. It is seen that the
shroud yielded a weak difference to the 〈u′2r 〉 and 〈u′2
θ 〉 components at the outer radius, while the relative
differences of these components at the inner radius are greater.
3.2 Mean flow and turbulence statistics
Figure 5 shows the mean PIV velocity fields obtained at the middle plane with Rej = 17.2 × 10³ and
ReΩ = 0, 0.33× 10⁵, 2.66× 10⁵ and 5.32× 10⁵. The velocity vectors are nondimensionalised by the mean
jet velocity Uj , which is also overlaid on the right hand side of these figures.
Flow visualisation studies by Baydar and Ozmen (2006) demonstrated that for a jet impinging on a
plate with an aspect ratio e/D = 1 and a jet Reynolds number Rej = 4.8 × 10³, a strong recirculation
zone occurred in the confined region around the jet axis. Such a recirculation zone did not appear in the
unconfined jet in this experiment. Although in the current PIV experiments, measurements were performed
in planes normal to the axial direction, the mean velocity vectors in figure 5(a) show that no recirculation
formed in the region between the rotor and stator (note the very low aspect ratio — e/D = 0.25 — compared
to e/D = 1 in Baydar and Ozmen (2006)). This figure also shows that the impinging jet flow without rotation
was outward across the entire radius. In contrast, figures 5(b,c,d) illustrate that recirculation zones occurred
and was centered on the jet axis. The effect of the rotation is clearly observed near the periphery when
the rotational speed increases. The flow is radial over nearly the whole rotor radius for ReΩ = 0.33× 10⁵
but becomes tangential towards the periphery, starting from r/Rext = 0.6 for ReΩ = 2.66× 10⁵ and from
r/Rext = 0.4 for ReΩ = 5.32× 10⁵. Because the thickness of the boundary layers that develop on the rotor
and stator increases in the radial direction, the flow is gradually dominated by the rotation at the larger
radii. In our experiments, the mean velocity fields do not show an inflow zone near the outer radius of the
stator as found in Boutarfa and Harmand (2005). It should be noted that the ratio between the radius of
the central opening in the stator and the rotor radius is 0.89 in Boutarfa and Harmand (2005), while it is
much smaller (0.08) in our experiment.
Considering the effects of the stator, Owen and Rogers (1989) related the rotational Reynolds number
ReΩ and a limiting value of the non-dimensional spacing G as
Glim = 1.05Re−0.2Ω , (5)
below which the stator yields effects to the flow structure and the heat transfer. In our study, the rotational
Reynolds numbers ReΩ varied from 0.33 × 10⁵ to 5.32 × 10⁵ yielding Glim = 0.07 and 0.13. The non-
dimensional gap spacing G = 0.02 indicates that the presence of the stator is expected to have a strong
influence on the flow structures. Figure 6 shows the differences among the nondimensionalised radial velocity
〈ur〉/Uj and root-mean-square (r.m.s) fluctuating velocity√
〈u′2r 〉/Uj obtained from the current PIV results
with Rej = 25.8× 10³, and those obtained from the LDA measurements of Minagawa and Obi (2004) and
the Elliptic-Blending Reynolds Stress Model (EB-RSM) of Manceau et al (2009) with Rej = 14.5×10³. The
PIV and LDA experiments have the same rotation rate ωD/Uj = 0.15 while the rotation rate of EB-RSM
simulation is slightly smaller, ωD/Uj = 0.12. It is necessary to note that the LDA and EB-RSM results were

10 Nguyen T.D. et al.
1 0.9 0.8 0.7 0.6 0.5 0.4 0.3 0.2 0.1 0 −0.2
−0.1
0
0.1
0.2
−x/Rext
y/R
ext
(a)
1 0.9 0.8 0.7 0.6 0.5 0.4 0.3 0.2 0.1 0 −0.2
−0.1
0
0.1
0.2
−x/Rext
y/R
ext
(b)
1 0.9 0.8 0.7 0.6 0.5 0.4 0.3 0.2 0.1 0 −0.2
−0.1
0
0.1
0.2
−x/Rext
y/R
ext
(c)
1 0.9 0.8 0.7 0.6 0.5 0.4 0.3 0.2 0.1 0 −0.2
−0.1
0
0.1
0.2
−x/Rext
y/R
ext
(d)Fig. 5 Nondimensionalised mean PIV velocity fields of the jet impinging on the open rotor-stator, Rej = 17.2 × 10³, (a)
ReΩ = 0, (b) ReΩ = 0.33 × 10⁵, (c) ReΩ = 2.66 × 10⁵, (d) ReΩ = 5.32 × 10⁵. Velocity vectors are de-sampled for better
visibility.
obtained for the case of impinging jet without a stator. The presence of the stator has a strong influence on
the flow structures as shown in figure 6(a) by the negative values of 〈ur〉/Uj , which reveal a recirculation

PIV measurements of an air jet impinging on an open rotor-stator system 11
0 1 2 3 4 5 6−0.5
0
0.5
1
1.5
r/D
〈ur〉/
Uj
(a) 0 1 2 3 4 5 60
0.05
0.1
0.15
0.2
0.25
r/D
√
〈u′2 r〉/
Uj
(b)
Fig. 6 Comparisons of (a) the mean radial velocity 〈ur〉, and (b) r.m.s fluctuating radial velocity√
〈u′2r 〉 obtained by PIV
( ), LDA (⊓⊔, Minagawa and Obi (2004)) and EB-RSM (——, Manceau et al (2009)). The LDA and EB-RSM results were
obtained for the case of impinging jet without a stator.
0 1 2 3 4 5 6 7 8 9 10 11 120
0.05
0.1
0.15
0.2
0.25
r/D
√
〈u′2 r〉/
Uj
ReΩ = 0.33 × 10⁵
ReΩ = 5.32 × 10⁵
ReΩ = 2.66 × 10⁵
Rej = 17.2 × 10³
Rej = 25.8 × 10³
Rej = 43.0 × 10³
(a)
0 1 2 3 4 5 6 7 8 9 10 11 120
0.05
0.1
0.15
0.2
0.25
r/D
√
〈u′2 θ〉/
Uj
ReΩ = 0.33 × 10⁵ Rej = 17.2 × 10³
Rej = 43.0 × 10³
Rej = 25.8 × 10³ReΩ = 2.66 × 10⁵
ReΩ = 5.32 × 10⁵
(b)
0 1 2 3 4 5 6 7 8 9 10 11 12−3
−2
−1
0
1
2
3
4x 10⁻³
r/D
−〈u
′ ru′ θ〉/
U2 j
ReΩ = 2.66 × 10⁵
ReΩ = 0.33 × 10⁵
ReΩ = 5.32 × 10⁵ Rej = 43.0 × 10³
Rej = 17.2 × 10³
Rej = 25.8 × 10³
(c)
Fig. 7 Nondimensionalised r.m.s fluctuating velocities obtained by PIV measurements near the rotor with various rotational
speeds and jet velocities, (a)√
〈u′2r 〉/Uj , (b)
√
〈u′2
θ 〉/Uj , (c) 〈−u′
ru′
θ〉/U2
j .
region near the impingement. Such flow structure, which is not visible in the LDA and EB-RSM results,
also causes the differences in radial distributions of√
〈u′2r 〉/Uj as illustrated in figure 6(b).
12 Nguyen T.D. et al.
0 1 2 3 4 5 6 7 8 9 10 11 120
0.05
0.1
0.15
0.2
0.25
r/D
√
〈u′2 r〉/
Uj
ReΩ = 0.33 × 10⁵, near rotorReΩ = 2.66 × 10⁵, near rotorReΩ = 5.32 × 10⁵, near rotorReΩ = 0.33 × 10⁵, middleReΩ = 2.66 × 10⁵, middleReΩ = 5.32 × 10⁵, middleReΩ = 0.33 × 10⁵, near statorReΩ = 2.66 × 10⁵, near statorReΩ = 5.32 × 10⁵, near stator
(a)
0 1 2 3 4 5 6 7 8 9 10 11 120
0.05
0.1
0.15
0.2
0.25
r/D
√
〈u′2 θ〉/
Uj
(b)
0 1 2 3 4 5 6 7 8 9 10 11 12−1
0
1
2
3x 10⁻³
r/D
−〈u
′ ru′ θ〉/
U2 j
(c)
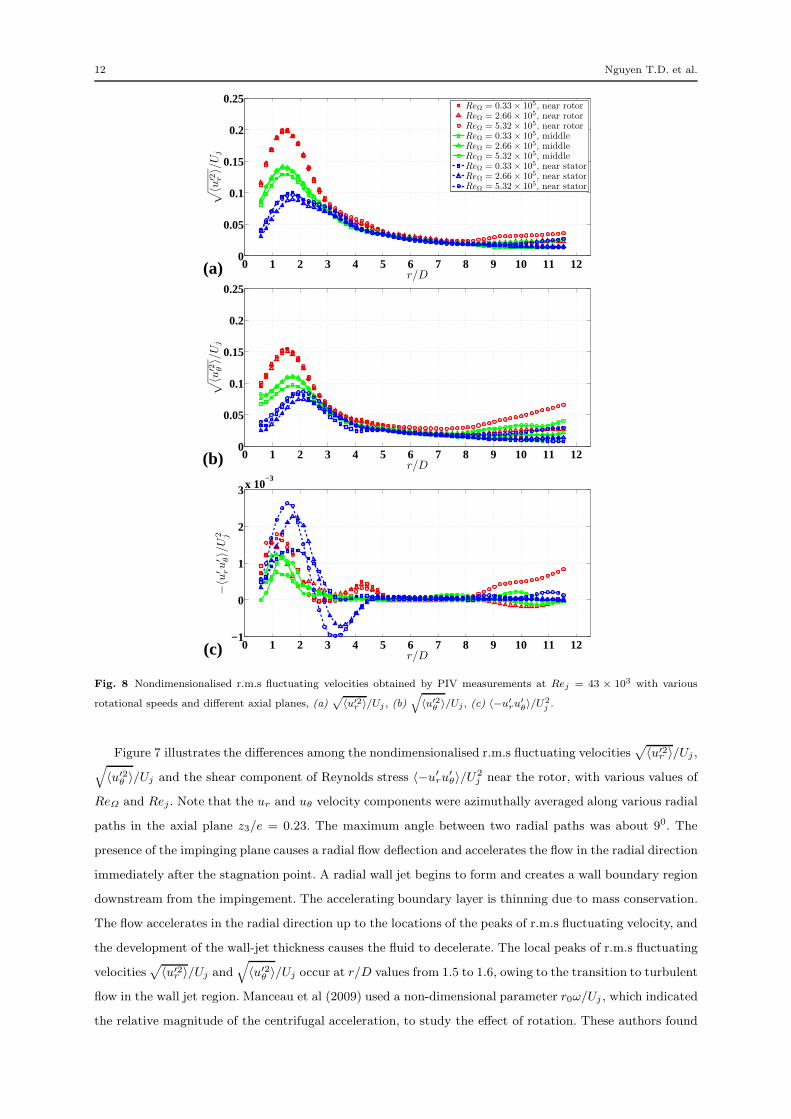
Fig. 8 Nondimensionalised r.m.s fluctuating velocities obtained by PIV measurements at Rej = 43 × 103 with various
rotational speeds and different axial planes, (a)√
〈u′2r 〉/Uj , (b)
√
〈u′2
θ 〉/Uj , (c) 〈−u′
ru′
θ〉/U2
j .
Figure 7 illustrates the differences among the nondimensionalised r.m.s fluctuating velocities√
〈u′2r 〉/Uj ,
√
〈u′2
θ 〉/Uj and the shear component of Reynolds stress 〈−u′
ru′
θ〉/U2
j near the rotor, with various values of
ReΩ and Rej . Note that the ur and uθ velocity components were azimuthally averaged along various radial
paths in the axial plane z3/e = 0.23. The maximum angle between two radial paths was about 90. The
presence of the impinging plane causes a radial flow deflection and accelerates the flow in the radial direction
immediately after the stagnation point. A radial wall jet begins to form and creates a wall boundary region
downstream from the impingement. The accelerating boundary layer is thinning due to mass conservation.
The flow accelerates in the radial direction up to the locations of the peaks of r.m.s fluctuating velocity, and
the development of the wall-jet thickness causes the fluid to decelerate. The local peaks of r.m.s fluctuating
velocities√
〈u′2r 〉/Uj and
√
〈u′2
θ 〉/Uj occur at r/D values from 1.5 to 1.6, owing to the transition to turbulent
flow in the wall jet region. Manceau et al (2009) used a non-dimensional parameter r0ω/Uj , which indicated
the relative magnitude of the centrifugal acceleration, to study the effect of rotation. These authors found

PIV measurements of an air jet impinging on an open rotor-stator system 13
that the influence of rotation was negligible near the impingement region but significant in the wall jet
region after r/D > 2.5. In our work, the influence of rotation can be identified from figure 7 as the deviation
of r.m.s fluctuating velocities. Such effect appears in a region away from the impingement, r/D ≥ 4, and
becomes more obvious at a higher rotational speed. Lytle and Webb (1994) showed that for aspect ratios
e/D < 1, the peak in the velocity fluctuations parallel to the impingement surface corresponded to the peak
in the mean heat transfer distribution. Figure 7 also shows that the areas of high r.m.s fluctuating velocity
were located in the recirculation region and the peaks in the recirculation region were not strongly affected
by an increase of the rotational speed. This observation agrees with the results reported by Itoh and Okada
(1998). In contrast, an increase of the jet velocity produced an increase in the background r.m.s fluctuating
velocity.
Figure 8 compares the nondimensionalised r.m.s fluctuating velocities√
〈u′2r 〉/Uj ,
√
〈u′2
θ 〉/Uj and the
shear component of Reynolds stress 〈−u′
ru′
θ〉/U2
j at the middle plane, near the rotor and near the stator. The
jet Reynolds number was Rej = 43×103 and the rotational Reynolds numbers ReΩ was varied as indicated.
It is seen that after the stagnation point, the r.m.s. fluctuations of the velocity components parallel to the
impingement surface rapidly increase and yield the maximum peaks in the wall jet region. The lowest peaks
of r.m.s fluctuating velocity occur at the plane near the stator, while the peaks at the middle plane are about
40% greater. The highest peaks of r.m.s fluctuating velocity correspond to the plane near the rotor, owing to
the transition from a laminar to a turbulent boundary layer and the growth of turbulence production caused
by the near-wall shear. Another feature is that the positions of the r.m.s fluctuating velocity peaks at the
middle plane do not coincide with those obtained at the planes near the rotor and the stator. This is clearly
observed in the distributions of√
〈u′2
θ 〉/Uj , c.f. figure 8(b), which show a translation of the peak location
from r/D = 1.5 for the plane near the rotor to r/D = 1.75 for the middle plane, and r/D = 2.0 for the
plane near the stator. When investigating the flow structures of the confined impinging jet with e/D = 4,
Fitzgerald and Garimella (1998) also found that the turbulence levels near the impinging plane were higher
than those near the confinement plane, which corresponded to the rotor and stator planes, respectively,
in our experiment. Moreover, these authors discussed that approaching the stator, the turbulence peaks
moved radially outward because the turbulence diffused through the boundary layer. Such phenomenon
were also observed in Baydar and Ozmen (2006) experiments with a confined impinging air jet of e/D = 1.
Their results showed a radial translation of ∆r/D = 0.2 of the locations of the turbulence intensity peaks
at different measurement planes. In our experiments, the translation of the peak location is attributed to
the turbulence diffusion and a high shear region due to the presence of the rotor that primarily affects the
corresponding component√
〈u′2
θ 〉/Uj .
4 Flow analysis by proper orthogonal decomposition
4.1 Proper orthogonal decomposition
In this section, proper orthogonal decomposition (POD) is applied to the PIV velocity snapshots to reveal
the most dominant flow structures, which play an important role in the flow dynamics and heat transfer.

14 Nguyen T.D. et al.
These velocity fields were obtained near the jet region and corresponded to the cases of Rej = 25.8× 10³,
ReΩ = 2.66 × 10⁵ and ReΩ = 0. Complete descriptions of the direct and snapshot POD techniques are
given by Berkooz et al (1993), Holmes et al (1996) and Sirovich and Kirby (1987). In this paper, we apply
the snapshot POD to a set of instantaneous flow fields collected from PIV experimental velocity fields. A
brief review of the snapshot POD is described here. A correlation matrix is calculated as
Cij =1
N
∫
u(x, ti) · u(x, tj)dx, (6)
where N is the number of PIV velocity snapshots. In order to compute the POD basis functions ψ(x) and
temporal coefficients ζk(t), let us first define αki as
αki =υki
√
N∑N
m=1
∑Nr=1
υkmυk
rCmr
(7)
where υki is the ith element of the eigenvector υk corresponding to the eigenvalue λk of the correlation
matrix C. The POD basis functions are then computed as
ψk(x) =N∑
i=1
αkiu(x, ti), (8)
and the temporal coefficients as
ζk(t) =
∫
u(x, t) ·ψk(x)dx = NN∑
i=1
αkiCit. (9)
In our POD calculation, the eigenvalue λ associated with each POD mode is proportional to the kinetic
energy contained in that mode. The decomposition yields statistically dominant flow structures in the few
lowest-order POD modes; these modes capture most of the flow’s kinetic energy and are typically associated
with large-scale structures. Besides, the POD basis functions computed from these velocity snapshots yield
an optimal representation of the flow field in the sense that, for any given number of basis functions, the
Hilbert norm of the truncation error between the original velocity data and the projection of the original
velocity data onto these basis functions is minimised. The present PIV setup allows us to capture several
hundred instantaneous velocity fields. A set of 500 PIV measurements suffices for a POD analysis to reveal
the statistically dominant structures of the flow.
Figure 9 shows the energy spectra and cumulative energies of the velocity decomposition. The energy
fraction of the first POD mode, which is approximately equal to the average flow, is found to be 54% of the
total energy of the flow for the case ReΩ = 2.66× 10⁵. For the case ReΩ = 0, the first POD mode captures
almost the same total energy of the flow, 53%, while the kinetic energy levels contained in the other low-
order modes (modes 2, 3, 4, etc) are less than those in the low-order modes for the case ReΩ = 2.66× 10⁵.
The kinetic energy levels of the low-order POD modes are less than 1%, resulting in a slow convergence of
the cumulative energy; i.e. 90 modes capture about 80% total kinetic energy of the flow. This indicates that
the jet region is highly turbulent and the flow energy is distributed over many small-scale structures.
Figure 10 shows the in-plane components of the low-order POD modes (k = 2, 3 and 4) from the velocity
decomposition for the case Rej = 25.8×10³ and ReΩ = 2.66×10⁵. In our POD calculation, the POD basis
functions are nondimensional. The first POD mode, which reveals the structure similar to the mean flow,

PIV measurements of an air jet impinging on an open rotor-stator system 15
0 20 40 6010
−3
10−2
10−1
100
Mode
log(λ
i/Σ
λi)
0 20 40 600.4
0.5
0.6
0.7
0.8
0.9
1
Number of mode
Cum
ula
tive
ener
gy
Rej = 25.8 × 10³, ReΩ = 2.66 × 10⁵
Rej = 25.8 × 10³, ReΩ = 0
(a) (b)Fig. 9 POD decomposition to the PIV velocity snapshots obtained near the jet region, (a) energy spectra, (b) cumulative
energy.
is not shown in figure 10. By using large-eddy simulation (LES), Hadziabdic and Hanjalic (2008) showed
that the coherent large-scale structures were created by the break down of the ring vortical structures,
which are typical for a free jet. They also found that prior to the impingement, these ring vortices were
deformed and tilted with respect to the impinged plane (the rotor plane in our experiment). Due to the
tilting and the irregularity of the vortex breakdown, the large-scale eddies impinge on the rotor at different
instants without an axial symmetry. The authors also mentioned that the asymmetric impingement of the
large-scale eddy structures caused flapping around the jet axis, which enhanced the heat transfer in the jet
region. In figure 10, footprints of the coherent large-scale structures discussed in Hadziabdic and Hanjalic
(2008) are displayed inside the recirculation region. Their sizes are comparable to the axial gap e between
the rotor and the stator. Because of the impact on the rotor, these large-scale eddies have structures that
are somewhat stretched in the radial direction. The large-scale structures coexist, interact, and somewhat
interconnect as they are originate from the ring vortices. However, such interactions, in combination with
the shear stress caused by the rotor, increase the breaking of those structures into smaller vortical ones
rolling inward and outward around the recirculation region. The eventual breakdown of the vortices and the
rise in the turbulence levels near the jet region play an important role in the flow dynamics and heat transfer
(Hadziabdic and Hanjalic, 2008). The formation of such roll-up vortices was also discussed in Hadziabdic
and Hanjalic (2008) as the primary and secondary vortices. Although the current PIV experiments were not
able to provide the evolution of the large-scale structures, their existences can be confirmed in figure 10.
Figure 11 shows the POD velocity decomposition for the case Rej = 25.8 × 10³ and ReΩ = 0. Due
to the absence of rotation, the flow in this case is the same as a jet impinging on a stationary surface
in a very thin, confined region. Similar to figure 10, figure 11 illustrates the large-scale structures created
by the breakdown of the jet ring vortices as discussed in Hadziabdic and Hanjalic (2008). These vortical
structures roll outward in the wall jet; they may merge to form larger or weaker vortices, and then break
into smaller-scale structures.

16 Nguyen T.D. et al.
−0.3 −0.2 −0.1 0
−0.1
0
0.1
x/Rext
y/R
ext
(a)
−0.3 −0.2 −0.1 0
−0.1
0
0.1
x/Rext
y/R
ext
(b)
−0.3 −0.2 −0.1 0
−0.1
0
0.1
x/Rext
y/R
ext
(c)Fig. 10 Low-order POD velocity modes for the case Rej = 25.8× 10³ and ReΩ = 2.66× 10⁵, (a) mode 2, (b) mode 3, (c)
mode 4. Vectors are de-sampled for better visibility.

PIV measurements of an air jet impinging on an open rotor-stator system 17
−0.3 −0.2 −0.1 0
−0.1
0
0.1
x/Rext
y/R
ext
(a)
−0.3 −0.2 −0.1 0
−0.1
0
0.1
x/Rext
y/R
ext
(b)
−0.3 −0.2 −0.1 0
−0.1
0
0.1
x/Rext
y/R
ext
(c)Fig. 11 Low-order POD velocity modes for the case Rej = 25.8× 10³ and ReΩ = 0, (a) mode 2, (b) mode 3, (c) mode 4.
Vectors are de-sampled for better visibility.

18 Nguyen T.D. et al.
The results from the POD velocity decomposition have shown that the recirculation region is observed
only in the averaged flow with the presence of rotation. The kinetic energy levels contained in the low-order
POD modes – the coherent large-scale structures – of the jet impinging on the rotor are higher than those
of the jet impinging on the stationary surface. The large-scale structures with the same size and shape
are observed in the region near the jet for the cases of the jet impinging on the surface with and without
rotation.
5 Conclusions
In this paper, we obtained PIV measurements for an air jet impinging on an open rotor-stator system with
a low non-dimensional spacing, G = 0.02, and a very low aspect ratio, e/D = 0.25. The velocity profiles and
r.m.s fluctuating velocity distributions were obtained at three axial planes for the entire disk diameter with
various rotational Reynolds numbers and jet Reynolds numbers. The PIV results were compared with those
obtained with LDA measurements and an RSM simulation by Poncet et al (2005), which were carried out for
a shrouded rotor-stator system that consisted of a central hub connected to the rotor and a fixed shroud. The
PIV results showed that the recirculation region occurred near the jet region with the presence of the rotor.
In this region, the increase of the jet velocity produced a rise in the r.m.s fluctuating velocity distributions.
The background r.m.s fluctuating velocity levels nevertheless were not influenced by an increase in the
rotational speed. The r.m.s fluctuating velocity reached their peaks at the radial locations r/D between
1.5 and 1.6. In the open rotor-stator experiment, we also observed an increase in r.m.s fluctuating velocity
near the periphery. We determined the difference in the local r.m.s fluctuating velocity peaks obtained at
different axial planes. The peaks were lowest at the plane near the stator and highest at the plane near
the rotor due to the transition from a laminar to a turbulent boundary layer and the growth of turbulence
production caused by the near-wall shear. In addition, the radial positions of the r.m.s fluctuating velocity
peaks measured at different axial planes were not identical with the peak translation of 0.25D, owing to the
turbulence diffusion and the high shear region caused by the rotor.
Finally, we applied the POD analysis to the velocity snapshots obtained near the jet region to reveal
the most dominant flow structures. The POD velocity decompositions revealed that the coherent large-scale
structures possess an oval shape and their size is comparable to the axial gap spacing. For a jet impinging
on a surface with and without rotation, the flow in the jet region is characterised by similar large-scale
structures.
Acknowledgements
The authors are grateful for the financial support provided by the MEDEE project, the Region Nord Pas-
de-Calais, European project FEDER and the French National Research Agency.

PIV measurements of an air jet impinging on an open rotor-stator system 19
References
Baydar E, Ozmen Y (2006) An experimental investigation on flow structures of confined and unconfined
impinging air jets. Heat and Mass Transfer 42(4):338–346
Berkooz G, Holmes P, Lumley J (1993) The proper orthogonal decomposition in the analysis of turbulent
flows. Annual Review of Fluid Mechanics 25(1):539–575
Boutarfa R, Harmand S (2005) Local convective heat transfer for laminar and turbulent flow in a rotor-stator
system. Experiments in Fluids 38(2):209–221
Brodersen S, Metzger D (1992) Experimental investigation of the flowfield resulting from the interaction
between an impinging jet and a rotating disk. Experimental Thermal and Fluid Science 5(3):351–358
Coleman H, Steele W (1995) Engineering application of experimental uncertainty analysis. AIAA Journal
33(10):1888–1896
Fitzgerald J, Garimella S (1998) A study of the flow field of a confined and submerged impinging jet.
International journal of heat and mass transfer 41(8-9):1025–1034
Gui L, Longo J, Stern F (2001) Towing tank PIV measurement system, data and uncertainty assessment
for DTMB model 5512. Experiments in Fluids 31(3):336–346
Hadziabdic M, Hanjalic K (2008) Vortical structures and heat transfer in a round impinging jet. Journal of
Fluid Mechanics 596(1):221–260
Holmes P, Berkooz G, Lumley J (1996) Turbulence, coherent structures, dynamical systems and symmetry.
Cambridge University Press, Cambridge, UK
Itoh M, Okada M (1998) An experimental study of the radial wall jet on a rotating disk. Experimental
Thermal and Fluid Science 17(1-2):49–56
Lytle D, Webb B (1994) Air jet impingement heat transfer at low nozzle-plate spacings. International
Journal of Heat and Mass Transfer 37(12):1687–1697
Manceau R, Perrin R, Hadziabdic M, Fourment P, Benhamadouche S (2009) Turbulent jet impinging onto
a rotating disc: a collaborative evaluation of rans models. Turbulence, Heat and Mass Transfer 6
Minagawa Y, Obi S (2004) Development of turbulent impinging jet on a rotating disk. International journal
of heat and fluid flow 25(5):759–766
Murray N, Ukeiley L (2007) An application of Gappy POD. Experiments in Fluids 42(1):79–91
Owen J, Rogers R (1989) Flow and heat transfer in rotating-disc systems - Vol.1: Rotor-stator systems.
John Wiley and Sons Inc., New York
Pelle J, Harmand S (2009) Heat transfer study in a rotor-stator system air-gap with an axial inflow. Applied
Thermal Engineering 29(8-9):1532–1543
Poncet S, Chauve M, Schiestel R (2005) Batchelor versus Stewartson flow structures in a rotor-stator cavity
with throughflow. Physics of Fluids 17:075,110
Raffel M, Willert C, Wereley S, Kompenhans J (2007) Particle Image Velocimetry: a Practical Guide.
Springer Verlag
Sirovich L, Kirby M (1987) Low-dimensional procedure for the characterization of human faces. Journal of
the Optical Society of America A 4(3):519–524

20 Nguyen T.D. et al.
Westerweel J (1994) Efficient detection of spurious vectors in particle image velocimetry data. Experiments
in Fluids 16(3):236–247


![REPORTOOCUM ETATIONPAOB - DTICcharacteristics of impinging jet sprays. Ingebo [6] quantified the drop-size distribution for heptane jets impinging at 90%, and obtained an empirical](https://static.fdocuments.us/doc/165x107/5f7eb6364693594f354d769d/reportoocum-etationpaob-dtic-characteristics-of-impinging-jet-sprays-ingebo-6.jpg)


