
pISSN: 0256-1115 DOI: 10.1007/s11814-016-0194-3 … · · 2016-10-27Production and consumption of...
15
3149 Korean J. Chem. Eng., 33(11), 3149-3161 (2016) DOI: 10.1007/s11814-016-0194-3 pISSN: 0256-1115 eISSN: 1975-7220 INVITED REVIEW PAPER † To whom correspondence should be addressed. E-mail: [email protected], [email protected] Copyright by The Korean Institute of Chemical Engineers. Activated carbon from sewage sludge for removal of sodium diclofenac and nimesulide from aqueous solutions Glaydson Simões dos Reis * , ** ,† , Mohammad Khalid Bin Mahbub ** , Michaela Wilhelm ** , Eder Claudio Lima *** , Carlos Hoffmann Sampaio * , Caroline Saucier *** , and Silvio Luis Pereira Dias *** *Department of Metallurgical Engineering, Federal University of Rio Grande do Sul (UFRGS), Av. Bento Gonçalves 9500, Porto Alegre, RS, Brazil **University of Bremen, Advanced Ceramics, Am Biologischen Garten 2, IW3, 28359 Bremen, Germany ***Institute of Chemistry, Federal University of Rio Grande do Sul (UFRGS), Av. Bento Gonçalves 9500, Postal Box 15003, ZIP 91501-970, Porto Alegre, RS, Brazil (Received 5 February 2016 • accepted 2 July 2016) Abstract-Sludge based activated carbons (ACs) were used to remove selected pharmaceuticals such as diclofenac (DCF) and nimesulide (NM) from aqueous solutions. The powered sewage sludge was mixed with different propor- tions of ZnCl 2 . The mixture was pyrolyzed in a conventional oven using three different temperatures under inert atmo- sphere. Afterwards, in order to increase the specific surface area and uptake capacity the carbonized materials were acidified with 6 mol L -1 HCl under reflux at 80 o C for 3 hours. The characterization of ACs was achieved by scanning electron microscopy, FTIR, TGA, hydrophobicity index by water, n-heptane vapor adsorption and nitrogen adsorption/ desorption curves. The specific surface area (S BET ) of adsorbents varied between 21.2 and 679.3 m 2 g -1 . According to the water and n-heptane analysis data all ACs had hydrophobic surface. Experimental variables such as pH, mass of adsor- bent and temperature on the adsorption capacities were studied. The optimum pH, mass of adsorbent and tempera- ture for adsorption of DCF and NM onto ACs were found to be 7.0 (DCF) and 10.0 (NM), 30 mg and 25 o C, respectively. The kinetic adsorption was investigated using general-order, pseudo-first order and pseudo-second order kinetic models, while the general-order model described the adsorption process most suitably. The maximum amounts of DCF and NM adsorbed were 156.7 and 66.4 mg g -1 for sample 1(500-15-0.5), respectively. Keywords: Sewage Sludge, Activated Carbons, Adsorption of Pharmaceuticals, Water and n-Heptane Adsorptions, Adsorption Mechanism INTRODUCTION Pharmaceuticals have caused increasing environmental concerns in recent years as they are a group of ubiquitous, persistent and biologically active compounds with recognized toxicities and endo- crine disruption functions. Production and consumption of these products results in pharmaceutical-laden wastewaters [1-3] that must be treated before being discharged into the environment [2,4]. However, conventional wastewater and drinking water treat- ment processes are not designed to be efficient for removing phar- maceuticals at first instance [5-7]. Consequently, a vast number of these compounds have been detected in effluents of wastewater treatment plants (WWTPs), surface water, ground water, and even drinking water samples [7-9]. Recent studies have shown that several pharmaceuticals are sus- pected to be directly related to the toxicity of aquatic organisms [9,10]. Continual and undetectable effects, with chronic and accu- mulative potential, may result in irreversible consequences on wild- life and human beings [10,11]. Therefore, the need for development of an effective method of removing pharmaceuticals from water has become very urgent [12]. Commonly used methods to remove these substances include filtration, ozonization, oxidation, precipitation, coagulation, and ad- sorption [1,13-17]. However, most of these methods are met with resistance due mainly to the high initial cost involved. In this con- text, in recent years, many studies have reported the use of the ad- sorption method for the removal of pharmaceuticals substances in wastewater [1,2,16]. Adsorption is a common, and cost-effective, approach for solving many problems concerning the purification of pharmaceutical-laden wastewaters [1,2,18]. Adsorption is a process by which the pollutants are transferred from the effluent to a solid phase, thereby minimizing the bioavail- ability of the pollutants to the living organisms [19-21]. Another advantage of the adsorption process is that the adsorbents can be regenerated and reused [20-22]. Among the available adsorbents, activated carbons are known for their excellent adsorption characteristics because of their en- hanced pore structures and higher specific surface area. This unique property makes activated carbons one of the materials most used for the treatment of industrial wastewaters [23-25]. The major de- terminants for the ability of activated carbons to adsorb pollutants from aqueous solutions are the nature of the organic material used to prepare the activated carbon and the experimental conditions of the activation processes [23,25].
Transcript of pISSN: 0256-1115 DOI: 10.1007/s11814-016-0194-3 … · · 2016-10-27Production and consumption of...

3149
Korean J. Chem. Eng., 33(11), 3149-3161 (2016)DOI: 10.1007/s11814-016-0194-3
pISSN: 0256-1115eISSN: 1975-7220
INVITED REVIEW PAPER
†To whom correspondence should be addressed.E-mail: [email protected], [email protected] by The Korean Institute of Chemical Engineers.
Activated carbon from sewage sludge for removal of sodium diclofenacand nimesulide from aqueous solutions
Glaydson Simões dos Reis*,**
,†, Mohammad Khalid Bin Mahbub**, Michaela Wilhelm**, Eder Claudio Lima***,Carlos Hoffmann Sampaio*, Caroline Saucier***, and Silvio Luis Pereira Dias***
*Department of Metallurgical Engineering, Federal University of Rio Grande do Sul (UFRGS),Av. Bento Gonçalves 9500, Porto Alegre, RS, Brazil
**University of Bremen, Advanced Ceramics, Am Biologischen Garten 2, IW3, 28359 Bremen, Germany***Institute of Chemistry, Federal University of Rio Grande do Sul (UFRGS), Av. Bento Gonçalves 9500,
Postal Box 15003, ZIP 91501-970, Porto Alegre, RS, Brazil(Received 5 February 2016 • accepted 2 July 2016)
Abstract−Sludge based activated carbons (ACs) were used to remove selected pharmaceuticals such as diclofenac(DCF) and nimesulide (NM) from aqueous solutions. The powered sewage sludge was mixed with different propor-tions of ZnCl2. The mixture was pyrolyzed in a conventional oven using three different temperatures under inert atmo-sphere. Afterwards, in order to increase the specific surface area and uptake capacity the carbonized materials wereacidified with 6 mol L−1 HCl under reflux at 80 oC for 3 hours. The characterization of ACs was achieved by scanningelectron microscopy, FTIR, TGA, hydrophobicity index by water, n-heptane vapor adsorption and nitrogen adsorption/desorption curves. The specific surface area (SBET) of adsorbents varied between 21.2 and 679.3 m2g−1. According to thewater and n-heptane analysis data all ACs had hydrophobic surface. Experimental variables such as pH, mass of adsor-bent and temperature on the adsorption capacities were studied. The optimum pH, mass of adsorbent and tempera-ture for adsorption of DCF and NM onto ACs were found to be 7.0 (DCF) and 10.0 (NM), 30 mg and 25 oC,respectively. The kinetic adsorption was investigated using general-order, pseudo-first order and pseudo-second orderkinetic models, while the general-order model described the adsorption process most suitably. The maximum amountsof DCF and NM adsorbed were 156.7 and 66.4 mg g−1 for sample 1(500-15-0.5), respectively.
Keywords: Sewage Sludge, Activated Carbons, Adsorption of Pharmaceuticals, Water and n-Heptane Adsorptions,Adsorption Mechanism
INTRODUCTION
Pharmaceuticals have caused increasing environmental concernsin recent years as they are a group of ubiquitous, persistent andbiologically active compounds with recognized toxicities and endo-crine disruption functions. Production and consumption of theseproducts results in pharmaceutical-laden wastewaters [1-3] that mustbe treated before being discharged into the environment [2,4].
However, conventional wastewater and drinking water treat-ment processes are not designed to be efficient for removing phar-maceuticals at first instance [5-7]. Consequently, a vast number ofthese compounds have been detected in effluents of wastewatertreatment plants (WWTPs), surface water, ground water, and evendrinking water samples [7-9].
Recent studies have shown that several pharmaceuticals are sus-pected to be directly related to the toxicity of aquatic organisms[9,10]. Continual and undetectable effects, with chronic and accu-mulative potential, may result in irreversible consequences on wild-life and human beings [10,11]. Therefore, the need for developmentof an effective method of removing pharmaceuticals from water has
become very urgent [12].Commonly used methods to remove these substances include
filtration, ozonization, oxidation, precipitation, coagulation, and ad-sorption [1,13-17]. However, most of these methods are met withresistance due mainly to the high initial cost involved. In this con-text, in recent years, many studies have reported the use of the ad-sorption method for the removal of pharmaceuticals substances inwastewater [1,2,16]. Adsorption is a common, and cost-effective,approach for solving many problems concerning the purificationof pharmaceutical-laden wastewaters [1,2,18].
Adsorption is a process by which the pollutants are transferredfrom the effluent to a solid phase, thereby minimizing the bioavail-ability of the pollutants to the living organisms [19-21]. Anotheradvantage of the adsorption process is that the adsorbents can beregenerated and reused [20-22].
Among the available adsorbents, activated carbons are knownfor their excellent adsorption characteristics because of their en-hanced pore structures and higher specific surface area. This uniqueproperty makes activated carbons one of the materials most usedfor the treatment of industrial wastewaters [23-25]. The major de-terminants for the ability of activated carbons to adsorb pollutantsfrom aqueous solutions are the nature of the organic material usedto prepare the activated carbon and the experimental conditionsof the activation processes [23,25].

3150 G. S. dos Reis et al.
November, 2016
Adsorption using activated carbon has been reported as an effec-tive method of eliminating micropollutants. Saucier et al. [2] showedthat pharmaceuticals such as diclofenac and nimesulide were effec-tively removed by 97 and 98%, respectively, from water using cocoashell activated carbon with a maximum adsorption capacity of 63.47and 74.81 mg g−1 to DCF and NM, respectively. In contrast, Soteloet al. [18] reported high uptake values for the micropollutants suchas caffeine (190.9 mg g−1) and sodium diclofenac (233.9 mg g−1) ontocommercially available powered activated carbon. Jung et al. [16]showed a higher maximum adsorption capacity value for sodiumdiclofenac, equal to 372 mg g−1 by applying powered activated car-bon. The reason for various removal values of micropollutants inthe previous researches might be the different experimental condi-tions used such as the concentration of micropollutants and adsor-bent, contact time, pH, and the sample used [2,18,23].
This paper reports the preparation of activated carbons (ACs)from powdered sewage sludge by chemical activation with ZnCl2using different ZnCl2 : sludge ratios of 0.5, 1.0 and 1.5. The ACswere pyrolyzed at three different conditions under inert atmosphere.Intending to increase the specific area of the ACs, the carbonizedmaterials were acidified with 1.0 mol L−1 of HCl to obtain chemi-
Table 1. Chemical structure of used adsorbates in this studySodium diclofenac (DFC) Nimesulide (NM)
CAS 15307-79-6 CAS 21803-78-2C12H10Cl2NNaO2 C13H12N2O5S318.13 g·mol−1 308.31 g·mol−1
LogKow=3.91 LogKow=2.22pKa=4.00 pKa=6.70λmax=285 nm λmax=392 nmVan der Waals surface area=359.64 A2 Van der Waals surface area=406.46 A2
Polar surface area 52.16 A2 Polar surface area 104.12 A2
Dipole Moment 19.21 Debye Dipole Moment 11.52 DebyePolarizability 27.74 Polarizability 28.28
Table 2. Overview of activated carbons prepared by pyrolysis at different conditions and their respective specific surface areas, pore volumeand maximum adsorption values
Samples Pyrol (oC) Holding time (min) Ratio ZnCl2/sludge SBET (mg2 g−1) V (cm3 g−1) qDCF (mg g−1) qNM (mg g−1)1- (500-15-0.5) 500 15 0.5 679.3 0.690 162.72 63.012- (800-15-0.5) 800 15 0.5 378.7 0.379 126.66 58.623- (500-60-0.5) 500 60 0.5 602.5 0.493 155.48 57.314- (800-60-0.5) 800 60 0.5 405.4 0.349 142.39 55.215- (500-15-1.5) 500 15 1.5 484.2 0.379 148.65 60.546- (800-15-1.5) 800 15 1.5 328.0 0.422 092.69 51.357- (500-60-1.5) 500 60 1.5 662.2 0.396 151.72 49.348- (800-60-1.5) 800 60 1.5 351.6 0.560 124.81 40.329- (650-37-1.0) 650 37 1.0 503.7 0.422 140.32 44.3510- (500-15-0) 500 15 0.0 021.2 0.007 012.33 03.88
cally activated sludge based carbons. As far we know, for the firsttime, ACs prepared from sewage sludge were tested as adsorbentsin the removal of pharmaceuticals such as sodium diclofenac (DCF)and nimesulide (NM) from aqueous solutions.
MATERIALS AND METHODS
1. Solutions and ReagentsAll solutions were prepared using deionized water. The diclofenac
(DCF) and nimesulide (NM) (see Table 1) were supplied by SigmaAldrich and used without purification. The ZnCl2 was purchasedfrom Vetec and was used for chemical activation of sewage sludge.The characteristics of the pharmaceuticals used on this study areshown in Table 1.
A 1.00 g L−1 stock solution of DCF and NM was prepared byweighing and dissolving a calculated amount of the pharmaceuti-cals in deionized water. Different working solutions were preparedby diluting the stock solution.2. Preparation of Sludge Derived Activated Carbons
The raw material used for preparing the activated carbon wasthe sewage sludge obtained from a municipal wastewater treatment

Activated carbon from sewage sludge for removal of sodium diclofenac and nimesulide from aqueous solutions 3151
Korean J. Chem. Eng.(Vol. 33, No. 11)
plant in Porto Alegre, RS - Brazil. First, the sludge was dried at 105 oCfor 24 h until constant weight loss. Finally, it was crushed with agrinder and sieved to a size range below 300μm. The preparationof the sludge-based ACs followed the three main steps presentedby dos Reis et al. [23]:
a. 10.0 g of powdered sewage sludge was mixed with differentamounts of ZnCl2 to adjust different ratios of ZnCl2 : sludge (seeTable 2). Subsequently, 5.0 mL of water was added and thoroughlymixed, by hand, to obtain a homogeneous paste. The resultingpaste was placed in a crucible and dried at room temperature for24 h.
b. The samples were pyrolyzed at temperatures and holding timeslisted in Table 2. The pyrolysis processes were performed using flowof N2 gas with flow rate of 100 mL min−1 and at a constant heat-ing rate of 5 oC min−1 in a conventional furnace.
c. To complete the chemical activation, a leaching procedurewas performed to eliminate the remaining ZnCl2 of the pyrolyzedcarbons, and to increase the specific area of the ACs [2,26]. Thefollowing procedure was employed [2,26]: 8.0 g of AC were addedto 150 mL of 6 mol L−1 HCl in a 250 mL reaction flask; the mix-ture was stirred on a magnetic stirrer under reflux for 3 h at 80 oC.Subsequently, the slurry was cooled and filtered under vacuum usinga 0.45μm membrane in a polycarbonate Sartorius system. Afterextensive washing with distilled water the solid material was ovendried at 110 oC for 5 h, and finally the carbon sample was milledin a mortar and the activated carbon was sieved to particle sizes≤90μm [2,26].
The pyrolyzed materials investigated in this study are listed inTable 2 and are denominated by different numbers. The first num-ber refers to the temperature used in the pyrolysis followed by theholding time and ratio of ZnCl2 : sludge. To give an example, thesample 1(500-15-0.5) was prepared at 500 oC with 15 minutes ofholding time and a weight ratio of 0.5/1.0 of ZnCl2 : sludge.3. Characterization of the Activated Carbons
Nitrogen adsorption isotherms were recorded with a commer-cial system (Belsorp-Mini, Bel Japan Inc.) at −196 oC after dryingfor 3 h at 120 oC under reduced pressure (<2 mbar). The specificsurface areas were determined from the Brunauer, Emmett andTeller (BET) method [27]. The pore size distributions were calcu-lated from the desorption branch of the isotherms based on theBarrett-Joyner-Halenda (BJH) model [28].
Surface morphologies of selected samples were observed byusing scanning electron microscopy (SEM) (JEOL microscope,model JSM 6060, Tokyo, Japan).
The functional groups of the adsorbents were assessed usingFourier Transform Infra-Red Spectroscopy (FTIR). The spectrumwas recorded with 64 cumulative scans over the range of 4,000-400 cm−1 with a resolution of 4 cm−1 [29,30].
Thermogravimetric (TGA) analysis of adsorbents were obtainedon a TA Instruments model SDT Q600 (New Castle, USA) with aheating rate of 20 oC min−1 at 100 mL min−1 of synthetic air flow.Temperature was varied from 20 oC to 1,000 oC (acquisition timeof 1 point per 5 s) using 10.00-15.00 mg of solid.
For vapor adsorption experiments about 300.0 mg of powderadsorbent was dried in 10 mL beakers at 105 oC for 24 h. The sam-ples were cooled in a desiccator before determining their accurate
weight (about 300.0 mg). Storage in an atmosphere of saturatedsolvent vapor was performed in Erlenmeyer flasks capped withglass caps (45/50 ground glass joint), using 60 ml of solvent (wateror n-heptane). The dried powder samples inside the beakers wereplaced in such a way that they were not in contact with the wall ofthe Erlenmeyer flasks and kept at 25 oC under static conditions.The beakers containing the solid samples were removed from theErlenmeyer flasks after 24 h, dried carefully from the outside withlaboratory tissues. The weight gain during vapor solvent exposi-tion was used to determine the maximal vapor uptake (of water orn-heptane).4. Batch Adsorption Studies
Aliquots of 20.00 mL of 5.00-500.0 mg L−1 of DCF and NM wereadded to 50 mL flat Falcon tubes containing varying amount ofadsorbents (5.0-200.0 mg). The flasks were capped and placed hori-zontally in a shaker model TE-240, and the system was agitatedfor time between 5 and 360 min with temperature varying between25 and 45 oC. Afterwards, in order to separate the adsorbents fromthe aqueous solutions, the flasks were centrifuged using a Fanemcentrifuge, and aliquots of 1-5 ml of the supernatant were prop-erly diluted to 20.0-100.0 ml in calibrated flasks using water [20,31].
The residual solution after adsorption was quantified using UV/visible spectrophotometer (T90+ UV-VIS spectrophotometer, PGInstruments, London, United Kingdom), at a maximum wave-length of 275 and 392 nm, for DCF and NM, respectively.
The amount of DCF and NM removed by the activated carbons(q in mg g−1) and the percentage of removal (%Removal) were cal-culated with the aid of Eqs. (1) and (2), respectively:
(1)
(2)
where q is the amount of DCF and NM uptaken by the absor-bent (mg g−1); Co is the initial DCF and NM concentrations put incontact with the adsorbent (mg L−1), Cf is the DCF and NM con-centrations (mg L−1) after the batch adsorption procedure, V is thevolume of DCF and NM solutions (L) put in contact with theadsorbent and m is the mass (g) of absorbent.5. Quality Assurance and Statistical Evaluation of Models
All the experiments were in triplicate to ensure reproducibility,reliability and accuracy of the experimental data. The relative stan-dard deviations of all measurements were below 5%. Blanks wererun in parallel and corrected when necessary [32].
The solutions of DCF and NM were stored in glass bottles,which were cleaned by immersion in 1.4 molL−1 HNO3 for 24 h[33], rinsing with deionized water, drying and storing them in asuitable cabinet.
Standard solutions of the pharmaceuticals (between 5.00 and50.0mg L−1) were used for calibration in parallel with a blank solu-tion. A linear analytical calibration curve was performed on theUV-Win software of the T90+PG Instruments spectrophotome-ter. All the analytical measurements were in triplicate, and the pre-cision of the standards was better than 3% (n=3) [34]. The detection
q = Co − Cf( )
m-------------------- V⋅
%Removal =100Co − Cf( )
Co--------------------⋅
3152 G. S. dos Reis et al.
November, 2016
limit of pharmaceuticals were 0.14 mg L−1 with a signal/noise ratioof 3 [35]. A 50.0 mg L−1 of standard DCF and NM solutions wereused for quality control after every five measurements to ensureaccuracy of the pharmaceutical solutions [33].
The mathematical fitness of the kinetic and equilibrium datawas done using nonlinear methods, which were evaluated using theSimplex method, and the Levenberg-Marquardt algorithm usingthe fitting facilities of the Microcal Origin 2015 software. A deter-mination coefficient (R2), an adjusted determination coefficient(R2
adj) and the residual standard deviation (SD) were used to evalu-ate the suitability of the models [21,36]. Residual standard devia-tion is a measure of the differences between the theoretical andexperimental amounts of DCF and NM adsorbed. The R2, R2
adj
and SD are represented in Eqs. (3), (4) and (5), respectively.
(3)
(4)
(5)
In these equations, qi, model represents individual theoretical q val-ues predicted by the model; qi, exp represents individual experimen-tal q values; is the average of experimental q values; n representsthe number of experiments; p represents the number of parame-ters in the fitting model [21,36].6. Kinetic Models
According to the rate law, exponents of chemical reactions aremostly independent of the coefficients of chemical equations, butare sometimes related. This means that the order of a chemicalreaction depends on the experimental data. To establish the gen-eral rate law equation for adsorption, the adsorption process onthe surface of an adsorbent is considered to be the rate determin-ing step [37,38]. Attention is now focused on the change in theeffective number of active sites at the surface of adsorbent duringadsorption instead of the concentration of adsorbate in bulk solu-tion. Applying the reaction rate law to Eq. (6) gives the adsorptionrate expression.
(6)
where kN is the rate constant; qe is the amount of adsorbateadsorbed by adsorbent at equilibrium; qt is the amount of adsor-bate adsorbed by adsorbent at a given time, t; n is the order of ad-sorption with respect to the effective concentration of the adsorp-tion active sites present on the surface of the adsorbent. Applica-tion of the universal rate law to the adsorption process has led toEq. (6), which can be used without assumptions. Theoretically, theexponent n in Eq. (6) can be an integer or non-integer rational num-ber [37,38].
Eq. (7) describes the number of the active sites (θτ) available onthe surface of adsorbent for adsorption [37,38].
(7)
Eq. (8) describes the relationship between the variable (θt) andrates of adsorption.
(8)
Where k=kN(qe)n−1
For an unadsorbed adsorbent θt=1, which decreases during theadsorption process. θt approaches a fixed value when the adsorp-tion process reaches equilibrium. For a saturated adsorbent, θt=0[38].
Eq. (8) gives Eq. (9).
(9)
Similarly, Eq. (9) gives Eq. (10).
(10)
Eq. (10) gives Eq. (11) on rearrangement.
(11)
Substituting Eq. (7) into Eq. (11), and replacing k=kN(qe)n−1, Eq.(12) is obtained.
(12)
Eq. (12) is the general order kinetic equation of adsorption;valid for n≠1 [38].
A special case of Eq. (8) is the pseudo-first order kinetic model(n=1) [37,38].
(13)
Eq. (13) on integration gives Eq. (14).
qt=exp(−k·t) (14)
Substitution of Eq. (7) into Eq. (14), and replacing k=k1 givesthe pseudo-first order kinetic model (Eq. (15)).
qt=qe[1−exp(−k1·t) (15)
Pseudo-first order kinetic equation is a special case of generalkinetic model of adsorption.
When n=2, the pseudo-second-order kinetic model is a specialcase of Eq. (12) [38].
(16)
Eq. (16) on rearrangement gives Eq. (17).
(17)
Pseudo-first-order (Eq. (15)), pseudo-second-order (Eq. (17)), and
R2 =
qi, exp − qi, exp( )2 − qi, exp − qi, model( )2
i
n∑
i
n∑
qi, exp − qi, exp( )2
i
n∑
-----------------------------------------------------------------------------------------
⎝ ⎠⎜ ⎟⎜ ⎟⎜ ⎟⎜ ⎟⎛ ⎞
Radj2
=1− 1− R2( )n −1
n − p −1------------------
⎝ ⎠⎛ ⎞⋅
SD = 1
n − p-----------
⎝ ⎠⎛ ⎞ qi, exp − qi, model( )2
i
n∑⋅
qexp
dqdt------ = kN qe − qt( )n
θt =1− qt
qe----
dθt
dt------- = − kθt
n
dθt
θt n
------- = − k dt0
t∫1
θ
∫
11− n---------- θt
1−n −1[ ] = − kt⋅
θt = 1− k 1− n( ) t⋅[ ]1/1−n
qt = qe − qe
kN qe( )n−1 t n −1( ) +1⋅ ⋅[ ]1/1−n
-----------------------------------------------------------------
dθt
dt------- = − k θt
1⋅
qt = qe − qe
k2 qe( ) t +1⋅[ ]------------------------------
qt = qe
2k2tk2 qe( ) t +1⋅[ ]------------------------------
Activated carbon from sewage sludge for removal of sodium diclofenac and nimesulide from aqueous solutions 3153
Korean J. Chem. Eng.(Vol. 33, No. 11)
general order equation model (Eq. (12)) were used to evaluate thekinetics of adsorption of the pharmaceuticals on the carbon adsor-bents.7. Equilibrium Models
In this work, the Langmuir, Freundlich, and Sips [39-41] isothermmodels were tested.
The Langmuir isotherm equation is:
(18)
where, Ce is the supernatant concentration after the equilibriumof the system (mg L−1), KL is the Langmuir equilibrium constant(L mg−1), and Qmax is the maximum adsorption capacity of the mate-rial (mg g−1) assuming a monolayer of adsorbate uptaken by theadsorbent.
The Freundlich isotherm model is:
q=KF·Ce1/n (19)
where KF the Freundlich equilibrium constant [mg g−1(mg L−1)−1/n]and n is the Freundlich exponent (dimensionless).
The Sips model is an empirical model that consists of the com-bination of the Langmuir and Freundlich isotherm type models.The Sips [38,41] model takes the following form:
(20)
where KS is the Sips equilibrium constant (mg L−1)−1/n and Qmax
is the Sips maximum adsorption capacity (mg g−1).At low adsorbate concentrations the Sips model effectively reduces
to a Freundlich isotherm, while at high adsorbate concentrations itpredicts a monolayer adsorption capacity characteristic of the Lang-muir isotherm.
RESULTS AND DISCUSSION
1. Characterization of the Carbon AdsorbentsActivated carbons were prepared by using sewage sludge as an
organic precursor. The chemical activation was carried out usingZnCl2. Ten different activated carbons were pyrolyzed at differenttemperatures (500o, 650o and 800 oC), using different zinc chloride :organic precursor ratios (0 : 1, 0.5 : 1, 1 : 1, and 1.5 : 1), see Table 2.Afterwards to complete the chemical activation, an acid treatmentwith 6 mol L−1 HCl, under reflux for 2 hours, was used to leachout the inorganic compounds of the carbon structure [26,36]. TheACs were characterized by SEM, elemental analysis, solvent vapor(n-heptane and water) adsorption and N2 adsorption/desorptionisotherms. Likewise, the ACs were tested for their performance inthe removal of the DCF and NM in aqueous solutions by batchadsorption method. The characterization of activated carbons pre-pared will be discussed in the following section.
In Table 2 is shown all the textural characteristics of the carbonadsorbents prepared. It was observed that the samples with highersurface area (SBET) presented the highest values for adsorption ofthe anti-inflammatory DCF and NM (see Supplementary Fig. 1).These results show clearly that improvements in the superficial areaof the adsorbent are related to increases in the sorption capacity of
the adsorbents for DCF and NM [2,26,36].Samples 1(500-15-0.5) (high surface area), 6(800-15-1.5) (lower
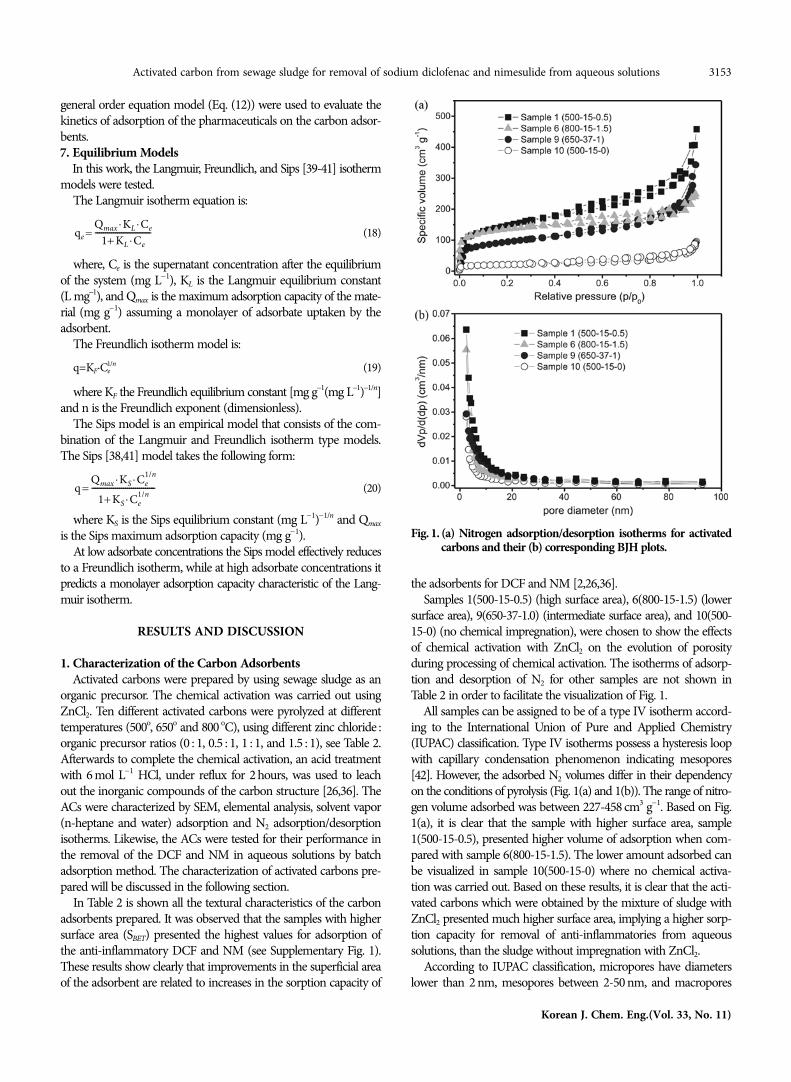
surface area), 9(650-37-1.0) (intermediate surface area), and 10(500-15-0) (no chemical impregnation), were chosen to show the effectsof chemical activation with ZnCl2 on the evolution of porosityduring processing of chemical activation. The isotherms of adsorp-tion and desorption of N2 for other samples are not shown inTable 2 in order to facilitate the visualization of Fig. 1.
All samples can be assigned to be of a type IV isotherm accord-ing to the International Union of Pure and Applied Chemistry(IUPAC) classification. Type IV isotherms possess a hysteresis loopwith capillary condensation phenomenon indicating mesopores[42]. However, the adsorbed N2 volumes differ in their dependencyon the conditions of pyrolysis (Fig. 1(a) and 1(b)). The range of nitro-gen volume adsorbed was between 227-458 cm3 g−1. Based on Fig.1(a), it is clear that the sample with higher surface area, sample1(500-15-0.5), presented higher volume of adsorption when com-pared with sample 6(800-15-1.5). The lower amount adsorbed canbe visualized in sample 10(500-15-0) where no chemical activa-tion was carried out. Based on these results, it is clear that the acti-vated carbons which were obtained by the mixture of sludge withZnCl2 presented much higher surface area, implying a higher sorp-tion capacity for removal of anti-inflammatories from aqueoussolutions, than the sludge without impregnation with ZnCl2.
According to IUPAC classification, micropores have diameterslower than 2 nm, mesopores between 2-50 nm, and macropores
qe = Qmax KL Ce⋅ ⋅
1+ KL Ce⋅----------------------------
q = Qmax KS Ce
1/n⋅ ⋅
1+ KS Ce1/n⋅
--------------------------------
Fig. 1. (a) Nitrogen adsorption/desorption isotherms for activatedcarbons and their (b) corresponding BJH plots.

3154 G. S. dos Reis et al.
November, 2016
higher than 50 nm [42]. All samples possess micropores and mes-opores as illustrated in the BJH plots (see Fig. 1(b)).
Structural heterogeneity and internal solid structure can be rep-resented by characterization of the pore size distribution [42]. Thepore size distribution visualized by BJH plots of the samples areshown in Fig. 1. By increasing the temperature of production of acti-vated carbon, the samples illustrated a sharp increase in the rangeof micropores.
The use of a scanning electron microscope (SEM) is one of themost versatile techniques available for the examination and analy-sis of microstructure morphology characterization, providing detailedsurface information such as shape and size of the particles. The SEMimages of samples without chemical treatment, sample 10(500-15-0); sample 1(500-15-0.5); sample 9(650-37-1.0); and sample 6(800-15-1.5) are presented in Fig. 2. The roughness of the carbon mate-rials is visible (see Fig. 2). The main difference in roughness con-cerns the lesser roughness of the non-washed samples comparedto the other chemically treated samples that possess higher rough-ness. This observation could be attributed to the acidic treatmentsof sample 1(500-15-0.5), sample 9(650-37-1.0) and sample 6(800-15-1.5) that were leached by HCl solution removing practically allthe inorganic contents of the samples, as already described in theliterature [2,26,36].
The surface polarity of adsorbents is important for interactionswith adsorbates that are solutes dissolved in solvents. n-Heptanevapor and water which present different polarities were used tocharacterize the surface of the adsorbents prepared within this
study, as shown in Fig. 3 for all materials. Fig. 3 shows the massratio of n-heptane:water uptaken by dried samples of the activatedcarbons. For all ACs the uptake of n-heptane (which shows mainlydispersive interaction) were higher than the uptake of water (whichis mainly polar) demonstrating that the more hydrophobic sur-faces of the activated carbons were present in the set of samples[43,44].
Fig. 2. SEM images of (a) sample 10(500-15-0); (b) sample 1(500-15-1.5); (c) sample 9(650-37-1.0); and (d) sample 6(800-15-1.5). For descrip-tion of samples see Table 2.
Fig. 3. Ratio of the maximum sorption capacities of water and n-heptane onto activated carbons.
Activated carbon from sewage sludge for removal of sodium diclofenac and nimesulide from aqueous solutions 3155
Korean J. Chem. Eng.(Vol. 33, No. 11)
Samples 6(800-15-1.5) and 8(800-60-1.5) presented higher n-heptane : water ratio for the whole set of preparation conditions ofACs. It may be inferred that higher temperature can influence sur-face characteristics with regards to hydrophobicity. The polarity ofthe carbon surface should decrease as activation temperature isincreased. The unique exception for this observation occurs forsample 2(800-15-0.5), which has practically the same hydropho-bic character of the surface of the activated carbon that was ob-tained for sample 1(500-15-0.5).
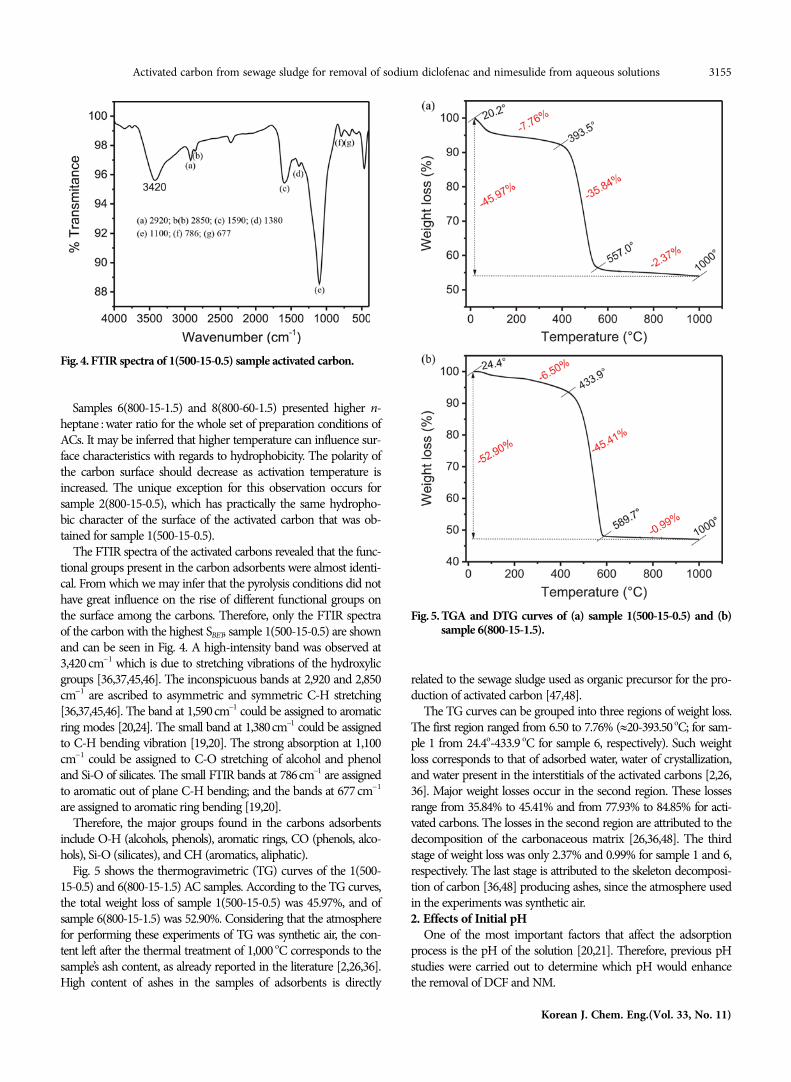
The FTIR spectra of the activated carbons revealed that the func-tional groups present in the carbon adsorbents were almost identi-cal. From which we may infer that the pyrolysis conditions did nothave great influence on the rise of different functional groups onthe surface among the carbons. Therefore, only the FTIR spectraof the carbon with the highest SBET, sample 1(500-15-0.5) are shownand can be seen in Fig. 4. A high-intensity band was observed at3,420 cm−1 which is due to stretching vibrations of the hydroxylicgroups [36,37,45,46]. The inconspicuous bands at 2,920 and 2,850cm−1 are ascribed to asymmetric and symmetric C-H stretching[36,37,45,46]. The band at 1,590 cm−1 could be assigned to aromaticring modes [20,24]. The small band at 1,380cm−1 could be assignedto C-H bending vibration [19,20]. The strong absorption at 1,100cm−1 could be assigned to C-O stretching of alcohol and phenoland Si-O of silicates. The small FTIR bands at 786cm−1 are assignedto aromatic out of plane C-H bending; and the bands at 677 cm−1
are assigned to aromatic ring bending [19,20].Therefore, the major groups found in the carbons adsorbents
include O-H (alcohols, phenols), aromatic rings, CO (phenols, alco-hols), Si-O (silicates), and CH (aromatics, aliphatic).
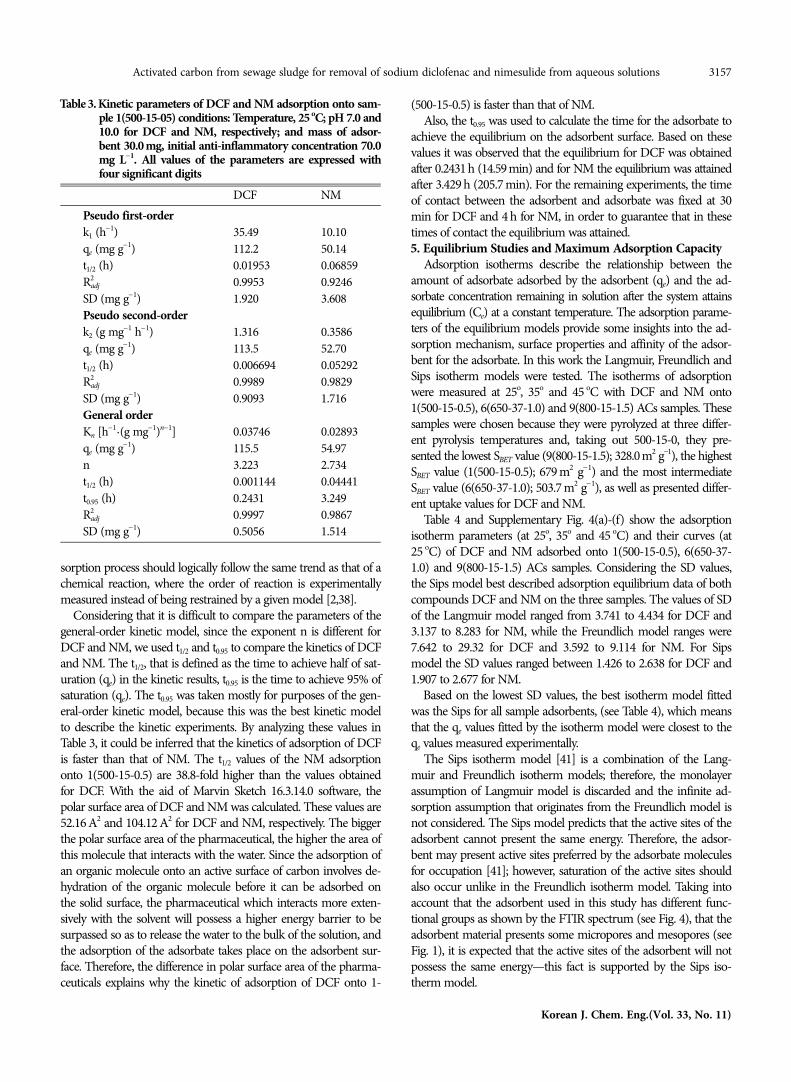
Fig. 5 shows the thermogravimetric (TG) curves of the 1(500-15-0.5) and 6(800-15-1.5) AC samples. According to the TG curves,the total weight loss of sample 1(500-15-0.5) was 45.97%, and ofsample 6(800-15-1.5) was 52.90%. Considering that the atmospherefor performing these experiments of TG was synthetic air, the con-tent left after the thermal treatment of 1,000 oC corresponds to thesample’s ash content, as already reported in the literature [2,26,36].High content of ashes in the samples of adsorbents is directly
related to the sewage sludge used as organic precursor for the pro-duction of activated carbon [47,48].
The TG curves can be grouped into three regions of weight loss.The first region ranged from 6.50 to 7.76% (≈20-393.50 oC; for sam-ple 1 from 24.4o-433.9 oC for sample 6, respectively). Such weightloss corresponds to that of adsorbed water, water of crystallization,and water present in the interstitials of the activated carbons [2,26,36]. Major weight losses occur in the second region. These lossesrange from 35.84% to 45.41% and from 77.93% to 84.85% for acti-vated carbons. The losses in the second region are attributed to thedecomposition of the carbonaceous matrix [26,36,48]. The thirdstage of weight loss was only 2.37% and 0.99% for sample 1 and 6,respectively. The last stage is attributed to the skeleton decomposi-tion of carbon [36,48] producing ashes, since the atmosphere usedin the experiments was synthetic air.2. Effects of Initial pH
One of the most important factors that affect the adsorptionprocess is the pH of the solution [20,21]. Therefore, previous pHstudies were carried out to determine which pH would enhancethe removal of DCF and NM.
Fig. 4. FTIR spectra of 1(500-15-0.5) sample activated carbon.
Fig. 5. TGA and DTG curves of (a) sample 1(500-15-0.5) and (b)sample 6(800-15-1.5).

3156 G. S. dos Reis et al.
November, 2016
Variations of adsorptions of DCF and NM onto 1(500-15-0.5)sample were investigated in the pH range 6-11 using HCl and/orNaOH to control pH. The effect of pH on DCF and NM remov-als was studied using 30.0 mg of AC in 20 ml of pharmaceuticalsolutions (50 mg L−1) at an adsorption time of 240 min to makesure that equilibrium was reached. Plots of pH versus removal (%)of DCF and NM at 25 oC are shown in Supplementary Fig. 2.
For DCF, the influence of the pH on the adsorption capacity onAC caused a decrease of the percentage of removal when the pHof solution was increased. On the other hand, for nimesulide, in-crease of pH of solution increased the amount adsorbed. For instance,at pH 7.0 the percentage removal of DCF was 91.22%, and at pH11 it decreased to 58.72%. However for NM the percentage re-moval at pH 7.0 was 72.32%, and at pH 11.0 it was 81.25%, reach-ing the highest percentage removal at pH 10.0 with 86.94%.
The difference of optimum pH for adsorption of DCF and NMcould be explained by the differences of their pKa values in water.The DCF has a pKa 4.00 and NM a pKa 6.70; these values werecalculated by the software Marvin Sketch 16.3.14.0. Therefore, atpH 7.0 and 10.0 for DCF and NM, respectively, these pharmaceu-ticals are deprotonated as anions. Positive groups of surface mate-rials could interact with such anions.
Therefore, on the basis of the above discussion, the optimumpH values for adsorption of DCF and NM onto ACs are pH 7.0and 10.0, respectively.
3. Effect of Adsorbent MassThe quantity or mass of adsorbent is an important factor in
large scale industrial application of adsorbent in the removal of adesired sorbate. The study of adsorbent mass is important in orderto avoid waste generation and minimize costs associated with theadsorption process [24,31].
The study of adsorbent dosages for the removal of DCF andNM from aqueous solution was carried out using quantities of1(500-15-0.5) sludge-activated carbon samples ranging from 5.0 to150.0 mg with a fixed volume of 20.0 mL of DFC and NM withan initial concentration of 50 mg L−1. The optimal adsorption forDCF was attained for a mass of 54.0 mg with 99.24% percentageof removal and q equal to 36.56 mg·g−1 (see Fig. 6(a)). However,for the next experiments a mass of 30.0 mg was chosen because atthat amount the percentage of removal was 96.34% and q equal to58.90 mg·g−1 (see Fig. 6(a)). This choice is justified because the useof 30 mg instead 54 mg leads an amount reduction of AC in theorder of 80% while the decrease of uptake (q) is just 2.91% (seeFig. 6(a)).
A similar trend was observed for NM adsorption, its optimaladsorption was reached at a mass of 60.0 mg with 95.70% percent-age of removal and with q equal to 34.68mg·g−1 (see Fig. 6(b)), whilea mass of 30.0 mg presented a percentage of removal of 92.56%and a sorption capacity of 47.45 mg g−1. Therefore, an increase of50% of the mass of the adsorbent led to an increase of only 3.14%of removal and a decrease of 26.91% on the sorption capacity.Therefore, the best mass for adsorption experiments was found tobe 30.0 mg for each adsorbent.4. Kinetic Studies
To investigate the mechanism of adsorption and potential rate-controlling steps such as chemical adsorption, diffusion controland mass transport processes, kinetic models have been used totest experimental data. These studies give valuable information foradsorption process design, operation control, and evaluation of theadsorbents [1,2,20,21].
Nonlinear pseudo-first order, pseudo-second order and general-order kinetic models were used to assess the kinetics of adsorp-tion of DCF and NM onto the activated carbon that presented thehigher surface area, sample 1(500-15-0.5). All other samples pre-sented the same trend for the kinetic studies and sample 1(500-15-0.5) was chosen to demonstrate the parameters of the kinetic mod-els, because it was considered the best adsorbent in this study as itpresented highest SBET and performance in uptake of the DCF andNM in aqueous solutions.
Table 3 and Supplementary Fig. 3 show the parameters and curves,respectively, of kinetic experiments performed to determine theequilibrium time required for the uptake of DCF and NM by sam-ple 1(500-15-0.5). The parameters of the curves were obtained byplotting the DCF and NM uptake capacity versus time at 70 mgL−1 initial concentration. Adsorption studies were carried out forperiods of times between 5 min and 10 hours.
Using the SD and the R2adj it can be concluded that the kinetic
data were best fitted by the general order kinetic model, as alreadyreported in the literature for several adsorbents and adsorbates[1,2,20,21,26,36,37,44,45].
The general-order kinetic model states that the order of an ad-Fig. 6. Effect of the mass of adsorbent on the % removal and sorp-
tion capacity (q) onto sample 1(500-15-0.5).
Activated carbon from sewage sludge for removal of sodium diclofenac and nimesulide from aqueous solutions 3157
Korean J. Chem. Eng.(Vol. 33, No. 11)
sorption process should logically follow the same trend as that of achemical reaction, where the order of reaction is experimentallymeasured instead of being restrained by a given model [2,38].
Considering that it is difficult to compare the parameters of thegeneral-order kinetic model, since the exponent n is different forDCF and NM, we used t1/2 and t0.95 to compare the kinetics of DCFand NM. The t1/2, that is defined as the time to achieve half of sat-uration (qe) in the kinetic results, t0.95 is the time to achieve 95% ofsaturation (qe). The t0.95 was taken mostly for purposes of the gen-eral-order kinetic model, because this was the best kinetic modelto describe the kinetic experiments. By analyzing these values inTable 3, it could be inferred that the kinetics of adsorption of DCFis faster than that of NM. The t1/2 values of the NM adsorptiononto 1(500-15-0.5) are 38.8-fold higher than the values obtainedfor DCF. With the aid of Marvin Sketch 16.3.14.0 software, thepolar surface area of DCF and NM was calculated. These values are52.16 A2 and 104.12 A2 for DCF and NM, respectively. The biggerthe polar surface area of the pharmaceutical, the higher the area ofthis molecule that interacts with the water. Since the adsorption ofan organic molecule onto an active surface of carbon involves de-hydration of the organic molecule before it can be adsorbed onthe solid surface, the pharmaceutical which interacts more exten-sively with the solvent will possess a higher energy barrier to besurpassed so as to release the water to the bulk of the solution, andthe adsorption of the adsorbate takes place on the adsorbent sur-face. Therefore, the difference in polar surface area of the pharma-ceuticals explains why the kinetic of adsorption of DCF onto 1-
(500-15-0.5) is faster than that of NM.Also, the t0.95 was used to calculate the time for the adsorbate to
achieve the equilibrium on the adsorbent surface. Based on thesevalues it was observed that the equilibrium for DCF was obtainedafter 0.2431 h (14.59 min) and for NM the equilibrium was attainedafter 3.429 h (205.7 min). For the remaining experiments, the timeof contact between the adsorbent and adsorbate was fixed at 30min for DCF and 4 h for NM, in order to guarantee that in thesetimes of contact the equilibrium was attained.5. Equilibrium Studies and Maximum Adsorption Capacity
Adsorption isotherms describe the relationship between theamount of adsorbate adsorbed by the adsorbent (qe) and the ad-sorbate concentration remaining in solution after the system attainsequilibrium (Ce) at a constant temperature. The adsorption parame-ters of the equilibrium models provide some insights into the ad-sorption mechanism, surface properties and affinity of the adsor-bent for the adsorbate. In this work the Langmuir, Freundlich andSips isotherm models were tested. The isotherms of adsorptionwere measured at 25o, 35o and 45 oC with DCF and NM onto1(500-15-0.5), 6(650-37-1.0) and 9(800-15-1.5) ACs samples. Thesesamples were chosen because they were pyrolyzed at three differ-ent pyrolysis temperatures and, taking out 500-15-0, they pre-sented the lowest SBET value (9(800-15-1.5); 328.0 m2 g−1), the highestSBET value (1(500-15-0.5); 679 m2 g−1) and the most intermediateSBET value (6(650-37-1.0); 503.7 m2 g−1), as well as presented differ-ent uptake values for DCF and NM.
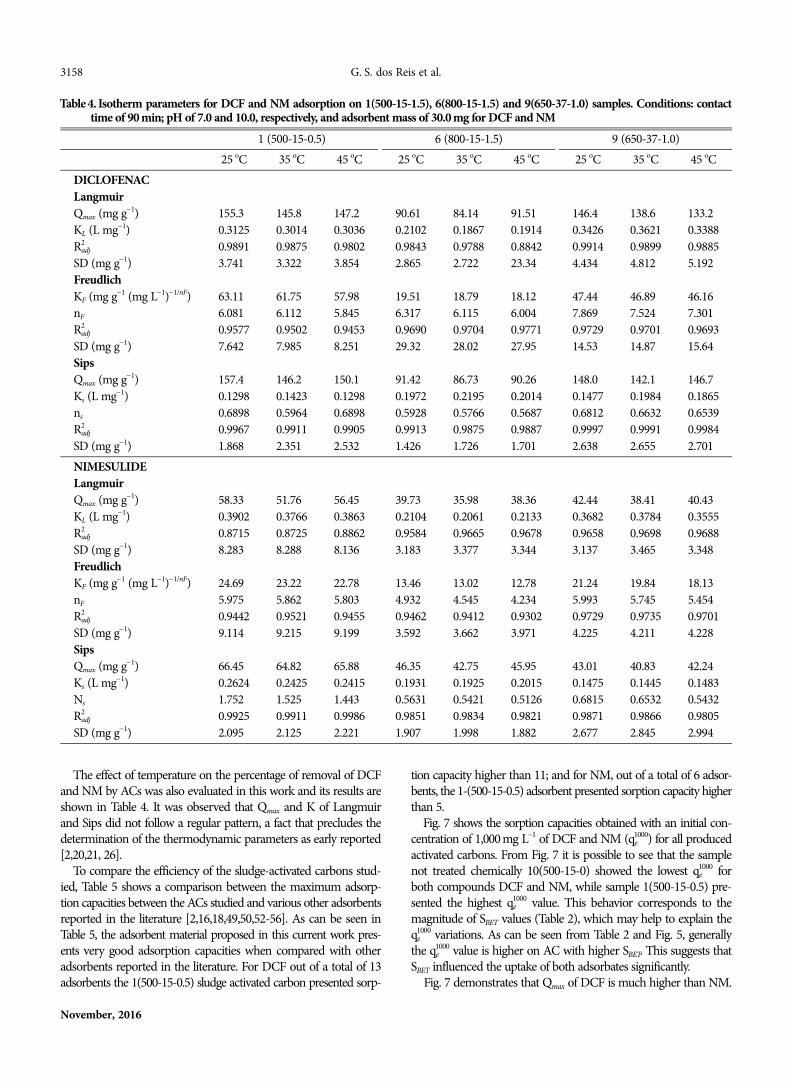
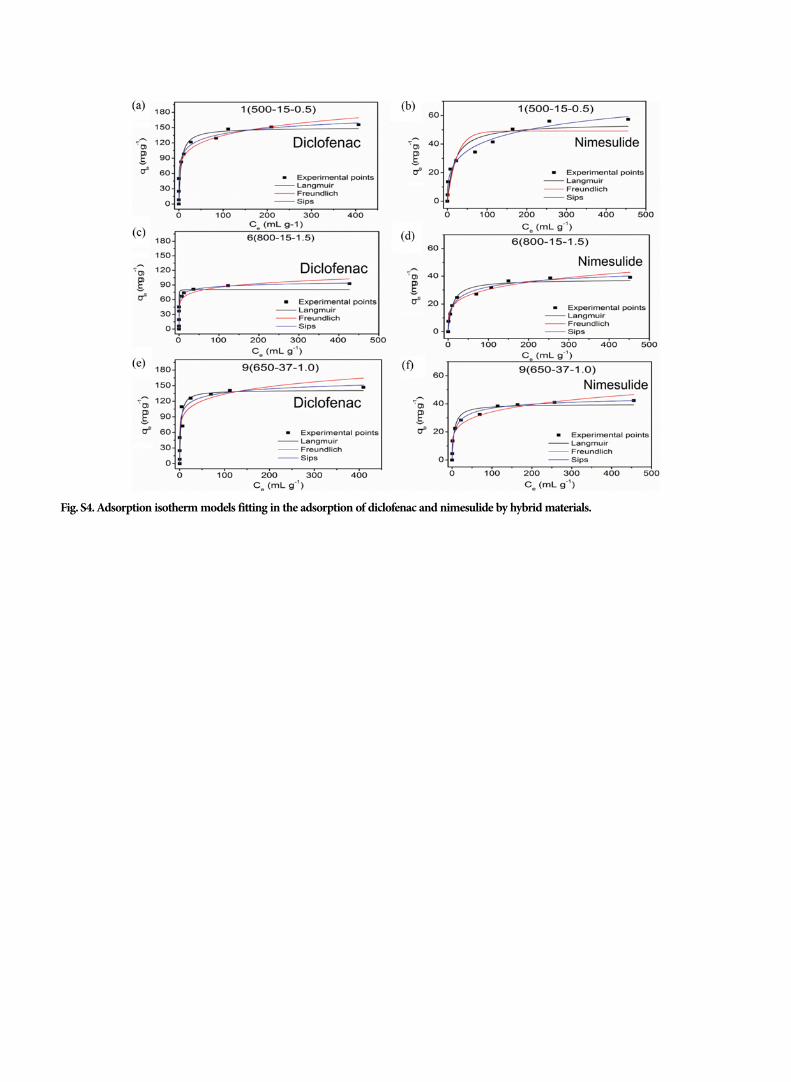
Table 4 and Supplementary Fig. 4(a)-(f) show the adsorptionisotherm parameters (at 25o, 35o and 45 oC) and their curves (at25 oC) of DCF and NM adsorbed onto 1(500-15-0.5), 6(650-37-1.0) and 9(800-15-1.5) ACs samples. Considering the SD values,the Sips model best described adsorption equilibrium data of bothcompounds DCF and NM on the three samples. The values of SDof the Langmuir model ranged from 3.741 to 4.434 for DCF and3.137 to 8.283 for NM, while the Freundlich model ranges were7.642 to 29.32 for DCF and 3.592 to 9.114 for NM. For Sipsmodel the SD values ranged between 1.426 to 2.638 for DCF and1.907 to 2.677 for NM.
Based on the lowest SD values, the best isotherm model fittedwas the Sips for all sample adsorbents, (see Table 4), which meansthat the qe values fitted by the isotherm model were closest to theqe values measured experimentally.
The Sips isotherm model [41] is a combination of the Lang-muir and Freundlich isotherm models; therefore, the monolayerassumption of Langmuir model is discarded and the infinite ad-sorption assumption that originates from the Freundlich model isnot considered. The Sips model predicts that the active sites of theadsorbent cannot present the same energy. Therefore, the adsor-bent may present active sites preferred by the adsorbate moleculesfor occupation [41]; however, saturation of the active sites shouldalso occur unlike in the Freundlich isotherm model. Taking intoaccount that the adsorbent used in this study has different func-tional groups as shown by the FTIR spectrum (see Fig. 4), that theadsorbent material presents some micropores and mesopores (seeFig. 1), it is expected that the active sites of the adsorbent will notpossess the same energy—this fact is supported by the Sips iso-therm model.
Table 3. Kinetic parameters of DCF and NM adsorption onto sam-ple 1(500-15-05) conditions: Temperature, 25 oC; pH 7.0 and10.0 for DCF and NM, respectively; and mass of adsor-bent 30.0 mg, initial anti-inflammatory concentration 70.0mg L−1. All values of the parameters are expressed withfour significant digits
DCF NMPseudo first-orderk1 (h−1) 35.49 10.10qe (mg g−1) 112.2 50.14t1/2 (h) 0.01953 0.06859R2
adj 0.9953 0.9246SD (mg g−1) 1.920 3.608Pseudo second-orderk2 (g mg−1 h−1) 1.316 0.3586qe (mg g−1) 113.5 52.70t1/2 (h) 0.006694 0.05292R2
adj 0.9989 0.9829SD (mg g−1) 0.9093 1.716General orderKn [h−1·(g mg−1)n−1] 0.03746 0.02893qe (mg g−1) 115.5 54.97n 3.223 2.734t1/2 (h) 0.001144 0.04441t0.95 (h) 0.2431 3.249R2
adj 0.9997 0.9867SD (mg g−1) 0.5056 1.514
3158 G. S. dos Reis et al.
November, 2016
The effect of temperature on the percentage of removal of DCFand NM by ACs was also evaluated in this work and its results areshown in Table 4. It was observed that Qmax and K of Langmuirand Sips did not follow a regular pattern, a fact that precludes thedetermination of the thermodynamic parameters as early reported[2,20,21, 26].
To compare the efficiency of the sludge-activated carbons stud-ied, Table 5 shows a comparison between the maximum adsorp-tion capacities between the ACs studied and various other adsorbentsreported in the literature [2,16,18,49,50,52-56]. As can be seen inTable 5, the adsorbent material proposed in this current work pres-ents very good adsorption capacities when compared with otheradsorbents reported in the literature. For DCF out of a total of 13adsorbents the 1(500-15-0.5) sludge activated carbon presented sorp-
tion capacity higher than 11; and for NM, out of a total of 6 adsor-bents, the 1-(500-15-0.5) adsorbent presented sorption capacity higherthan 5.
Fig. 7 shows the sorption capacities obtained with an initial con-centration of 1,000 mg L−1 of DCF and NM (qe
1000) for all producedactivated carbons. From Fig. 7 it is possible to see that the samplenot treated chemically 10(500-15-0) showed the lowest qe
1000 forboth compounds DCF and NM, while sample 1(500-15-0.5) pre-sented the highest qe
1000 value. This behavior corresponds to themagnitude of SBET values (Table 2), which may help to explain theqe
1000 variations. As can be seen from Table 2 and Fig. 5, generallythe qe
1000 value is higher on AC with higher SBET. This suggests thatSBET influenced the uptake of both adsorbates significantly.
Fig. 7 demonstrates that Qmax of DCF is much higher than NM.
Table 4. Isotherm parameters for DCF and NM adsorption on 1(500-15-1.5), 6(800-15-1.5) and 9(650-37-1.0) samples. Conditions: contacttime of 90 min; pH of 7.0 and 10.0, respectively, and adsorbent mass of 30.0 mg for DCF and NM
1 (500-15-0.5) 6 (800-15-1.5) 9 (650-37-1.0)25 oC 35 oC 45 oC 25 oC 35 oC 45 oC 25 oC 35 oC 45 oC
DICLOFENACLangmuirQmax (mg g−1) 155.3 145.8 147.2 90.61 84.14 91.51 146.4 138.6 133.2KL (L mg−1) 0.3125 0.3014 0.3036 0.2102 0.1867 0.1914 0.3426 0.3621 0.3388R2
adj 0.9891 0.9875 0.9802 0.9843 0.9788 0.8842 0.9914 0.9899 0.9885SD (mg g−1) 3.741 3.322 3.854 2.865 2.722 23.34 4.434 4.812 5.192FreudlichKF (mg g−1 (mg L−1)−1/nF) 63.11 61.75 57.98 19.51 18.79 18.12 47.44 46.89 46.16nF 6.081 6.112 5.845 6.317 6.115 6.004 7.869 7.524 7.301R2
adj 0.9577 0.9502 0.9453 0.9690 0.9704 0.9771 0.9729 0.9701 0.9693SD (mg g−1) 7.642 7.985 8.251 29.32 28.02 27.95 14.53 14.87 15.64SipsQmax (mg g−1) 157.4 146.2 150.1 91.42 86.73 90.26 148.0 142.1 146.7Ks (L mg−1) 0.1298 0.1423 0.1298 0.1972 0.2195 0.2014 0.1477 0.1984 0.1865ns 0.6898 0.5964 0.6898 0.5928 0.5766 0.5687 0.6812 0.6632 0.6539R2
adj 0.9967 0.9911 0.9905 0.9913 0.9875 0.9887 0.9997 0.9991 0.9984SD (mg g−1) 1.868 2.351 2.532 1.426 1.726 1.701 2.638 2.655 2.701NIMESULIDELangmuirQmax (mg g−1) 58.33 51.76 56.45 39.73 35.98 38.36 42.44 38.41 40.43KL (L mg−1) 0.3902 0.3766 0.3863 0.2104 0.2061 0.2133 0.3682 0.3784 0.3555R2
adj 0.8715 0.8725 0.8862 0.9584 0.9665 0.9678 0.9658 0.9698 0.9688SD (mg g−1) 8.283 8.288 8.136 3.183 3.377 3.344 3.137 3.465 3.348FreudlichKF (mg g−1 (mg L−1)−1/nF) 24.69 23.22 22.78 13.46 13.02 12.78 21.24 19.84 18.13nF 5.975 5.862 5.803 4.932 4.545 4.234 5.993 5.745 5.454R2
adj 0.9442 0.9521 0.9455 0.9462 0.9412 0.9302 0.9729 0.9735 0.9701SD (mg g−1) 9.114 9.215 9.199 3.592 3.662 3.971 4.225 4.211 4.228SipsQmax (mg g−1) 66.45 64.82 65.88 46.35 42.75 45.95 43.01 40.83 42.24Ks (L mg−1) 0.2624 0.2425 0.2415 0.1931 0.1925 0.2015 0.1475 0.1445 0.1483Ns 1.752 1.525 1.443 0.5631 0.5421 0.5126 0.6815 0.6532 0.5432R2
adj 0.9925 0.9911 0.9986 0.9851 0.9834 0.9821 0.9871 0.9866 0.9805SD (mg g−1) 2.095 2.125 2.221 1.907 1.998 1.882 2.677 2.845 2.994

Activated carbon from sewage sludge for removal of sodium diclofenac and nimesulide from aqueous solutions 3159
Korean J. Chem. Eng.(Vol. 33, No. 11)
Also the rate of adsorption of DCF was faster than that of NMaccording to t1/2 (see Table 3). The higher affinity of sludge activatedcarbons by DCF rather than NM could be linked to their differ-ences in chemical properties. The van der Waals surface area ofDCF and NM was 359.64 A2 and 406.46 A2, respectively (see Table1), while the polar surface area of DCF and NM was 52.16 A2 and104.12 A2, respectively (see Table 1). Performing the division ofpolar surface area by van der Waals surface area and multiplyingby 100, the percentage of polar area in relation to the total area ofDCF is 14.50% and for NM is 25.62%. Considering that the acti-vated carbons are hydrophobic, as can be seen in Fig. 3, it is ex-pected that DCF would have higher affinity of the hydrophobicsurface of the activated carbon when compared with NM.6. Adsorption Mechanism
Based on the combined data of characterization of materials aswell as the kinetic and equilibrium studies, it is possible to suggestmechanisms for adsorption of DCF and NM onto AC adsorbents.The adsorption process involves physical interactions such as vander Waals interactions, hydrogen bonding and π-π interactions of
the aromatic ring of the adsorbent with the aromatic rings of thepharmaceuticals. The aromatic rings of pharmaceuticals interactwith the phenyl, OH, C=O and COOH groups of the ACs throughπ-π interactions as shown in Fig. 8.
CONCLUSION
Activated carbons have been prepared using sewage sludge asstarting material and a conventional furnace pyrolysis for heat treat-ment. The powdered sewage sludge and ZnCl2 were mixed in dif-ferent proportions at room temperature. The mixture was heatedat three different temperatures, 500o, 650o and 800 oC, under inertconditions. The carbonized materials were treated with a 6 mol L−1
HCl and refluxed for 3 h to obtain chemically activated ACs. Theacidification process leached the inorganics from the carbona-ceous matrix, which was confirmed by BET surface area and SEMtechniques. According to water and n-heptane adsorption, thesamples of ACs were hydrophobic. The sample 1(500-15-0.5) wasidentified to be the best adsorbent for the removal of DCF and
Table 5. Comparison of adsorption capacities of different adsorbents for DCF and NMAdsorption capacity (mg g−1)
Adsorbent DCF NM ReferenceActivated carbon from cocoa shell 63.47 74.810 0[2]PAC 372.000 - [16]PAC 233.900 - [18]Modified chitosan 09.33 - [49]Functionalized silica 35.59 - [50]Composite adsorbent 27.18 14.550 [52]Hybrid adsorbent 41.43 26.120 [52]Sludge activated carbon 16.27 09.438 [52]Multi-walled carbon nanotubes 008.640 - [53]Carbon xerogels 80.00 - [54]PAC 40.55 - [55]Mesoporous silica (SBA-15) 34.18 - [56]Silica aerogel - 14.180 [56]1 (500-15-0.5) sludge activated carbon 157.400 66.450 This work
Fig. 7. Adsorption capacity of 1,000 mg L−1 (qe1000) of DCF and NM onto sludge based activated carbons at 25 oC.

3160 G. S. dos Reis et al.
November, 2016
NM from aqueous solutions. Adsorption capacity of the ACs pro-duced within this work is among the highest of many works foundin literature. At 25 oC, it was observed that the equilibrium for DCFwas obtained after 0.2431h (14.59min) and for NM the equilibriumwas attained after 3.429 h (205.7 min). The general-order kineticmodel best described the adsorption process, because the order ofadsorption was experimentally measured instead of being restrictedby a given model. Sips isotherm model gave the best fit of isother-mal data, showing that an adsorption process should occur in mul-tiple sites of the activated carbon. The maximum amounts (Qmax)of DCF and NM adsorbed were 157.4 and 66.45 mg g−1 for 1(500-15-0.5), respectively.
ACKNOWLEDGEMENTS
The authors thank the National Council for Scientific and Tech-nological Development (CNPq, Brazil), the Coordination of Im-provement of Higher Education Personnel (CAPES, Brazil), andthe German Academic Exchange Service (DAAD, Germany) forfinancial support, fellowships, grants and technical support. We thankChemaxon for giving an academic research license for the MarvinSketch software, Version 16.3.14.0, (http://www.chemaxon.com),2016 used for the pharmaceuticals physical-chemical properties.
SUPPORTING INFORMATION
Additional information as noted in the text. This information isavailable via the Internet at http://www.springer.com/chemistry/journal/11814.
REFERENCES
1. S. Rovani, M. T. Censi, S. L. Pedrotti-Jr., E. C. Lima, R. Cataluña andA. N. Fernandes, J. Hazard. Mater., 271, 311 (2014).
2. C. Saucier, M. A. Adebayo, E. C. Lima, R. Cataluna, P. S. Thuea,P. D. T. Lizie, P.-M. J. Rosero, F. M. Machado, F. A. Pavan and G. L.
Dotto, J. Hazard. Mater., 289, 18 (2015).3. R. Gothwal and T. Shashidhar, Clean - Soil Air Water, 43, 479 (2015).4. L. Prieto-Rodríguez, I. Oller, N. Klamerth, A. Agüera, E. M. Rodrí-
guez and S. Malato, Water Res., 47, 1521 (2013).5. N. Bolong, A. F. Ismail, M. R. Salim and T. Matsuura, Desalina-
tion, 239, 229 (2009).6. H. J. Lee, E. Lee, S. H. Yoon, H. R. Chang, K. Kim and J. H. Kwon,
Chemosphere, 87, 969 (2012).7. Y. Li, G. Zhu, W. J. Ng and S. K. Tan, Sci. Total Environ., 468-469,
908 (2014).8. N. Han, T. Taro, U. Thi and T. Ta, Clean - Soil Air Water, 42, 267
(2014).9. E. Geiger, R. Hornek-Gausterer and M. T. Saçan, Ecotoxicol. Envi-
ron. Saf., 129, 189 (2016).10. R. Feito, Y. Valcárcel and M. Catalá, Ecotoxicology, 21, 289 (2012).11. M. Boonsaner and D. W. Hawker, Chemosphere, 122, 176 (2015).12. C. Sheng, A. G. A. Nnann, Y. Liu and J. D. Vargo, Sci. Total Envi-
ron., 550, 1075 (2016).13. J. B. Parsa, T. M. Panah and F. N. Chianeh, Korean J. Chem. Eng.,
33, 893 (2016).14. W. Gebhardt and H. F. Schroder, J. Chromatogr. A, 1160, 34 (2007).15. S. Suarez, J. M. Lema and F. Omil, Bioresour. Technol., 100, 2138
(2009).16. C. Jung, L. K. Boateng, J. R. V. Flora, J. Oh, M. C. Braswell, A. Son
and Y. Yoon, Chem. Eng. J., 264, 1 (2015).17. L. R. Rad, M. Irani and R. Barzegar, Korean J. Chem. Eng., 32, 1606
(2015).18. J. L. Sotelo, G. Ovejero, A. Rodríguez, S. Álvarez, J. Galán and J.
García, Chem. Eng. J., 240, 443 (2014).19. G. L. Dotto, E. C. Lima and L. A. A. Pinto, Bioresour. Technol., 103,
123 (2012).20. L. D. T. Prola, E. Acayanka, E. C. Lima, C. S. Umpierres, J. C. P.
Vaghetti, W. O. Santos, S. Laminsi and P. T. Njifon, Ind. Crop Prod.,46, 328 (2013).
21. D. C. dos Santos, M. A. Adebayo, S. F. P. Pereira, L. D. T. Prola, R.Cataluña, E. C. Lima, C. Saucier, C. R. Gally and F. M. Machado,
Fig. 8. Adsorption mechanism of DCF and NM onto AC.
Activated carbon from sewage sludge for removal of sodium diclofenac and nimesulide from aqueous solutions 3161
Korean J. Chem. Eng.(Vol. 33, No. 11)
Korean J. Chem. Eng., 31, 1470 (2014).22. S. Sadaf and H. N. Bhatti, Clean Technol. Environ. Policy., 16, 527
(2014).23. G. S. dos Reis, M. Wilhelm, T. C. A. Silva, K. Rezwan, C. H. Sam-
paio, E. C. Lima and S. M. A. G. U. Souza, Appl. Therm. Eng., 93,590 (2016).
24. T. Calvete, E. C. Lima, N. F. Cardoso, J. C. P. Vaghetti, S. L. P. Diasand F. A. Pavan, J. Environ. Manage., 91, 1695 (2010).
25. H. Marsh and F. R. Reinoso, Activated Carbon. Elsevier, Amster-dam (2006).
26. M. C. Ribas, M. A. Adebayo, L. D. T. Prola, E. C. Lima, R. Cata-luña, L. A. Feris, M. J. Puchana, F. M. Machado, F. A. Pavan and T.Calvete, Chem. Eng. J., 248, 315 (2014).
27. S. Brunauer, P. H. Emmett and E. Teller, J. Am. Chem. Soc., 60, 309(1938).
28. E. P. Barrett, I. G. Joyner and P. P. Halend, J. Am. Chem. Soc., 73,373 (1951).
29. L. Leng, X. Yuana, H. Huang, J. Shao, H. Wang, X. Chen and G.Zeng, Appl. Surf. Sci., 346, 223 (2015).
30. A. V. Maldhure and J. D. Ekhe, Chem. Eng. J., 168, 1103 (2011).31. T. Calvete, E. C. Lima, N. F. Cardoso, S. L. P. Dias and E. S. Ribeiro,
Clean: Air, Soil, Water, 38, 521 (2010).32. E. C. Lima, F. Barbosa-Jr., F. J. Krug and U. Guaita, J. Anal. Atom.
Spectrom., 14, 1601 (1999).33. E. C. Lima, F. Barbosa-Jr., F. J. Krug and A. Tavares, Talanta, 57, 177
(2002).34. E. C. Lima, F. J. Krug, J. A. Nóbrega and A. R. A. Nogueira, Talanta,
47, 613 (1998).35. E. C. Lima, P. G. Fenga, J. R. Romero and W. F. de Giovani, Polyhe-
dron, 17, 313 (1998).36. C. Saucier, M. A. Adebayo, E. C. Lima, L. D. T. Prola, P. S. Thue,
C. S. Umpierres, M. J. Puchana-Rosero and F. M. Machado, Clean.,43, 1389 (2015).
37. W. S. Alencar, E. C. Lima, B. Royer, B. D. dos Santos, T. Calvete,
E. A. da Silva and C. N. Alves, Sep. Sci. Technol., 47, 513 (2012).38. E. C. Lima, M. A. Adebayo and F. M Machado, Chapter 3- Kinetic
and Equilibrium Models of Adsorption in Carbon Nanomaterials asAdsorbents for Environmental and Biological Applications, C. P.Bergmann and F. M. Machado, Eds., Springer (2015).
39. I. Langmuir, J. Am. Chem. Soc., 40, 1361 (1918).40. H. Freundlich, Phys. Chem. Soc., 40, 1361 (1906).41. R. Sips, J. Chem. Phys., 16, 490 (1948).42. P. B. Balbuenat and K. E. Gubbins, Langmuir, 9, 1801 (1993).43. T. Prenzel, T. L. M. Guedes, F. Schluter, M. Wilhelm and K. Rez-
wan, Sep. Purif. Technol., 129, 80 (2014).44. S. W. Nam, D. J. Choi, S. K. Kim, N. Her and K. D. Zoh, J. Hazard.
Mater., 270, 144 (2014).45. S. Biniak, G. Szymanski, J. Siedlewski and A. Swiatkowski, Car-
bon, 35, 1799 (1997).46. Y. Otake and R. G. Jenkins, Carbon, 31, 109 (1993).47. K. M. Smith, G. D. Fowler, S. Pullket and N. D. J. Graham, Water
Res., 43, 2569 (2009).48. G. B. Gasco, C. G. Guerrero, F. Mendez and A. M. Lazaro, J. Anal.
Appl. Pyrol., 74, 413 (2005).49. K. A. A. Pereira, L. R. Osório, M. P. Silva, K. S. Sousa and E. C. S.
Filho, Mat. Res., 17, 1516 (2014).50. N. Suriyanon, P. Punyapalakul and C. Ngamcharussrivichai, Chem.
Eng. J., 214, 208 (2013).51. T. X. Bui and H. Choi, J. Hazard. Mater., 168, 602 (2009).52. G. S. dos Reis, C. H. Sampaio, E. C. Lima and M. Wilhelm, Col-
loids Surf. A Physicochem. Eng. Asp., 497, 304 (2016).53. X. Hu and Z. Cheng, Chin. J. Chem. Eng., 23, 1551 (2015).54. S. Álvarez, R. S. Ribeiro, H. T. Gomes, J. L. Sotelo and J. García,
Chem. Eng. Res. Des., 95, 229 (2015).55. C. M. Dai, S. U. Geissen, Y. L. Zhang, Y. J. Zhang and X. F. Zhou,
Environ. Pollut., 159, 1660 (2011).56. G. Caputo, M. Scognamiglio and I. De Marco, Chem. Eng. Res.
Des., 90, 1082 (2012).

3162 G. S. dos Reis et al.
November, 2016
Supporting Information
Activated carbon from sewage sludge for removal of sodium diclofenacand nimesulide from aqueous solutions
Glaydson Simões dos Reis*,**
,†, Mohammad Khalid Bin Mahbub**, Michaela Wilhelm**, Eder Claudio Lima***,Carlos Hoffmann Sampaio*, Caroline Saucier***, and Silvio Luis Pereira Dias***
*Department of Metallurgical Engineering, Federal University of Rio Grande do Sul (UFRGS),Av. Bento Gonçalves 9500, Porto Alegre, RS, Brazil
**University of Bremen, Advanced Ceramics, Am Biologischen Garten 2, IW3, 28359 Bremen, Germany***Institute of Chemistry, Federal University of Rio Grande do Sul (UFRGS), Av. Bento Gonçalves 9500,
Postal Box 15003, ZIP 91501-970, Porto Alegre, RS, Brazil(Received 5 February 2016 • accepted 2 July 2016)
Fig. S2. Dependence of pH on the sorption capacity of DCF andNM pharmaceuticals on 1(500-15-0.5). Conditions: tempera-ture, 25 oC; adsorbent mass, 20.0 mg; adsorbent 25 oC phar-maceutical concentration, 50.0 mg L.
Fig. S3. Adsorption kinetic models fitting in the adsorption of di-clofenac and nimesulide onto 1(500-15-0.5) sample.
Fig. S1. Adsorption isotherm models fitting in the adsorption ofdiclofenac and nimesulide by hybrid materials.
Activated carbon from sewage sludge for removal of sodium diclofenac and nimesulide from aqueous solutions 3163
Korean J. Chem. Eng.(Vol. 33, No. 11)
Fig. S4. Adsorption isotherm models fitting in the adsorption of diclofenac and nimesulide by hybrid materials.


![pISSN: 0256-1115 DOI: 10.1007/s11814-017-0004-6 INVITED ... · the tray properly. In this article, by using commercial CFX code and based on the experimental work [22] a CFD model](https://static.fdocuments.us/doc/165x107/5eac432fdcaa19699f34fbe7/pissn-0256-1115-doi-101007s11814-017-0004-6-invited-the-tray-properly-in.jpg)


