PISA-BASED TEST FOR SCHOOLS TECHNICAL … Test for Schools...This is a balanced incomplete block...
66
PISA-BASED TEST FOR SCHOOLS TECHNICAL REPORT (DRAFT)
-
Upload
phungnguyet -
Category
Documents
-
view
217 -
download
0
Transcript of PISA-BASED TEST FOR SCHOOLS TECHNICAL … Test for Schools...This is a balanced incomplete block...

PISA-BASED TEST FOR SCHOOLS
TECHNICAL REPORT (DRAFT)
2
TABLE OF CONTENTS
PISA-BASED TEST FOR SCHOOLS TECHNICAL REPORT ................................................. 1
TABLE OF CONTENTS .............................................................................................................. 2
1. PISA-based Test for Schools: An overview ....................................................................... 6
a. Features of the PISA-based Test for Schools.................................................................. 6
b. Managing and implementing the PTS: Overview of roles and responsibilities .............. 7
c. Structure of this report .................................................................................................... 8
PART 1: INSTRUMENT DESIGN .............................................................................................. 9
2. Test design, scope and development ................................................................................ 10
a. Test design .................................................................................................................... 10
b. Test scope ..................................................................................................................... 10
c. Test development .......................................................................................................... 11
d. Reporting PTS results on PISA scales .......................................................................... 12
3. Context Questionnaires .................................................................................................... 14
a. Student Questionnaire ................................................................................................... 14
b. School Questionnaire .................................................................................................... 15
PART 2: OPERATIONS ............................................................................................................. 17
4. Overview of the roles and responsibilities ....................................................................... 18
a. School Co-ordinators .................................................................................................... 18
b. Test Administrators ....................................................................................................... 18
5. Preparing for implementation ........................................................................................... 20
a. Translation, adaptation and verification of the test and survey material ...................... 20
b. Field trial participation and outcomes ........................................................................... 22
6. Field operations ................................................................................................................ 24
3
a. School and student eligibility to participate in the survey ............................................ 24
b. Sampling ....................................................................................................................... 25
c. Packaging and shipping materials ................................................................................. 27
d. Receipt of materials by the National Service Provider after testing ............................. 27
e. Coding of the cognitive test and of the context questionnaires .................................... 27
f. Coding the test booklets ................................................................................................ 28
g. Student questionnaire coding ........................................................................................ 29
h. School questionnaire coding ......................................................................................... 29
PART 3: DATA PROCESSING ................................................................................................. 30
7. Constructing the initial PTS database ............................................................................... 31
a. Files in the initial PTS database .................................................................................... 31
b. Records in the database ................................................................................................. 32
c. Representing missing data ............................................................................................ 33
d. Merging the data files ................................................................................................... 33
8. Procedures for scaling cognitive data ............................................................................... 34
a. The mixed coefficients multinomial logit model .......................................................... 34
b. Application to PTS ........................................................................................................ 37
9. Procedures for constructing contextual variables ............................................................. 43
a. Overview ....................................................................................................................... 43
b. Simple questionnaire variables ..................................................................................... 43
c. Questionnaire scale indices ........................................................................................... 44
d. Disciplinary climate in mathematics ............................................................................. 48
e. Other complex questionnaire variables ......................................................................... 49
10. Survey weighting (the balanced repeated replication method) ..................................... 52
a. The balanced repeated replication method .................................................................... 52
b. The sampling variance estimator .................................................................................. 53

4
11. Statistical procedures for generating school report results ........................................... 54
a. Univariate statistics for context variables ..................................................................... 54
b. Students average scores and their standard errors ........................................................ 55
c. Reporting and reviewing school-level data ................................................................... 59
PART 4: SCHOOL REPORT ..................................................................................................... 60
1. Supporting the preparation of a national version of the school report template ............... 61
a. Proposal for adaptations ................................................................................................ 61
b. Translation of the template ........................................................................................... 62
2. Production of the school report eBooks ........................................................................... 62
a. Automatizing the school report production .................................................................. 62
b. Receiving OECD’s approval on the eBooks ................................................................. 63
REFERENCES ............................................................................................................................ 64
BOXES
Box 1: ConQuest® syntax for running the item analyses on the reading test ....................................... 37
Box 2: ConQuest® syntax for generating the plausible values in reading ............................................ 41
Box 3: ConQuest® syntax for generating the WLEs of the MATHEFF scale ..................................... 46
Box 4: Contents of the item parameter file matheff.prm ....................................................................... 46
Box 5: First six lines of the WLE file matheff.wle ............................................................................... 47
FIGURES
Figure 1: Example of scatter plot .......................................................................................................... 39
Figure 2: How the reading process can be characterised ...................................................................... 50
Figure 3: Profile of readers .................................................................................................................... 50
Figure 4: Latent profile analysis with two categorical latent variables ................................................. 51

5
TABLES
Table 1: Cluster rotation design used to form test booklets for PTS ..................................................... 10
Table 2: Item types ................................................................................................................................ 11
Table 3: Number of items ...................................................................................................................... 12
Table 4: Lower score limits for the proficiency levels in reading, mathematics and science ............... 42
Table 5: Mapping of ISCED to years .................................................................................................... 44
Table 6: OECD means and standard deviations of Weighted Likelihood Estimates (WLEs) .............. 45
Table 7: Item parameters for mathematics self-efficacy (MATHEFF) ................................................. 45
Table 8: Item parameters for instrumental motivation for mathematics (INSTMOT) .......................... 47
Table 9: Item parameters for science self-efficacy (SCIEEFF) ............................................................ 47
Table 10: Item parameters for instrumental motivation to learn science (INSTSCIE) ......................... 47
Table 11: Item parameters for disciplinary climate in language of instruction (DISCLIMA, PISA
2009).............................................................................................................................................. 48
Table 12: Item parameters for disciplinary climate in mathematics (DISCLIM, PISA 2012) .............. 48
Table 13: Item parameters for teacher-student relations (STUDREL).................................................. 48
Table 14: Home possession items ......................................................................................................... 49
Table 15: International item parameters for HOMEPOS ...................................................................... 49
Table 16: National item parameters for HOMEPOS ............................................................................. 49
Table 17: Factor loadings for OECD countries ..................................................................................... 49
Table 18: Factor loadings for partner countries and economies ............................................................ 50
Table 19: Hadamard Matrix .................................................................................................................. 53
Table 20: Replicates for the Balanced Repeated Replicate method ...................................................... 53
Table 21: The 405 mean estimates ........................................................................................................ 56
Table 22: Link error estimates............................................................................................................... 57

6
1. PISA-based Test for Schools: An overview
a. Features of the PISA-based Test for Schools
The PISA-based Test for Schools (PTS) is a student assessment tool geared for use by schools
and networks of schools to support research, international benchmarking and school improvement
efforts. In the United States, the assessment is known as the OECD Test for Schools (based on PISA).
The assessment tool provides descriptive information and analyses on the skills and creative
application of knowledge of 15-year-old students in reading, mathematics, and science, comparable to
existing PISA scales.
The assessment also provides information on how different factors within and outside school
associate with student performance. Contextual questionnaires geared for students and schools are an
important part of the assessment. Information about students’ socio-economic backgrounds, their
attitudes and interests in reading, science and mathematics and the learning environment at school are
all addressed in the assessment.
The PTS provides important peer-to-peer learning opportunities for educators – locally,
nationally and internationally – as well as the opportunity to share good practices to help identify
“what works” to improve learning and build better skills for better lives.
The OECD completed the international pilot trial of the assessment in March 2013. Since 2010
and under the guidance of the PISA Governing Board (PGB), the OECD has carried out the
development of the assessment and the implementation of the pilot in collaboration with schools and
local partners in different countries.
The organisational and technical characteristics of the PTS involve a number of different aspects:
The design of the test and the features incorporated into the test developed for PTS.
The student sampling design, requirement and procedures.
Because of the international nature of the test, rules and procedures required to guarantee
the equivalence of the different language and cultural versions used within and between
participating countries.
Various operational procedures, including test administration arrangements, data capture
and processing, and quality assurance mechanisms designed to ensure the generation of
comparable data from all schools and countries.
Scaling and analysis of the data and their subsequent reporting: PTS employs scaling
models based on Item Response Theory (IRT) methodologies. The described proficiency
scales, which are the basic tool in reporting PTS outcomes, are derived using IRT
analysis.
Procedures for automatizing the production of school reports presenting schools’ results
at PTS.
This report describes the above-mentioned methodologies as they must be implemented in the PTS
by the National Service Provider.

7
b. Managing and implementing the PTS: Overview of roles and responsibilities
The PTS is co-ordinated in each country by an accredited National Service Provider who
implements the procedures prepared and agreed with the OECD. This report has been developed for
National Service Providers to acquaint themselves with the PTS design and with the procedures
required to correctly implement the PTS, and generate and report back results to the participating
schools.
The National Service Provider is responsible for implementing the project within its own country.
It:
is in contact with the OECD and receives support in all aspects of the PTS operational
procedures;
discusses nationally specific aspects of the implementation of the PTS (such as national
options regarding sampling, analyses and reporting);
establishes procedures for the security and protection of the confidentiality of materials during
all phases of the implementation;
prepares the national versions of the test instruments, questionnaires, manuals and coding
guides;
conducts a field trial and analyses the field trial data in order to assess and possibly improve
the quality of the survey instruments;
recruits the participating schools;
identifies school co-ordinators from each of the participating schools (nominated by the school
principal or a volunteer from the school staff) and works with them on school preparation
activities;
selects the student sample from a list of eligible students provided by the school co-ordinators;
recruits and trains tests administrators according to the PTS technical standards to administer
the tests within schools;
recruits and train coders;
arranges for the data entry of the test and questionnaire responses;
processes school cognitive and context data according to the procedures described in this
technical report and generating schools results; and
co-ordinates the reporting of individual school results and sends school reports back to the
participating schools.
If the National Service Provider does not have all the capacities required for carrying out each of
the above-listed tasks, it can outsource some of the responsibilities to one or several other service
providers accredited by the OECD.
The team of the National Service Provider will typically consist of:
a Project Manager who will oversee and manage the project, and liaise with the OECD,
the schools and other key partners of the project;
a team of Test Administrators who will be responsible for administering the PTS to the
schools in accordance with PTS standard procedures;
a team of Coders who will score students’ responses to the cognitive test and the Student
Questionnaire and schools’ responses to the School Questionnaire;
a Statistician(s), preferably with experience with IRT modelling, who will process the data
and generate the results;

8
a Layout/Graphic Designer(s) who will prepare school reports based on a report template
prepared by the OECD.
The staff resources will of course depend on the local setup and the number of schools expected
to participate in the test.
c. Structure of this report
This Technical Report is designed to describe organisational and technical aspects of the project at
a sufficient level of detail to enable replication of the procedures for managing and implementing the
PISA-based Test for Schools assessment. There are four parts in the report:
Part 1 – Instrument design: describes the design and development of both the cognitive test and
the contextual questionnaires (chapters 2 and 3);
Part 2 – Operations: gives details of the operational procedures for instrument translation, the
sampling and population definitions, and test administration (chapters 4 to 6);
Part 3 – Data processing: covers the procedures used for constructing the database,
performance and context variables, including scaling methods, analysing the field trial data, and
generating school report results (chapters 7 to 11);
Part 4 – School report: covers the procedures used for supporting the preparation of the school
report template, and producing the school report eBooks (chapters 12 and 13).

9
PART 1: INSTRUMENT DESIGN
10
2. Test design, scope and development
This section describes the test design for the PISA-based Test for Schools and the processes by
which the Australian Council for Educational Research (ACER) developed the cognitive tests for
mathematics, reading and science and linked them to the PISA tests.
a. Test design
The test items for mathematics, reading and science are compiled in seven item clusters (two
mathematics clusters, two reading clusters, two science clusters and one cluster including items from
all three domains) with each cluster representing 40 minutes of test time. The items are presented to
students in seven standard test booklets, with each booklet being composed of three clusters, hence
two hours of test time. Clusters labelled M1 and M2 denote the two mathematics clusters, R1 and R2
denote the reading clusters, S1 and S2 denote the science clusters, and RMS denotes the cluster with
items from all three domains.
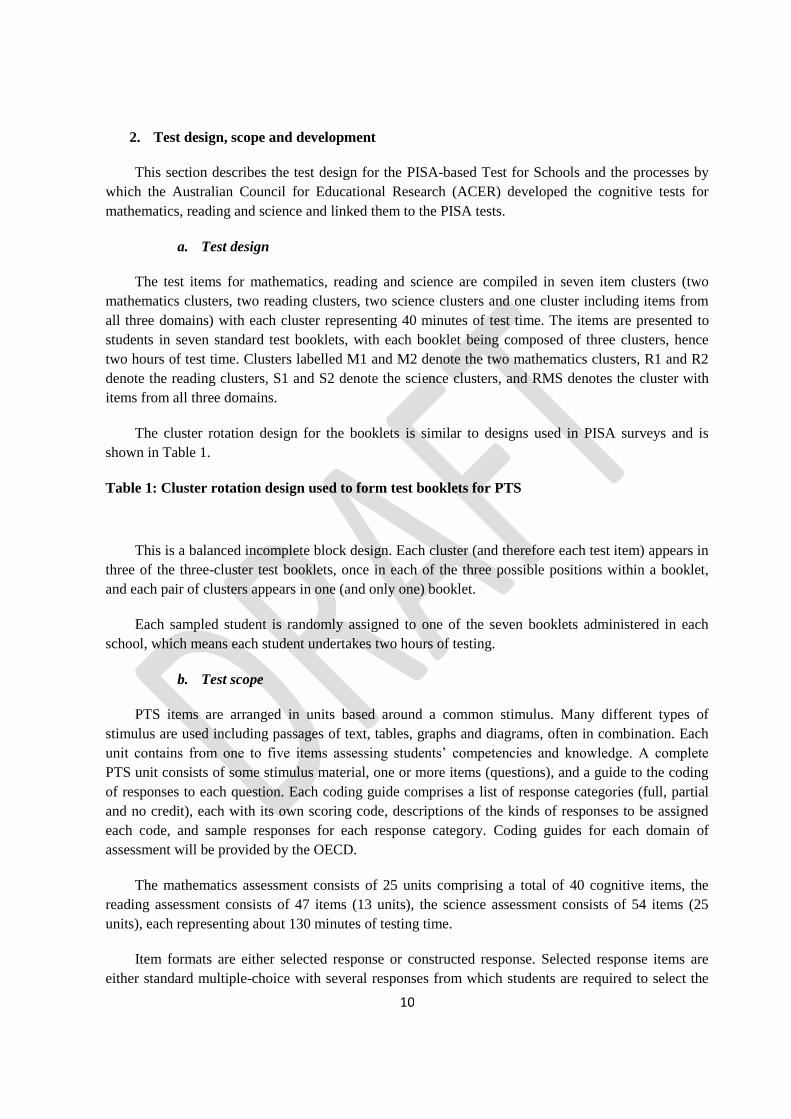
The cluster rotation design for the booklets is similar to designs used in PISA surveys and is
shown in Table 1.
Table 1: Cluster rotation design used to form test booklets for PTS
This is a balanced incomplete block design. Each cluster (and therefore each test item) appears in
three of the three-cluster test booklets, once in each of the three possible positions within a booklet,
and each pair of clusters appears in one (and only one) booklet.
Each sampled student is randomly assigned to one of the seven booklets administered in each
school, which means each student undertakes two hours of testing.
b. Test scope
PTS items are arranged in units based around a common stimulus. Many different types of
stimulus are used including passages of text, tables, graphs and diagrams, often in combination. Each
unit contains from one to five items assessing students’ competencies and knowledge. A complete
PTS unit consists of some stimulus material, one or more items (questions), and a guide to the coding
of responses to each question. Each coding guide comprises a list of response categories (full, partial
and no credit), each with its own scoring code, descriptions of the kinds of responses to be assigned
each code, and sample responses for each response category. Coding guides for each domain of
assessment will be provided by the OECD.
The mathematics assessment consists of 25 units comprising a total of 40 cognitive items, the
reading assessment consists of 47 items (13 units), the science assessment consists of 54 items (25
units), each representing about 130 minutes of testing time.
Item formats are either selected response or constructed response. Selected response items are
either standard multiple-choice with several responses from which students are required to select the
11
best answer, or complex multiple-choice presenting several statements for each of which students are
required to choose one of two or more possible responses (yes/no, true/false, correct/incorrect, etc.).
Constructed response items are of two broad types. Constructed response manual items require limited
manual input by trained coders at the stage of processing student responses. They require students to
construct a numeric response within very limited constraints, or only required a word or short phrase
as the answer, and coders later to assign each response to the predefined response categories.
Constructed response expert items require the use of trained expert coders to interpret observed
student responses and assign them to one of the defined response categories. These items require a
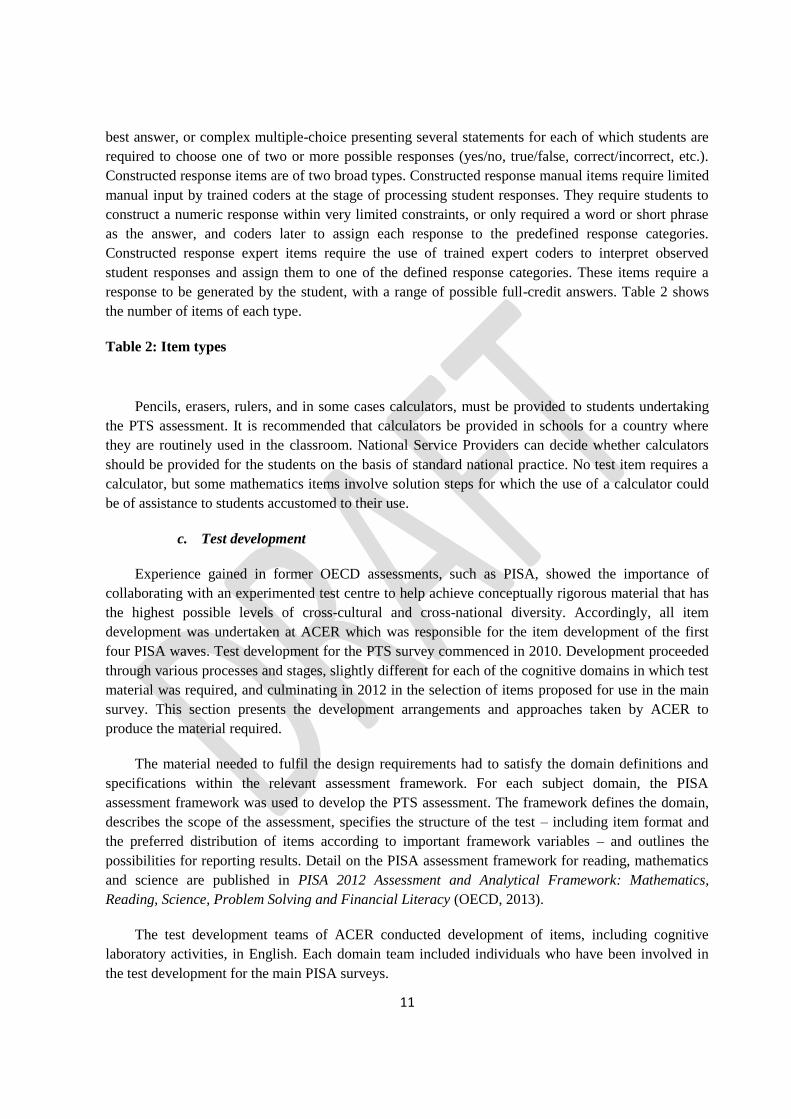
response to be generated by the student, with a range of possible full-credit answers. Table 2 shows
the number of items of each type.
Table 2: Item types
Pencils, erasers, rulers, and in some cases calculators, must be provided to students undertaking
the PTS assessment. It is recommended that calculators be provided in schools for a country where
they are routinely used in the classroom. National Service Providers can decide whether calculators
should be provided for the students on the basis of standard national practice. No test item requires a
calculator, but some mathematics items involve solution steps for which the use of a calculator could
be of assistance to students accustomed to their use.
c. Test development
Experience gained in former OECD assessments, such as PISA, showed the importance of
collaborating with an experimented test centre to help achieve conceptually rigorous material that has
the highest possible levels of cross-cultural and cross-national diversity. Accordingly, all item
development was undertaken at ACER which was responsible for the item development of the first
four PISA waves. Test development for the PTS survey commenced in 2010. Development proceeded
through various processes and stages, slightly different for each of the cognitive domains in which test
material was required, and culminating in 2012 in the selection of items proposed for use in the main
survey. This section presents the development arrangements and approaches taken by ACER to
produce the material required.
The material needed to fulfil the design requirements had to satisfy the domain definitions and
specifications within the relevant assessment framework. For each subject domain, the PISA
assessment framework was used to develop the PTS assessment. The framework defines the domain,
describes the scope of the assessment, specifies the structure of the test – including item format and
the preferred distribution of items according to important framework variables – and outlines the
possibilities for reporting results. Detail on the PISA assessment framework for reading, mathematics
and science are published in PISA 2012 Assessment and Analytical Framework: Mathematics,
Reading, Science, Problem Solving and Financial Literacy (OECD, 2013).
The test development teams of ACER conducted development of items, including cognitive
laboratory activities, in English. Each domain team included individuals who have been involved in
the test development for the main PISA surveys.
12
A total of 420 cognitive items were developed by ACER in two phases. All items were field trial
tested, along with 63 PISA link items, across students from schools in Australia, Ireland, the United
Kingdom and the United States. Data from the international field trial was analysed using standard
item response techniques.
The 420 available items were evaluated by the expert group in terms of their substantive quality,
fit to framework, range of difficulty, psychometric quality, durability and interest level for 15-year-
olds.
The selection of items to be proposed for inclusion in the main survey instruments had to satisfy
the following conditions:
The psychometric properties of all selected items had to be satisfactory.
There had to be an appropriate distribution of item difficulties, broad enough to generate
useful measurement data at both extremes of the anticipated ability distribution of
sampled students across all participating countries.
Characteristics of the item set used in the field trial, and the selected set for the main survey, are
presented in the PISA-based Test for Schools: Technical report produced by ACER (2012).
In selecting PISA link items, framework balance, range of difficulty, and a high level of reliability
were considered as prime criteria.
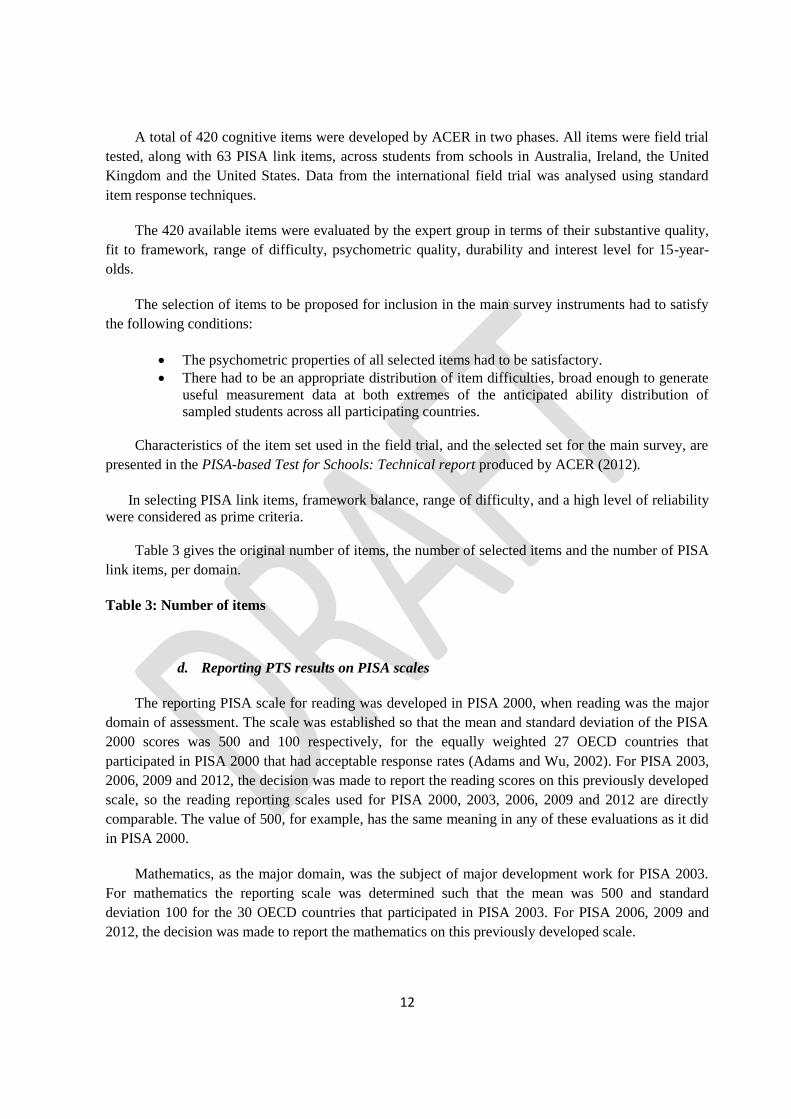
Table 3 gives the original number of items, the number of selected items and the number of PISA
link items, per domain.
Table 3: Number of items
d. Reporting PTS results on PISA scales
The reporting PISA scale for reading was developed in PISA 2000, when reading was the major
domain of assessment. The scale was established so that the mean and standard deviation of the PISA
2000 scores was 500 and 100 respectively, for the equally weighted 27 OECD countries that
participated in PISA 2000 that had acceptable response rates (Adams and Wu, 2002). For PISA 2003,
2006, 2009 and 2012, the decision was made to report the reading scores on this previously developed
scale, so the reading reporting scales used for PISA 2000, 2003, 2006, 2009 and 2012 are directly
comparable. The value of 500, for example, has the same meaning in any of these evaluations as it did
in PISA 2000.
Mathematics, as the major domain, was the subject of major development work for PISA 2003.
For mathematics the reporting scale was determined such that the mean was 500 and standard
deviation 100 for the 30 OECD countries that participated in PISA 2003. For PISA 2006, 2009 and
2012, the decision was made to report the mathematics on this previously developed scale.
13
For science a new scale was established in 2006. The metric for that scale was set so that the
mean was 500 and standard deviation 100 for the 30 OECD countries that participated in PISA 2006.
For PISA 2009 and 2012, the decision was made to report the science scores on this previously
developed scale.
To permit a comparison of the PTS results with those of PISA, the decision was thus made to
report:
the PTS reading scores on the PISA reading scale developed for PISA 2000;
the PTS mathematics scores on the PISA mathematics scale developed for PISA 2003;
and
the PTS science scores on the PISA science scale developed for PISA 2006.
Further details on the various PISA reporting scales are given in Chapters 9 and 12 of the PISA
2012 Technical Report (OECD, 2014).
The linking of PTS mathematics, reading and science to the existing PISA scales was undertaken
using equating methods. The mathematics and science items were put on the current PISA scale (2003
and 2006 respectively) by anchoring the PISA link items at their 2003 and 2006 item parameters. The
reading items were mapped on to the 2000 scale by adjusting the PISA 2009 item parameters by a
linear transformation to the PISA 2000 scale. Details are provided in the PISA-based Test for Schools:
Technical report produced by ACER (2012). The transformations to put the PTS logit scores on the
PISA point scales are given in Section 8.b.ii of Part 3.
14
3. Context Questionnaires
This section describes the content of the Student and School Questionnaires to be used as part of
the PISA-based Test for Schools.
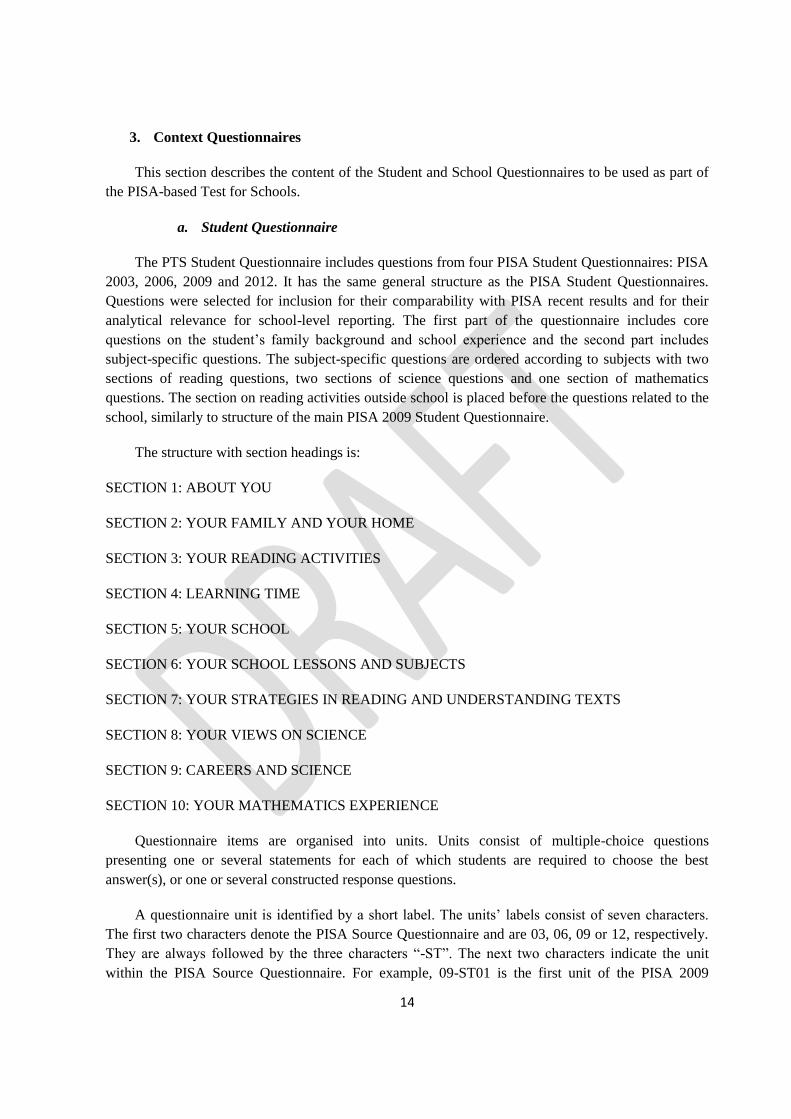
a. Student Questionnaire
The PTS Student Questionnaire includes questions from four PISA Student Questionnaires: PISA
2003, 2006, 2009 and 2012. It has the same general structure as the PISA Student Questionnaires.
Questions were selected for inclusion for their comparability with PISA recent results and for their
analytical relevance for school-level reporting. The first part of the questionnaire includes core
questions on the student’s family background and school experience and the second part includes
subject-specific questions. The subject-specific questions are ordered according to subjects with two
sections of reading questions, two sections of science questions and one section of mathematics
questions. The section on reading activities outside school is placed before the questions related to the
school, similarly to structure of the main PISA 2009 Student Questionnaire.
The structure with section headings is:
SECTION 1: ABOUT YOU
SECTION 2: YOUR FAMILY AND YOUR HOME
SECTION 3: YOUR READING ACTIVITIES
SECTION 4: LEARNING TIME
SECTION 5: YOUR SCHOOL
SECTION 6: YOUR SCHOOL LESSONS AND SUBJECTS
SECTION 7: YOUR STRATEGIES IN READING AND UNDERSTANDING TEXTS
SECTION 8: YOUR VIEWS ON SCIENCE
SECTION 9: CAREERS AND SCIENCE
SECTION 10: YOUR MATHEMATICS EXPERIENCE
Questionnaire items are organised into units. Units consist of multiple-choice questions
presenting one or several statements for each of which students are required to choose the best
answer(s), or one or several constructed response questions.
A questionnaire unit is identified by a short label. The units’ labels consist of seven characters.
The first two characters denote the PISA Source Questionnaire and are 03, 06, 09 or 12, respectively.
They are always followed by the three characters “-ST”. The next two characters indicate the unit
within the PISA Source Questionnaire. For example, 09-ST01 is the first unit of the PISA 2009

15
Student Questionnaire. In the PTS database, it is recommended to form item names by adding an item
number to the unit label. For example, 09-ST08Q01 will indicate the student response to whether the
student’s mother lives at home with the student, 09-ST08Q02 the student response to whether the
student’s father lives at home with the student, etc.
The following questions in the PTS Student Questionnaire are constructed response manual items
that require very limited manual input by trained coders at the stage of processing student responses:
09-ST01: What year group are you in?
09-ST18: If you were not born in <test country>, how old were you when you arrived in <test
country>?
09-ST28: How many minutes, on average, are there in a lesson for the following subjects?
09-ST29: How many lessons per week do you typically have for the following subjects?
09-ST30: In a normal, full week at school, how many lessons do you have in total?
09-ST35: On average, about how many students attend your <test language> class?
Two sets of questions in the PTS Student Questionnaire are constructed response expert items
which require the use of trained coders to interpret observed student responses and assign them to one
of the defined response categories:
09-ST09: What is your mother’s main job? What does your mother do in her main job?
09-ST13: What is your father’s main job? What does your father do in his main job?
Details about how to code student responses to these questions are provided in Section 6.e of Part
2.
The total estimated response time to the PTS Student Questionnaire for each student is
approximately of 28 to 33 minutes.
b. School Questionnaire
There are two existing versions of the School Questionnaire. The reduced version of the School
Questionnaire is designed to only collect information required for generating results reported back to
participating schools. The extended version of the School Questionnaire was designed and
administered for the PTS international pilot study. The anonymous data gathered through this
questionnaire will be used for research purposes on school management. National Service Providers,
in consultation with the OECD, can choose to administer either version of the School Questionnaire.

16
i. Reduced version of the School Questionnaire
The reduced version of the School Questionnaire is designed to collect information required for
reporting purposes only. It includes questions about:
the total number of students enrolled in the school;
the school type and sector; and
the school location.
The estimated response time to the reduced School Questionnaire is a couple of minutes.
ii. Extended version of the School Questionnaire
The extended version of the PTS School Questionnaire includes all questions from the PISA 2009
School Questionnaire that were retained in PISA 2012, which allows for comparability between the
PTS and most recent PISA School Questionnaires. Questions that were used to construct school-level
indices and results in PISA 2009 initial reports are also included. As in the main PISA assessment, it
covers such elements as:
the structure and organisation of the school;
student and teachers demographics;
the school’s resources;
the school’s instruction, curriculum and assessment;
the school climate; and
school policies and practices.
The total estimated response time of this extended version of the School Questionnaire is around
30 minutes, similar to the School Questionnaire in the main PISA assessment.

17
PART 2: OPERATIONS

18
4. Overview of the roles and responsibilities
For school-level operations, the National Service Provider co-ordinates activities with school-
level staff, referred to as School Co-ordinators. Trained Test Administrators administer the PTS in
schools.
a. School Co-ordinators
The National Service Provider must identify a School Co-ordinator in each participating school:
typically, this person is nominated by the school principal or is a volunteer from the school staff.
School Co-ordinators co-ordinate school-related activities with the National Service Provider and the
Test Administrators.
The School Co-ordinators:
Establish the testing date and time in consultation with the accredited National Service
Provider.
Prepare a student list with names of all eligible students in the school and send it to the
National Service Provider so that the latter can select the student sample.
Receive the list of sampled students on a student tracking form from the National Service
Provider and update it if necessary, including identifying students with disabilities or limited
test language proficiency who cannot take the test according to the criteria established.
Administer the school questionnaire.
Inform school staff, students and parents of the nature of the test and the test date by sending a
letter or organising a meeting, and secure parental permission if required by the school.
Assist the test administrator with room arrangements for the test day.
On the test day, the School Co-ordinator is expected to ensure that the sampled students attend
the test session(s). If necessary, the School co-ordinator also makes arrangements for a follow-up
session and ensures that absent students attend the follow-up session. The School Co-ordinator’s
Manual describes in detail the activities and responsibilities of the School Co-ordinator.
b. Test Administrators
The Test Administrators are primarily responsible for administering the PTS test fairly,
impartially and uniformly, in accordance with international standards and main PTS procedures. To
maintain fairness, the Test Administrators are usually employed by the National Service Provider.
Prior to the test date, Test Administrators need to be trained by the National Service Provider. Training
includes a thorough review of the Test Administrator’s Manual, and the script to be followed during
the administration of the test and questionnaire. Additional responsibilities include:
Ensuring receipt of the testing material from the National Service Provider and maintaining
their security.
Co-operating with the School Co-ordinator.
Contacting the School Co-ordinator one to two weeks prior to the test and confirm plans.
Completing final arrangements on the test day.
Conducting a follow-up session, if needed, in consultation with the School Co-ordinator.

19
Reviewing and updating the student tracking form.
Completing the session attendance form (a form designed to summarise session times, any
disturbance to the session, etc.).
Ensuring that the number of tests and questionnaires collected from students tallies with the
number sent to the school.
Obtaining the school questionnaire from the School Co-ordinator.
Sending the school questionnaire, the student questionnaires and all test materials (both
completed and not completed) to the National Service Provider after the testing is carried out.
The Test Administrator’s Manual describes in detail the activities and responsibilities of the Test
Administrators.
Templates for the student tracking form and session attendance form will be provided by the
OECD.
20
5. Preparing for implementation
a. Translation, adaptation and verification of the test and survey material
The PTS study is intended to be available in a large number of countries with different languages,
different cultures and different school systems. The PTS follows the main PISA practice of providing
the testing materials in the language of instruction in the content areas being tested. The aim is to
assess 15-year-old students’ skills in three major domains: reading, mathematical and science literacy,
using strictly equivalent test batteries, translated and adapted into each of the languages of instruction
of the participating schools. In order to achieve this, PTS implements strict procedures for
translation/adaptation and verification procedures.
The procedures firstly consisted in the development of a source version of the instruments in
English (see Section 2 of Part 1). If the language of instruction is not the source language (English), a
full translation, as described here, is needed. For English-language and non-English language
applications, some degree of adaptation of the materials to local educational and cultural terminology
is needed.
i. Language of instrumentation and administration
In some countries, the PTS is to be administered in more than one language, so the procedures for
translation and adaptation need to be carried out for each language. The decision about choice of the
test language can be made at the student, school or country level. These situations require agreement
with the OECD.
ii. Materials to be prepared
The key end-user materials need to be translated into the assessment language or languages so as
to be linguistically equivalent to the PTS source version:
All administered assessment items
All administered context questionnaires
Test Administrator manual
School Co-ordinator manual
Coding guides for the cognitive items
iii. Procedures for preparing the materials
Prior to the field trial (see Section 5.b), the National Service Provider must prepare a translation
plan, that clarifies the procedures to be used to develop their national version(s) and the different
processes used for translator/reconciler recruitment and training. The translation plan should be
reviewed by the OECD for agreement. The translation/adaptation process results in a report prepared
by the National Service Provider, which must be reviewed and approved by the OECD. Test units,
questionnaire items, manuals and coding guides are initially sent to National Service Providers several
months before the testing dates, allowing adequate time for materials to be translated (if required),
adapted and verified. A single translation of the materials should be undertaken by professional

21
translators. The PTS Translation and Adaptation Guidelines manual contains general instructions, a
number of recommendations to address common translation traps encountered when translating test
materials, a list of adaptations that are desirable, acceptable or crucial when translating cognitive tests,
notes on translation and adaptation of questionnaires and manuals. Note-versions of the student
questionnaire and cognitive items are also available. They contain notes on each question and item and
are designed to aid National Service Providers and translators in adapting and translating the survey
material in a consistent and internationally comparable way.
Cognitive test material
National Service Providers are required to submit the translated/adapted items in units, i.e., in sets
of items associated with the same stimuli or support, and not in booklets. The cognitive items must be
submitted along with a form documenting any proposed national adaptations for verification by the
OECD. As in main PISA, one of the most important quality control procedures implemented to ensure
high-quality standards in the translated assessment items for PTS is to have an independent team of
expert verifiers verify each national version against the English source version. The OECD establishes
one verification centre for being in charge of the linguistic verification of the cognitive items.
Verification is not required when a testing language will be used for only less than 500 students across
a school year (about 7 schools). Once the verification of the cognitive items has been approved by the
OECD, the National Service Provider incorporates the requested modifications into their materials and
assembles the seven different test booklets with clusters of test items arranged according to the test
booklet design.
Test items are presented in units (stimulus material and items relating to the stimulus) and each
cluster contains several units. Units allocated to clusters and clusters allocated to booklets are also
provided, together with detailed instructions to the National Service Provider about how to assemble
their translated or adapted clusters into booklets. For reference, the source version of all test booklets
is provided to National Service Providers in English. National Service Providers are encouraged to use
the cover design provided by the OECD. In formatting translated or adapted test booklets, they have to
follow the layout in the source version as much as possible, including allocation of items to pages. The
seven test booklets are submitted to the OECD, which perform a final check of the materials. This is a
verification of the layout, instructions to the student, the rendering of graphic material, etc. Once
feedback from OECD’s final check has been received and incorporated into the test booklets, the
National Service Provider is ready to send the materials to print.
Context questionnaires
As with the test material, the source versions of the context questionnaires in English are
provided to National Service Providers for translation and adaptation into the test languages. As all the
questionnaire questions come from the PISA context questionnaires, National Service Providers whose
country has already participated in main PISA studies can use the questions translated and adapted for
their country (and their language). National Service Providers are permitted to add questions of
national interest as national options to the questionnaires. Proposals and text for these are submitted to
the OECD for approval as part of the process of reviewing adaptations to the questionnaires. It is
recommended that the additional material should be placed at the end of the international modules.

22
With the OECD’s approval, National Service Providers can also take out questions that are not
relevant for the local context and that are not used in the computation of key school-level results.
National Service Providers are required to submit a note documenting all proposed national
adaptations to questionnaire items to the OECD for approval. National Service Providers implement
OECD’s feedback in the final version of the questionnaires, which is submitted once more in order to
conduct a final check. Following feedback from the final check, National Service Providers make final
changes to their questionnaires prior to printing.
School Co-ordinator and Test Administrator manuals
The School Co-ordinator’s Manual and Test Administrator’s Manual are also required to be
translated into the language of instruction. English versions of each manual are provided by the
OECD. National Service Providers are required to submit a form documenting all proposed national
adaptations to the manuals to the OECD for approval. Following approval of the adaptations, the
manuals are prepared and submitted to the OECD once more. National Service Providers implement
final OECD feedback into their manuals prior to printing.
All survey instruments that have been translated, adapted and verified are the OECD’s property
and are made available to new participating countries.
b. Field trial participation and outcomes
The PTS survey can be made publicly available to schools on demand once a country has
successfully implemented a field trial. A field trial is usually only required in an assessment language
if that language group represents more than 500 students (i.e., more than 7 schools) expected to be
assessed throughout the school year. The sample size for the field trial is a function of the test design
and is set to achieve the standard of 200 student responses per cognitive item (i.e., 500 students from a
minimum of 7 schools) need to be tested during the field trial. The schools selected for participating in
the field trial should be as diverse as possible in terms of level of achievement, school’s size, intake
and type.
During the field trial, the National Service Provider sets up a query service. School Co-ordinators
and Test Administrators are encouraged to send queries to the service so that a common adjudication
process is consistently applied to all questions about test administration procedures conducted in the
schools. All practical issues that have arisen during the field trial operations, as well as the solutions
proposed by the National Service Provider to address and improve them for the publicly available
study, must be documented.
The National Service Provider is in charge of analysing the field trial data: all response
information from the field trial must be coded, and a validation study of the field trial instruments
must be conducted through psychometric analyses of cognitive items. Analyses of cognitive items are
to be performed for each language of instruction available in the country (as described in Part 3).
Particular attention must be paid to the fit of the items to the scaling model, item discrimination (and
item-by-language interactions if there are several instruction languages in the participating country).

23
The results of these analyses are used to assess and possibly improve the quality of the instruments
and to make decisions regarding item treatment for each language. This means that an item may be
deleted from the PTS scaling in a country (or in a language) if it has poor psychometric characteristics
in this particular country (or for this particular language). Depending on the results of the cognitive
item analyses, the National Service Provider can be asked by the OECD to perform analyses of scaling
outcomes for each language of instruction available in the country (as described in Part 3). Particular
attention must then be paid to the tests targeting and reliability, and the domain inter-correlations. The
National Service Provider can outsource these analyses to another service provider.
The National Service Provider prepares a report that documents proposed changes in the
administration procedures and includes the psychometric analyses. This report must be reviewed by
the OECD for approval.
24
6. Field operations
a. School and student eligibility to participate in the survey
i. Target definition
The National Service Provider is responsible for the recruitment of schools. All schools in the
country, including schools offering vocational training programmes or any related type of educational
programmes, as well as foreign schools within the country, having 45 or more 15-year-old students in
grades 7 and higher and aged from 15 years and 3 completed months to 16 years and 2 completed
months at the time of the assessment (the operational definition of an age population directly depends
on the testing dates) are eligible to participate. A variation of up to one month in this age definition is
permitted.
ii. Recommendations regarding testing time
Testing is not recommended:
During the first six weeks of the school year because of a concern that student performance
levels may have been lower at the beginning of the academic year than at the end of the
previous academic year, even after controlling for age.
During the assessment period of other OECD tests such as PISA, TALIS, etc.
For cost purposes, it is recommended to offer schools to be tested during a limited period rather
than throughout the school year.
iii. Within-school exclusions
International within-school exclusion rules for students are specified as follows:
Intellectually disabled students are students who have a mental or emotional disability and
who, in the professional opinion of qualified staff, are cognitively delayed such that they
cannot be validly assessed in the PTS testing setting. This category includes students who are
emotionally or mentally unable to follow even the general instructions of the test. Students are
not to be excluded solely because of poor academic performance or normal discipline
problems.
Functionally disabled students are students who are permanently physically disabled in such a
way that they cannot be validly assessed in the PISA testing setting. Functionally disabled
students who can provide responses are to be included in the testing.
Students with insufficient assessment language experience are students who need to meet all
of the following criteria: i) are not native speakers of the assessment language(s); ii) have
limited proficiency in the assessment language(s); and iii) have received less than one year of
instruction in the assessment language(s). Students with insufficient assessment language
experience can be excluded.

25
b. Sampling
Student sampling is undertaken using a list of all PTS-eligible students in each school that agrees
to participate. The lists can be prepared at the national, regional, local or school level as data files,
computer-generated listings, or by hand, depending on who has the most accurate information. Since it
is important that the student sample be selected from an accurate complete list, the list needs to be
prepared slightly in advance of the testing date. It is suggested that the list be received one to two
months before the testing date so that the National Service Provider has adequate time to select the
student sample.
i. Preparing a list of age-eligible students
A list of age-eligible students is to be prepared using the student tracking form that the OECD
will provide. The following is considered important:
The list is to include students who might not be tested due to a disability or limited language
proficiency. Students who cannot be tested are to be excluded from the assessment after the
student sample is selected.
It is suggested that schools retain a copy of the student list in case the National Service
Provider has to contact the school with questions.
The student list is to be up-to-date at the time of the sampling rather than a list prepared at the
beginning of the school year.
Students are identified by their unique student identification numbers.
Student grade and gender are to be reported on the student list.
ii. Student sample size
For each country, a sample target size is set, this value is typically 85 students although, with
agreement, countries can use alternative values. From each list of students that contain more than 85
eligible students, a sample of 85 students is selected, and for lists of fewer students than the target size,
all students on the list are selected.
iii. Stratification
Prior to sampling, students are to be stratified. Stratification consists of classifying students listed
into strata (or groups) according to two selected variables referred to as stratification variables:
student’s gender and student’s grade. Stratification is used in PTS to improve the efficiency of the
sample design, thereby making the survey estimates more reliable, and ensure all types of students are
included and adequately represented in the sample. The National Service Provider needs to compute
the proportions of eligible students in each stratum (defined by the crossing of gender and grade),
determines the target number of students to be sampled within each group given the total sample size
targeted (85 students in general) and select random sample of the corresponding number of students
within each group. The recommended method for carrying out the selection is to use a ratio approach
based on the expected total number of sampled students.
26
iv. Preparing instruction for excluding students
The PTS is a timed assessment administered in the instructional language of each participating
school and is designed to be as inclusive as possible. However, students with limited assessment
language experience or with physical, mental, or emotional disabilities should not be assessed. The
National Service Provider uses the guidelines described in this report to develop any additional
instructions. School Co-ordinators and Test Administrators need precise instruction for exclusions.
The national operational definitions for within-school exclusion are to be clearly documented in the
School Co-ordinator and Test Administrator manuals and submitted to the OECD for review before
testing.
v. Student replacements
If it is likely that the response rate is going to be below 80%, due to parental refusals or absent
students that are unlikely to attend a follow-up session, replacement students can be used. The
replacement students are identified as follows. For each sampled student, the student immediately
preceding and following it in the stratum, which was ordered within in the stratification process, are
designated as his/her replacement students. The student immediately following the sampled student is
designated as the first replacement, while the student immediately following the sampled student is
designated as the second replacement.
vi. Sending the student tracking form to the School Co-ordinator and the Test
Administrator
The School Co-ordinators need to know which students are sampled in order to notify students,
parents and teachers, to update information, and to identify students to be excluded. The student
tracking form should therefore be sent four weeks before the testing period. It is recommended that
copies of the tracking form be kept by the National Service Provider and the Test Administrator in
case the school copy is misplaced before the assessment day. The Test Administrator and School Co-
ordinator manuals both assume that each would have a copy. In the interest of ensuring the PTS is as
inclusive as possible, student participation and reasons for exclusion and replacement are separately
coded in the student tracking form.
vii. Student participation
A participation rate of 80% of selected students is required. A student who participates in the
original or follow-up cognitive sessions is considered to be a participant.
These requirements have been set to ensure adequate accuracy in estimating the school’s results.
Schools that do not meet these requirements will not be allowed to receive a report. National Service
Providers must be very explicit in their communications to the schools about the requirements
regarding student participation.

27
c. Packaging and shipping materials
Regardless of how materials are packaged and shipped, the following need to be sent either to the
Test Administrator or to the school:
test booklets and student questionnaires for the number of students sampled;
a student tracking form;
a session attendance form; and
additional student questionnaires and a bundle of extra test booklets.
It is also recommended that the National Service Provider send material reception and return
forms to keep tallies of the materials.
Of the seven separate test booklets, one is pre-allocated to each student from a random starting
point in each school. It is recommended that labels be printed, each with a student identification
number and test booklet number allocated to that identification, as well as the student’s name if this is
an acceptable procedure within the country. Two or three copies of each student’s label can be printed,
and used to identify the test booklet, the questionnaire, and a packing envelope if used. National
Service Providers are allowed some flexibility in how the materials are packaged and distributed,
depending on local circumstances. It is specified however that the test booklets for a school be
packaged so that they remain secure.
d. Receipt of materials by the National Service Provider after testing
It is recommended that the National Service Provider establish a database of schools before
testing begins in order to record the shipment of materials to and from schools, keep tallies of
materials sent and returned, and monitor the progress of the materials throughout the various steps in
processing booklets after the testing. It is also recommended that upon receipt of materials back from
schools, the counts of completed and unused booklets be checked against the participation status
information recorded on the student tracking form by the Test Administrator.
e. Coding of the cognitive test and of the context questionnaires
This section describes PTS coding procedures. Overall, a substantial share of the cognitive items
across reading, mathematics, and science domains requires manual coding by trained coders. It is
crucial for comparability of results in a study such as the PTS that students’ responses are scored
uniformly from coder to coder, and from country to country. Comprehensive criteria for coding,
including many examples of acceptable and unacceptable responses, prepared by the OECD, will be
provided to National Service Providers in coding guides for each of the three domains: reading,
mathematics, and science.
In setting up the coding of students’ responses to open-ended items, National Service Providers
have to carry out or oversee several steps:
Adapt or translate the coding guides as needed and submit these to the OECD for verification.
Recruit and train coders.

28
Locate suitable local examples of responses to use in training and practice.
Organise booklets as they are returned from schools.
Code the students’ responses to the test booklets.
Code the students’ responses to the Student Questionnaire.
Code the school’s responses to the School Questionnaire.
f. Coding the test booklets
The coding of the PTS test booklets is to be carried out following a single coding design. It is
recommended to organise coding so that all appearances of each cluster type involved in the coding
are coded together. This arrangement entails coders working with several booklet types at the same
time and requires space for partly coded booklets to be stored while other booklets are being worked
on. However, organising the coding this way has the substantial benefits of more accurate and
consistent coding (because training and coding are more closely linked), minimising effects of coder
leniency or harshness (coders code across the range of participating students and schools).
i. Staffing
National Service Providers are responsible for recruiting appropriately qualified people to carry
out the coding of the test booklets and the context questionnaires. Pools of experienced coders from
other projects can be called upon. It is not necessary for coders to have high-level academic
qualifications, but they need to have a good understanding of either mid-secondary level mathematics
and science or the language of the test, and to be familiar with ways in which secondary-level students
express themselves. Teachers on leave, recently retired teachers and senior teacher trainees are all
considered to be potentially suitable coders.
People are also needed to unpack, check and assemble booklets into labelled bundles so that
coders can respect the design for randomly allocating sets of booklets to coders.
i. Confidentiality form
Before seeing or receiving any copies of PTS test materials, prospective coders are required to
sign a confidentiality form, obligating them not to disclose the content of the PTS tests beyond the
groups of coders and trainers with whom they will be working.
ii. Training
Coders are required to attend one coder training session coordinated by the National Service
Provider. At the training session, National Service Providers familiarise coding staff with the coding
guides and their interpretation. It is recommended that prospective coders be informed at the
beginning of training that they will be expected to apply the coding guides with a high level of
consistency and that reliability checks will be made frequently by the overall supervisor as part of the
coding process.
29
iii. Length of coding sessions
Coding responses to open-ended items is mentally demanding, requiring a level of concentration
that cannot be maintained for long periods of time. It is therefore recommended that coders work for
no more than six hours per day on actual coding, and take two or three breaks for coffee and lunch.
g. Student questionnaire coding
Questions from several PISA Student Questionnaires were assembled to form the PTS Student
Questionnaire. The PTS Student Questionnaire includes most of the core items from the PISA 2009
Student Questionnaire to allow for direct comparisons with PISA results and analyses from 2009
onwards. Most of these core questions have remained unchanged in PISA 2012 and are part of a pool
of basic questions that are retained for all PISA cycles. However, other aspects such as instrumental
motivation and self-efficacy of students in science are also included from the PISA 2006 cycle.
The PISA Student Questionnaire Codebooks must be used to code student response to the PTS
Student Questionnaire. The question IDs clearly indicate the original questionnaire the question stems
from (see Section 3.a in Part 1). For instance, the first question: “What year are you in?” is indexed as
“09-ST01” meaning that it corresponds to question 1 of the PISA 2009 questionnaire. Therefore,
responses to this question can be coded following the PISA 2009 Codebook.
The questions belonging to the pool of common PISA questionnaire questions must be coded
using the most recent PISA codebook, i.e., PISA 2012 Student Questionnaire Codebook. Questions
that are specific to the PISA 2009 Student Questionnaire must be coded following the PISA 2009
Student Questionnaire Codebook. The few science-specific questions included from the PISA 2006
Student Questionnaire must be coded with the PISA 2006 Codebook.
h. School questionnaire coding
The PTS School Questionnaire both in the reduced and extended versions includes questions
common to the PISA 2009 and 2012 School Questionnaires. The PISA 2012 School Questionnaire
Codebook must be used to code schools’ responses to the reduced version of the PTS School
Questionnaires. The PISA 2012 School Questionnaire Codebook must be privileged to code schools’
responses to the extended version of the PTS School Questionnaires. Questions specific to the PISA
2009 School Questionnaire must be coded using the PISA 2009 School Questionnaire Codebook.

30
PART 3: DATA PROCESSING
31
For the data processing, the National Service Provider co-ordinates activities with analysts
proficient in data processing and statistics, referred to as Statisticians. Statisticians are responsible for
constructing the school datasets, the context and performance variables, and for generating schools’
results delivered in the school report. Creating context and performance variables requires using
scaling software. This report presents syntax examples of the scaling software ConQuest® developed
by the Australian Council of Educational Research (ACER). Statisticians can work with another
scaling software, such as the TAM package under R (a free open-source statistical software), after
approval of the OECD. Results reported in the school report must be generated using standard
methodologies and procedures. This part of the report also presents and refers to syntax and macros
for statistical software packages such as SAS® and SPSS®, initially developed for analysing PISA
data. SAS® and SPSS® syntax and macros are detailed in the second edition of the PISA Data
Analysis Manual (OECD, 2009a and 2009b) for SAS® and SPSS® users. Statisticians are encouraged
to ask the OECD any query or question regarding the implementation of the statistical procedures.
7. Constructing the initial PTS database
a. Files in the initial PTS database
The initial PTS database consists of three data files: two with student responses and one with
school responses.
i. Student questionnaire file
The student questionnaire data file must contain, for each student who participated in the
assessment, the following information:
Identification variables for the school and the student (possibly the country if the National
Service Provider operates in different countries).
The student responses to the Student Questionnaire.
ii. Student test files
Two versions of the student test files must be prepared: a version that contains original responses
and a version that contains scored responses.
For each student who participated in the assessment, the following information should be
included in the database:
Identification variables for the school and the student (and possibly the country).
Ttest booklet identification (and possibly test language).
The student responses to the cognitive items. Attention must be paid to the format of the
responses for use in scaling software. For instance, when the scored responses consist of
multiple digits (complex multiple choice or open ended items), the multiple digits must be
recoded into single digit variables for use in scaling software ConQuest®.
The PTS items are organised into units. Each unit consists of a stimulus (consisting of a piece of
text or related texts, pictures or graphs) followed by one or more questions. A unit is identified by a
32
short label. The units’ labels consist of six characters and form the first part of the item names in the
data files. The first two characters are PR, PM or PS for reading, mathematics or science, respectively.
The next four characters indicate the unit within the domain. For example, PM5124 is a mathematics
unit. The item names (usually eight or nine digits) represent questions within a unit and are used as
item names (in the current example the item names within the unit are PM5124Q01, PM5124Q02,
PM5124Q03). Thus, items within a unit have the same initial six characters plus a question number.
Responses that need to be recoded into single-digit variables have a “T” or “D” at the end of the
variable name (e.g., PS7012Q07T).
For use in the scaling software ConQuest®, the scored data file typically includes one single digit
variable per item with scores instead of response categories. In both the original and scored responses
files, it is recommended that the cognitive items are sorted by domain and alphabetically and
numerically by item name within domain. This means that the mathematics items appear at the
beginning of the file, followed by the reading items and then the science items. Within domains, units
with smaller numeric identification appear before those with larger identification, and within each unit,
the first question will precede the second, and so on.
iii. School file
The school questionnaire data file must contain the following information for each school that
participated in the assessment:
The identification variables for the school (and possibly the country).
The school responses on the (reduced or extended version of the) School Questionnaire.
The testing date.
The school file must also contain the original variables collected through information provided by
the school prior to testing, such as the number of students eligible for participating in the PTS.
b. Records in the database
i. Records included in the database
The student scored response file must contain records of all PTS students who attended test
(assessment) sessions. PTS students who only attended the questionnaire session are included in the
student questionnaire file if they provided at least one response to the student questionnaire, their sex
is known, and the father’s or the mother’s occupation is known from the student questionnaire. The
school file should contain records of all participating schools with 35 or more students participating in
the assessment sessions.
ii. Records excluded from the database
The following records should be excluded from the student file:

33
Sampled students who are reported as not eligible, students who are no longer at school,
students who are excluded for physical, mental or linguistic reasons, and students who are
absent on the testing day.
Students who refused to participate in the assessment sessions.
Schools where fewer than 35 students participating in the assessment sessions should have their
records excluded from the school file.
c. Representing missing data
The coding of the data must distinguish between four different types of missing data:
Item level non-response: 9 for a one-digit variable, 99 for a two-digit variable, 999 for a three-
digit variable, and so on. Missing codes are shown in the codebooks. This missing code is
used if the student or school principal is expected to answer a question, but no response is
actually provided.
Multiple or invalid responses: 8 for a one-digit variable, 98 for a two-digit variable, 998 for a
three-digit variable, and so on. For the multiple-choice items code, 8 is used when the student
selects more than one alternative answer.
Not-administered: 7 for a one-digit variable, 97 for a two-digit variables, 997 for a three-digit
variable, and so on. Generally, this code is used for cognitive and questionnaire items that are
not administered to the students and for items that are deleted after assessment because of
misprints or translation errors.
Not reached items: all consecutive missing values clustered at the end of test session are
replaced by the non-reached code, ‘r’, except for the first value of the missing series, which is
coded as item level non-response.
d. Merging the data files
Once the data files are well prepared and organised, the student scored responses file must be
merged with the student and school questionnaires data files using the student and school (possibly
language and country) identification variables. The following procedures are to be performed in data
cleaning:
Resolving cases of unmatched students or schools in the three data files.
Removing unresolved cases of unmatched students or schools in the initial PTS database.
34
8. Procedures for scaling cognitive data
Procedures for scaling cognitive data must be used in two cases: When assessing the
psychometric properties of items administered during the field trial and when constructing student
performance variables for reporting purposes. In both cases, Statisticians must use a specific form of a
generalised item response model; the mixed coefficients multinomial logit model. This section first
provides, in technical terms, an overview of the methodological background of this model. It describes
the specific model used for analysing items from the field trial and the one used for computing
students’ performance scores at PTS. It then details the practical procedures for performing the
estimation of such models, the item analyses required on field trial data and the construction of
students’ performance scores and proficiency levels.
a. The mixed coefficients multinomial logit model
As for main PISA surveys, the mixed coefficients multinomial logit model as described by
Adams, Wilson and Wang (1997) must be used to scale the PTS cognitive data. This model results
from the combination of an item response model and a population model. This section presents in
rather technical terms the features of the general model and describes the two specific forms used for
item analyses and for the construction of performance variables.
i. The item response model
As the PTS tests contain both dichotomous items (having two possible scores) and polytomous
items (having more than two possible scores), the item response model used is a generalised form of
the Rasch model. In that model, the probability that a student with ability θ will obtain a score of j on
item i is expressed as
𝑃𝑖𝑗(θ) = P(𝑋𝑖𝑗 = 1|θ, ∆) =exp(θ − δ𝑖 + 𝜏𝑖𝑗)
∑ exp(θ − δ𝑖 + 𝜏𝑖𝑘)𝑀𝑖𝑘=0
, 𝑗 = 0,1, … ,𝑀𝑖
Item i has 𝑀𝑖 “steps”, and j is the number of “steps” successfully completed by the students or the
number of credits obtained. The 𝑀𝑖 + 1 values range from 0 (not steps completed or no credit) to 𝑀𝑖
(all steps completed or full credit obtained), and the steps are ordered; that is, for a given item, a
higher score (a higher value of j) reflects higher ability. The item parameter δ𝑖 gives the location of the
item on the latent continuum and 𝜏𝑖𝑗 are called step difficulties: δ𝑖𝑗 is the difficulty of step j of item i.
The overall scale is anchored using ∑ ∑ δ𝑖 − 𝜏𝑖𝑘𝑀𝑖𝑘=0
𝑛𝑖=1 ≡ 0, where n is the total number of items used
for scaling.
The probability of obtaining a particular score on a particular item can be generalised to the
probability of a response pattern to all items of the domain. For each item (𝑖)𝑖=1,..,𝑛, The 𝑀𝑖 +1
variables (𝑋𝑖𝑗)𝑗=0,1,…,𝑀𝑖 are collected together into a vector 𝑋𝑖. The n vectors 𝑋𝑖 are collected together
into a single vector X, called the response pattern. The probability that a student with ability θ will
obtain a particular response pattern {x} is thus modelled as
35
𝑓(𝑥|θ, ∆) = 𝑃({𝑋 = 𝑥}|θ, ∆) =∏∏𝑃𝑖𝑗(θ)𝑥𝑖𝑗
𝑀𝑖
𝑗=1
𝑛
𝑖=1
which can be rewritten in a simplified form as
𝑓𝑥(𝑥|θ) =exp(𝑥(𝜃 − ∆))
∑ exp(𝑢(𝜃 − ∆))𝑢∈Ω
where Ω is the set of all possible response patterns and ∆ is a vector containing sums of item
parameters.
When using the item response model for analysing item characteristics, Statisticians must estimate
item difficulty parameters (∆) from item response data of the field trial. Those parameters are the
outcomes of interest for the item analyses. When using the item response model for estimating
students’ ability (θ), Statisticians must anchor (or fix) item difficulty parameters at their international
values (provided by the OECD). In this case, students’ ability estimates are the outcomes of interest.
ii. The population model
The item response model is a conditional model, in the sense that it describes the process of
generating item responses conditional on the latent variable, . The complete definition of the model,
therefore, requires the specification of a density, fθ(), for the latent variable, . Student latent ability
is assumed to be sampled from a normal population with mean μ and variance σ². That is:
fθ(θ; μ, σ2) =
1
√2πσ²exp(−
(θ − μ)2
2σ2)
Or equivalently θ = μ + ε where ε~𝒩(0, σ2).
This is how the population model must be specified when analysing item response data from the field
trial.
Adams, Wilson and Wang (1997) discuss how a natural extension of this equation is to replace
the mean, μ, with the regression model, Zβ, where Z is a vector of fixed and known values for a
student, and β is the corresponding vector of regression coefficients. The population model can be re-
written as:
fθ(θ; β, σ2) =
1
√2πσ²exp(−
(θ − Zβ)2
2σ2)
The Z variables are referred to as conditioning variables. If this equation is used as the population
model then the parameters to be estimated are β and σ2.
This is how the population model must be specified when estimating students’ ability.

36
iii. The combined model
The conditional item response model and the population model are then combined to obtain the
unconditional, or marginal, item response model.
The combined model used for the item analyses of the field trial data can be written as:
fX(X; ∆) = ∫ fX(X; ∆|θ)fθ(θ; β, σ2)dθ
θ (Equation 1)
This combined model was initially used for estimating the international item parameters (∆)
during the international pilot and equating study. Values of the international item parameters will be
provided by the OECD.
The combined model used for estimating students’ ability can be written as:
fX(X|∆) = ∫ fX(X|θ, ∆)fθ(θ; β, σ2)dθ
θ (Equation 2)
It is important to recognise that under this model the locations of individuals on the latent
variable (θ) are not estimated. For each individual it is possible, however, to specify a posterior
distribution for the latent variable, given by:
hθ(θ|X, ∆) =fX(X|θ, ∆)fθ(θ; β, σ
2)
fX(X|∆)
When using this combined model to estimate students’ abilities, item parameters ∆ must be anchored
at their international values. The posterior distribution of the latent student ability must be used to
generate plausible values of each student’s score.
iv. Plausible values
As with all item response scaling models, student proficiencies are not observed; they are missing
data that must be inferred from the observed item responses. There are several alternative approaches
for making this inference. As in main PISA, PTS uses the imputation methodology usually referred to
as plausible values (PVs). PVs are a selection of likely proficiencies for students that attained each
score. For each scale, five plausible values per student are included in the database.
Using item parameters anchored at their estimated values from the international calibration
(provided by the OECD), the plausible values are random draws from the marginal posterior of the
latent distribution for each student. For details on the generation of plausible values, see Chapter 9 of
the PISA 2012 Technical Report (OECD, 2014). Drawing plausible values in PTS data analysis can
easily be implemented using statistical software suited for item response model estimation.

37
b. Application to PTS
National service providers (NSP) must use two different combined models: One for performing
national item analyses on field trial data, the other for generating students’ scores. In both cases,
Statisticians must use scaling software which can perform generalised item response models.
i. Item analyses of the field trial data
National item analyses of the field trial data must be performed separately, country by country,
and within country, language by language, using unweighted data. For the item analyses, the
conditional item response model must be used in conjunction with the population model without
conditioning variables fX(X; ∆) = ∫ fX(X; ∆|θ)fθ(θ; β, σ2)dθ
θ(Equation 1). That is, it will be assumed
that students have been sampled from a normal distribution. In the item response part of the model, the
item parameters will be freely estimated and not anchored at their international values.
An example of a ConQuest® syntax used to fit partial credit items and run the partial credit
sample analysis on students’ responses to the reading test is presented in Box 1. The datafile
PTS_scored.dat read by ConQuest® must contain the scored responses and not the original responses
of the students. The scored responses to the 46 reading items are placed in the ascending order of the
item identifiers in column 19 through 64 of the datafile. The codes statement restricts the list of codes
that ConQuest will consider valid to 0, 1 and 2. Any other codes for the items will be treated as
missing-response data. The model statement contains two terms (item and item*step) and results in the
estimation of two sets of parameters. The term item results in the estimation of a set of item difficulty
parameters, and the term item*step in a set of item step-parameters that vary across items. This is the
generalised partial credit model. The estimate statement is used to initiate the estimation of the model.
The export statement produces a display of the item response model parameter estimates and saves
them to the file readnat.prm. The option estimates=latent requests that the displays include an
illustration of the latent ability distribution and redirect them to the file readnat.shw. The itanal
statement produces a display of the results of a traditional item analysis and redirects them to the file
read.itn.
Box 1: ConQuest® syntax for running the item analyses on the reading test
Title Item analyses for reading;
datafile PTS_scored.dat;
format id 1-5 responses 19-64;
labels << read.lab ;
codes 0,1,2;
model item + item*step;
estimate;
export parameters >> readnat.prm;
show ! estimates=latent >> readnat.shw;
itanal >> read.itn ;
quit;
38
The outcomes of the item analyses are used to make a decision about how to treat each item in
the participating country and for each language. This means that an item may be deleted from the
scaling in a particular country and in particular languages if it has poor psychometric characteristics in
this particular country and those particular languages. When reviewing the national item analyses,
particular attention must be paid to the fit of the items to the scaling model, item discrimination and
item-by-country or language interactions. Three types of item analyses must be carried out by the
Statistician(s): item response model fit, discrimination coefficients and difference in national and
international item difficulties. The outcomes of these three analyses, a national list of ‘dodgy’ items
and recommendations regarding item treatment must be reported to the OECD for approval.
Item response model fit (weighted mean square MNSQ)
For each item parameter, the fit mean square index (Adams, Wilson and Wang, 1997) must be
used to provide an indication of the compatibility of the model and the data. For each student, the
model describes the probability of obtaining the different item scores. It is therefore possible to
compare the model prediction and what has been observed for one item across students. Accumulating
comparisons across students gives an item-fit statistic. As the fit statistics compare an observed value
with a predicted value, the fit is an analysis of residuals. In the case of the item infit mean square,
values near one are desirable. A weighted MNSQ greater than one is associated with a low
discrimination index, meaning the data exhibits more variability than expected by the model, and an
infit mean square less than one is associated with a high discrimination index, meaning the data
exhibits less variability than expected by the model. As in main PISA, PTS accepts small variation of
MNSQ around one. Items with values of weighted MNSQ larger than 1.2 and below 0.8 must be
reported as dodgy items.
Discrimination coefficients
For each item, the correlation between the student’s score on the item and the student’s aggregate
score on the set for the same domain as the item of interest must be used as an index of discrimination.
If 𝑝𝑖𝑗 (calculated as 𝑥𝑖𝑗 𝑚𝑖⁄ ) is the proportion of score levels that student i achieved on item j, and
𝑝𝑖 = ∑ 𝑝𝑖𝑗𝑗 (where the summation is of the items from the same domain as item j) is the sum of the
proportions of the maximum score achieved by student i, then the discrimination is calculated as the
product-moment correlation between 𝑝𝑖𝑗 and 𝑝𝑖 for all students. Items with a discrimination
coefficient below 0.2 must be reported as dodgy items.
Difference in item difficulties
The national scaling provides nationally specific item parameter estimates. The consistency of
item parameter estimates across countries is of particular interest for PTS. If the test measures the
same latent trait per domain in all participating countries, then nationally specific items should have
the same relative difficulty or, more precisely, would fall within a specific confidence interval.
Statisticians are asked to report scatter plots of national and international PTS item difficulties per
domain. International PTS item difficulties will be provided by the OECD. Both sets of difficulties are
centred on zero and are therefore referred to as relative difficulties. Both sets of difficulties must also
39
be standardized with a standard deviation of one. The vertical axis must represent the national
standardized item difficulties and the horizontal axis the OECD or international standardized item
difficulties. Each item must be represented by a dot. A linear regression line must be added to the
scatter plot to illustrate the relationship between notational and international item difficulties.
Figure 1 provides an overview of the behaviour of all items in a domain in one country compared
to the pooled international set and assists in identifying outliers. Items that lie exactly on the
regression line have similar national and international relative item difficulties. An outlier occurs when
the relative national item difficulty is very different from the predicted one given the
OECD/international relative item difficulty. For each item, Statisticians will calculate the difference
between the international and national difficulties. Each difference will standardise the difference by
dividing each of them by the standard deviation of all differences. Statisticians will then list all items
with a standardised difference of more than 1.96. In Figure 1 there are a couple of obvious outliers
(red dots). This suggests that something could be wrong with these items. They must be reported as
dodgy in the report.
Figure 1: Example of scatter plot
National list of dodgy items
For each language, National Service Providers must report all the items identified as dodgy and
the criteria these items do not satisfy. They are asked to check them carefully for any translation or
printing errors. After the verification of the dodgy items, National Service Provider must recommend
decisions regarding their treatment for the student score generation for the field trial data and for
future administration of the survey. It is recommended that items with translation and misprint
problems be discarded for the student score generation from the field trial data and improved for future
administration of the survey. Once the report containing the national item analyses has been reviewed
and decisions regarding dodgy items approved by the OECD, Statisticians can proceed with the
student score generation.
ii. Student score generation
A school report presents a school’s results from the PTS and compares the students’
performances in three subjects (reading, mathematics and science) with performances of peers in
countries and economies that took part in past PISA surveys. For reporting purposes, thirty
performance variables must be constructed and included in the database: five plausible values of
student’s performance score and five plausible levels of student’s proficiency for each of the three
domains of assessment.
Estimation of the plausible values
Estimation of the combined model presented in Equation 2 must be performed separately for each
domain of assessment. Fifteen plausible values, five for each of the three PTS scales must be included

40
in the PTS database: MATHPV1 to MATHPV5 are for mathematical literacy, READPV1 to
READPV5 for reading literacy and SCIEPV1 to SCIEPV5 for scientific literacy.
The PTS conditioning variables (vector Z in Equation 2) are prepared using procedures based on
those used in PISA. All available student-level information, other than their responses to the items in
the booklets, is used either as direct or indirect regressors in the population model. The preparation of
the variables for the conditioning proceeds as follows. Variables for booklet identifier are represented
by dummy variables and are used as direct regressors. Each booklet that contains items of the
assessment domain is represented by one variable, except for reference booklet 7. Booklet 7 is chosen
as reference booklet because it includes items from all domains. Other direct variables in the
regression are gender (and missing gender if there are any), grade, parents’ HISEI (see Section 9.b),
and school dummy variables (with the largest school as a reference).
All other categorical variables from the Student Questionnaire are dummy coded. Four numerical
variables must be recoded as follows:
AGE = (test year – student’s birth year) + (test month – student’s birth month)/12
= (test year – 09-ST03b) + (test month – 09-ST03a)/12
LMINS = (minutes in language lesson) × (number of language lessons per week)
= 09-ST28a × 09-ST29a
MMINS = (minutes in mathematics lesson) × (number of mathematics lessons per week)
= 09-ST28b × 09-ST29b
SMINS = (minutes in science lesson) × (number of science lessons per week)
= 09-ST28c × 09-ST29c
All dummy variables, the numerical variables age of school entry (09-ST06), age of arrival in the
country (09-ST18), total number of lessons per week (09-ST30), number of students in the classroom
(09-ST35), as well as the four recoded numerical variables AGE, LMINS, MMINS and SMINS are
analysed in a principal component analysis. The number of component vectors that must be extracted
and used in the scaling model as regressors is country specific and must explain 95% of the total
variance in all the original variables. In practice, the number of component vectors should not go over
10.
The item-response model is fitted for each domain of assessment to each national PTS data set
and the model parameters are estimated using item parameters anchored at their international location
(provided by the OECD), and the direct conditioning variables as well as the extracted component
vectors described above must be introduced in the regression. A minimum number of 2000
observations are required for the model to be correctly fitted. Five plausible values must be drawn
from the multivariate normal distribution following the methodology described earlier in this section.

41
At this stage, the plausible values drawn are expressed in logits and must still be put onto PISA point
scales.
An example of the ConQuest® syntax used for estimating the plausible values in reading is
presented in Box 2. The datafile PTS_scored.dat read by ConQuest® must contain the scored
responses and not the original responses of the students. The scored responses to the 46 reading items
are placed in the ascending order of the item identifiers in column 19 through 64 of the data file. The
reading test contains dichotomous items (scored 0 or 1) and polytomous items (scored 0, 1 or 2) so the
codes statement limit the valid codes to 0, 1 and 2. The vectors extracted from the principal
component analysis are named PCAvec1, PCAvec2, PCAvec3, and so on. School dummies are named
school001, school002, school003, and so on. In this example, it is assumed that data from 40 schools
are being scaled. For the sake of brevity, only four school dummies are listed in the format command.
In the example, it is assumed that 3 principal component vectors have been extracted. The regression
command must contain the list of all direct regressors and all vectors extracted from the principal
component analysis. Booklets 4 and 7 are excluded from the direct regressors as booklet 4 contains no
reading item and because booklet 7 is chosen as the reference booklet. The model statement contains
two terms (item and item*step) and results in the estimation of two sets of parameters. The term item
results in the estimation of a set of item difficulty parameters, and the term item*step in a set of item
step-parameters that vary across items. The estimate statement is used to initiate the estimation of the
model. The anchored values of the item parameters (the international item parameters) must be
imported. The order of the anchored parameters in the read.prm file must fit with the order of the item
responses. The read.prm file contains 49 values: the first 46 values correspond to the difficulty
parameters of each of the items; the last 3 values are the step-parameters of the three polytomous
reading items (PR6014Q06T, PR6017Q05T and PR6018Q08). The file read.pls will finally be created
when the command file is executed. It will contain 5 plausible values for each case.
Box 2: ConQuest® syntax for generating the plausible values in reading
Title Plausible values reading;
datafile PTS_scored.dat;
format id 1-5 format 6-49 female 50 male 51 gender_m 52 grade 53 booklet1 54 booklet2 55 booklet3
56 booklet4 57 booklet5 58 booklet6 59 booklet7 60 HISEI 61-65 PCAvec1 66-75 PCAvec2 76-85
PCAvec3 86-95 school001 96 school002 97 schol003 98 school040 125;
labels << read.lab ;
codes 0,1,2;
regression female male grade booklet1 booklet2 booklet3 booklet5 booklet6 PCAvec1 PCAvec2
PCAvec3 school002 school003 school040;
model item + item*step;
import anchor_parameters << read.prm;
export reg_coefficients >> read.reg;
export covariance >> read.cov;
set constraints=none,update=yes,warnings=no,n_plausible=5;
estimate ! fit=no;
show cases ! estimates=latent >> read.pls;
quit;

42
Transforming the plausible values to PISA scales
For PISA surveys, the reading, mathematics and science results are each reported on the scales
that were established when the respective domain was a major domain. For reading the reference scale
was established for PISA 2000, for math it was for PISA 2003, for science it was for PISA 2006. So,
for instance for PISA 2012, the reading results are thus reported on the PISA 2000 scale, the
mathematics results on the PISA 2003 scale, the science results on the PISA 2006 scale. This was
made possible because the new PISA tests were equated to the former PISA tests. In order to facilitate
the interpretation of scores assigned to students, the PISA reading, mathematics and science reference
scales were designed to have an average score of 500 points and a standard deviation of 100 across
OECD countries.
For PTS the reading, mathematics and science results are also each reported on the reference
PISA scales of the domain. This is also made possible because PTS tests were linked to the former
PISA tests. Thanks to a transformation, students’ scores at PTS can thus be expressed in score points
and put on the reference PISA scale. The transformations to put the PTS plausible values expressed in
logits (PTS_L) on the PISA point scales are:
Reading: 𝑃𝐼𝑆𝐴2000 = 500 + 100 × (𝑃𝐵𝑇𝑆_𝐿 − 0.5076)/1.1002
Mathematics: 𝑃𝐼𝑆𝐴2003 = 500 + 100 × (𝑃𝐵𝑇𝑆_𝐿 + 0.1344)/1.2838 Science: 𝑃𝐼𝑆𝐴2006 = 500 + 100 × (𝑃𝐵𝑇𝑆_𝐿 − 0.1797)/1.0724
Generation of the proficiency levels
In order to render PISA results more accessible to educators, proficiency scales have been
developed for the assessment domains. Since these scales are divided according to levels of difficulty
and performance, both a ranking of student performance and a description of the skill associated with
that proficiency level can be obtained. Each successive level is associated with tasks of increased
difficulty. In PTS, six levels of proficiency, as defined in former PISA surveys, are used for each
domain of assessment. The cut off points that frame the proficiency levels in reading, mathematics and
science are presented in Table 4.
Table 4: Lower score limits for the proficiency levels in reading, mathematics and science
Proficiency levels must be derived from the plausible values. Five plausible proficiency levels
must be assigned to each student respectively according to their five plausible values. The SAS® and
SPSS® syntaxes for the generation of the plausible proficiency levels are provided in chapter 9 of the
PISA Data Analysis Manual (OECD, 2009a and 2009b).
43
9. Procedures for constructing contextual variables
a. Overview
The PTS Student Questionnaire includes numerous items on student characteristics, student
family background, and student perceptions. Responses to the items are transformed to be displayed in
the school report. Some of the items are designed to be used in analyses as single items (for example,
gender). However, most questionnaire items are designed to be combined in some way in order to
measure latent constructs that cannot be observed directly. To these items, transformations or scaling
procedures must be applied to construct meaningful indices.
This section describes how indices, used in the analyses of the school report, must be constructed.
Three different kinds of indices can be distinguished:
Simple indices: these indices must be constructed through the arithmetical transformation or
recoding of one or more items.
Scale indices: these indices are constructed through the scaling of several items. Typically,
scale scores for these indices are estimates of latent traits derived through Item Response
Theory (IRT) scaling of dichotomous or polytomous items.
Complex indices: these indices are derived from several other indices.
All indices have been used in main PISA surveys and must be constructed following the same
methodology. It is recommended that the Statisticians responsible for the construction of contextual
variables first test their procedures on PISA data (for instance, the PISA data of their country if the
country has already participated in PISA), by re-constructing individual scores for each contextual
variable. Once the procedures allow replicating the PISA indices, they can be used to generate PTS
individual scores for each contextual index.
b. Simple questionnaire variables
i. Highest occupational status of parents
Occupational data for both the student’s father and mother are obtained by asking open-ended
questions in the Student Questionnaire. The responses must be coded to four-digit ISCO codes (ILO,
2007). Details about ISCO codes can be found in the PISA 2012 Student Questionnaire Codebook that
will be provided by the OECD. Once the parents’ occupations are coded, they must then be mapped to
the international socio-economic index of occupational status (ISEI) (Ganzeboom, 2010). Like in
PISA 2012, the new ISCO and ISEI in their 2008 version must be used in the PTS. SAS® and SPSS®
programmes for mapping ISCO-08 Occupation code to ISEI-08 are provided by the OECD to the
National Service Provider.
Three indices are calculated based on this information: father’s occupational status (BFMJ2);
mother’s occupational status (BMMJ1); and the highest occupational status of parents (HISEI), which
corresponds to the higher ISEI score of either parent or to the only available parent’s ISEI score. For
all three indices, higher scores indicate higher levels of occupational status.

44
ii. Education levels of parents
Students’ responses regarding parental education must be classified using ISCED (OECD, 1999).
Indices on parental education must be constructed by recoding educational qualifications into the
following categories: (0) None, (1) ISCED 1 (primary education), (2) ISCED 2 (lower secondary), (3)
ISCED Level 3B or 3C (vocational/pre-vocational upper secondary), (4) ISCED 3A (general upper
secondary) and/or ISCED 4 (non-tertiary post-secondary), (5) ISCED 5B (vocational tertiary) and (6)
ISCED 5A or 6 (theoretically oriented tertiary and post-graduate). Indices with these categories must
be created for the students’ mother (MISCED) and the students’ father (FISCED). In addition, the
index on the highest educational level of parents (HISCED) corresponds to the higher ISCED level of
either parent. The index for highest educational level of parents must also be recoded into estimated
number of years of schooling (PARED). A mapping of ISCED levels of years of schooling is provided
in Table 5.
Table 5: Mapping of ISCED to years
c. Questionnaire scale indices
i. Scaling methodology
Questionnaire scale indices are derived from student responses to several items, using a scaling
methodology similar to that used for generating students’ performance scores. In the scaling model, θ
no longer represents student’s ability in a domain but a student’s latent trait. The mixed coefficients
multinomial logit model described in Equation 1 of Section 8.a.iii (without conditioning) must be
fitted to student responses data. When using the unconditional item response model to estimate
students’ latent traits, item parameters ξ must be anchored at their international values. In the
following subsections, international item parameters (obtained from PISA calibration samples using
the ConQuest® software) are provided for each index.
For each student, it is then possible to specify a posterior distribution for the latent trait, given by:
hθ(θ; ξ, μ, σ2|X) =
fX(X; ξ|θ)fθ(θ|μ, σ2)
fX(X; ξ, μ, σ2)
This posterior distribution of student latent trait must be used to generate Weighted Likelihood
Estimates (WLEs) of each student’s latent trait (and not plausible values as for students’ performance
scores).
WLEs must finally be transformed to an international metric with an OECD average of zero and
an OECD standard deviation of one. The transformation must be achieved by applying the formula:
θ′ =θ − θ̅OECDσ(θOECD)

45
where 𝜃′ is the student’s trait score in the international metric, 𝜃 the original WLE in logits, and θ̅OECD
is the OECD mean of logit scores with equally weighted country samples. σ(θOECD) is the OECD
standard deviation of the original WLEs. Means and standard deviations used for the transformation
into the international metric are shown in Table 6.
Table 6: OECD means and standard deviations of Weighted Likelihood Estimates (WLEs)
ii. Mathematics self-efficacy
Eight items are used in the PTS as well as in PISA 2012 to measure mathematics self-efficacy
(MATHEFF). The four response categories are “Very confident”, “Confident”, “Not very confident”
and “Not at all confident”. All items must be reversed, so the higher difficulty corresponds to the
higher level of confidence. Table 7 shows the item wording and the PISA 2012 international item
parameters for this scale. For this index, item difficulties ranged from a comparatively easy one
“Solving an equation like 3x+5= 17” (δ= - 0.62) to more difficult ones, such as “Finding the actual
distance between two places on a map with a 1:10 000 scale” (δ= 0.56) and “Calculating the petrol
consumption rate of a car” (δ= 0.65). The scaling procedure of this index thus takes into account the
fact that students feel more confident in solving linear equations than they feel applying rates and
proportions to real life situations.
Table 7: Item parameters for mathematics self-efficacy (MATHEFF)

46
Box 3 shows an example of a ConQuest® command that can be used for generating the WLEs of
the mathematics self-efficacy (MATHEFF) scale and easily adapted for generating other scale indices.
The file matheff.dat contains student scored responses to the eight items located in columns 5 through
12. The four key statements are used to do the reverse scoring of the eight items. The model statement
for these data contains two terms (item and item*step) and will result in the use of two sets of
parameters: a set of item difficulty parameters and a set of item step-parameters. The import command
identifies the file matheff.prm containing the anchored values for the item parameters. Box 4 shows
the order of the item parameters in the file matheff.prm. The command file listed in

47
Box 3 also produces the file matheff.wle. This file contains WLEs for each of the students in the
file matheff.dat. The format of these files is as follows. The file matheff.wle contains one line of data
for each student in the sample who provides a valid response to at least one of the eight items that are
analysed. The first block of columns contains an identification number for the case, which is the
sequence number of the student (id) in the original data file. The next blocks of columns contain: the
total score that the student attained; the maximum possible score that the student could have attained;
the WLE of the student’s latent ability; and an asymptotic standard error for that ability estimate. An
extract from matheff.wle is shown in Box 5. Further detail about ConQuest® procedures can be found
in the ConQuest Manual developed by ACER (Adams, Wu and Wilson, 2012).

48
Box 3: ConQuest® syntax for generating the WLEs of the MATHEFF scale
datafile matheff.dat ;
format id 1-4 responses 5-12 ;
key 11111111 ! 3 ;
key 22222222 ! 2 ;
key 33333333 ! 1 ;
key 44444444 ! 0 ;
model item + item*step ;
set constraints = cases ;
import anchor_parameters << matheff.prm ;
estimate ;
show cases ! estimates = wle >> matheff.wle ;
show ! estimates = latent >> matheff.shw ;
itanal >> matheff.itn ;
Box 4: Contents of the item parameter file matheff.prm
1 -0.16537 /* ST37Q01 */
2 -0.31699 /* ST37Q02 */
3 0.13366 /* ST37Q03 */
4 -0.15505 /* ST37Q04 */
5 -0.62211 /* ST37Q05 */
6 0.55600 /* ST37Q06 */
7 -0.07740 /* ST37Q07 */
8 0.64726 /* ST37Q08 */
9 -1.85539 /* ST37Q01 step 1 */
10 -0.10055 /* ST37Q01 step 2 */
11 -1.69833 /* ST37Q02 step 1 */
12 -0.05907 /* ST37Q02 step 2 */
13 -1.83729 /* ST37Q03 step 1 */
14 0.14817 /* ST37Q03 step 2 */
15 -1.78957 /* ST37Q04 step 1 */
16 -0.12065 /* ST37Q04 step 2 */
17 -1.09181 /* ST37Q05 step 1 */
18 -0.05693 /* ST37Q05 step 2 */
19 -1.89647 /* ST37Q06 step 1 */
20 0.29021 /* ST37Q06 step 2 */
21 -1.38321 /* ST37Q07 step 1 */
22 0.06433 /* ST37Q07 step 2 */
23 -1.96788 /* ST37Q08 step 1*/
24 0.13774 /* ST37Q08 step 2 */

49
Box 5: First six lines of the WLE file matheff.wle
1 18.00 24.00 1.41200 0.52906
2 13.00 24.00 0.20141 0.47971
3 22.00 24.00 2.80125 0.73009
4 11.00 24.00 -0.24666 0.47732
5 14.00 24.00 0.42920 0.48390
6 9.00 24.00 -0.69620 0.48396
iii. Instrumental motivation in mathematics
Four items are used in PTS as well as in PISA 2012 to measure instrumental motivation for
mathematics (INSTMOT). Table 8 shows the item wording and the international item parameters for
this scale. The response categories vary from “Strongly Agree”, “Agree”, “Disagree”, to “Strongly
Disagree”. All items must be reversed, so the higher difficulty corresponds to the higher level of
motivation. For this index, item difficulties do not vary considerably.
Table 8: Item parameters for instrumental motivation for mathematics (INSTMOT)
iv. Science self-efficacy
Eight items measuring students’ science self-efficacy (their confidence in performing science-
related tasks) are included from PISA 2006. These items cover important themes identified in the
science literacy framework: identifying scientific questions, explaining phenomena scientifically and
using scientific evidence. Table 9 shows the item wording and the international item parameters for
this scale. All items must be reverse coded for IRT scaling so that positive WLE scores on this new
index indicate higher levels of self-efficacy in science.
Table 9: Item parameters for science self-efficacy (SCIEEFF)
v. Instrumental motivation in science
Five items measuring the construct of instrumental motivation are included from the PISA 2006
main study. Table 9 shows the item wording and the international item parameters for this scale. All
items are inverted for IRT scaling: positive WLE scores on this new index for PISA 2006 indicate
higher levels of instrumental motivation to learn science.
Table 10: Item parameters for instrumental motivation to learn science (INSTSCIE)
vi. Disciplinary climate in language of instruction
This scale provides information on disciplinary climate in the classroom (DISCLIMA) included
from PISA 2009. There are five items in this scale, each with four response categories varying from
“Strongly Disagree”, “Disagree”, “Agree” to “Strongly Agree”. The items in this scale must be reverse
coded (i.e., higher WLE’s on this scale indicate a better disciplinary climate and lower WLE’s a
poorer disciplinary climate). Similarly, positive item difficulties indicate aspects of disciplinary
climate that are less likely to be found in the classroom environment. Table 11 shows the item wording
50
and the international item parameters for this scale. The item difficulties (deltas) for all the items in
this scale are all negative, which means that the items are relatively easier to endorse.
Table 11: Item parameters for disciplinary climate in language of instruction (DISCLIMA,
PISA 2009)
d. Disciplinary climate in mathematics
This scale provides information on disciplinary climate in the mathematics lessons (DISCLIM in
PTS but named DISCLIMA in PISA 2012) based on five items. The four response categories are
“Every lesson”, “Most lessons”, “Some lessons”, to “Never or hardly ever”. Table 12 shows the item
wording and the international item parameters for this scale.
Table 12: Item parameters for disciplinary climate in mathematics (DISCLIM, PISA 2012)
i. Teacher-student relationship
Five items on teacher-student relations are included from the PISA 2012 Student Questionnaire.
This scale provides information on students’ perceived teacher’s interest in student performance.
There are four response categories varying from “Strongly Agree”, “Agree”, “Disagree” to “Strongly
Disagree”. All items must be reversed. Table 13 shows the item wording and the international item
parameters for this scale. The statement that students generally find the most difficult to agree with is
that most of their teachers really listen to what students have to say.
Table 13: Item parameters for teacher-student relations (STUDREL)
ii. Household possessions
Fourteen items on the availability of household items at home are included from PISA 2012
(ST26). In addition, countries and economies that participated in PISA 2012 added three specific
household items that are seen as appropriate measures of family wealth within the country’s context
(ST27). The home possession index (HOMEPOS) is derived from these items. It is a summary index
of all household items from the units ST26 and ST27 and also included the variable indicating the
number of books at home (ST28) which is recoded from the original six categories into three: (0) 0-25
books, (1) 26-100 books, (2) more than 100. Questions ST27Q01 and ST27Q02 are recoded from the
original four categories into three: (0) ‘None or one’, (1) ‘Two’ (2) ‘Three or more’. Questions
ST27Q03, ST27Q04 and ST27Q05 retain four categories. Table 14 shows the wording of items used
for the computation of HOMEPOS. Table 15 provides international item parameters for HOMEPOS
items ST26Q01-ST26Q12, St27Q01-ST27Q03 and ST28. Table 16 provides national item parameters
for items ST26Q13 to ST26Q17 (which were nationally scaled).1
1 For a country that has not participated in PISA yet, two solutions can be envisaged. One is to use national item
parameters of another relevant participating country. The other is to use freely estimated item parameters for
items ST26Q13 to ST26Q17 when computing the HOMEPOS index.
51
HOMEPOS is also one of three components in the construction of the index of economic, social
and cultural status (or ESCS; see the subsection on ESCS index construction later in this section).
Table 14: Home possession items
Table 15: International item parameters for HOMEPOS
Table 16: National item parameters for HOMEPOS
e. Other complex questionnaire variables
i. Index of economic, social and cultural status (ESCS)
One key variable for the analyses reported in the school report is the index of economic, social
and cultural status (ESCS). As in PISA 2003, 2006, 2009 and 2012, ESCS for PTS is derived from
three variables: home possessions (HOMEPOS); the highest parental occupation (HISEI); and the
highest parental education expressed as years of schooling (PARED).
Missing values for students with missing data for only one variable must be imputed with
predicted values plus a random component based on a regression on the other two variables. If there
are missing data on more than one variable, ESCS is not computed for that case and a missing value is
assigned for ESCS.
In PISA, variables with imputed values were then used for a principal component analysis with
an OECD senate weight. The ESCS scores were obtained as component scores for the first principal
component with zero being the score of an average OECD student and one being the standard
deviation across equally weighted OECD countries.
In the PTS, ESCS scores are obtained as:
ESCS = β1HISEI
′ +β2PARED′ +β3HOMEPOS
εf
where 𝛽1, 𝛽2 and 𝛽3 are the OECD factor loadings, 𝜀𝑓 is the eigenvalue of the first principal
component, HISEI’ and PARED’ are the “OECD-standardised” variables, and 𝜀𝑓 equals
1.83361862519104. HISEI must be standardised with a mean of 50.6655128 and a standard deviation
of 21.6082898, and PARED with a mean of 13.4889051 and a standard deviation of 3.0375495.
Table 17 shows the factor loadings for the OECD countries and Table 18 those for partner
countries and economies.
Table 17: Factor loadings for OECD countries
52
Table 18: Factor loadings for partner countries and economies
ii. Reader profiles
Students that participated in the PTS are classified into six profiles of readers based on whether
they regularly read comic books, magazines, newspapers, fiction and non-fiction books for enjoyment
– as an indicator of how “wide” their reading habits are – as well as on their awareness of effective
learning strategies to understand, remember and summarise information – as indicators of how “deep”
their reading and learning is. Figure 2 illustrates how the reading process can be characterised along
the width and depth dimensions.
Figure 2: How the reading process can be characterised
As in PISA 2009, students in PTS must be grouped into the six profiles shown in Figure 3. Latent
class analysis must be performed to classify students into the six profiles. This subsection first
describes how to create the seven variables used in the latent profile analysis and then explains how to
perform the latent profile analysis in order to classify students into reader profiles.
Figure 3: Profile of readers
Construction of variables
Questions ST25Q01 to ST25Q05 included from PISA 2009 Student Questionnaire about
students’ frequency of reading certain materials must be recoded into five dummy variables named
“magazine”, “comic”, “fiction”, “nonfic” and “news”. Each of these dummy variables equals one if
the student declares reading this material “several times a month” or “several times a week” and zero
if the student declares reading this material “never or almost never”, “a few times a year” or “about
once a month”.
Two other variables must be derived from questions relative to two meta-cognition tasks
“Understanding and remembering” (UNDREM) and “Summarising” (METASUM). Both meta-
cognition tasks consist of a stem (which is a reading task) and a set of strategies.
For each strategy listed in items ST41Q01 to ST41Q06 from the PISA 2009 Student
Questionnaire, students are asked to rate the usefulness of the strategy for understanding and
remembering a text, using a scale ranging from 1 to 6. For each student, nine scores must be calculated
according to the following set of nine order relations:
If ST41Q03>ST41Q01 then student’s score is set to 1, else 0.
If ST41Q03>ST41Q02 then student’s score is set to 1, else 0.
If ST41Q03>ST41Q06 then student’s score is set to 1, else 0.
If ST41Q04>ST41Q01 then student’s score is set to 1, else 0.
If ST41Q04>ST41Q02 then student’s score is set to 1, else 0.
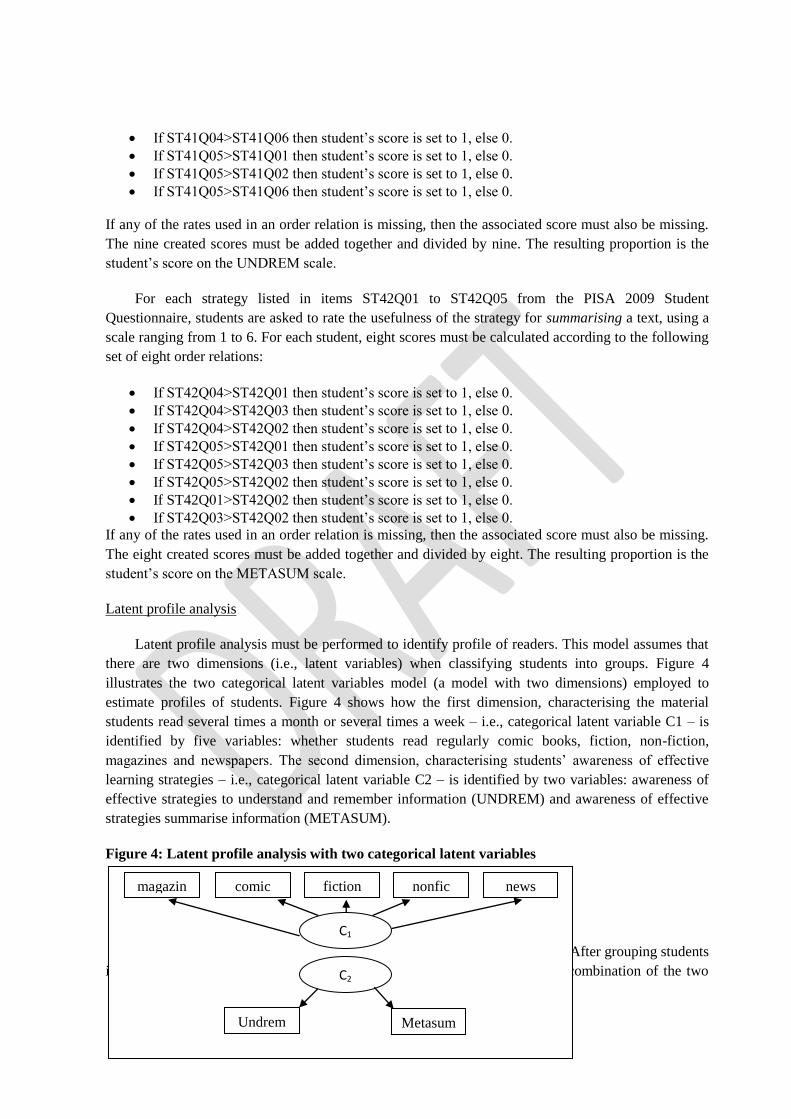
53
If ST41Q04>ST41Q06 then student’s score is set to 1, else 0.
If ST41Q05>ST41Q01 then student’s score is set to 1, else 0.
If ST41Q05>ST41Q02 then student’s score is set to 1, else 0.
If ST41Q05>ST41Q06 then student’s score is set to 1, else 0.
If any of the rates used in an order relation is missing, then the associated score must also be missing.
The nine created scores must be added together and divided by nine. The resulting proportion is the
student’s score on the UNDREM scale.
For each strategy listed in items ST42Q01 to ST42Q05 from the PISA 2009 Student
Questionnaire, students are asked to rate the usefulness of the strategy for summarising a text, using a
scale ranging from 1 to 6. For each student, eight scores must be calculated according to the following
set of eight order relations:
If ST42Q04>ST42Q01 then student’s score is set to 1, else 0.
If ST42Q04>ST42Q03 then student’s score is set to 1, else 0.
If ST42Q04>ST42Q02 then student’s score is set to 1, else 0.
If ST42Q05>ST42Q01 then student’s score is set to 1, else 0.
If ST42Q05>ST42Q03 then student’s score is set to 1, else 0.
If ST42Q05>ST42Q02 then student’s score is set to 1, else 0.
If ST42Q01>ST42Q02 then student’s score is set to 1, else 0.
If ST42Q03>ST42Q02 then student’s score is set to 1, else 0.
If any of the rates used in an order relation is missing, then the associated score must also be missing.
The eight created scores must be added together and divided by eight. The resulting proportion is the
student’s score on the METASUM scale.
Latent profile analysis
Latent profile analysis must be performed to identify profile of readers. This model assumes that
there are two dimensions (i.e., latent variables) when classifying students into groups. Figure 4
illustrates the two categorical latent variables model (a model with two dimensions) employed to
estimate profiles of students. Figure 4 shows how the first dimension, characterising the material
students read several times a month or several times a week – i.e., categorical latent variable C1 – is
identified by five variables: whether students read regularly comic books, fiction, non-fiction,
magazines and newspapers. The second dimension, characterising students’ awareness of effective
learning strategies – i.e., categorical latent variable C2 – is identified by two variables: awareness of
effective strategies to understand and remember information (UNDREM) and awareness of effective
strategies summarise information (METASUM).
Figure 4: Latent profile analysis with two categorical latent variables
Means are specified to vary only across the classes within each dimension. After grouping students
into classes within each dimension, groupings are assigned according to the combination of the two
magazin
e
comic fiction nonfic news
Undrem Metasum
C1
C2
54
dimensions, C1 and C2. Three classes must be extracted from the first dimension, and two classes
from the second dimension, resulting in a total of 6 groups that students can be assigned to (3 x 2).
Students’ assignment to reader profiles must be performed using coefficients fixed at their
international values. Input and output files of the latent class analysis performed with Mplus software
on PISA 2009 data will be provided by the OECD.
10. Survey weighting (the balanced repeated replication method)
Survey weights are required to facilitate calculation of appropriate estimates of sampling error
and making valid estimates and inferences of the population. Statisticians must calculate survey
weights for all assessed students, to get estimates of standard errors, conduct significance tests and
create confidence intervals appropriately.
A replication methodology must be employed to estimate the sampling variances of PTS
parameter estimates. This methodology accounts for the variance in estimates due to the sampling of
students. Additional variance due to the use of plausible values from the posterior distributions of
scaled scores is captured separately as measurement error. Computationally the calculation of these
two components can be carried out using SAS® and SPSS® macros. Additional variance due to the
comparison of PTS results with those of PISA is captured separately by a link error. For further detail,
see PISA Data Analysis Manual (OECD, 2009a or 2009b).
a. The balanced repeated replication method
The approach used for calculating sampling variances for PISA and therefore PTS estimates is
known as Balanced Repeated Replication (BRR), or balanced half-samples. The particular variant
known as Fay’s method must be used.2 This variant of the BRR method must be implemented as
follows.
In each school, students must be ranked on the basis of their first principal component that was
used to generate the plausible values. The first two students in the ordered list are paired; the following
two students are paired and so on. If a school has an odd number of students, the last three students are
grouped to form a triple. Let us assume that there are H pairs of students, also referred as variance
strata or zones, or pseudo-strata in the sampling literature. Pairs are numbered sequentially, 1 to H.
A set of 80 replicate weights must then be created. Each of these replicate weights is formed by
assigning a weight of 1.5 to one of the two students in the stratum, and a weight of 0.5 to the
remaining student. In cases where there are three units in a triple, either one of the students (designated
at random) receive a factor of 1.7071 for a given replicate, with the other two students receiving
factors of 0.6464, or else the one student receives a factor of 0.2929, and the other two students
receive factors of 1.3536. The determination as to which students receive inflated weights and which
receive deflated weights is carried out in a systematic fashion, based on the entries of the first H rows
2 This method is similar in nature to the jackknife method used in other international studies of educational
achievement.
55
in a Hadamard matrix of order 80. A Hadamard matrix3 contains entries that are +1 and –1 in value,
and has the property that the matrix, multiplied by its transpose, gives the identity matrix of order 80,
multiplied by a factor of 80.
For pairs of students:
The +1 in the Hadamard matrix is converted to a weight of 1.5 for the first student of the pair,
and 0.5 for the second student of the pair;
The -1 in the Hadamard matrix is converted to a weight of 0.5 for the first student of the pair,
and 1.5 for the second student of the pair.
For triples of students:
The +1 in the Hadamard matrix is converted to a weight of 1.7071 for the first student of the
pair, and 0.6464 for the other two students of the triple;
The -1 in the Hadamard matrix is converted to a weight of 0.2929 for the first student of the
pair, and 1.3536 for the other two students of the triple.
Table 19 and Table 20 describe how the replicate weights are generated for this method in a
fictitious example where there are 21 students in a participating school. Table 19 displays an example
of a Hadamard matrix. Table 20 shows how the replicate weights are assigned to each student.
Table 19: Hadamard Matrix
Table 20: Replicates for the Balanced Repeated Replicate method
b. The sampling variance estimator
As with all replication methods, the statistic of interest (𝜑) is computed based on the sample (φ̂),
and then again on each replicate (φ̂(i), i = 1to80). The replicates are then compared to the whole
sample estimate to get the sampling variance, as follows:
σ²(φ)̂ =1
20∑(φ̂(i) − φ̂
80
i=1
)²
3 Details concerning Hadamard matrices are given in Wolter (2007).

56
11. Statistical procedures for generating school report results
This section of the report has been developed to provide Statisticians with the techniques needed
to correctly analyse the PTS database. It helps them to confidently and accurately implement
procedures used for the production of the PTS school reports. This section is largely based on the
procedures described in the PISA Data Analysis Manual (OECD, 2009a and 2009b) which the reader
can refer to for further detail. This section will cover all cases of computations required for generating
school report results.
a. Univariate statistics for context variables
Replicate weights have to be used for the computation of the standard error for any population
estimate. The standard error of statistics for context variables only (i.e., not involving performance
variables) simply equals the sampling error, i.e., the square root of the sampling variance estimator
reported in Section 10.b.
vii. Percentage of students per category
For categorical variables, the statistic of interest is usually a percentage of students per category.
Each percentage is estimated after deleting cases with missing values for the variable of interest in the
dataset. The procedure for estimating the percentage of students per category and the corresponding
standard error requires first computing the percentage for the original sample (without weighting
student data), and then computing 80 other percentages, each of them by weighting the student sample
with one of the 80 replicates.
SAS® and SPSS® syntaxes and macros (respectively PROC_FREQ_NO_PV.SAS and
MCR_SE_GRPPCT.SPS) for computing the percentages and their standard errors are presented in
chapter 7 of the PISA Data Analysis Manual (OECD, 2009a and 2009b).
For reporting, percentages of students:
reporting that disciplinary issues in <test language> lessons occur “never or hardly ever” or
“in some lessons”;
reporting that disciplinary issues in mathematics lessons occur “never or hardly over” or “in
some lessons”;
who agree or strongly agree with statements regarding teacher-student relations at school;
per reading profile;
who feel either confident or very confident about having to do various mathematics tasks;
who feel either confident or very confident about having to do various science tasks;
who agree or strongly agree with statements regarding their instrumental motivation in
mathematics;
who agree or strongly agree with statements regarding their instrumental motivation in
science;
as well as their standard errors must be computed.

57
viii. School mean indices
To compute a school mean index and its corresponding standard error, it is also necessary to first
compute the mean on the original student sample, and then to compute 80 other means, each of them
by weighting the data with one of the 80 replicates.
SAS® and SPSS® syntaxes and macros (respectively PROCMEAN_NO_PV.SAS and
MCR_SE_UNIV.SPS) for computing the percentages and their standard errors are presented in
chapter 7 of the PISA Data Analysis Manual (OECD, 2009a and 2009b).
For reporting, the school mean of:
the economic, social and cultural status index (ESCS);
the index of disciplinary climate in <test language> lessons (DISCLIMA);
the index of disciplinary climate in mathematics (DISCLIM);
the index of teacher-student relations (STUDREL);
the index of instrumental motivation in mathematics (INSTMOT);
the index of instrumental motivation in science (INSTSCIE);
the index of self-concept in mathematics (MATHEFF);
the index of self-concept in science (SCIEEFF);
as well as their standard errors must be computed.
For reporting purposes, the DISCLIM and STUDREL indices (which are originally expressed in
a metric with an OECD mean of 0 and an OECD standard deviation of one) must be converted to a
scale with an OECD mean of 5 and a standard deviation of 2, using the following transformation:
Transformedindex = 2index + 5, where index is either DISCLIM or STUDREL.
ix. Identification of “similar” schools in regards to socio-economic background
Several figures in the school report compare the school’s results with those of similar schools
with regards to socioeconomic background. “Similar” schools are schools that participated in PISA
2012 and whose ESCS is within +/- 0.25 of the ESCS index of the school having participated in the
PTS.
b. Students average scores and their standard errors
As described above, the cognitive data in the PTS are scaled with the mixed coefficients
multinomial logit model and the performance of students is denoted with plausible values (PVs). For
each domain, five plausible values per student are included in the international databases. This section
describes how to perform analyses with plausible values, so it is useful when reporting results on
student performances and their relationships with student or school characteristics.
The computation of a statistic with plausible values always consists of six steps, regardless of the
required statistic.

58
1. The required statistic has to be computed for each plausible value. In the previous section, it was
mentioned that 81 estimates are necessary to get the final estimate and its standard error. Therefore,
any analysis that involves five plausible values will require 405 estimates (5 × 81). To estimate a
mean score and its respective standard error, 405 means must be calculated. The means estimated on
the original sample (without weighting) are denoted μ̂1, μ̂2, μ̂3, μ̂4 and μ̂5. From the 80 replicates
applied on each of the five plausible values, five sampling variances are estimated, denoted
respectively σ(μ̂1)2 , σ(μ̂2)
2 , σ(μ̂3)2 , σ(μ̂4)
2 and σ(μ̂5)2 . These five mean estimates and their respective
sampling variances are provided in Table 21.
Table 21: The 405 mean estimates
Weight PV1 PV2 PV3 PV4 PV5
None �̂�1 �̂�2 �̂�3 �̂�4 �̂�5
Replicate 1 �̂�1_1 �̂�2_1 �̂�3_1 �̂�4_1 �̂�5_1
Replicate 2 �̂�1_2 �̂�2_2 �̂�3_2 �̂�4_2 �̂�5_2
Replicate 3 �̂�1_3 �̂�2_3 �̂�3_3 �̂�4_3 �̂�5_3
…. … …. … … …
Replicate 80 �̂�1_80 �̂�2_80 �̂�3_80 �̂�4_80 �̂�5_80
Sampling
variance
𝜎(�̂�1)2 𝜎(�̂�2)
2 𝜎(�̂�3)2 𝜎(�̂�4)
2 𝜎(�̂�5)2
2. The final mean estimate is equal to the average of the five mean estimates, i.e.,
μ̂ =1
5(μ̂1 +μ̂2 + μ̂3 + μ̂4 + μ̂5).
3. The final sampling variance is equal to the average of the five sampling variances, i.e.,
σ̂sampling2 =
1
5(σ(μ̂1)
2 + σ(μ̂2)2 + σ(μ̂3)
2 + σ(μ̂4)2 + σ(μ̂5)
2 ).
4. The imputation variance, also denoted measurement error variance, is computed as
σ̂measure2 =
1
4∑ (μ̂ −5i=1 μ̂i)².
5. Two types of standard errors can be computed depending on the reporting purpose. Whenever a
mean score is compared with a specific PISA result or put in parallel of a specific PISA scale, the
appropriate link error must be included in the calculation of the standard error of the mean estimate.
For instance, if the school average score of the PTS mathematics scale is compared with the country’s
average score at PISA 2012 mathematics test, the link error between the PTS and the PISA 2012

59
mathematics tests must be included in the estimation of the standard error on the school’s average
score. The total error variance results from the combination of the sampling error variance, the
measurement error variance and the linking error variance (denoted σ̂link2 ), and it is computed as:
σ̂finalwithlinkerror2 = 1.2σ̂measure
2 + σ̂sampling2 + σ̂link
2 .
Whenever a mean estimate (such as the school average score) is presented as such, i.e., alone, then no
link error must be taken into account in the calculation of the standard error. The sampling variance
and the imputation variance are combined to obtain a final error variance as:
σ̂finalwithoutlinking2 = 1.2σ̂measure
2 + σ̂sampling2 .
6. The standard error equals the square root of the total error variance.
The SAS® macro PROC_MEANS_PV.SAS and the SPSS® macro MCR_SE_PV.SPS for computing
mean scores and their standard errors (without linking) are described in chapter 8 of the PISA Data
Analysis Manual. Link errors are given in Table 22.
Table 22: Link error estimates
For reporting, the following scores averages and their standard errors must be computed:
Average score of students in the school.
Average score of students in the school, by gender.
Average score of students in the school, by reader profile.
x. School mean performance adjusted for ESCS
A multilevel regression of students’ scores with random intercepts and one fixed effect (student’s
ESCS centred at the national ESCS average) must be performed to compute school mean performance
adjusted for ESCS. The equation of this model can be written as:
Yij = γ00 + γ10(ESCSij − ESCS̅̅ ̅̅ ̅̅ ̅) + u0j + εij
where Yij represents the performance of student i in school j, γ00 the overall intercept, γ10 the
regression coefficient for centred student’s ESCS. The model has two random components: u0j, the
school departure from the overall intercept, and εij the student residual.
This can be estimated with the SAS® or the SPSS® syntaxes and macros (proc_mixed_pv.sas
and MCR_ML_PV.SPS) detailed in chapter 15 of the PISA Data Analysis Manual. The average school
performance after accounting for ESCS must be computed as the sum of the fixed intercept (γ00) and
the random component of the intercept (u0j) for the considered school.

60
xi. Distribution of students across proficiency levels
The SAS® macro proc_freq_pv.sas and the SPSS® macro MCR_SE_PCTLEV.SPS have been
developed for computing the percentage of students at each proficiency level as well as its respective
standard error in one run. They are detailed in chapter 9 of the PISA Data Analysis Manual.
61
c. Reporting and reviewing school-level data
National Service Providers are asked to prepare an Excel workbook containing, for all
participating schools, all school-level data that will be used as input in the school report. This
workbook typically contains school observations in rows and all required school-level variables in
columns. National Service Providers usually process altogether the data of schools that participated in
the same testing window. So, once the data processing of a given testing window is completed, the
National Service Provider must fill in the Excel workbook with the corresponding school data, and
send it for review to the OECD. The OECD will perform several quality assurance checks on the
dataset and possibly send feedback to the National Service Provider. Once the calculated results have
been approved by the OECD, the National Service Provider can proceed with the eBook production
for the schools of this testing window. This process will be repeated for each testing window.

62
PART 4: SCHOOL REPORT

63
1. Supporting the preparation of a national version of the school report template
Schools that participate in the PISA-based Test for Schools receive a comprehensive 150-page
report with over 40 figures that are unique to each school and information on the learning climate at
school, as well as students’ engagement toward learning, to enhance school leaders’ understanding of
the overall performance of a school. The report also contains examples of relevant school policies and
practices from around the world to stimulate reflections and discussions among local educators on
school improvement. These reports are referred to as “eBooks”: to review a sample eBook, the reader
can visit: www.oecd.org/pisa/aboutpisa/PISA-based-Test-for-Schools-European-School-Culham.pdf.
The OECD is responsible for the preparation of a national version of the school report eBook
template. All templates are prepared in English and follow the same general outline:
Summary of your school’s results
Reader’s guide
Section 1 – Introduction: Understanding your school’s results
Section 2 – What students at your school know and can do in reading, mathematics and
science
Section 3 – Student engagement and the learning environment at your school in an
international perspective
Section 4 – Your school compared with similar schools in your country
Section 5 – Your school’s results in an international context
Annex A – The PISA-based Test for Schools in the [insert country name] [insert school
year]
Annex B – Overview of the PISA-based Test for Schools
Annex C – Examples of test questions
Annex D – Tables of results from PISA 2012 for countries and economies
a. Proposal for adaptations
Adaptations to the school report template can include, but are not limited to, changing the
selection of countries/economies for comparison to your school/country results, selecting additional
and/or different results to highlight in the report, modifying the figures, modifying the terminology
used to describe types of schools (e.g., public and private schools may be referred to otherwise in other
countries), etc. Adaptions to the report template are done by the OECD in consultation with and with
the support of the National Service Provider.

64
b. Translation of the template
The National Service Provider is responsible for the translation of the school report template in
the language(s) of use in the country. The following disclaimer is included on the legal page (page 4)
of each school’s report: “The translation of this OECD document was undertaken by [insert name of
company/organisation that did the translation]. In the event of any discrepancy between the original
work and the translation, only the text of original work shall be considered valid.”
Once the template has been translated, it must be reviewed and approved by the OECD. The
National Service Provider must allow at least one week for the review process. The OECD reviews the
layout as well as data/figures and consults with the National Service Provider in the case of
discrepancies between the English version and the translated version of the template. The OECD does
not check the quality and validity of the translated text, as this is the responsibility of the National
Service Provider.
2. Production of the school report eBooks
The National Service Provider is responsible for producing each school report eBook based on
the template that the OECD prepares in InDesign format. The OECD will also provide an Excel
workbook containing templates of all figures to be reported in the eBook. Each sheet of the Excel
workbook contains a template figure based on fixed input data. The National Service Provider will
only have to enter the school’s values as input data for the figures in the appropriate areas of the Excel
sheets.
The following sections explain automation procedures as well as the process for receiving the
OECD’s approval for mass production of the eBooks.
a. Automatizing the school report production
The following elements can be automatized with a layout software in the report, which eliminates
the need to manually enter information specific to each school’s results and makes eBook production
much more efficient:
Cover pages (pages 1 and 3 of the eBook containing the name of the school)
Headers of all pages of the report (containing the name of the school)
Summary of your school’s results: text and figures
o School name mentioned throughout summary
o Means scores for reading, mathematics and science in Figure A and the text that
follows
o Language used to describe school performance compared to national
performance (in the text after Figure A and in the section “Some highlights of
results for your school”)

65
Significantly above; not significantly different from; significantly below
Above the average; not significantly different from the average; below
the average
More positive than; similar to; less positive than
Higher than; similar to; lower than
o Percentages that appear in the text describing Figures B and C
Figures
Annex A
When setting up the automation procedures, attention must be paid to the variety of cases among
schools and of extreme cases (large confidence interval going over the figure frame). Additionally, if a
school has a very long name that might not fit on one line in the header on each page of the report, the
name of the school should be abbreviated so that it fits within the template.
b. Receiving OECD’s approval on the eBooks
The OECD reviews the first 10 eBooks following the update of a school report. The 10 eBooks
must be selected for review with the following criteria: schools must have different numbers of tested
students (to see how the report automation accommodates for large confidence intervals), different
levels of performance (to see how the report automation accommodates for results at the top and at the
bottom of performance scales), different socioeconomic compositions (to see how the report
automation accommodates for results at the top and at the bottom of the socioeconomic scale).
The National Service Provider should inform the OECD in advance of when they plan to send
eBooks for review so that the OECD can schedule time for the review. The National Service Provider
must allow a week for the OECD to review 10 eBooks. If the OECD receives the eBooks without
having been informed in advance of when they will be available for review, the National Service
Provider will have to allow more than one week before hearing back from the OECD.
Once the first 10 eBooks are reviewed, the National Service Provider can proceed with the
production of the remaining eBooks. It is the National Service Provider’s responsibility to distribute
the eBooks to each school.

66
REFERENCES
ACER (2012), PISA-based Test for Schools. Technical Report, ACER.
Adams, R.J., M. Wilson and W.C. Wang (1997), “The Multidimensional Random Coefficients
Multinomial Logit Model”, Applied Psychological Measurement, No. 21, pp. 1-23.
Adams, R.J. and M.L. Wu (2002), PISA 2000 Technical Report, OECD Publishing, Paris.
Adams, R., M. Wu, and M. Wilson (2012), ACER ConQuest 3.1, ACER, Melbourne.
Ganzeboom, H. B.G. (2010), Questions and Answers about ISEI-08,
www.harryganzeboom.nl/isco08/qa-isei-08.htm, last accessed 17 March 2015.
International Labour Organization (ILO) (2007), Resolution concerning updating the International
Standard Classification of Occupations,
www.ilo.org/public/english/bureau/stat/isco/docs/resol08.pdf, last accessed 17 March 2015.
OECD (2014), PISA 2012 Technical Report, OECD Publishing, Paris.
OECD (2013), PISA 2012 Assessment and Analytical Framework: Mathematics, Reading, Science,
Problem Solving and Financial Literacy, OECD Publishing, Paris.
OECD (2009a), PISA Data Analysis Manual. SAS®, Second Edition, OECD Publishing, Paris.
OECD (2009b), PISA Data Analysis Manual. SPSS®, Second Edition, OECD Publishing, Paris.
Wolter, K.M. (2007), Introduction to Variance Estimation, Second edition, Springer, New York.