PISA 2015: EU performance and initial conclusions regarding ...
32
Transcript of PISA 2015: EU performance and initial conclusions regarding ...


PISA 2015
EU performance and initial conclusions
regarding education policies in Europe
EUROPEAN COMMISSION
2016 Directorate-General for Education and Culture EN

Manuscript completed on 6 December 2016

3
PISA 2015: EU performance and initial conclusions regarding education policies in Europe December 2016
Executive summary
The OECD Programme for International Student Assessment (PISA) is the basis for the ET 2020 benchmark on underachievement of 15-year olds in basic skills. The indicator states that by 2020, the share of 15-year-olds who are low achievers in reading, maths and science should be less than 15% in the EU. PISA data on educational outcomes are collected every three years. PISA 2015 is the sixth round of this survey; it has a special focus on science performance.
Generally speaking, EU Member States show great variation with regards to the share of low achievers in all three subjects, to the extent that no convergence across average performance of
EU Member States over time can be observed.
Five main findings from PISA 2015 can be summarised from this preliminary analysis.
1. When it comes to progress towards the 2020 benchmark of less than 15% low achievers, the
EU as a whole is seriously lagging behind in all three domains and has taken a step backward, compared to the PISA 2012 results (science: 20.6%, +4.0 percentage points; reading: 19.7%, +1.9 percentage points; maths: 22.2%, + 0.1 percentage point).
Low achievers cannot successfully complete basic tasks that are required in modern societies and the consequences of this underachievement, if it is not tackled successfully, will be eminent and costly in the long run for them individually, but also for societies as a whole.
2. Gender differences are not as strong as they used to be: the gap in the shares of low
achievers in mathematics and science between boys and girls continues to be negligible, which is promising for later STEM fields of study. The gender gap in reading has gone down
significantly – even if this is at the cost of an overall higher level of low performers.
3. Socio-economic status continues to be a strongly influential factor for 15-year-old students'
achievement in science, with much higher shares of low achievers among the lower social groups than among students of higher socio-economic status.
4. A student's immigrant background is an additional factor that is related to high shares of low
achievers in most EU Member States. Even though there is a correlation with the effects of
socio-economic background, too many of immigrant students do not achieve the necessary basic skills, even among those born in the country where the test was taken.
5. Participation in pre-primary schooling is highly correlated with higher performance among 15-
year-olds. It is vital that EU Member States provide comprehensive, high quality early childhood education and care that is attractive and easily available to all groups of their population, so that early foundations for good performance, but also social inclusion are laid.

4
PISA 2015: EU performance and initial conclusions regarding education policies in Europe December 2016
1. Introduction
In 2009, the EU Member States agreed on a set of education benchmarks that should be reached
by the year 2020, also referred to as the 'ET2020 benchmarks'; they were adopted by the European Council in May 2009 as an important component of the strategic framework for European cooperation in education and training (ET 2020)1. These benchmarks are closely monitored by the European Commission in cooperation with the EU Member States. The key publication that informs the public about the state of the benchmarks in the EU Member States is the Education and Training Monitor, which is published annually2.
One of these benchmarks aims at reducing the share of 'low achievers' in reading, mathematics and science to below 15% by 2020. This ET 2020 benchmark is based on the OECD PISA Survey, where 'low achievement' equals a performance on the PISA scale for mathematics, reading or science that is below Level 2.
The OECD PISA Survey (Programme for International Student Assessment) is a key international educational skills assessment that has sparked educational reforms across participating countries
and economies since the launch of the results of the first assessment that took place in 2000. The 2015 round of the PISA survey was carried out in 28 EU Member States – the first time that all EU Member States are covered, among 72 countries and economies worldwide. The results of this sixth, 2015 round of PISA will be officially presented on 6 December in a joint Commission/OECD event in Brussels, representing a building block of the two institutions' intensive
and productive cooperation that spans not only PISA, but also other international assessments, like PIAAC and TALIS, the Education Policy Outlooks, studies and various other projects. PISA results strengthen the knowledge base of the Commission and allow for in-depth analysis of factors influencing educational outcomes. Like in previous rounds of the survey, the PISA 2015 report offers key insights into the performance of school systems, at the EU level, in EU Member States and in a broader global
context. It provides new evidence on students' competences in science, reading and maths and their development in participating countries over time. This way, participating countries and
economies can assess the success of their recent education policy reforms and identify the need for further activities. For EU Member States, PISA is a prominent source of information for the ET2020 strategic framework, the Europe 2020 strategy and the European Semester, where it is widely used in the
fields of reading, mathematics and science and especially low achievers. In PISA 2015, the major domain analysed among the student competences is science, while reading and mathematics are minor domains, since the major domain rotates every PISA cycle3. This means that, even though overall results are available for all three domains, detailed analyses are conducted for the science domain.
Basic levels of proficiency in all three domains tested in PISA are fundamental for mastering the challenges and achieving success on a personal and professional level later in life. These days, especially the understanding of science and technology is an essential component for a successful professional and social life. Furthermore, the culture of science is fundamental to cope with the technological and political complexities of a modern democratic society.
The OECD defines the basic levels of proficiencies as follows: 'In all three PISA core subjects, the baseline level is the level at which students are able to tackle tasks that require, at least, a minimal ability and disposition to think autonomously.
1 http://eur-lex.europa.eu/LexUriServ/LexUriServ.do?uri=OJ:C:2009:119:0002:0010:en:PDF 2 European Commission (2016): Education and Training Monitor. Annual publication; most recent 2016.
http://ec.europa.eu/education/policy/strategic-framework/et-monitor_en 3 Results from further analyses on students' well-being, financial literacy and collaborative problem solving will be reported
in 2017.

5
PISA 2015: EU performance and initial conclusions regarding education policies in Europe December 2016
In science, the baseline level of proficiency corresponds to the level at which students can not only use everyday knowledge about familiar scientific phenomena to recognise the correct explanation for them, but can also use such knowledge to identify the question being addressed in a simple
experimental design or to identify, in simple cases, whether a conclusion is valid based on the data provided. In mathematics, the baseline level of skills is defined as the level at which students can not only carry out a routine procedure, such as an arithmetic operation, in situations where all the instructions are given to them, but can also interpret and recognise how a (simple) situation (e.g. comparing the total distance across two alternative routes, or converting prices into a different
currency) can be represented mathematically. In reading, the baseline level of skills is defined as the level at which students can not only read simple and familiar texts and understand them literally, but can also demonstrate, even in the absence of explicit directions, some ability to connect several pieces of information, draw inferences that go beyond the explicitly stated information, and connect a text to their personal
experience and knowledge'4.
Education systems of all participating countries aim at equipping all their students with these basic competences. Where substantial shares of 15 year old pupils do not reach these levels and thus are low performers in one or more of these domains, education systems must react and aim at increasing the shares of students that reach the basic levels. As mentioned above, EU Member States have agreed to reduce the shares of low achievers in reading, maths and science to below
15% by 2020.
2. EU performance in 2015 – low achievers in science
In 2015, only two EU Member States (EE, FI) reach the ET2020 benchmark and have a share of low achievers that is below 15% (Figure 2.1). The average share of low achievers in science in the EU is 20.6%, more than five percentage points above the benchmark aspired for 2020.
Figure 2.1. Share of low achieving students in science, 2015
Source: OECD (PISA 2015). Note: Countries are ordered by low to high share of low achievers in science.
While the proportion of students who score below proficiency Level 2 in science in EE and FI is quite low at 8.8% and 11.5% respectively, it is particularly high in some EU countries (above 30% in SK, MT, EL, BG, RO, CY). In SI it is right at the benchmark level (15%), in IE, DK, PL and DE it is at or below 17%. Other countries, like LV, PT, UK, ES, NL and BE have shares of low achievers
4 OECD (2016): PISA 2015 Volume I, Chapter 8: 'What PISA results imply for policy'.
0%
5%
10%
15%
20%
25%
30%
35%
40%
45%
EE FI SI IE DK PL DE LV PT UK ES NL BE EU CZ AT SE FR IT HR LT LU HU SK MT EL BG RO CY
2015 Benchmark 2020

6
PISA 2015: EU performance and initial conclusions regarding education policies in Europe December 2016
below 20%. This shows that, while there is considerable variation among EU Member States (the share in EE is almost a fifth of that in CY), there are too few Member States close to the benchmark that they aim to reach by 2020. In fact, in 2015 the EU average is, at 20.6%, 4
percentage points higher than in 2012 and almost 1.4 times the share of low performers in science that Member States should reach only five years later. In sum, there are big challenges ahead for many EU Member States in the coming years. A more detailed analysis on which aspects need special attention follows below.
3. Performance of EU countries with regard to the ET2020 benchmark since 2009
3.1. Setbacks in science, reading and mathematics The PISA 2015 results, like previous PISA cycles, clearly indicate that performance is highly correlated across all three areas of basic skills (science, reading and mathematics). Member States that show certain levels of basic skills in one of the areas tend to perform similarly in the other areas. Therefore, policies designed to tackle low achievement are often valid for all three areas, or have common elements. A good point of departure is the share of students who are low achievers
in all three domains at the same time. This share of 'combined low-proficiency' is much lower than in any of the individual shares of low achievers in each domain (see Figure 3.1).
Figure 3.1. Share of low achieving students in all three domains science, reading and maths, 2015
Source: OECD (PISA 2015). Note: Countries are ordered by low to high share of low achievers in science, reading and maths.
The rank order of EU Member States and their shares of low achievers across the three domains
strongly resemble the one with low achievers in science, on a lower level. Here, the EU average is 12.3%, with seven Member States showing shares of less than 10% (EE, FI, IE, DK, SI, PL, DE) and six countries above 20% (SK, EL, MT, RO, CY, BG), but none reaching 30%. It must be kept in mind, though, that by failing to meet the minimum standards required in three essential subjects, these students are most likely to face serious problems in their further education, on the labour market and later in life.
0%
5%
10%
15%
20%
25%
30%
35%
40%
45%
EE FI IE DK SI PL DE UK ES LV PT NL SE IT EU BE AT CZ HR FR LT LU HU SK EL MT RO CY BG

7
PISA 2015: EU performance and initial conclusions regarding education policies in Europe December 2016
Science The average share of low achieving students in science in EU Member States has grown sharply in
PISA 2015 (20.6%), compared to PISA 2012 (16.6%) and PISA 2009 (17.7%). Even though there have been substantial changes in the PISA methodology in 20155, this is an indication that EU countries are not making sufficient progress towards reducing the share of low achievers in science.
Figure 3.2 compares PISA 2015 performance with the performance in science in 2009 and 2012. It illustrates
that the 2015 results in science provide a serious setback for the EU as a whole and that only very few EU Member States were able to improve their performance against this general trend.
Figure 3.2. Progress towards meeting the Benchmark of low achievers
in science, 2009-2015
Source: OECD: PISA 2009, 2012, 2015. Countries are ordered by low to high share of low achievers in science and sorted by
2015. CY did not participate in PISA 2009; Data are missing for AT in 2009; MT did not participate in PISA 2012.
While in several countries, the change from 2009 (green triangle) to 2012 (red line) was improving – a reduction in the share of low achievers – this trend does not continue to 2015 in most Member States. In fact, only PT (-1.6 percentage points), DK (-0.8 percentage points) and SE (-0.6 percentage points) have been able to reduce the share of low achievers in science since 2012. This makes PT the only EU Member State to show a constant decrease over time – not only since 2009, but since the PISA tests started.
In comparison to 2012, most EU Member States have higher shares of low achievers in science in
2015. The increase lies near the average EU increase (4 percentage points) in CY (+4.1 percentage points), IE (+4.2 percentage points), but exceeds it in IT (+4.5 percentage points), DE (+4.8 percentage points), AT (+5 percentage points), NL (5.4 percentage points), CZ (6.9 percentage points), EL and PL (7.2 percentage points each), HR (7.4 percentage points), HU (8.0 percentage
points) and LT (8.7 percentage points).
5 This refers especially to the introduction of Computer Based Assessment instead of Paper Based Assessment and an
updated framework for the subject science. The OECD states that 'changes to the assessment design, the mode of delivery, the framework and the set of science items were carefully examined in order to ensure that the 2015 results can
be presented as trend measures at the international level'. For more information, refer to OECD (2016): PISA 2015
Volume I: Reader's Guide.
0%
5%
10%
15%
20%
25%
30%
35%
40%
45%
50%
EE FI SI IE DK PL DE LV PT UK ES NL BE EU CZ AT SE FR IT HR LT LU HU SK MT EL BG RO CY
2015 2012 2009
The EU has taken a backward step in its efforts to reduce
the share of low achievers in
science since 2012

8
PISA 2015: EU performance and initial conclusions regarding education policies in Europe December 2016
Compared to 2009, the only countries where the low-achiever shares decreased in 2015 are DK, BG and RO; the share remained stable in MT (which did not participate in 2012). Given their generally high rates of low achievers, it is good that these three countries have not increased their
shares of low achievers since 2009. Reading On average in the EU, the percentage of low achievers in reading has grown from 17.8% in 2012 to 19.7% in 2015, annulling all the progress made since 2009, when it was also 19.5%. Only four
EU Member States reached the benchmark of below 15% in 2015 (IE, EE, FI, PL); DK was right at the 15% mark; DE, ES, PT, LV, UK, NL, SE, BE and HR are below 20%. The share of low achievers in reading is above the EU average in HR (19.9%), IT (21.0%), FR (21.5%), CZ (22.0%), AT (22.5%), LT (25.1%), LU (25.6%), EL (27.3%), HU 27.5%, SK (32.1%), MT and CY (35.6% each), RO (38.7%) and BG (41.5%).
Figure 3.3 shows that, in line with the overall EU average, most Member States showed higher
rates of low achievers in reading in 2015 than in 2012. Contrary to this trend, only four countries were able to improve in this respect with lower rates of low achievers in 2015 than in 2012: SI (-6 percentage points), SE (-4.3 percentage points), ES (-2.1 percentage points) and PT (-1.6 percentage points). Several Member States recorded above EU-average increases in the share of low achievers: HU (+7.8 percentage points), CZ (+5.2 percentage points), EL (+4.7 percentage points), NL (+4.1 percentage points) LT and SK (+3.9 percentage points), PL (+3.8 percentage
points) and LU, BE (+3.5 percentage points each), AT (+3.0 percentage points), CY (+2.9 percentage points), FR (+2.6 percentage points) and BG (+2.1 percentage points). In comparison to 2009, when the ET2020 benchmarks were introduced, the greatest progress was achieved by IE (17.2% in 2009, 10.2% in 2012) and SI (21.2% in 2009, 15.1% in 2012). Among the two countries with the highest share of low achievers in reading that participated in all three cycles, RO has partially undone its 2012 improvement, whereas in BG it now exceeds that of both
2009 and 2012.
Figure 3.3. Progress towards meeting the Benchmark of low achievers
in reading, 2009-2015
Source: OECD: PISA 2009, 2012, 2015. Countries are ordered by low to high share of low achievers in reading and sorted by
2015. CY did not participate in PISA 2009; Data are missing for AT in 2009; MT did not participate in PISA 2012.
0%
5%
10%
15%
20%
25%
30%
35%
40%
45%
50%
IE EE FI PL DK SI DE ES PT LV UK NL SE BE EU HR IT FR CZ AT LT LU EL HU SK MT CY RO BG
2015 2012 2009

9
PISA 2015: EU performance and initial conclusions regarding education policies in Europe December 2016
Mathematics Among the three domains, the share of low achievers is highest in mathematics, just like in
previous years and almost unchanged; it was 22.2% on average in the EU Member States in 2015, up only slightly, by 0.1 percentage point compared to PISA 2012 (22.1%) and only slightly lower than in PISA 2009 (22.3%). There are only three Member States that reached the benchmark in 2015: EE (11.2%), DK and FI (13.6% each), with IE right at 15%. Only four countries have a share of low achievers between the benchmark value and 20% (SI: 16.1%, NL: 16.7% and PL and DE: 17.2%).
The share of low achievers is above average in twelve Member States: IT (23.3%), FR (23.5%), PT (23.8%), LT (25.4%), LU (25.8%), SK (27.7%), HU (28.0%), MT (29.1%), HR (32%), EL (35.8%), RO (39.9%), BG (42.1%) and CY (42.6%). Compared to 2012 and in contrast to the general trend, twelve EU Member States were able to
reduce their share of low achievers (see Figure 3.4); only marginally in some countries
(between -0.1 and -0.9 percentage points: HU, DE, LT, RO), between -1 and -2 percentage points in five other (IE, BG, ES, IT, PT), and more substantially in three others: SE (-6.2 percentage points), SI (-4.0 percentage points), DK (-3.3 percentage points). This contrasts with an increase in the share of low achievers in mathematics in several EU countries, which is especially
unfortunate in those Member States that already were above the benchmark in 2012: LV, LU (+1.5 percentage points each), HR (+2.2 percentage points), AT (+3.1 percentage points), NL (+1.9 percentage points) and PL (+2.8 percentage points, thus losing almost half of its impressive progress of 6.1 percentage points between 2009 and 2012).
Figure 3.4. Progress towards meeting the Benchmark of low achievers
in mathematics, 2009-2015
Source: OECD: PISA 2009, 2012, 2015. Countries are ordered by low to high share of low achievers in maths and sorted by
2015. CY did not participate in PISA 2009; Data are missing for AT in 2009; MT did not participate in PISA 2012.
0%
5%
10%
15%
20%
25%
30%
35%
40%
45%
50%
EE FI DK IE SI NL PL DE BE SE LV CZ AT UK ES EU IT FR PT LT LU SK HU MT HR EL RO BG CY
2015 2012 2009
The EU needs to increase
its efforts to reach the 2020 benchmarks for
reading and mathematics
performance

10
PISA 2015: EU performance and initial conclusions regarding education policies in Europe December 2016
The trends from 2009 to 2015 are quite diverse across Member States: while in some the shares of low achievers increased considerably (e.g. FI, NL, SK, HU, EL), they went down in others (e.g. EE, DK, IE, SI, PL, DE, ES, IT, MT, RO and BG). Only very few countries show a steady 6-year trend,
with FI, NL and LU worsening and IE, DE, LT and BG improving. Implications for education and training policies – Learning from successful countries Against this general rise in low achievers across the three domains – science, reading and mathematics – since 2012, it is worth looking at Member States who have been able to withstand
this overall trend. It is even more relevant to scrutinise countries that have been successful in more than one subject. Here, two Member States were successful at lowering the share of low achievers in all three subjects: SE more substantially in maths (-6.2 percentage points) and reading (-4.3 percentage points), but also slightly in science (-0.6 percentage points) and PT in all three subjects, by 1.6
percentage points in science and reading and 1.1 percentage points in maths.
Taking a closer look at Sweden reveals that, after the 'PISA-Shock' following the 2006 to 2012 PISA results, significant measures were taken to restore the results to their originally very good starting points in the early 2000s. This includes measures like the 'Boost for Teachers' programme (Lärarlyftet) (2007-11), which offered 30 000 teachers the possibility of following advanced continuing professional education at higher education institutions. 'Boost for Teachers II' offers the
possibility for registered teachers without formal teaching qualification in a subject or age group they teach, to take specialised courses. The programme has been extended and prolonged from 2012 until 2018. In 2012, continuing professional development courses to become a special needs teacher were integrated into this programme. The career development reform from 2013 continues to provide an increase in salary and career advancement steps for one in six teachers. The government also supports teachers’ continuous professional development through two
initiatives: 'Boost for Mathematics' (Matematiklyftet) and 'Boost for Reading' (Läslyftet), the most collaborative learning programmes ever developed in SE. These programmes started in 2012, with three out of four teachers participating in this action, so the fact that 15-year-olds improved so much in the two domains 'boosted' in Sweden, reading and maths, might be related to the specific
policy efforts in these subjects. There is also the Programme for Professional Development for School Leaders, which focuses on
pedagogical leadership within steering and guidance. It is aimed at principals who have worked for at least one year and been responsible for curriculum-steered activities. The programme started in 2011 and has been prolonged until 2018. The other positive example is Portugal. Here, extensive reforms were launched in basic education (2011-15): these included changes to curricula in 2012 to increase performance rates. New
learning outcomes and didactic materials were also introduced in Mathematics and Portuguese Language. In addition, there was a reform of teacher training to strengthen teachers’ qualifications, particularly in scientific fields, in specialised teaching methods and in introducing students to professional practice. In addition, entry requirements for teacher training programmes were changed: a compulsory exam for all candidates applying for a teaching position in public schools was introduced6. There were also new initiatives aiming at tackling school failure and promotion of the quality and effectiveness of learning by grouping students with similar school performance, and
introducing alternative curricular paths for struggling students.
With regard to secondary education, recent policy has endeavoured to improve vocational education and adapt it to students’ needs by increasing supply and developing, since 2005, a national vocational education and training strategy involving the business sector and increased hours in a work context. The developments regarding teacher training and appraisal for basic education also apply to this level of education, although there seems to exist greater concern with
the quality of teachers at lower levels of education, who were trained in the polytechnic sector.
6 However, the measure was ruled unconstitutional, and the incumbent government has dropped it.

11
PISA 2015: EU performance and initial conclusions regarding education policies in Europe December 2016
In the highly centralised PT education system, the introduction of autonomy contracts for schools between 2012 and 2015 opened new opportunities for education centres to design and implement measures to ensure the quality of learning; by 2015, 212 schools had signed such a contract.
Thus, as different as these countries, their outcomes and their policies are, the emphasis on quality education and especially on the role of teachers is apparent. This confirms the key findings summarised in the 2016 Education and Training Monitor7: teachers and school leaders play a crucial role in innovation at school and improving student performance. Creating collaborative work environments, supporting professional development and providing effective feedback are among the measures that can help them play this role and act as agents of change for innovation and school development.
In addition, there is a wide range of approaches to school governance that can help countries achieve sustainable innovation and inclusion, ranging from school evaluation to the organisation of teaching and learning as well as to staff collaboration. In recent years, the policy dialogue on schools has proposed a learner-focussed whole-school approach that connects the school to the local community and focusses on the use of school development plans and internal evaluation (see
also section 3.3. on p. 18 of this note).
Implications for education and training policies – The limited role of funding Since the question of funding is often discussed in relation to improving school outcomes, it is important to note here that higher public expenditure on education has not always delivered better
results. However, quality outcomes cannot be achieved below a minimum level of spending. Money is necessary to secure high quality and equitable participation in school, but it is not the only factor that guarantees high performance. Real public expenditure per primary and secondary student rose by around 7% between 2006 and 2014 on average across the EU8. Yet, students’ mean reading proficiency has stagnated since 2000, and there has been no notable reduction in the percentage of students performing below the baseline level of proficiency. For the majority of OECD countries with average or high spending levels, there is essentially no statistical relationship between
spending per student and outcomes in PISA; this is only the case for low-spending countries, where the amount of funding is correlated with learning outcomes9.
Implications for education and training policies – General conclusions Various factors, school-related and systemic alike, contribute to underachievement. An
unfavourable school climate, violence and bullying, a learning environment in which learners do not feel respected or valued, insufficient learner support and poor teacher-pupil relationships may lead learners to underperform10. At the same time, appropriate school-related policy responses that address the structure and quality of education systems may have a strong impact on learners’ performance.
Underachievement can be effectively tackled at the national level by looking at the whole spectrum of education and training systems, starting from early childhood education and care, including non-formal learning, and promoting measures to support learners' progress, educational achievement and completion of education11. EU Member States are already working with each other and with the European Commission through the Open Method of Coordination to improve their education systems and optimise their education
policy approaches. The 2015 Joint Report of the Council and the Commission on the
implementation of the Strategic framework for European cooperation in education and training
7 European Commission (2016): Education and Training Monitor 2016. http://ec.europa.eu/education/policy/strategic-
framework/et-monitor_en 8 Eurostat, General government expenditure by function (COFOG) and UOE data on pupils by ISCED level, annual data. 9 OECD (2016): PISA 2015, Volume I, Chapter 8: What PISA results imply for policy. 10 For system-related factors that influence early school leaving, see European Commission/EACEA/Eurydice/CEDEFOP
(2014): Tackling early leaving from education and training in Europe 11 The Eurydice network carries out systematic monitoring of policy measures to reduce underachievement. See: European
Commission/EACEA/Eurydice (2016): Structural Indicators for Monitoring Education and Training Systems in Europe.
Eurydice Background Report to the Education and Training Monitor.

12
PISA 2015: EU performance and initial conclusions regarding education policies in Europe December 2016
(ET2020) sets new priorities for European cooperation in education and training12. It emphasises that relevant and high-quality learning requires a more active use of innovative pedagogies, strong support for educators, facilitating learning mobility, strengthened and simplified EU transparency
and recognition tools and filling the investment gap. To achieve these goals, the ET2020 tools have been strengthened and now include a new generation of Working Groups that work on the ET 2020 priority areas, ET 2020 peer learning activities, including peer reviews and peer counselling, and the dissemination of good practices. Given the high levels of low performers in many EU Member States in 2015, it seems important that this cooperation is continued and intensified in order to come close to reaching the benchmark
of less than 15% of low achievers by the year 2020. The following paragraphs add an overview over trends for aspects as gender, socio-economic status, immigrant background as well as participation in early childhood education and care.
3.2. Performance of students by gender Reading: The gap between boys and girls has shrunk considerably - at an overall higher rate In reading, girls still outperform boys in all EU countries by a large margin. On average in the EU the share of low achievers in reading is 15.9% among girls and 23.5% for boys. However,
compared to previous PISA cycles, this gender gap has shrunk considerably. While countries have made substantial efforts to reduce the gender gap and encourage boys to improve their reading skills, this might also be, at least partly, a result of the fact that, different from the last PISA cycles, PISA was administered electronically (see also footnote 5). Given that boys use computers and electronic games more often, their greater familiarity with electronic reading might have helped them overcome some of the disadvantage they had in comparison with girls with regard to
'traditional' reading skills in previous PISA cycles. This is also more in line with the findings of the – electronically administered – Survey of Adult Skills (PIAAC, 2012), which only showed minor differences in the levels of reading skills among the younger age groups, which are those that participated in previous PISA cycles.
Figure 3.5. Share of low achieving boys and girls in reading 2015 (above) and development of the gender gap for low achievement in reading 20012-2015 (below)
12 Joint Report of the Council and the Commission on the implementation of the strategic framework for European
cooperation in education and training (ET 2020) — New priorities for European cooperation in education and training,
2015/C 417/04.
0%
5%
10%
15%
20%
25%
30%
35%
40%
45%
50%
FI EE IE SI PL LV DK SE ES DE PT NL UK HR EU FR CZ BE LT IT AT EL LU HU CY SK MT BG RO
Shar
e o
f lo
w a
chie
vme
nt
Boys Girls Benchmark 2020

13
PISA 2015: EU performance and initial conclusions regarding education policies in Europe December 2016
Source: OECD (PISA 2012 and 2015). Note: Countries are ordered by the performances of girls (above) and by 2015 gaps
between boys and girls (below). The gaps between boys and girls are illustrated as the score for boys minus the score for gir ls.
2012 data are missing for MT.
The countries with the largest gender gap are BG and CY (Figure 3.5). The gender gap in BG has shrunk considerably, from 23.9 percentage points to 17.3 percentage points and seems to be on the right track. The countries that show a
gender gap below or at 5 percentage points are IE and BE. All EU countries narrowed the gender gap between 2012 and 2015, which accounts for a change of 4.1 percentage points at the EU level, from 11.7 to 7.6. The countries that show the strongest decrease of their gender gaps between 2012 and 2015 are RO, IT, AT, HR, SI and LT.
Mathematics and science: no striking gender gaps PISA data show for 2015, just like they did for previous years, that there are no striking differences in the share of low achievers in maths and science between boys and girls, with slightly higher shares of boys in most cases (see Figures 3.6 and 3.7).
Across EU countries, the percentage point difference between the shares of boys and girls below level 2 in mathematics remained small, with a very slight increase from 1.7 percentage points in 2012 to 1.9 in 2015. A look at the individual countries shows that in no Member State, the difference is much higher than 5 percentage points. In mathematics, there is no
clear pattern for the higher shares of boys or girls among low achievers, although the EU average shows a slightly higher share of low achieving girls, at 23.2%, compared to boys at 21.2%.
0%
5%
10%
15%
20%
25%
IE BE DE DK UK RO IT PT AT ES NL LU EE EU HU FR PL HR CZ FI SI SE SK LV LT EL MT BG CY
Pe
rce
nta
ge p
oin
t d
iffe
ren
ce
be
twe
en
bo
ys a
nd
gir
ls
2012 2015
Gender
differences in science and
mathematics are shrinking further
The large disadvantage of boys in reading skills has
shrunk considerably and in all EU Member States: the gender gap in reading
is smaller than in
previous PISA cycles

14
PISA 2015: EU performance and initial conclusions regarding education policies in Europe December 2016
Figure 3.6. Share of low achieving boys and girls in maths 2015 (above) and development of the gender gap for low achievement in maths 2012 and 2015 (below)
Source: OECD (PISA 2012 and 2015). Note: Countries are ordered by the performances of girls (above) and by 2015 gaps
between boys and girls (below). The gaps between boys and girls are illustrated as the score for boys minus the score for girls.
2012 data are missing for MT.
The gender breakdown amongst the low achievers in science is shown Figure 3.7. It indicates a pattern similar to the one found for mathematics, although the differences within Member States
are still higher, up to 10 percentage points. The share of low achievement in science in the EU average, however, is only very slightly higher among boys (20.7%) than it is among girls (20.4%). This difference is even more negligible and has further gone down in the EU average since 2012, when it was 1.8 percentage points.
0%
5%
10%
15%
20%
25%
30%
35%
40%
45%
50%
EE FI DK IE SI NL PL DE SE LV BE CZ FR EU UK ES LT PT AT IT LU MT SK HU HR EL RO BG CY
Shar
e o
f lo
w a
chie
vme
nt
Boys Girls Benchmark 2020
-10%
-5%
0%
5%
10%
15%
20%
25%
AT IT DE HR ES UK PL BE EU LU IE HU DK PT SK RO SI FR CZ NL EE EL SE LT BG LV MT CY FI
Pe
rce
nta
ge p
oin
t d
iffe
ren
ce
be
twe
en
bo
ys a
nd
gir
ls
2012 2015

15
PISA 2015: EU performance and initial conclusions regarding education policies in Europe December 2016
Figure 3.7. Share of low achieving boys and girls in science 2015 (above) and development of the gender gap for low achievement in science 2012 and 2015 (below)
Source: OECD (PISA 2012 and 2015). Note: Countries are ordered by the performances of girls (above) and by 2015 gaps
between boys and girls (below). The gaps between boys and girls are illustrated as the score for boys minus the score for girls.
2012 data are missing for MT.
Implications for education and training policies
It is a remarkable success of recent years that the gender gap in mathematics and science is, at the EU level, practically non-existent in 2015. And it is a very important step forward that the share of low-achieving boys in reading literacy has fallen and is no longer so much higher than the girls', even if it is the overall increased share of low-achieving girls that contributed most to narrow the gap. But even though it is great news that the universal, persistent and significant gender gap in reading literacy has shrunk considerably since 2012, it is important to persist in policy measures aimed at reducing this gap and further encouraging boys and girls to read well.
0%
5%
10%
15%
20%
25%
30%
35%
40%
45%
50%
EE FI SI LV IE DK PL PT UK NL DE ES SE EU CZ BE FR AT LT HR IT HU LU EL SK MT BG RO CY
Shar
e o
f lo
w a
chie
vme
nt
Boys Girls Benchmark 2020
-10%
-5%
0%
5%
10%
15%
20%
25%
IT AT DE BE LU DK UK HR ES PL EU CZ PT IE HU NL EE SK SI FR RO SE LT MT LV FI EL BG CY
Pe
rce
nta
ge p
oin
t d
iffe
ren
ce
be
twe
en
bo
ys a
nd
gir
ls
2012 2015

16
PISA 2015: EU performance and initial conclusions regarding education policies in Europe December 2016
The continued high levels of low achievement among boys may be related to more general aspects of boys' participation at school. Boys generally show lower levels of performance, lower levels of engagement with school and a lower motivation for reading. Research has explored the following
explanations for this performance gap: boys and girls tend to participate in different study programmes; boys tend both to fall behind in school and repeat school years more frequently than girls; and women and men react differently to the changing characteristics of the labour market13. Therefore, there is a need for specific actions in order to motivate boys to read and to perform better in school overall. This should be done through coherent approaches to reading and writing, taught as essential skills across the curriculum; and through attractive, age- and gender-specific
reading materials with digital reading as part of the norm in schools. Such approaches must also involve parents and peers to engage boys in reading as a social activity. Engaging male role models in literacy and attracting more men into the teaching professions are other important elements14.
3.3. Performance of students by socio-economic status Socio-economic status15 is one of the main determinants for success in education systems and societies overall and thus especially for the acquisition of basic skills16. This strong correlation has considerable influence both on the individual and on the country-level performance. In many countries, schools tend to reproduce existing patterns of socio-economic advantage, rather than contribute to a more equitable distribution of learning opportunities and outcomes. But there are
also countries that are able to combine both low levels of low achievement with a low level of reproduction of socio-economic patterns.
In order to visualise the different shares of low achievers among students with different social backgrounds, Figure 3.8 shows the share of low achievers in science in PISA 2015 in the bottom
quarter of PISA’s socio-economic index and the share of low achievers in science among the upper 25% of this index; thus, this comparison includes half of the student population that took part in PISA 2015 and is not just a comparison of extremes.
The EU average share of low achievers in science within the bottom quarter on the socio-economic index of the 2015 PISA student population is 33.8% – i.e. 26.2 percentage points more than
among the students with the higher social backgrounds at 7.6%. Several EU Member States (BG, CY, RO) have shares of above 50% of low achievers among the lower social quarter; the share is 49.9% in SK. This means that in these Member States, (less than) half of 15-year-olds from lower social backgrounds reach the basic skills in science. There are only two Member States in which less than one-fifth of the students from the poorer social quarter of society do not reach the basic level in science: FI, at 19.7%, and EE at 13.5%.
It is interesting to note that the gap among the upper and lower social quarters is very different across EU Member States: while it is 26.2 percentage points in the EU average, it is especially large in BG (42.1 percentage points) and above 35 percentage points in LU, HU, RO, SK and EL; but the gaps in low achievers between the richer and poorer quarters are not necessarily high only in countries with overall high levels of low achievement: this gap is also quite high in FR (34.6
percentage points), CZ (30.5 percentage points) and BE (29.3 percentage points). These three countries are, contrary to their overall around average performance, very successful at achieving a very low rate of low achievers among students from the higher social quarter. In fact, 18 out of 28
13 Pekkarinen, Tuomas (2012), Gender differences in education; European Commission/EACEA/Eurydice (2010), Gender
differences in educational outcomes: Study on the measures taken and the current situation in Europe); Buchmann,
Claudia, Thomas A. DiPrete, and Anne McDaniel (2008), Gender inequalities in education. 14 European Commission (2016): Education and Training Monitor, p. 665-66 and European Commission (2016), Study on
the Diversity Within the Teaching Profession with Particular Focus on Migrant and / or Minority Background. 15 Socio-economic status is a broad concept that summarises many different aspects of a pupil, school or system. In the
OECD PISA study, a pupil’s socio-economic status is estimated by the index that is based on such indicators as parental
education and occupation, and the number and type of home possessions related to education. These are considered
proxies for wealth and the educational resources available at home. 16 Other important individual-level background characteristics, such as migrant status, are to a large extent correlated with
socio-economic status. This is why, in order to assess the real impact of migrant background (section 3.4) (section 3.5),
socio-economic status has to be held constant, or confounding effects of socio-economic status have to be kept in mind.
A student's socio-economic status still is
the most influential factor for the acquisition
of basic skills

17
PISA 2015: EU performance and initial conclusions regarding education policies in Europe December 2016
EU Member States achieve rates of low achievers below 10% among their upper social quarters (HU, LU, FR, CZ, BE, AT, ES, NL, PT, PL, DE, IE, DK, SI, UK, LV, FI, EE).
On the other hand, several EU Member States have more 'equitable' distributions of low-achievers across socio-economic groups, with gaps between students from the upper and lower quartiles lower than 20 percentage points: EE and FI, as mentioned above, and LV, UK, SI and DK.
Figure 3.8. Low achievement in science by socio-economic status, 2015
Source: OECD (PISA 2015). Note: Countries are ranked in descending order of the average share of underachievement
amongst the bottom quarter of the PISA index of economic, social and cultural status (ESCS).
Implications for education and training policies Given that the influence of socio-economic status is a universal and powerful feature in all societies, education is one of the most important factors to overcome the disadvantages young persons from lower social backgrounds are facing. Therefore, it is crucial to increase the skills of the large shares of low achievers, especially among students from lower social backgrounds; often, they do not have sufficient support from their families, due to lower social and/or financial capital,
challenges with the language of instruction and other, related factors. This is where education policy must step in and support these young people so that they have better chances to achieve sufficient skill levels and to succeed in life.
Addressing low achievement among the students of lower socio-economic status may be a key factor to reducing the level of low achievement in the EU overall and the EU Member States.
Tackling low achievement in countries facing economic and social hardships may require a concerted effort that involves a variety of actors and resources that go well beyond the sphere of education. Low achievement can be effectively tackled at the national level by looking at the whole spectrum of education and training systems, starting from early childhood education and care, including non-formal learning and promoting measures to support learners' progress.
0%
10%
20%
30%
40%
50%
60%
70%
BG CY RO SK EL MT HU LU FR LT IT CZ HR BE AT EU SE ES NL PT DE PL IE UK DK SI LV FI EE
Bottom quarter of ESCS Top quarter of ESCS Average low achievement in science

18
PISA 2015: EU performance and initial conclusions regarding education policies in Europe December 2016
Such policies should include, as mentioned under section 3.5, early childhood education and care that will be used by all social groups, so that especially children from disadvantaged social backgrounds have the chance to attend several years of high quality early childhood education and
care, so that they can start school well prepared. In addition, it is important to create the conditions for the early diagnosis of low achievement, monitoring, and provision of the needed support at school level with a special focus on students with disadvantaged socio-economic backgrounds. In some countries, all-day schools can have a positive effect for low achievers. Providing incentives for highly qualified teachers to work with disadvantaged students combined with support structures for teachers to address related impediments can be identified as another important component of such policies.
Member States reached the conclusion that policies to reduce underachievement should be embedded in an overall inclusive learner-centred vision of education in which high-quality education is accessible to all. In this vision, schools are instrumental in ensuring that all learners reach their full potential for growth, irrespective of individual and family-related factors, socio-economic status and life experiences17. In this so-called 'whole school approach', all members of
the school community (school leaders, middle management, teaching and non-teaching staff,
learners, parents and families) feel responsible and play an active role in tackling educational disadvantage. A 'whole school approach' also implies a cross-sectorial approach and stronger cooperation with a wide range of stakeholders (social services, youth services, outreach care workers, psychologists, nurses, speech and language therapists, guidance specialists, local authorities, NGOs, businesses, unions, volunteers etc.) and the community at large, to deal with issues, which schools do not (and cannot) have the relevant expertise for.
3.4. Performance of students by immigrant status
In almost all Member States, the science skills of immigrant students lag behind those of non-migrant students. Second generation students – having been born in the host country – generally perform better than first generation students (see Figure 3.10).
Before looking at the differences between EU Member States regarding the performance of immigrants in their education systems, it is important to note
that the shares of immigrants vary considerably between the different countries. Table 3.9 informs about these differences, here giving the shares of second- and first-generation students among 15 year olds in the Member States.
Second-generation students are those born in the country of assessment with both parents foreign-born; first-generation students are foreign-born students whose parents are also foreign-born18:
While in LU, 30.6% of 15-year-olds are second-generation and 21.4% are first-generation immigrant students – which means that more than half of the student population has an immigrant background – these rates are considerably lower in the other EU Member States. Especially in many Eastern European countries, but also in MT, FI and ES, the shares of second-generation students are below 3 percent of the student population. The shares of first-generation students are below 3 percent in many Eastern European countries, but also in NL, DK and FI.
17 European Commission (2015), Schools policy. A whole school approach to tackling early school leaving. 18 Here, the large influx of refugees and asylum seekers into some Member States in 2015 is not yet taken into account.
Second generation
migrant pupils on average score better
than first generation
migrant pupils

19
PISA 2015: EU performance and initial conclusions regarding education policies in Europe December 2016
Table 3.9. Percentage of students with an immigrant background, 2015
% 2nd generation % 1st generation
EU 6.5% 4.8%
LU 30.6% 21.4%
DE 13.2% 3.7%
AT 12.7% 7.6%
SE 9.8% 7.6%
EE 9.3% 0.7%
HR 9.0% 1.8%
BE 9.0% 8.7%
FR 8.7% 4.5%
NL 8.6% 2.2%
UK 8.0% 8.8%
DK 7.9% 2.8%
EL 7.0% 3.8%
SI 4.5% 3.3%
LV 4.0% 1.0%
IE 3.4% 11.0%
PT 3.3% 4.1%
CY 3.2% 8.0%
IT 3.2% 4.8%
ES 1.9% 9.1%
FI 1.8% 2.2%
CZ 1.7% 1.7%
HU 1.5% 1.1%
MT 1.5% 3.5%
LT 1.4% 0.4%
SK 0.6% 0.6%
BG 0.5% 0.5%
RO 0.2% 0.1%
PL 0.1% 0.2%
Source: OECD (PISA 2015). Second generation students: children of immigrants who have been born in the host country; first
generation students: those who were born outside the country. EU average value based on the entire population of 15-year-
olds.
In order to avoid distortions of percentages in calculations based on very small sample sizes, this report shows results only for EU Member States where the shares of second-generation immigrant students are above 3 percent.
Figure 3.10. Share of low achievers in science by migrant status, 2015
Source: OECD (PISA 2015). Note: Countries are ordered by the performance of non-migrant students. Countries are ordered by
the performance of non-migrant students. EU average based only on results of the countries included in this figure (Table 3.9).
0%
10%
20%
30%
40%
50%
60%
70%
EE DE DK SI IE BE UK AT NL LU LV SE EU PT FR IT HR EL CY
Non-immigrants First-generation immigrants Second-generation immigrants
20
PISA 2015: EU performance and initial conclusions regarding education policies in Europe December 2016
In almost all of the Member States shown here, the difference in the share of low achievers between first-generation immigrant students and their non-immigrant counterparts is quite large. This gap is between 25 and 33 percentage points in SE, NL, FR, DK, BE, EL, DE, AT and SI. In most
EU Member States with more than 3% second generation immigrant students, the share of low achievers among second generation students is lower than among first-generation students, except in DK, IE and HR. This shows the reassuring finding that growing up in the country of the assessment is an advantage compared to moving there as a child or young person, although it would be desirable to have equal chances for all children growing up in the same country. Obviously, this helps with learning the language, but also with familiarity with the country and its education institutions, but it is not sufficient to reach the same levels as children with a non-
migrant background. But there are also Member States where the difference in the share of low achievers among first or second generation students is very small compared to non-immigrant students: these are IE, PT and, to a smaller extent, UK. Here, immigrants may have an advantage due to differences in the prevalent types of migration, students' countries of origin and their command of languages.
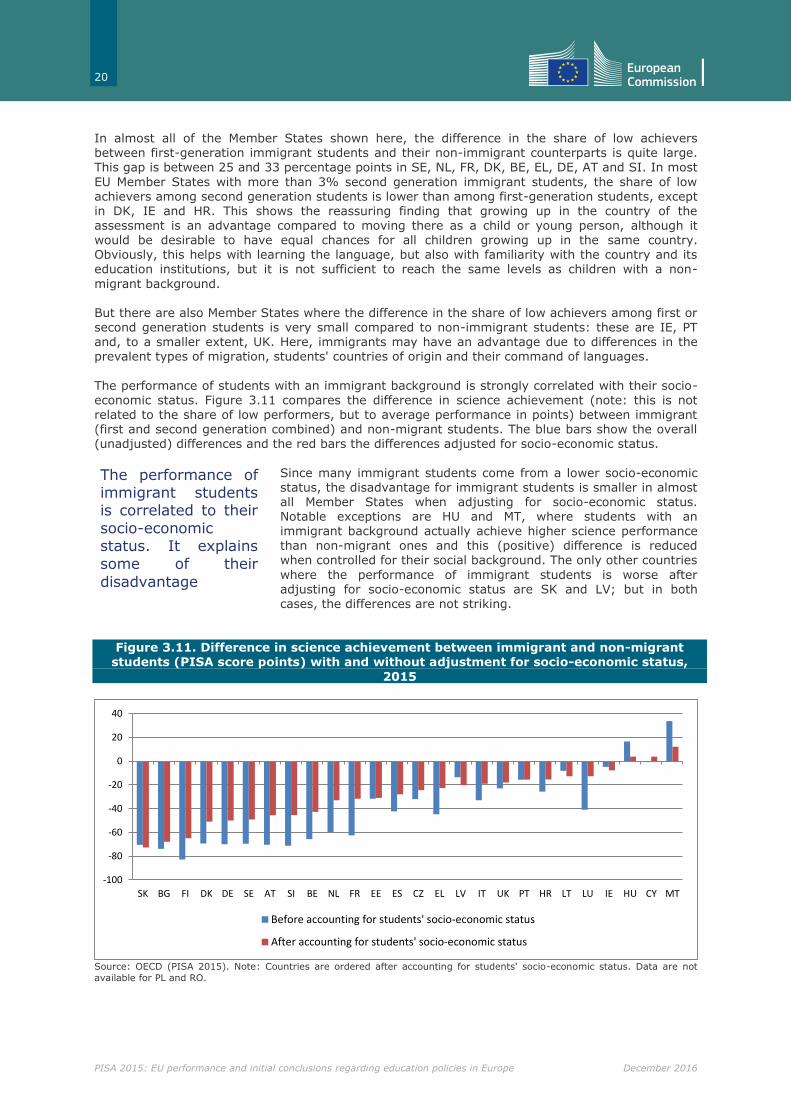
The performance of students with an immigrant background is strongly correlated with their socio-economic status. Figure 3.11 compares the difference in science achievement (note: this is not related to the share of low performers, but to average performance in points) between immigrant (first and second generation combined) and non-migrant students. The blue bars show the overall (unadjusted) differences and the red bars the differences adjusted for socio-economic status.
Since many immigrant students come from a lower socio-economic status, the disadvantage for immigrant students is smaller in almost all Member States when adjusting for socio-economic status. Notable exceptions are HU and MT, where students with an immigrant background actually achieve higher science performance than non-migrant ones and this (positive) difference is reduced when controlled for their social background. The only other countries
where the performance of immigrant students is worse after adjusting for socio-economic status are SK and LV; but in both cases, the differences are not striking.
Figure 3.11. Difference in science achievement between immigrant and non-migrant
students (PISA score points) with and without adjustment for socio-economic status,
2015
Source: OECD (PISA 2015). Note: Countries are ordered after accounting for students' socio-economic status. Data are not
available for PL and RO.
-100
-80
-60
-40
-20
0
20
40
SK BG FI DK DE SE AT SI BE NL FR EE ES CZ EL LV IT UK PT HR LT LU IE HU CY MT
Before accounting for students' socio-economic status
After accounting for students' socio-economic status
The performance of immigrant students is correlated to their
socio-economic status. It explains
some of their
disadvantage

21
PISA 2015: EU performance and initial conclusions regarding education policies in Europe December 2016
Implications for education and training policies Education is a powerful force for integrating immigrants, as reflected in a number of EU Council
conclusions on integration of third-country nationals and the Action Plan for the integration of third-country nationals (2016)19. But, as the results show, education systems perform very differently in successfully integrating students with immigrant backgrounds. Policies that Member States use to increase the chances of immigrant students ensure language support for students whose mother tongue differs from the language of instruction, education and career guidance as well as efforts to increase the flexibility and permeability of educational pathways – so that early decisions are not irreversible. Crucial for better educational outcomes is the early participation in
high quality early childhood education and care (ECEC, see 3.5 below). In addition, it is very important to promote a culture of inclusion in schools where diversity is gradually increasing and should also increase among the teaching staff. Integrating immigrants and fostering attachment to EU common values subscribes to the broader European agenda for active citizenship. The rise of populism and extremisms in Europe has placed
an even greater emphasis on the role of education in promoting EU common values and active
citizenship. In particular, in 2015 the EU ministers of education and the EU Commissioner for education adopted a declaration on 'Promoting citizenship and the common values of freedom, tolerance and non-discrimination through education'20, known as the Paris Declaration. The document calls for renewed efforts to improve the teaching and acceptance of EU common values and lay the foundations for more inclusive societies through education. The primary purpose of education is understood as not only the development of knowledge, skills and competences but
also the broader embedding of common values. In addition, education should help young people become active, responsible and open-minded members of society.
3.5. Performance of students by participation in ECEC Regarding early childhood education and care (ECEC), PISA 2012 results showed that the share of low achievers is smaller in all countries among students who had participated in pre-primary education, and more significantly so if they had participated in pre-primary education for more than one year. The PISA student questionnaire changed in 2015, adding the possibility of
answering the question about pre-primary participation with 'I do not remember' – so that varying shares, but up to 12.9% of participating students in EU Member States chose this answer (see
Figure 3.12). As a result of these high and varying shares of missing information about pre-primary schooling, there is no reliable answer about how different levels of PISA-performance relate to the students' participation in ECEC.
OECD analysis shows the differences of PISA outcomes for students who say they have participated in less than one year, between one and two years, between two and three years and 3 years or more in pre-primary
education. The data provided by the OECD21 show that, except for LV and BG, where the effects of participation in pre-primary education are negative for all lengths of participation, there is a strong positive correlation between participation in pre-primary education and performance in science in PISA 2015 across EU Member States.
The highest effect could be found for three or more years of pre-primary education, with a 93 point increase in the PISA science score in BE, 85 points in FR and 81 points in SE. This is equivalent to a learning advantage of about three school years. Even participation in
between two and three years of pre-primary education results in an increase of 80 points in BE, 72 in FR and 51 in SE.
19 Communication from the European Commission (2016): Action Plan on the integration of third country nationals,
COM(2016)377 final. 20 Informal meeting of European Union education ministers (17.03.2015): Declaration on promoting citizenship and the
common values of freedom, tolerance and non-discrimination through education. 21 OECD (2016): PISA 2015. Volume II, Table II.6.52
Pupils who attended pre-
primary school show a clear advantage in
science
performance

22
PISA 2015: EU performance and initial conclusions regarding education policies in Europe December 2016
Figure 3.12. Participation in pre-primary school, 2015
Source: OECD (PISA 2015). Note: Countries are ordered by more than one year of pre-primary education. Data are not
available for NL, MT and RO.
Implications for education and training policies
These findings show that current activities in all Member States to increase participation in ECEC, despite the success in recent years (the benchmark has reached 91.2% for 4-year-olds as the EU average in 201422), need to be intensified23. This is especially the case, as high-quality ECEC compensates the negative effects of growing up in a disadvantaged setting can have. At the same time, some Member States with very high participation rates in ECEC still show a high impact of socio-economic background on education outcomes, e.g. BE and FR. It would therefore be optimal
if all young children, starting at a very early age, had access to ECEC and benefited from early childhood education and care of high quality. All Member States have developed various forms of policy guidance to ensure the quality of ECEC or are currently discussing them. These include measures affecting the structure of ECEC provision, the quality of pedagogical processes in formal settings and child development outcomes. Structural quality, which looks at how the ECEC system is designed and organised, has long been legislated
for in all MS. Process quality concerns the practice within an ECEC setting. It often includes the role of play in the curriculum; relationships between ECEC providers and families; interactions between staff and children, and among children; the extent to which care and education is provided in an integrated way; parental involvement and the day-to-day pedagogic practice. Traditionally, process quality has been regulated and monitored to a lesser degree. An ET2020 working group therefore developed principles for an ECEC quality framework24. This proposal reflects experts’ consensus on quality principles in ECEC in five areas: access, workforce, curriculum, evaluation and monitoring,
and governance and funding. This work should be further developed in order to support ongoing discussions on the quality of ECEC in a number of Member States.
Qualitative indicators depicted in the 2016 Education and Training Monitor25 show favourable policy trends, with a number of EU Member States increasing minimum qualification requirements, enhancing curricula and providing more language support. One of the key challenges remains the
professionalisation of the ECEC workforce for children under the age of 3. For this age group, half of European countries currently do not ensure that at least one staff member per group of children
22 European Commission (2016): Education and Training Monitor 2016. Table 3.1.1. 23 It should be noted, though, that with very high rates of participation in ECEC, the share of student that didn't attend pre-
primary schooling is very low; this might limit the comparability of the PISA scores between the groups. 24 European Commission (2014): Proposal for key principles of a Quality Framework for Early Childhood Education and Care. 25 European Commission (2016): Education and Training Monitor 2016: p.59.
0%
10%
20%
30%
40%
50%
60%
70%
80%
90%
100%
PT LT HR PL SI LV LU DE SE CY IE EE DK EU UK BG FI BE EL HU SK FR CZ AT IT ES
More than one year of pre-primary education Less than one year of pre-primary education
No pre-primary education I do not remember

23
PISA 2015: EU performance and initial conclusions regarding education policies in Europe December 2016
is qualified to a minimum of bachelor level in the field of education. Several Member States do not have a system for compulsory professional development. Parents are key partners in the ECEC sector and their involvement is increasingly encouraged in most countries by targeted policies or
programmes. The importance of the ECEC factor in reducing low achievement in basic skills requires Member States to provide access to child care and early education for all young children and to ensure the high quality of its provision.
4. A brief look at PISA 2015 and TIMSS 2015
One week before the launch of the PISA 2015 results on performance in science, reading and maths, the IEA published the outcomes of TIMSS 2015 (Trends in International Mathematics and
Science Studies). A comparison of the results of these two international surveys is hampered by various factors. Even if 21 EU Member States participated in TIMSS 2015, only 8 Member States chose to test 8th
grade students (age 14-16). In TIMSS, this is the sample most adjacent to the PISA sample of 15-
year old pupils and allows for careful comparison on a substantial but not statistical level. Figures 4.1 and 4.2 offer insights regarding underperformance in maths and science in TIMSS 2015 and PISA 2015 in 7 EU Member States26.
Figure 4.1. Low achievers in science among 15-year-olds in PISA 2015 and 8th graders not reaching the Intermediate International Benchmark in science in TIMSS
2015
Source: OECD (PISA 2015); IEA (TIMSS 2015).
26 The UK participated in PISA 2015 as a whole, but only England and Northern Ireland participated in TIMSS 2015, hence a
direct comparison is not possible and UK/ England and Northern Ireland are excluded here.
Ireland
Italy
Lithuania
Hungary
Malta
Slovenia
Sweden
0%
5%
10%
15%
20%
25%
30%
35%
40%
45%
50%
0% 5% 10% 15% 20% 25% 30% 35% 40% 45% 50%
Stu
den
ts n
ot
reac
hin
g th
e In
term
edia
te In
t. B
ench
mar
k in
TIM
SS 2
01
5 s
cien
ce
Low achievers in PISA 2015 science

24
PISA 2015: EU performance and initial conclusions regarding education policies in Europe December 2016
Figure 4.2. Low achievers in mathematics among 15-year-olds in PISA 2015 and 8th graders not reaching the Intermediate International Benchmark in maths in TIMSS
2015
Source: OECD (PISA 2015); IEA (TIMSS 2015).
The figures reveal that for both subjects (TIMSS) or subject domains (PISA), there are similarities in underperformance at the national level in both tests. Especially for mathematics, a high share of underperforming students in PISA corresponds closely to a high share of underperforming students in TIMSS.
Nonetheless, the reader should bear in mind the challenges in comparing the outcomes of these
two assessments. Given the very different frameworks and sampling procedures, we cannot claim that the consistency in underperformance in both tests is statistically correlated. TIMSS assessments are based on collaboratively developed frameworks for the topics from national curricula in mathematics and science to be assessed. For the curriculum areas of maths and
science, the frameworks are organised around two dimensions. The first is a content dimension specifying the content to be assessed, for example, algebra, geometry, etc. in mathematics, and biology, chemistry, etc. in science. The second is a cognitive dimension specifying the thinking processes to be assessed. On the other hand, PISA assesses the competence in these two skills domains on an international level, regardless of national curricula.
Furthermore, performance is defined differently in the two tests. PISA measures student performance using six levels of proficiency and defines low achievers as those who perform below level 2, which is described as the 'baseline level of proficiency'. On the other hand, TIMSS uses a scale centre point (set to 500 score points) as a point of reference that remains constant from assessment to assessment, meaning that the low achievers depicted in Figures 4.1 and 4.2 are defined as all pupils who scored below 475 score-points, which the IEA defines as the international benchmark for Intermediate performance.
The information in Figures 4.1 and 4.2 allow the conclusion that, given all the difficulties in comparing TIMSS and PISA, there are no strong contradictions between the outcomes of these very different surveys in the seven countries presented here.
Ireland
Italy
Lithuania
Hungary
Malta
Slovenia
Sweden
0%
5%
10%
15%
20%
25%
30%
35%
40%
45%
50%
0% 5% 10% 15% 20% 25% 30% 35% 40% 45% 50%
Stu
den
ts n
ot
reac
hin
g th
e In
term
edia
te In
t. B
ench
mar
k in
TIM
SS 2
01
5 m
ath
emat
ics
Low achievers in PISA 2015 mathematics

25
PISA 2015: EU performance and initial conclusions regarding education policies in Europe December 2016
5. Conclusions
This preliminary analysis holds important messages for the European Commission and the EU Member States. Most EU Member States need to increase efforts to reach the 2020 benchmark of less than 15% low achievers in reading, maths and science by 2020 – which is only four years from now.
The Commission is already working intensively with Member States, who are confronted with tackling many different challenges at a time, often with limited resources. The available, strengthened ET2020 tools with the new generation of Working Groups, peer learning activities addressed to specific challenges, like the integration of newly arrived migrants, and assessment of previous schooling, peer reviews and peer counselling and the dissemination of good practices via
various channels are important means for improving education systems in the EU. In order to avoid big social and financial challenges in European societies in the future, it is crucial
to overcome barriers relating to gender, socio-economic status and immigrant background. Policies need to look at what motivates young people to learn, to explore, to excel, how to improve their attitudes and their engagement with school. Recruiting the best teachers and training them well, initially and during their career, is essential for successfully equipping young people with the skills
they need in an increasingly uncertain future. The PISA results show that there is still a lot to do – but they also give insights in what works in some countries and how progress is possible. Using the available evidence and the various tools for cooperation, EU Member States have a chance, in intensively working together and learning from each other, to improve their education systems in order to achieve the goals they have set for 2020. This would mark a fundamental milestone in the endeavour to ensure that all pupils and students achieve adequate learning
outcomes, which will continue beyond 2020 as committed to with the Sustainable Development agenda.

26
PISA 2015: EU performance and initial conclusions regarding education policies in Europe December 2016
Annex 1: Country abbreviations
AT Austria BE Belgium BE fr Belgium – French speaking community BE nl Belgium – Flemish speaking community
BG Bulgaria CY Cyprus CZ Czech Republic DE Germany DK Denmark EE Estonia
EL Greece ES Spain EU European Union
FI Finland FR France HR Croatia HU Hungary
IE Ireland IT Italy LT Lithuania LU Luxembourg LV Latvia MT Malta NL Netherlands
PL Poland PT Portugal RO Romania SE Sweden SI Slovenia SK Slovakia
UK United Kingdom