
PIPELINES Volume 13 Number 07 - July 2013 JULY 2013€¦ · Volume 13 Number 07 - July 2013 C...
92
® Volume 13 Number 07 - July 2013 WORLD PIPELINES JULY 2013 www.energyglobal.com
Transcript of PIPELINES Volume 13 Number 07 - July 2013 JULY 2013€¦ · Volume 13 Number 07 - July 2013 C...
®
Volume 13 Number 07 - July 2013
WO
RLD
PIP
ELIN
ES
JU
LY 2013
ww
w.energyglobal.com
ON THE GO.Round-the-clock availability is essential. Which is why
ROSEN provides second-to-none service delivery. Get what you need, where and when you need it. Every time.
www.roseninspection.net
EMPOWERED BY TECHNOLOGY
5024 59 73
ON THIS MONTH'S COVER
Copyright© Palladian Publications Ltd 2013. All rights reserved. No part of this publication may be reproduced, stored in a retrieval system, or transmitted in any form or by any means, electronic, mechanical, photocopying, recording or otherwise, without the prior permission of the copyright owner. All views expressed in this journal are those of the respective contributors and are not necessarily the opinions of the publisher, neither do the publishers endorse any of the claims made in the articles or the advertisements. Printed in the UK.
Member of ABC Audit Bureau of Circulations
Volume 13 Number 07 - July 2013
C ntents
ISSN
147
2-73
90
WORLD PIPELINES | VOLUME 13 | NUMBER 07 | JULY 2013
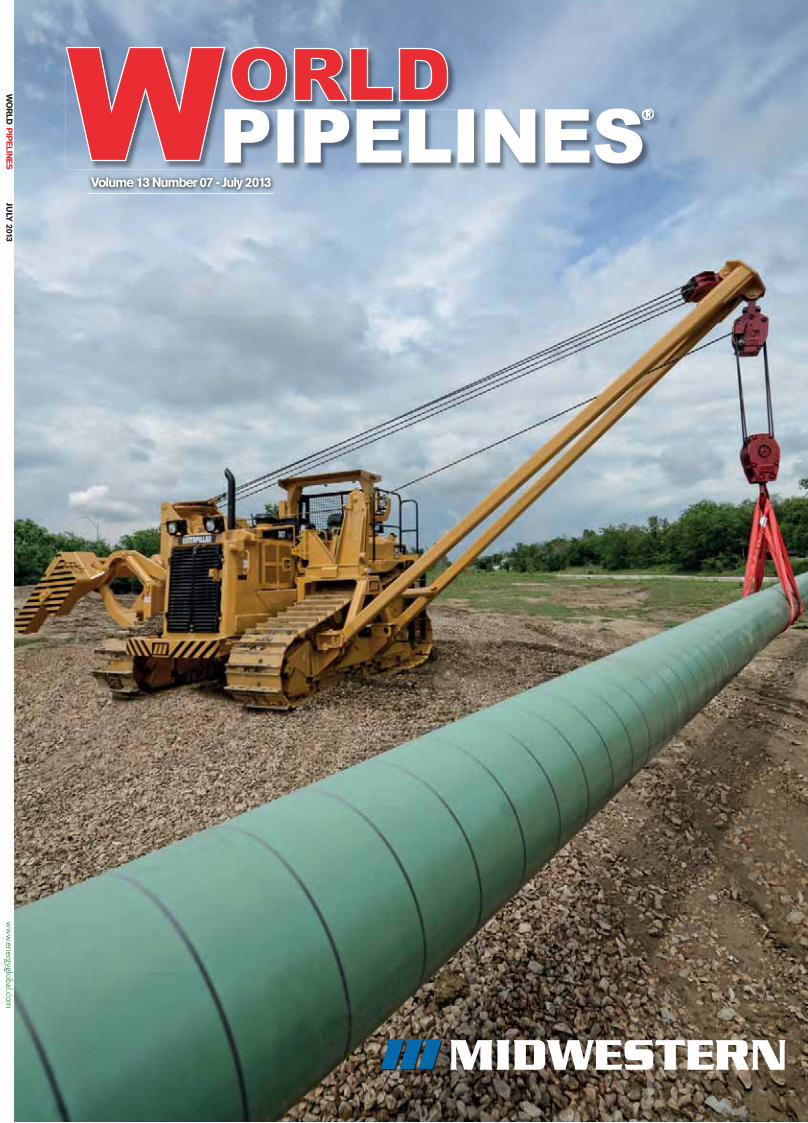
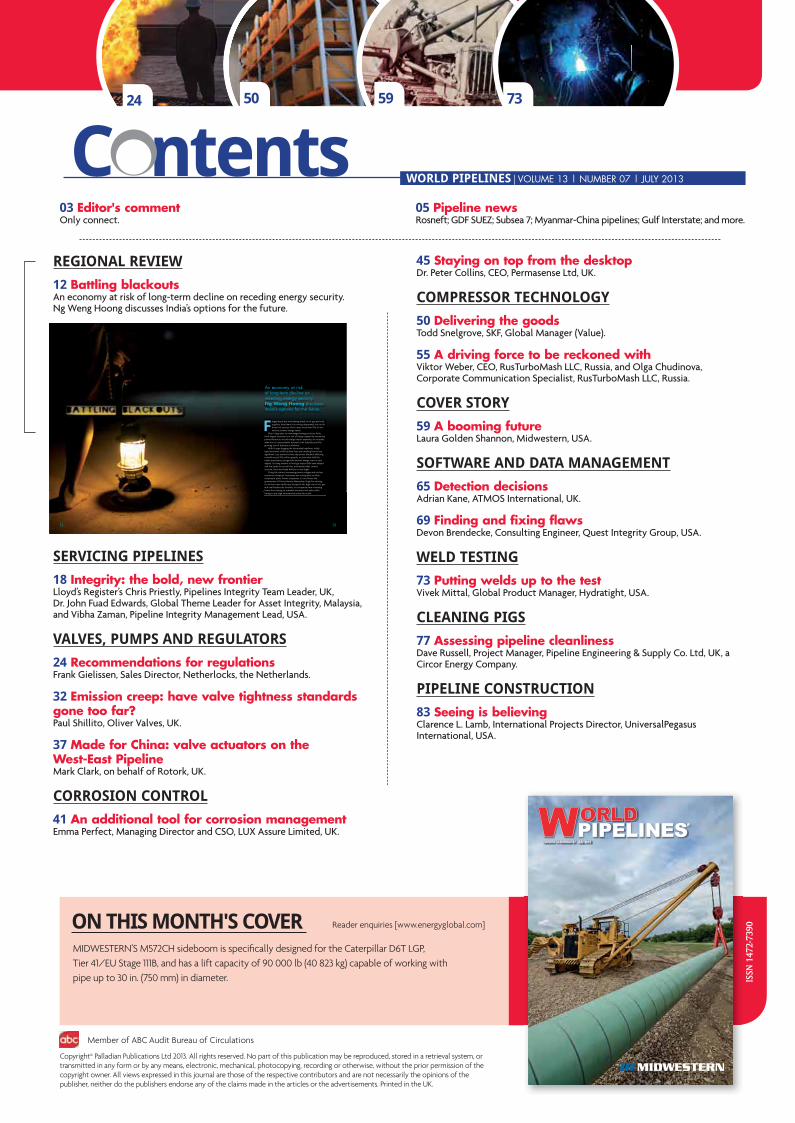
MIDWESTERN’S M572CH sideboom is specifi cally designed for the Caterpillar D6T LGP, Tier 41/EU Stage 111B, and has a lift capacity of 90 000 lb (40 823 kg) capable of working with pipe up to 30 in. (750 mm) in diameter.
REGIONAL REVIEW
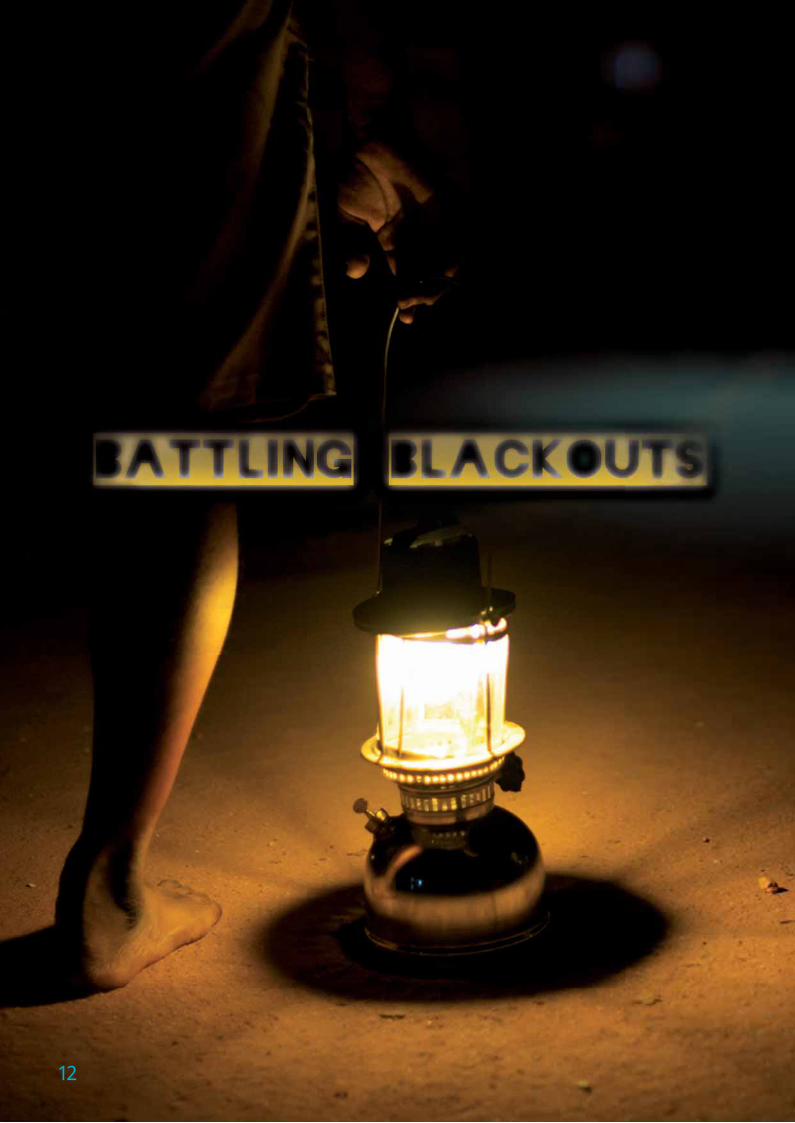
12 Battling blackoutsAn economy at risk of long-term decline on receding energy security. Ng Weng Hoong discusses India’s options for the future.
SERVICING PIPELINES
18 Integrity: the bold, new frontierLloyd’s Register’s Chris Priestly, Pipelines Integrity Team Leader, UK, Dr. John Fuad Edwards, Global Theme Leader for Asset Integrity, Malaysia, and Vibha Zaman, Pipeline Integrity Management Lead, USA.
VALVES, PUMPS AND REGULATORS
24 Recommendations for regulationsFrank Gielissen, Sales Director, Netherlocks, the Netherlands.
32 Emission creep: have valve tightness standards gone too far?Paul Shillito, Oliver Valves, UK.
37 Made for China: valve actuators on the West-East PipelineMark Clark, on behalf of Rotork, UK.
CORROSION CONTROL
41 An additional tool for corrosion managementEmma Perfect, Managing Director and CSO, LUX Assure Limited, UK.
45 Staying on top from the desktopDr. Peter Collins, CEO, Permasense Ltd, UK.
COMPRESSOR TECHNOLOGY
50 Delivering the goodsTodd Snelgrove, SKF, Global Manager (Value).
55 A driving force to be reckoned withViktor Weber, CEO, RusTurboMash LLC, Russia, and Olga Chudinova, Corporate Communication Specialist, RusTurboMash LLC, Russia.
COVER STORY
59 A booming futureLaura Golden Shannon, Midwestern, USA.
SOFTWARE AND DATA MANAGEMENT
65 Detection decisionsAdrian Kane, ATMOS International, UK.
69 Finding and fixing flawsDevon Brendecke, Consulting Engineer, Quest Integrity Group, USA.
WELD TESTING
73 Putting welds up to the testVivek Mittal, Global Product Manager, Hydratight, USA.
CLEANING PIGS
77 Assessing pipeline cleanliness Dave Russell, Project Manager, Pipeline Engineering & Supply Co. Ltd, UK, a Circor Energy Company.
PIPELINE CONSTRUCTION
83 Seeing is believingClarence L. Lamb, International Projects Director, UniversalPegasus International, USA.
03 Editor's commentOnly connect.
05 Pipeline newsRosneft; GDF SUEZ; Subsea 7; Myanmar-China pipelines; Gulf Interstate; and more.
Reader enquiries [www.energyglobal.com]
An economy at risk of long-term decline on receding energy security. Ng Weng Hoong discusses India’s options for the future.
Forget about the world being awash in oil, gas and coal supplies, India fears it is running desperately low on all three fuel sources which meet more than 95% of the nation’s primary energy needs.
Due in large part to mismanaged energy policies, Asia’s third largest economy is at risk of being crippled by worsening power blackouts, record energy import expenses, an incurable addiction to unsustainable domestic fuel subsidies and the growing loss of business confidence.
With Europe hogging the doomsday headlines, India’s rapid economic slide has been less eye-catching but no less significant. Last summer’s three day power blackout affecting a world record 700 million people, or more than half the Indian population, plunged the nation’s energy crisis to new depths. Its rising massive oil and gas import bills have helped sink the rupee to record lows, and raised India’s current account, fiscal and trade deficits to new highs.
Citing the nation’s worsening power outages and unclear economic prospects, businesses are cutting back on their investment plans. Power companies, in turn, blame the government of Prime Minister Manmohan Singh for refusing to let them raise tariff rates to pay for the high cost of oil, gas and coal feedstocks. Similarly, oil companies face mounting losses from having to subsidise domestic fuel sales while having to pay high international prices for crude.
12 13

800-752-1628 • 918-446-1934www.enduropls.com • [email protected]
25 Years of Innovation
Pig PopperTM SignalsOur Enduro Pig Popper is an intrusive pig signal that is manually reset once it has been tripped by a pig. TheEnduro Pig Popper is available in several different options - Manual Visual alert, Electrical alert, andElectrical/Manual Visual alert. Extensions are available in six inch increments for buried pipe locations. All unitsare also available in a lighted version. The Pig Popper is designed to be fitted on most existing 2" fittings.
Bringing you the power of information
Energy Global
EDITORElizabeth [email protected]
C mment
Palladian Publications Ltd, 15 South Street, Farnham, Surrey, GU9 7QU, ENGLAND Tel: +44 (0) 1252 718 999 Fax: +44 (0) 1252 718 992 Website: www.energyglobal.com Email: [email protected]
MANAGING EDITORJames [email protected]
ASSISTANT EDITOR Cecilia [email protected]
ADVERTISEMENT DIRECTORRod [email protected]
ADVERTISEMENT MANAGERChris [email protected]
SALES EXECUTIVEChris [email protected]
PRODUCTIONStephen [email protected]
CIRCULATION [email protected]
REPRINTS/MARKETING [email protected]
WEBSITE MANAGERTom [email protected]
WEBSITECallum O’[email protected]
PUBLISHERNigel Hardy
Annual subscription £60 UK including postage/£75/e110 overseas (postage airmail)/US$110 USA/Canada (postage airmail). Special two year discounted rate: £96 UK including postage/£120/e176 overseas (postage airmail)/US$176 USA/Canada (postage airmail). Claims for non receipt of issues must be made within three months of publication of the issue or they will not be honoured without charge.
Applicable only to USA & Canada: World Pipelines® (ISSN No: 1472 7390, USPS: 020-988) is published monthly by Palladian Publications Ltd GBR and distributed in the USA by SPP, 17B S Middlesex Ave, Monroe NJ 08831.Periodicals postage paid at New Brunswick, NJ. Postmaster: send address changes to Palladian Publications, 17B S Middlesex Ave, Monroe NJ 08831.
ONLY CONNECT
How best to connect with the masses? How best to make your voice heard by those you want to reach? I’m writing this as one million Brazilians take to
the streets on consecutive nights to protest against the government. What began as opposition to public transport cost increases has come to represent strong dissatisfaction with public spending ahead of the 2014 World Cup and, moreover, general tensions about the cost of life in Brazil. In his article ‘Brazilian Spring? Probably not’1, Forbes.com contributor Kenneth Rapoza discusses the growing disaffection in Brazil, where citizens pay inflated bus fares for the same poor service: “This past week’s protest over the bus fare shows one thing in my mind: Brazilians are finally fed up with paying money for nothing. Every Brazilian I know, every Brazilian you will ever meet, ask them what they think about all the taxes they pay for simple things, like service charges on phone bills; or income taxes, or school fees, and all of them will say they are paying big money for lacklustre services.”
These protests are about social issues: poor healthcare, corruption, lack of public infrastructure, things that are not working, things that are not good enough. Life in Brazil is more expensive than ever. Inflation is high, as are taxes. Cost of living goes up all the time. Among the BRIC countries, Brazil is the worst performing of the emerging markets in terms of economic growth.
The government is actually quite popular – Dilma Rousseff was the people’s beloved President Lula da Silva’s chosen candidate for the role, and she is outspoken on the necessity of social amelioration – but these protests are not about overthrowing the government, they are about being heard. The biggest uprising in 20 years is happening because things could be so much better. In his article on Latin America’s elites2, Tim Padgett looks at the protestors like this: “Don’t these people know that Brazil added 40 million of them to the middle class over the past decade, at one point creating almost
20 local currency millionaires a week? Sure they do, and they’re most appreciative. But here’s what else they know – and what their new economic clout has made them a lot bolder about challenging – their political and economic systems remain in too many ways as corrupt, indifferent and dysfunctional as they were when Brazil had only two classes, the very rich and very poor.”
As I’ve written about in previous issues, social reform is a key part of President Rousseff’s oil and gas policy, and her government has always earmarked production revenues to spend on education and social projects throughout the
country. The recent pre-salt discoveries were held up as a beacon of hope for the people of Brazil: ‘look, we have this huge abundant wealth of natural resources, it’s all going to be ok’. Poverty reduction via the distribution of revenues is the aim; what Lula dubbed as Brazil’s ‘passport’ out of poverty and inequality.
There has certainly been progress in reaching the poorest of Brazilians – in February, Rousseff announced a measure to lift 2.5 million people out of extreme poverty by increasing supplementary family incomes through the country’s Bolsa Família social programme. Whether or not efforts to translate resource wealth into raised
standards of living for the middle classes have yet been seen, or appreciated, is unclear. Certainly, the protests would suggest there is a long way to go before the masses feel connected to Brazil’s burgeoning oil and gas riches.
For your own way to feel connected, please visit our website www.energyglobal.com for daily pipeline news updates and articles. I’d also love to see you participate in our LinkedIn group (World Pipelines), keep tabs on us on Twitter (Energy_Global) and/or join in on Facebook (facebook.com/energyglobal), depending on your connection method of choice. 1. Rapoza, K., ‘‘Brazilian Spring’? Probably Not.’, Forbes.com,
http://www.forbes.com/sites/kenrapoza/2013/06/16/brazilian-spring-probably-not/ (Accessed 24th June 2013).
2. Padgett, T., ‘What Brazil’s Protests Say About Latin America’s Fumbling Elites’, Time Magazine, http://world.time.com/2013/06/19/what-brazils-protests-say-about-latin-americas-fumbling-elites/ (Accessed 24th June 2013).
POVERTY REDUCTION VIA THE DISTRIBUTION OF REVENUES IS THE AIM; WHAT LULA DUBBED
OUT OF POVERTY

AATS EQUIPMENTPIPELINE
This is what experience looks likePOWER: The BM 22-36 has the capacity to bend 36” X100 pipe with a
wall thickness of one inch. It is more powerful then any similar machine
currently on the market.
OPERATION: The layout is simple, operating the machine is easy. Machine
settings can be easily controlled and, if required, easily adjusted.
MAINTENANCE: Built with mainly LIEBHERR components, all major
parts have a proven track record as components build on heavy duty
construction machinery. Therefore service, maintenance and the odd
repair is easy. Parts can be bought from your local LIEBHERR dealer,
anywhere in the world.
Maats Pipeline Equipment • Breukersweg 4 • P.O. Box 165 • 7470 AD Goor (Holland)Tel.: +31 (0)547 26 00 00 • Fax: +31 (0)547-26 10 00 • [email protected] • www.maats.com
BENDING HISTORY
0 5JULY 2013 | World Pipelines
SIGN UP TO RSS NEWS FEEDS AT WWW.ENERGYGLOBAL.COM/SECTORS/PIPELINESW rld News
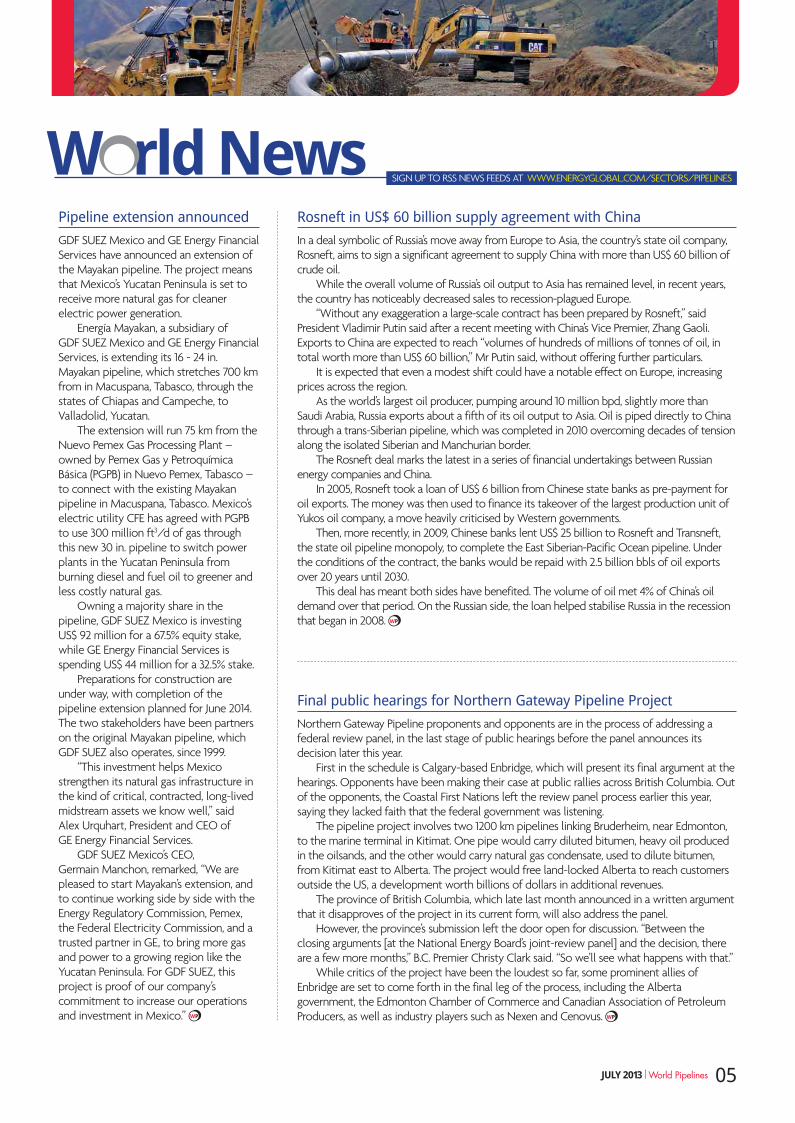
Pipeline extension announcedGDF SUEZ Mexico and GE Energy Financial Services have announced an extension of the Mayakan pipeline. The project means that Mexico’s Yucatan Peninsula is set to receive more natural gas for cleaner electric power generation.
Energía Mayakan, a subsidiary of GDF SUEZ Mexico and GE Energy Financial Services, is extending its 16 - 24 in. Mayakan pipeline, which stretches 700 km from in Macuspana, Tabasco, through the states of Chiapas and Campeche, to Valladolid, Yucatan.
The extension will run 75 km from the Nuevo Pemex Gas Processing Plant – owned by Pemex Gas y Petroquímica Básica (PGPB) in Nuevo Pemex, Tabasco – to connect with the existing Mayakan pipeline in Macuspana, Tabasco. Mexico’s electric utility CFE has agreed with PGPB to use 300 million ft3/d of gas through this new 30 in. pipeline to switch power plants in the Yucatan Peninsula from burning diesel and fuel oil to greener and less costly natural gas.
Owning a majority share in the pipeline, GDF SUEZ Mexico is investing US$ 92 million for a 67.5% equity stake, while GE Energy Financial Services is spending US$ 44 million for a 32.5% stake.
Preparations for construction are under way, with completion of the pipeline extension planned for June 2014. The two stakeholders have been partners on the original Mayakan pipeline, which GDF SUEZ also operates, since 1999.
“This investment helps Mexico strengthen its natural gas infrastructure in the kind of critical, contracted, long-lived midstream assets we know well,” said Alex Urquhart, President and CEO of GE Energy Financial Services.
GDF SUEZ Mexico’s CEO, Germain Manchon, remarked, “We are pleased to start Mayakan’s extension, and to continue working side by side with the Energy Regulatory Commission, Pemex, the Federal Electricity Commission, and a trusted partner in GE, to bring more gas and power to a growing region like the Yucatan Peninsula. For GDF SUEZ, this project is proof of our company’s commitment to increase our operations and investment in Mexico.”
Rosneft in US$ 60 billion supply agreement with ChinaIn a deal symbolic of Russia’s move away from Europe to Asia, the country’s state oil company, Rosneft, aims to sign a significant agreement to supply China with more than US$ 60 billion of crude oil.
While the overall volume of Russia’s oil output to Asia has remained level, in recent years, the country has noticeably decreased sales to recession-plagued Europe.
“Without any exaggeration a large-scale contract has been prepared by Rosneft,” said President Vladimir Putin said after a recent meeting with China’s Vice Premier, Zhang Gaoli. Exports to China are expected to reach “volumes of hundreds of millions of tonnes of oil, in total worth more than US$ 60 billion,” Mr Putin said, without offering further particulars.
It is expected that even a modest shift could have a notable effect on Europe, increasing prices across the region.
As the world’s largest oil producer, pumping around 10 million bpd, slightly more than Saudi Arabia, Russia exports about a fifth of its oil output to Asia. Oil is piped directly to China through a trans-Siberian pipeline, which was completed in 2010 overcoming decades of tension along the isolated Siberian and Manchurian border.
The Rosneft deal marks the latest in a series of financial undertakings between Russian energy companies and China.
In 2005, Rosneft took a loan of US$ 6 billion from Chinese state banks as pre-payment for oil exports. The money was then used to finance its takeover of the largest production unit of Yukos oil company, a move heavily criticised by Western governments.
Then, more recently, in 2009, Chinese banks lent US$ 25 billion to Rosneft and Transneft, the state oil pipeline monopoly, to complete the East Siberian-Pacific Ocean pipeline. Under the conditions of the contract, the banks would be repaid with 2.5 billion bbls of oil exports over 20 years until 2030.
This deal has meant both sides have benefited. The volume of oil met 4% of China’s oil demand over that period. On the Russian side, the loan helped stabilise Russia in the recession that began in 2008.
Final public hearings for Northern Gateway Pipeline ProjectNorthern Gateway Pipeline proponents and opponents are in the process of addressing a federal review panel, in the last stage of public hearings before the panel announces its decision later this year.
First in the schedule is Calgary-based Enbridge, which will present its final argument at the hearings. Opponents have been making their case at public rallies across British Columbia. Out of the opponents, the Coastal First Nations left the review panel process earlier this year, saying they lacked faith that the federal government was listening.
The pipeline project involves two 1200 km pipelines linking Bruderheim, near Edmonton, to the marine terminal in Kitimat. One pipe would carry diluted bitumen, heavy oil produced in the oilsands, and the other would carry natural gas condensate, used to dilute bitumen, from Kitimat east to Alberta. The project would free land-locked Alberta to reach customers outside the US, a development worth billions of dollars in additional revenues.
The province of British Columbia, which late last month announced in a written argument that it disapproves of the project in its current form, will also address the panel.
However, the province’s submission left the door open for discussion. “Between the closing arguments [at the National Energy Board’s joint-review panel] and the decision, there are a few more months,” B.C. Premier Christy Clark said. “So we’ll see what happens with that.”
While critics of the project have been the loudest so far, some prominent allies of Enbridge are set to come forth in the final leg of the process, including the Alberta government, the Edmonton Chamber of Commerce and Canadian Association of Petroleum Producers, as well as industry players such as Nexen and Cenovus.
FOR MORE NEWS VISIT WWW.ENERGYGLOBAL.COM/SECTORS/PIPELINES
IN BRIEF
W rld News
0 6 World Pipelines | JULY 2013
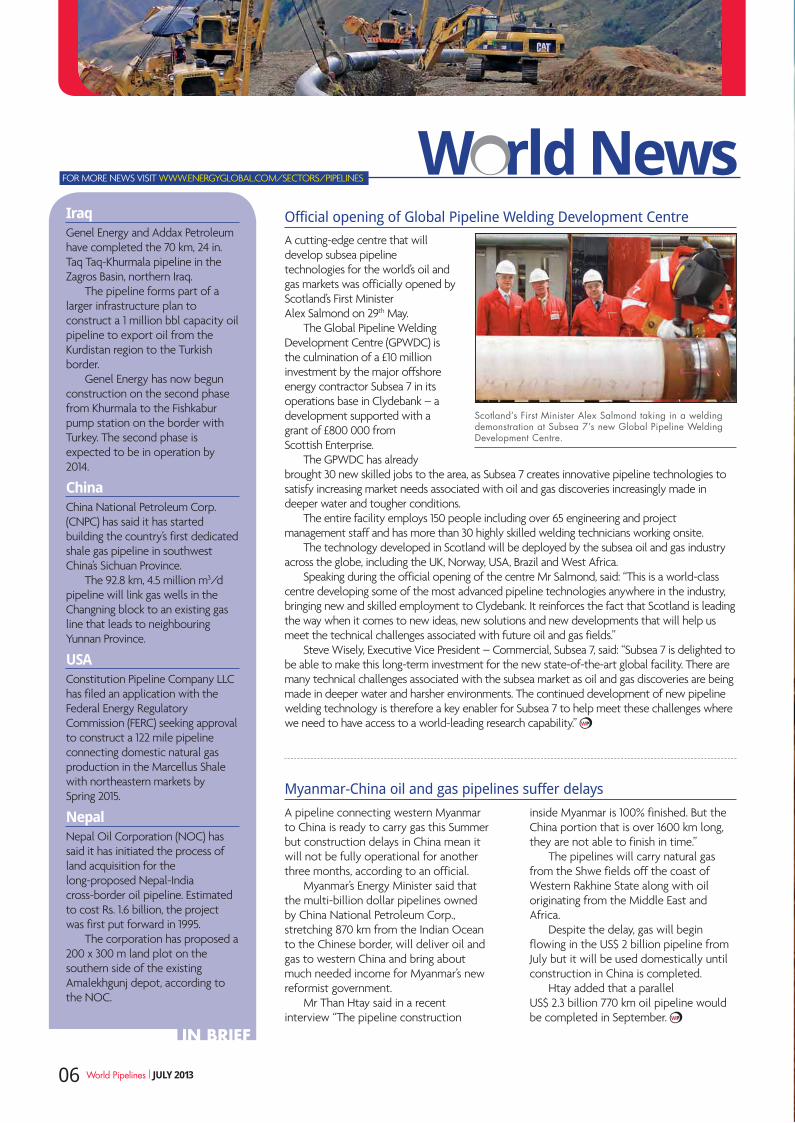
Official opening of Global Pipeline Welding Development CentreA cutting-edge centre that will develop subsea pipeline technologies for the world’s oil and gas markets was officially opened by Scotland’s First Minister Alex Salmond on 29th May.
The Global Pipeline Welding Development Centre (GPWDC) is the culmination of a £10 million investment by the major offshore energy contractor Subsea 7 in its operations base in Clydebank – a development supported with a grant of £800 000 from Scottish Enterprise.
The GPWDC has already brought 30 new skilled jobs to the area, as Subsea 7 creates innovative pipeline technologies to satisfy increasing market needs associated with oil and gas discoveries increasingly made in deeper water and tougher conditions.
The entire facility employs 150 people including over 65 engineering and project management staff and has more than 30 highly skilled welding technicians working onsite.
The technology developed in Scotland will be deployed by the subsea oil and gas industry across the globe, including the UK, Norway, USA, Brazil and West Africa.
Speaking during the official opening of the centre Mr Salmond, said: “This is a world-class centre developing some of the most advanced pipeline technologies anywhere in the industry, bringing new and skilled employment to Clydebank. It reinforces the fact that Scotland is leading the way when it comes to new ideas, new solutions and new developments that will help us meet the technical challenges associated with future oil and gas fields.”
Steve Wisely, Executive Vice President – Commercial, Subsea 7, said: “Subsea 7 is delighted to be able to make this long-term investment for the new state-of-the-art global facility. There are many technical challenges associated with the subsea market as oil and gas discoveries are being made in deeper water and harsher environments. The continued development of new pipeline welding technology is therefore a key enabler for Subsea 7 to help meet these challenges where we need to have access to a world-leading research capability.”
IraqGenel Energy and Addax Petroleum have completed the 70 km, 24 in. Taq Taq-Khurmala pipeline in the Zagros Basin, northern Iraq.
The pipeline forms part of a larger infrastructure plan to construct a 1 million bbl capacity oil pipeline to export oil from the Kurdistan region to the Turkish border.
Genel Energy has now begun construction on the second phase from Khurmala to the Fishkabur pump station on the border with Turkey. The second phase is expected to be in operation by 2014.
ChinaChina National Petroleum Corp. (CNPC) has said it has started building the country’s first dedicated shale gas pipeline in southwest China’s Sichuan Province.
The 92.8 km, 4.5 million m3/d pipeline will link gas wells in the Changning block to an existing gas line that leads to neighbouring Yunnan Province.
USAConstitution Pipeline Company LLC has filed an application with the Federal Energy Regulatory Commission (FERC) seeking approval to construct a 122 mile pipeline connecting domestic natural gas production in the Marcellus Shale with northeastern markets by Spring 2015.
NepalNepal Oil Corporation (NOC) has said it has initiated the process of land acquisition for the long-proposed Nepal-India cross-border oil pipeline. Estimated to cost Rs. 1.6 billion, the project was first put forward in 1995.
The corporation has proposed a 200 x 300 m land plot on the southern side of the existing Amalekhgunj depot, according to the NOC.
Myanmar-China oil and gas pipelines suffer delaysA pipeline connecting western Myanmar to China is ready to carry gas this Summer but construction delays in China mean it will not be fully operational for another three months, according to an official.
Myanmar’s Energy Minister said that the multi-billion dollar pipelines owned by China National Petroleum Corp., stretching 870 km from the Indian Ocean to the Chinese border, will deliver oil and gas to western China and bring about much needed income for Myanmar’s new reformist government.
Mr Than Htay said in a recent interview “The pipeline construction
inside Myanmar is 100% finished. But the China portion that is over 1600 km long, they are not able to finish in time.”
The pipelines will carry natural gas from the Shwe fields off the coast of Western Rakhine State along with oil originating from the Middle East and Africa.
Despite the delay, gas will begin flowing in the US$ 2 billion pipeline from July but it will be used domestically until construction in China is completed.
Htay added that a parallel US$ 2.3 billion 770 km oil pipeline would be completed in September.
Scotland’s First Minister Alex Salmond taking in a welding demonstration at Subsea 7’s new Global Pipeline Welding Development Centre.
IT’S ALL IN THE PIPELINE.
DEDICATION.INNOVATION.INTEGRITY.
CRC-Evans sets the industry standard for every aspect of onshore and offshore pipeline construction, including pipeline equipment, pipe handling, automatic welding, NDE, field joint coating and project management. Our unique, integrated approach combines equipment, service and technical support, offering you the resources you need to meet the industry’s toughest demands. We’re persistent. We’re proud. We’re available 24/7/365.
WHAT’S IN THE PIPELINE FOR YOU?Explore our complete service portfolio atwww.crc-evans.com

FOR FURTHER INFORMATION ON EVENTS VISIT WWW.ENERGYGLOBAL.COM/EVENTS
EVENTS DIARY
W rld News
0 8 World Pipelines | JULY 2013
19 - 21 August 2013ONS Norway
Stavanger, Norwaywww.onsnorway.no
3 - 6 September 2013Offshore Europe
Aberdeen, UKwww.offshore-europe.co.uk
23 - 27 September 201347th IPLOCA Annual Convention
Washington, USAwww.iploca.com
24 - 26 September 2013Rio Pipeline
Rio de Janeiro, Brazilwww.ibp.org.br
29 - 31 October 2013OTC Brasil
Rio de Janeiro, Brazilwww.otcbrasil.org/2013
30 September - 3 October 2013CORCON 2013
New Delhi, Indiawww.corcon.org
5 - 7 November 2013O&G Pipes Global Conference
London, UKwww.ogpipes.com
10 - 13 November 2013ADIPEC
Abu Dhabi, UAEwww.adipec.com
18 - 21 November 2013FABTECH 2013
Chicago, USAwww.fabtechexpo.com
28 - 31 January 2014European Gas Conference
Vienna, Austriawww.europeangas-conference.com
GAIL ordered to construct gas lineAn order from the Madras High Court (HC) mandates that Gas Authority of India (GAIL), the union and the state governments quickly implement the Kochi-Kottanad- Bangalore-Mangalore natural gas pipeline project in Tamil Nadu state.
The HC order followed a petition filed by a Madurai-based advocate, S. Thamizharasan, who claimed that the machinery to install the gas pipeline was ready, but the project has stalled due to non co-operation from the state government.
Further, the petition mentioned that the Union Ministry of Transport and GAIL had invested public money in the project, but the state failed to provide the necessary administrative support to implement the project in Tamil Nadu.
The petitioner fears without the pipeline Tamil Nadu will be totally cut off from the National Gas Grid.
Industrial internet introducedLast month, around 400 delegates from a variety of industries joined at London’s landmark Battersea Power Station to discuss the future of analytics, big data’s implications for business, and the industrial internet.
GE hosted its Minds + Machines Europe 2013 event in London on 19th June, to provide a platform for discussion. Led by McKinsey’s Kito de Boer and Science|Business’ Richard Hudson, two panels discussed the implications of software analytics and diagnostics: how smarter machines can improve bottom lines and allow companies to improve productivity; as well as how to prepare for and ensure industry, government and consumer participation.
GE’s Chairman and CEO, Jeff Immelt, opened the sessions and introduced the industrial internet’s possibility to drive efficiency gains of 1% across a wide range of sectors. This sentiment is echoed in GE’s recent report, ‘The Industrial Internet – Pushing the Boundaries of Minds and Machines, A European Perspective’, which presents the case that the industrial internet could increase productivity growth in Europe by 0.75 percentage points, adding e2.2 trillion to Europe’s GDP by 2030.
New practical ILI workshopSouthern Gas Association (SGA), based in Dallas, TX, is now offering its respected four day ‘Pipeline Inspection Using Intelligent Pigs’ workshop as two three-day programmes: ‘Practical Inline Inspection’ and ‘Advanced Inline Inspection’. The first ever practical workshop was held in conjunction with T.D. Williamson (TDW).
The three-day workshop was conducted on 7 - 9th May at TDW’s manufacturing plant in Tulsa, OK. The Technology Centre housed the classroom portion, while its 1100 ft, 12 in. test loop was the site for the hands-on portion. SGA’s curriculum included topics such as: introduction to intelligent pigging, pigging field operations success factors, data handling and reporting, data analysis demonstration and pipeline defect analysis.
The purpose was to provide operations and maintenance engineers, and pipeline field technicians with the knowledge to establish and manage an intelligent pigging programme that contributes optimum value toward improved pipeline integrity.
SGA is very pleased to report that, with its partner TDW, the first ‘Practical Inline Inspection’ workshop was a tremendous success.
Scan for the Energy GlobaliPhone/ iPad App
F Genesis awarded subsea FEED contract for Kudu in Namibia
F Oregon LNG files export application
F Pipeline steel manufacturer supports European Commission action plan
To read more about these articles go to:
News HIGHLIGHTS
follow us on twitter @energy_global
Join us on LinkedIn
Like us on Facebook Energy Global
World Pipelines
SAFE andPROFICIENT
SPX-SERIES PIPELAYERS
Safer than mechanical pipelayers
Easy to maintain and service
Highest lifting capacity in its class
Most stable machine in its class
Easy to operate with one joystick
State-of-the-art digital control panel
Features anti-tipping system
Meets OSHA and CE compliance
3 models available: SPX-460 (46-ton),
SPX-660 (66-ton) and SPX-960 (96-ton)
CALL OR EMAIL US FOR OUR FULL LINE CATALOGU.S. To l l Free 800.383.2666 I In t l . To l l Free 800.9675.3948
pipe l [email protected] I www.wor ldwidemachinery.com
TO KEEP UP-TO-DATE ON CONTRACTS VISIT WWW.ENERGYGLOBAL.COMC ntract News
World Pipelines | JULY 2013 10
A series of contract wins for Gulf Interstate Engineering Gulf Interstate Engineering Company (Gulf) has been awarded a series of contracts including:
F EPC management services on Iroquois Gas Transmission System, L.P.’s Wright Interconnect Project. The project scope involves the addition of a compression facility and modification of existing station piping to allow limited back-up between the facilities.
F In association with Arendal, Gulf has been selected by GDF Suez to provide project management and EPCC services for the Energía Mayakan Pipeline Expansion Project. The project consists of a 75.9 km, 30 in. pipeline, from the Centro Procesador de Gas Nuevo Pemex, Mexico to interconnect with Mayakan’s existing pipeline system.
F Engineering and design services on Marathon Petroleum Co., L.P.’s Utica Condensate Gathering Pipeline Project. Gulf is developing the conceptual engineering design for the 40 - 45 mile condensate trunkline and associated meter and pump stations.
Gulf Interstate Field Services (GIFS) was recently recognised as the only multi-award winner of Kinder Morgan’s contractor safety awards in 2013. GIFS received the overall Corporate Safety Award, as well as an individual business unit award in the Natural Gas division.
EPC contract for Algerian pipeline pumping stationABB has been awarded the engineering, procurement and construction (EPC) contract for a new liquefied petroleum gas (LPG) pumping station in the Hassi Messaoud District to increase the capacity of LR1 pipeline in Algeria. The contract was awarded by Sonatrach, Algeria’s oil and gas company, and is valued at US$ 100 million. The order was booked in Q4, 2012.
The new pumping station is part of an expansion project to add a second LPG pipeline between Haoud El Hamra and Hassi R’Mel in order to boost pipeline transportation capacity from 4.5 million tpy to 11 million tpy. Hassi R’Mel is Algeria’s largest gas field and the hub of the country’s natural gas transport network. From Hassi R’Mel the gas is transported by pipeline to terminals on the Mediterranean coast for export to Europe or for LNG processing.
ABB is responsible for design, engineering, procurement, commissioning and start-up. Construction and installation will be performed by, Sarpi, a 50% joint venture company owned by ABB and Sonatrach.
ABB will also supply a complete LPG pumping station including all the electrical, piping and mechanical equipment. The solution encompasses a broad range of power and automation products and systems including switchgear, transformers, motors, variable speed drive systems, instrumentation, distributed control and safety systems, as well as a supervisory control and data acquisition (SCADA) system for the new 400 km pipeline.
The plant is scheduled for completion by March 2015.
Wood Group Mustang to manage Purity PipelineWood Group Mustang has been selected by Williams to provide survey, engineering, design and programme management for its Purity Pipeline projects. The projects entail the conversion and construction of more than 300 miles of natural gas liquids and olefins pipelines.
The new and converted pipelines will be used to transport natural gas liquids (NGLs) and olefins to facilities along the Texas Gulf Coast. The project is scheduled to be completed during Q3, 2014. The company was selected for this project due to its extensive experience with both pipeline conversion and pipeline integrity projects as well as its experience in the region.
“Wood Group Mustang appreciates the confidence Williams has shown by awarding us these projects. We are qualified to execute this work due to our geographic experience and our ability to deliver using our in-house task groups. Our team is dedicated to the complete success of this project,” said John Ellison, Pipeline Business Unit President, Wood Group Mustang.
Wood Group Mustang is a global project management, engineering, procurement, and construction operations company serving the upstream oil and gas, refining and chemicals, pipeline, automation and control, and industrial markets. The company has offices in North America, South America, Europe, Middle East, Asia and Africa.
FEED contract awarded to GenesisGenesis Oil and Gas Consultants Ltd has announced that it has been awarded the subsea front-end engineering design (FEED) for the prestigious Kudu Gas to Power Project.
This gas field is located offshore Namibia, at a water depth of 170 m. The development concept is for three subsea wells tied back to a floating production system. Gas is processed offshore to the required specification for export, via a 170 km pipeline, to an onshore power station at Uubvlei.
Tullow Oil plc is the operator for the project including the operation of the gas facilities offshore and onshore up to the battery limits of the power plant.
Genesis’ scope will include FEED of flowlines, risers, subsea structures (including subsea isolation valves [SSIVs]), controls, umbilicals, the export pipeline and a beach valve station.
John Cambridge, Managing Director of Genesis, stated: “This is an excellent example of the integrated projects that Genesis can deliver as all of the business units will be supporting this project.”
The FEED is scheduled to be completed in H2, 2013.Genesis is a market-leading engineering company focused on
providing engineering and technical services to the global upstream oil and gas industry, with more than 1450 engineers and offices in 16 locations worldwide. The company’s services are utilised by oil and gas companies during planning and development phases of oil and gas projects and in the execution of subsea, onshore and offshore engineering projects.
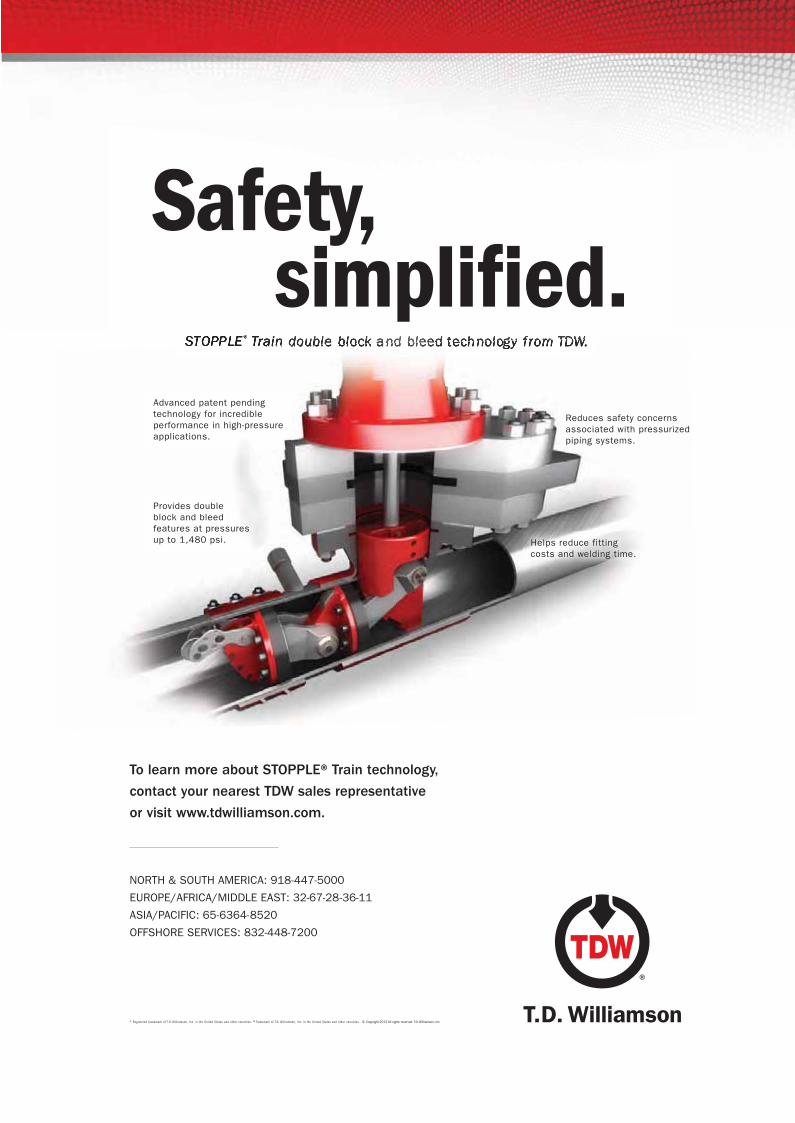
Provides double block and bleed features at pressures up to 1,480 psi.
Advanced patent pending technology for incredible performance in high-pressure applications.
Reduces safety concerns associated with pressurized piping systems.
Helps reduce fitting costs and welding time.
NORTH & SOUTH AMERICA: 918-447-5000
EUROPE/AFRICA/MIDDLE EAST: 32-67-28-36-11
ASIA/PACIFIC: 65-6364-8520
OFFSHORE SERVICES: 832-448-7200
To learn more about STOPPLE® Train technology,
contact your nearest TDW sales representative
or visit www.tdwilliamson.com.
® Registered trademark of T.D. Wil l iamson, Inc. in the United States and other countries. ™ Trademark of T.D. Wil l iamson, Inc. in the United States and other countries. © Copyright 2013 All rights reserved. T.D. Williamson, Inc.
STOPPLE® Train double block and bleed technology from TDW.
Safety, simplified.
12

An economy at risk of long-term decline on receding energy security. Ng Weng Hoong discusses India’s options for the future.
Forget about the world being awash in oil, gas and coal supplies, India fears it is running desperately low on all three fuel sources which meet more than 95% of the nation’s primary energy needs.
Due in large part to mismanaged energy policies, Asia’s third largest economy is at risk of being crippled by worsening power blackouts, record energy import expenses, an incurable addiction to unsustainable domestic fuel subsidies and the growing loss of business confidence.
With Europe hogging the doomsday headlines, India’s rapid economic slide has been less eye-catching but no less significant. Last summer’s three day power blackout affecting a world record 700 million people, or more than half the Indian population, plunged the nation’s energy crisis to new depths. Its rising massive oil and gas import bills have helped sink the rupee to record lows, and raised India’s current account, fiscal and trade deficits to new highs.
Citing the nation’s worsening power outages and unclear economic prospects, businesses are cutting back on their investment plans. Power companies, in turn, blame the government of Prime Minister Manmohan Singh for refusing to let them raise tariff rates to pay for the high cost of oil, gas and coal feedstocks. Similarly, oil companies face mounting losses from having to subsidise domestic fuel sales while having to pay high international prices for crude.
13

A reformist Finance Minister in the early 1990s, the 80 year old Singh has passively watched India’s energy crisis morphed into an economic disaster since becoming Prime Minister in 2004. Last year, India’s economic growth plunged to a 10 year low of 5% after years of 7 - 8% expansions. Growth has briefly rebounded, but India’s record account, trade and fiscal deficits from its rising energy expenses have become serious threats to long-term economic recovery.
The current state of economic turmoil and political malaise leaves India in a weak position to compete against Asia’s other major economies of China, Japan and South Korea for oil, gas and other natural resources around the world. The man who saved the Indian economy from the Gulf War-induced oil shock of 1990-91 is now seen as paving the way for its decline through failed energy policies.
India’s growing oil burdenThe government spent nearly Rs. 970 billion on oil product subsidies in the last financial year ending March 2013, more than 120% what it had originally budgeted for.
With this year’s fuel subsidy spending set to exceed Rs. 1 trillion for the first time, the Petroleum Ministry expects the country’s main downstream companies to forgo collecting a combined record sum of at least Rs. 1.67 trillion from selling fuel at below market prices, compared with Rs. 1.38 trillion in financial year 2012.
India’s largest state-owned oil company, ONGC, will be on the hook for nearly a third, or more than Rs. 550 billion, of that amount. To put this into perspective, the company’s subsidy burden of nearly Rs. 444 billion last year far exceeded its net income of Rs. 251 billion, effectively hampering its expansion and ability to acquire upstream assets in other countries.
The vision for India to become a major oil products exporter is running up against a reality check of its rising oil trade deficit.
In earning US$ 70 billion from oil product exports last year, India had to import nearly US$ 170 billion worth of crude, resulting in a record outflow of nearly US$ 100 billion which accounted for more than half the country’s merchandise trade deficit of nearly US$ 190 billion. The oil trade deficits of US$ 85 billion and US$ 62 billion the previous two years were part of a recent trend that contributed to the rupee’s value plunging from 40 to the US dollar in 2008 to a new low of 57 in 2012.
While not helping India’s inefficient export sector, the weakened currency has ignited domestic inflation as well as hurt its current account and fiscal balances by raising the cost of imports and straining government finances.
Crisil, India’s main credit ratings agency, has warned that the country’s current account deficit will remain high and could rise further if already well-supported global oil prices surged. Tracking its oil expenditure, India’s current account deficit deteriorated sharply from a manageable 1 - 2% between 2006 and 2008 to a record 6.7% in late 2012.
Some of India’s leading businessmen recently told a deeply worried Finance Minister P. Chidambaram that they will hold back expansion plans unless the government is able to fix the country’s energy mess and anti-business environment. Until those investment flows resume, the Indian economy is unlikely to again experience 6 - 8% growth rates.
Oil demand to grow India’s oil products consumption will grow by 4.9% in the current financial year to March 2014, predicts the planning unit of the Petroleum Ministry.
This forecast could prove conservative as India’s economy is expected to expand by 5.7% this year and 6% in 2014 after slumping to a 10 year low of 5% in 2012.
India’s products consumption will reach a record 155.42 million tpy for FY2013, with diesel use rising 6.8% to 69.2 million tpy, said the Petroleum Product & Analysis Cell. Similar to most of Asia, diesel is the most important fuel in India’s oil market.
Among the major products, naphtha use will rise fastest, by 9.5% to 12.28 million tpy, while gasoline demand will grow by 5% to 15.74 million tpy.
The biggest demand declines will be in kerosene and fuel oil, according to the planning unit. Fuel oil demand will plunge by 13.7% to 7.68 million tpy on account of increased substitution by natural gas for power generation while kerosene use is seen falling by 7.8% to 7.5 million tpy.
Products output is forecast to surge by nearly 7.4% to more than 219 million tpy as a result of the country’s expanded refining capacity. Diesel will continue to lead with its output seen rising by 10.6% from 83.43 million tpy to 92.3 million tpy. Fuel oil production is expected to plunge 17.1% from 17.72 million tpy last year to 14.68 million tpy, said the planning unit.
Doubling of domestic natural gas priceIndian consumers could face sharply higher energy costs this year as the Ministry of Petroleum and Natural Gas has agreed to let domestic natural gas prices rise to US$ 8.5/million Btu from their current level of US$ 4.2/million Btu.
As natural gas is used mostly for producing electricity, fertiliser and chemicals, a sharp price increase will filter through the rest of India’s economy with significant inflationary effect.
The ministry has signalled its support for the new price during upcoming talks over the renewal of five year gas supply contracts from the country’s fast-depleting Krishna-Godavari (KG) basin. Producer Reliance Industries (RIL) has long been lobbying for consumers to pay higher prices beyond the benchmark US$ 4.2/million Btu to reflect the increasing scarcity of supply from India’s main gas producing field.
India’s other main upstream oil and gas companies, ONGC, Petronet and Oil India Limited, are also demanding higher gas prices to help cover rising operating costs.
14 World Pipelines | JULY 2013

WWW.ZWICK-ARMATUREN.DE
Producers argue that even at US$ 8.5/million Btu, Indian consumers will be paying only half the amount that users in Japan and South Korea are paying.
Bidding for global energy assetsIn an attempt to compete against its East Asia rivals, the Indian government is looking to provide full state support as well as co-operate with private Indian companies to acquire and develop global energy assets.
The move is being seriously considered as New Delhi is frustrated by Indian companies’ apparent inability to compete for oil, gas and coal assets against their rivals from China, Japan and South Korea. More embarrassingly, India is also losing out to smaller players such as Malaysia and Thailand.
The East Asian model calls for a strong government role in providing financing and co-ordinating a national approach in identifying and acquiring assets abroad. In contrast, India has left much of the decision making to individual state-owned and private companies, often leading them to compete against each other.
As the world’s fourth largest energy consumer, India is increasingly unable to meet its rising domestic demand for oil, gas and coal. By 2035, its energy demand is expected to more than double to 1500 million toe from 700 million toe now.
India’s dependence on imports to meet its energy needs is expected to surge beyond 80% later this decade, but
its companies own relatively few producing assets abroad compared to other Asian countries.
To date, state-owned ONGC, GAIL and Oil India Ltd have invested a total of nearly Rs. 650 billion, or about US$ 11.8 billion, in oil and gas projects abroad. In contrast, China’s main state oil and gas companies have invested a total of US$ 100 billion between 2009 and 2012.
Of growing concern is that India’s overseas oil and gas assets are in decline. ONGC’s subsidiary ONGC Videsh Ltd (OVL), is expected to produce less than 6.9 million toe this year, down from 8.8 million toe on account of its exposure to troubled Syria and South Sudan.
Despite these setbacks, ONGC Chairman and Managing Director Sudhir Vasudeva has set an ambitious target for the company to produce 28.6 million tpy of crude in the current financial year ending March 2014, a 9.5% increase over last year’s 26.12 million tpy.
India cool on Kazakhstan oilfield, remains warm to IranThe government’s new thinking for a united ‘India Inc.’ approach to compete for overseas energy assets may have been helped by ONGC’s offer to pay US$ 5 billion for an 8.4% stake in Kazakhstan’s giant offshore Kashagan oilfield. Critics say the deal will add to ONGC’s rising debt load while yielding only marginal value. Last November, ONGC announced that its upstream subsidiary, OVL, had offered to
EVENTS WORLDWIDE
RIO PIPELINE24 - 26 SEPTEMBERRIO, BRAZILSTAND H7
acquire ConocoPhillips’ stake in one of the world’s largest oilfields with reserves estimated at 30 billion bbls.
New Delhi has been conspicuously lukewarm in supporting the bid which has already been approved by Kashagan’s consortium partners Italy’s ENI, Royal Dutch Shell, Total, ExxonMobil, Japan’s Inpex, and Kazakhstan’s state-owned KazMunaiGaz. Apart from Inpex, which holds a 7.56% stake, the other members each own a 16.8% share in the project.
Some Indian officials believe ONGC would be better off investing in Mozambique’s emerging offshore fields and North America’s booming shale sector than buying into a troubled project that has been repeatedly delayed by costly overruns, partnership disagreements, and disputes between the Kazakhstan government and the consortium members.
In lobbying for the deal, ONGC said the Kashagan acquisition, its biggest to date, would add an average 20 000 - 32 000 bpd to the group’s annual oil production over 25 years. ONGC had expected to reap immediate benefits based on forecasts that the field would begin producing 370 000 bpd of light crude oil from early 2013.
However, ratings agency Moody’s had earlier warned that cash-strapped ONGC’s credit rating could turn negative as the proposed acquisition by subsidiary OVL would be funded with debt and increase the group’s consolidated net debt by at least US$ 5 billion.
India’s main state-owned upstream firm has been struggling to generate positive free cash flows after spending a record US$ 7.5 billion on projects for the year ended March 2012. With only US$ 145 million in free cash flow at the end of March 2013, ONGC is also obligated to pay a hefty 30 - 35% share of India’s costly fuel subsidy programme that is expected to top US$ 40 billion for the current financial year to March 2014.
With few major alternative suppliers, India said it would continue to import oil from Iran, defying Western threats to punish those who continue to trade with the Islamic regime.
Petroleum and Natural Gas Minister M. Veerappa Moily said the Indian government would protect the supply line by providing insurance to refiners processing Iranian crude who were recently told they would no longer be covered by domestic and European insurers.
Last July, the EU and the US implemented tougher trade sanctions against Iran in the hope of bankrupting the regime for pursuing its nuclear development programme that the West and Israel said are a disguise for producing weapons. Some of the measures, passed without UN approval, aimed directly at stopping Iran’s oil and gas exports, mostly to customers in Asia. Most countries appealed against the sanctions, and were given temporary reprieve by the US and Europe to continue their imports from Iran.
In the latest attempt to disrupt Iranian oil exports, European re-insurance companies, under pressure from their governments, said they would no longer provide coverage to Indian insurers for the country’s refiners processing crude oil from Tehran.
The Indian government responded swiftly by announcing that its state-owned oil and gas companies, insurers and the Oil India Development Board would set up their own
insurance fund. India’s oil imports from Iran are expected to drop from more than 360 000 bpd last year to around 250 000 bpd of crude in 2013.
Like other buyers of Iranian crude, India has found it tough to secure tankers and insurance to import from Iran over the past year.
Positive outlook for domestic upstream sectorAmid the fog of bleak news, India expects to uncover more oil and gas reserves off its coast as well as in onshore unconventional formations as it seeks to raise domestic crude oil production from last year’s record volume of just under 900 000 bpd. India is probably the only major country to report rising crude oil production over the last 30 years when output came off a low of 148 000 bpd in 1973.
Royal Dutch Shell has begun talks with ONGC to form a long-term alliance as part of its plan to re-enter India’s upstream sector.
Having tied up long-term agreements with state companies in China, the European major is hoping to replicate its success in India which it left after selling off its 50% stake in Rajasthan state to Scotland’s Cairn in 2002 for just over US$ 7 million. With over 1 billion bbls in oil reserves, the onshore Mangala field has turned out to be one of India’s biggest hydrocarbon finds.
With Indian energy demand expected to double by 2035, Shell is seeking to invest in the country by co-operating with the country’s main oil and gas companies.
Cairn India, controlled by UK-listed Vedanta Resources, plans to invest Rs. 50 billion in the country’s second largest oilfields in Rajasthan state to raise production from 175 000 boe/d today to 300 000 boe/d by 2016.
If Cairn succeeds, production from the 16 onshore fields in the northern state could eventually account for 40% of India’s total, and overtake the rapidly declining Bombay High to become the country’s largest oil producer. Offshore Bombay High now yields just over 200 000 bpd down from a peak of around 440 000 bpd in 1989.
Cairn is the operator of the main Mangala, Bhagyam and Aishwariya and 13 other fields in the Barmer Basin’s Mangala area, which could hold as much as 1 billion bbls of recoverable crude oil reserves. Discovered in 2004, the Mangala field is India’s largest hydrocarbon find in 30 years. Cairn India is seeking to extend its production-sharing contract (PSC) for the block to 2020.
BP has already tied up with Reliance Industries Ltd, one of India’s largest privately owned companies, to expand natural gas production in the KG D6 block in the offshore Krishna-Godavari field. In August 2011, BP said it would pay Reliance US$ 7.2 billion for interests in 21 production sharing contracts and a further US$ 1.8 billion based on exploration success that results in development of commercial discoveries.
ONGC believes it is on the verge of discovering more hydrocarbons in the main offshore oil-producing D1 block located 200 km west of Mumbai city. Last August, the company announced it had found a new field in water depth of around 90 m that is capable of boosting the mature block’s production to 60 000 bpd from around 16 000 bpd now.
According to the US Energy Information Administration (EIA), India holds around 5.5 billion bbls of proved oil reserves, more than half of which are located onshore.
17JULY 2013 | World Pipelines

the bold, new frontier
18

Whether relying on existing or new infrastructure, pipeline
integrity will increasingly become a central link in the global energy supply chain. Lloyd’s Register’s Chris Priestly, Pipelines
Integrity Team Leader, UK, Dr. John Fuad Edwards,
Global Theme Leader for Asset Integrity, Malaysia,
and Vibha Zaman, Pipeline Integrity Management Lead,
USA, analyse the importance of pipeline integrity
management systems.
From its beginnings, the oil and gas business has embodied a high risk strategy in pursuit of high reward. Early ‘wildcatters’ relied on rudimentary
indicators to discover oil and then rolled the dice with the drill bit. Failure was more commonplace than success. As late as the 1960s, with more modern technology to hand, only one in 10 exploratory wells struck lucky. The last 50 years however have seen the industry mature and evolve at pace. Today’s operating model is more akin to a well-controlled business, with tight margins and little room for error. Consequently, oil and gas companies have turned their attention to managing risk in a bid to best control costs.
19

Pipeline operators in particular face tough challenges throughout a project’s life span, with onshore and offshore incidents changing operating environments overnight. Addressing such challenges favours a bold approach to act rather than react; to rethink what safety means – and can do – for business. For those operators who place integrity at the core of what they do, the benefits are manifold, from reduced risks, improved performance and maximum production rates to cementing the right business reputation to profit from emerging opportunities.
Heightened challenges and uncertaintiesRunning a pipeline facility is now a social accountability issue. Operators need to meet strict legislative and environmental requirements under growing public scrutiny, while continuing to satisfy their customers and shareholders. They must demonstrate and document their facility’s safe performance, make relevant data widely available and assess and mitigate risk factors. That is for now but the regulatory environment is ever evolving, with talk of US law for example reaching beyond ‘high consequence’ areas and introducing requirements elsewhere. This uncertainty in itself complicates the planning of long- and shorter-term projects. Aside from regulations, operators must contend with permits and land-use issues.
To compound matters, the market is positively disruptive, making it difficult for pipeline operators to address project planning, execution and delivery schedules. Over the decades, the business has moved from a simple model – a closely regulated conduit for transporting oil, natural gas and petroleum products under a handful of conventional tolling or tariff arrangements – to a free market with a dizzying array of rates and services. The unstable global economy is far from helpful, exacerbating the volatility of an industry whose fortunes are tied to commodity price movements.
On the natural gas transmission side in particular, the market looks increasingly more complex as storage services, load balancing and arbitrage enter the equation. Competition is also growing, crimping pipeline economics. Gas supply and demand have always been extremely sensitive to natural gas price movements and vice versa, but now LNG carriers bring added competition and serve an expanding international trade. LNG’s ability to monetise stranded gas assets at relatively low costs offers the potential to undercut domestic supplies, particularly as it can be fed straight in to existing domestic pipeline grids.
Expanding market opportunities Challenges and uncertainties paint a partial picture of the market. The world continues to demand oil and gas and the industry looks for further ways to distribute more product. Take the ascendance of unconventional oil and gas resource plays – shale in particular – which are opening up significant new pipeline markets.
The pursuit of shale is beginning to dominate the active drilling rig count in North America and this phenomenon is starting to spread to other countries. Some believe shale will turn the global energy equation on its head. The eye-popping gains in reserves means that the US now has more than a century’s worth of proven gas reserves at current rates of consumption versus a few dozen years at most estimated a decade ago. In North Dakota, home to most of the Bakken oil shale development activity, drilling is at risk of slowing down for lack of pipeline takeaway capacity. With production already topping 350 000 bpd, 75% of Bakken output is loaded onto trucks and trains. Comparable situations are cropping up in other North American shale plays.
Further market potential shimmers on the horizon. Environmental issues may well generate opportunities as well as regulatory challenges. Could the climate change agenda support a rapidly expanding global gas pipeline infrastructure? Time will tell.
What is certain is that pipelines will continue to be vital components in efficient, sustainable oil and gas production. As the global energy industry continues to evolve, it will increasingly depend on standards and conformity assessments for assurance that pipelines can fulfil specified requirements safely and reliably.
Redefining the boundaries of safety Tackling risk is a fine balancing act for pipeline operators. Integrity must be the fulcrum where safety has to become an integral component of a company’s entire operations across its supply chain.
Partnering with independent assurance experts is a key factor. Effective integrity management means gaining an in-depth understanding of all the materials, components, equipment, systems, human behaviour and operational complexities involved with manufacturing and operating pipelines, from inlet to outlet. For major operators it demands a broad scope of knowledge, covering on and offshore transmission, export and gathering systems and associated safeguards, risers, J-Tubes, pipe supports, flexible flowlines, manifolds, caissons, flanges, anodes and cathodic protection systems. It encompasses the various disciplines of quality, health, safety, environment and risk management.
Only by adopting such an approach will pipeline operators be able to benefit fully from their existing inspection programmes (an obvious but often overlooked opportunity to maximise performance), focus their maintenance efforts on the most critical assets, and take full advantage of sophisticated programmes to manage costs, minimise risks, prevent unplanned shutdowns, boost production and extend asset lifecycles.
Factoring in integrity from the outsetThe industry is seeing a growing demand for pipeline capacity to carry the new oil, natural gas and natural gas liquids, prompted by the North American shale boom. These and other new infrastructure projects worldwide
20 World Pipelines | JULY 2013

Delivering Quality Under PressureSM
Ultrasonic Wall Measurement Pays for ItselfDirect measurement of wall thickness using ultrasonic wall measurement (UTWM) technology produces more accurate results than MFL.
© 2013 Weatherford. All rights reserved. Incorporates proprietary and patented Weatherford technology.
Formation Evaluation | Well Construction | Completions | Production
MFL measurements are indirect and the resulting wall thickness calculations are inferred.
UTWM technology makes a direct measurement of remaining pipeline wall thickness. Direct
measurements result in far greater accuracy of wall thickness and associated safe maximum
allowable operating pressure (MAOP). A more accurate determination of metal loss on each
individual anomaly can increase the rated MAOP and rule out unnecessary digs and repairs
normally reported during an MFL survey. These operating improvements and the reduction in
the number of digs, when compared to MFL, could more than pay for the UTWM survey.
Detects defects that MFL can miss. UTWM also detects and characterizes many anomalies
that often go undetected by MFL such as laminations, inclusions, narrow axial corrosion,
longitudinal scratches and notches, hydrogen-induced cracking, and girth-weld misalignment.
UTWM also inspects internally coated pipe without the concern of damage being caused to
the lining integrity by MFL brushes.
Safe and sound investment. Why take chances when UTWM makes so much economic
sense. In fact, you’ll want to consider running it simultaneously with our ultrasonic crack
detection (UTWM+CD combo). Email [email protected], or visit weatherford.com/pipeline.

are ideal opportunities to lay the foundations for solid pipeline integrity.
While risk assessment can be conducted at any time during a pipeline’s operational life and become a continuous process in an ongoing integrity management programme, it is most effective when considered from the design stage onwards. Lloyd’s Register Energy has supported a number of new infrastructure projects where risks have been identified early on and eliminated with design modifications that go on to reduce operating costs. Where risks cannot be eliminated, the company’s risk engineers have developed strategies that mitigate and manage potential problems throughout the life of the pipeline. Careful monitoring of risks during construction and installation is also invaluable, ensuring that the condition of a pipeline is thoroughly documented when it is commissioned and put into service. All of these factors help make sure that pipeline operations are fit for service and optimised cost effectively, and that inspection and maintenance programmes are appropriate, focused and targeted.
Building in integrity is especially important for pipeline mega-projects, an industry trend as activity fans out into more challenging physical environments and companies look to leverage economies of scale. On the midstream side, such projects can run into multiple billions of dollars; a vast pipeline project designed to bring Alaskan North Slope natural gas to market has been estimated at between US$ 26 - 35 billion. With expanding project scope comes bigger challenges. Collaboration with independent technical experts is essential to find innovative solutions that minimise complexity and risk in these huge undertakings.
Addressing the risks of ageing infrastructureConsidering safety from the outset is all well and good for new infrastructure projects, but what about ageing pipelines around the world? The US alone counts on a vast, mature infrastructure. Some 299 000 miles of onshore gas transmission pipelines and 182 563 miles of onshore hazardous liquid pipelines move natural gas, crude oil and petroleum products across the country daily. And each day these and other operators of ageing facilities globally face the risk of leaks, spills and potentially catastrophic explosions.
In such circumstances, matters are hindered by standard industry thinking. Pipeline integrity is commonly viewed as a technical matter that mainly involves inspections. The supporting technology is impressive. Flow modelling and probabilistic analysis aid risk assessment. Intelligent pigs snake though pipelines carrying highly sensitive instruments. Offshore, remotely operated vehicles fly up and down risers and along pipeline routes looking for coating damage, external corrosion, leakage, scour and spanning, or sonar images of the pipeline and surrounding seabed are obtained. Where pigging is not practical, chemical and microbial analysis of inlet and outlet fluids and online
monitoring are used to detect evidence of corrosion. Direct non-destructive testing (NDT) is carried out at areas expected to have the highest internal or external corrosion.
But all of this can be falsely reassuring and a waste of money. Mindset is to blame. Traditionally, only findings of serious defects prompt action. In the absence of such faults, inspection results are placed on a shelf, or buried on a server, never to be consulted again. Consequently the number of failures and incidents remain stubbornly high. Beyond the use of technology, human intervention, decision-making and the level of technical expertise employed clearly also play their part.
Operators should get more from costly inspection efforts than a tick in a box and a binder gathering dust. Even a carefully optimised inspection programme can be wasteful if the data is used only to assess a pipeline’s condition, without a commitment to integrity management. In stark contrast, adopting a pipeline integrity management system (PIMS) delivers a comprehensive, long-term solution: identifying the broad spectrum of risks; increasing the value of investment in monitoring, inspecting and maintaining pipelines; and improving performance; and clearly identifying who is responsible for ensuring that integrity related actions are carried out.
PIMS evaluation and monitoring covers every individual component associated with a pipeline as each one counts towards a facility’s overall integrity. It encompasses an array of operating and environmental factors to assess risks and monitor changes. It goes beyond physical components and environmental factors to consider how a pipeline system is operated and managed. HSE policies and procedures are closely analysed, along with many other factors that affect system integrity – from hiring qualifications and personnel training to compensation and incentive schemes, supervisory organisation and approach, data collection and documentation, and even supply chain and contractor management.
What gets measured gets managedConfronted by challenges, complexities, uncertainties and opportunities, it is easy to lose sight of a simple fact: companies that fully assess their risks are better able to manage them strategically. Integrity is the new frontier for pipeline operators and it needs to be implemented from the very top of operator management – without that the whole process can easily degenerate into a regime where safety and reliability is degraded by cost cutting and short-term performance goals. Delivering effective integrity management with the support of independent expertise is vital to the oil and gas industry’s continued success and evolution. Such collaborations, which introduce valuable core competencies into businesses, will redefine industry perceptions of safety and foster important dialogue about energy supply and demand issues. These challenges can then be tackled head on, together.
22 World Pipelines | JULY 2013

The pipeline landscape is tough. Vermeer is tougher.
Vermeer is equipped to see you through from start to finish with the products and experience you need. Choose from a range of powerful horizontal and tub grinders, and track trenchers. Break through with a full lineup of horizontal directional drills and accessories, including maxi rigs, reclaimers and high-pressure mud pumps, as well as the tooling you need to tackle challenging subterrain. And it’s all backed by unmatched Vermeer dealer support that’s onsite when you need it.
VERMEER.COM
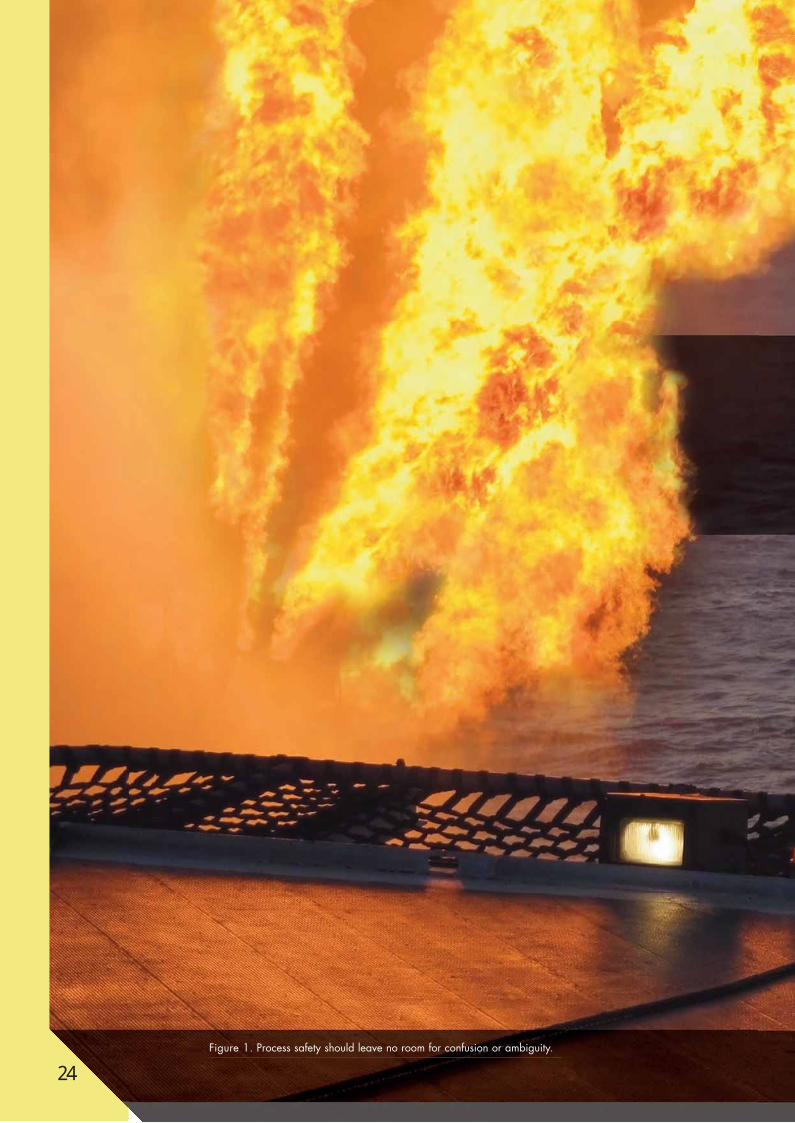
Figure 1. Process safety should leave no room for confusion or ambiguity.
24
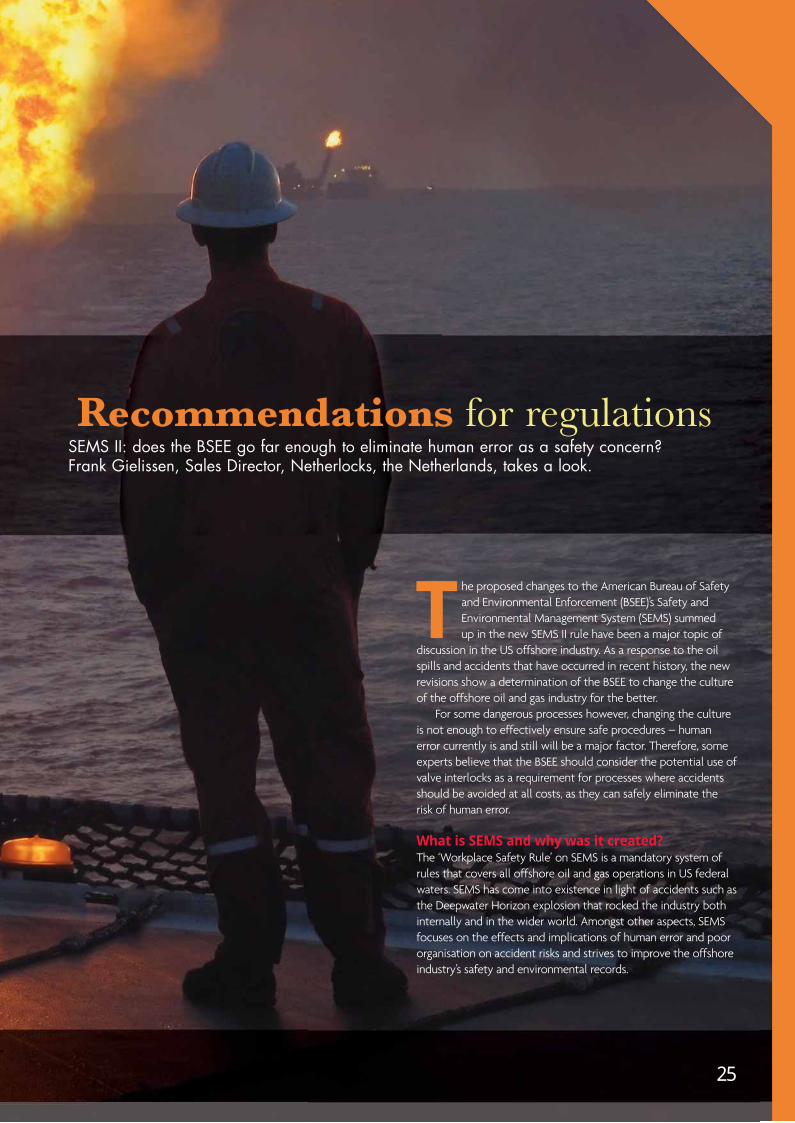
Recommendations for regulationsSEMS II: does the BSEE go far enough to eliminate human error as a safety concern? Frank Gielissen, Sales Director, Netherlocks, the Netherlands, takes a look.
The proposed changes to the American Bureau of Safety and Environmental Enforcement (BSEE)’s Safety and Environmental Management System (SEMS) summed up in the new SEMS II rule have been a major topic of
discussion in the US offshore industry. As a response to the oil spills and accidents that have occurred in recent history, the new revisions show a determination of the BSEE to change the culture of the offshore oil and gas industry for the better.
For some dangerous processes however, changing the culture is not enough to effectively ensure safe procedures – human error currently is and still will be a major factor. Therefore, some experts believe that the BSEE should consider the potential use of valve interlocks as a requirement for processes where accidents should be avoided at all costs, as they can safely eliminate the risk of human error.
What is SEMS and why was it created?The ‘Workplace Safety Rule’ on SEMS is a mandatory system of rules that covers all offshore oil and gas operations in US federal waters. SEMS has come into existence in light of accidents such as the Deepwater Horizon explosion that rocked the industry both internally and in the wider world. Amongst other aspects, SEMS focuses on the effects and implications of human error and poor organisation on accident risks and strives to improve the offshore industry’s safety and environmental records.
25

Recommended practice made mandatorySEMS makes mandatory the essential components of Recommended Practice (RP) 75 of the American Petroleum Institute (API). RP 75 is a comprehensive safety and environmental management standard and can be regarded as a tool for integrating safety management into a variety of offshore operations. It is broad in scope and addresses the identification and management of safety hazards and environmental impacts in design, construction, start-up, operation, inspection and maintenance of
installations. It was also created to be a permanent part of a company’s culture, objectives and operations, inherent and
integral to the way business is conducted.
Which are the main principles of RP 75?RP 75 requires that management of offshore oil and gas companies put forward a safety programme based on the following principles:
1. A written programme is required.
2. Leadership, accountability and resources must be provided
3. Representatives must be appointed to establish, implement and maintain the programme.
Figure 2. While operating in the start-up and shutdown mode less than 5% of the time, more than 40% of the accidents take place during this ‘take off’ and ‘landing’ mode.
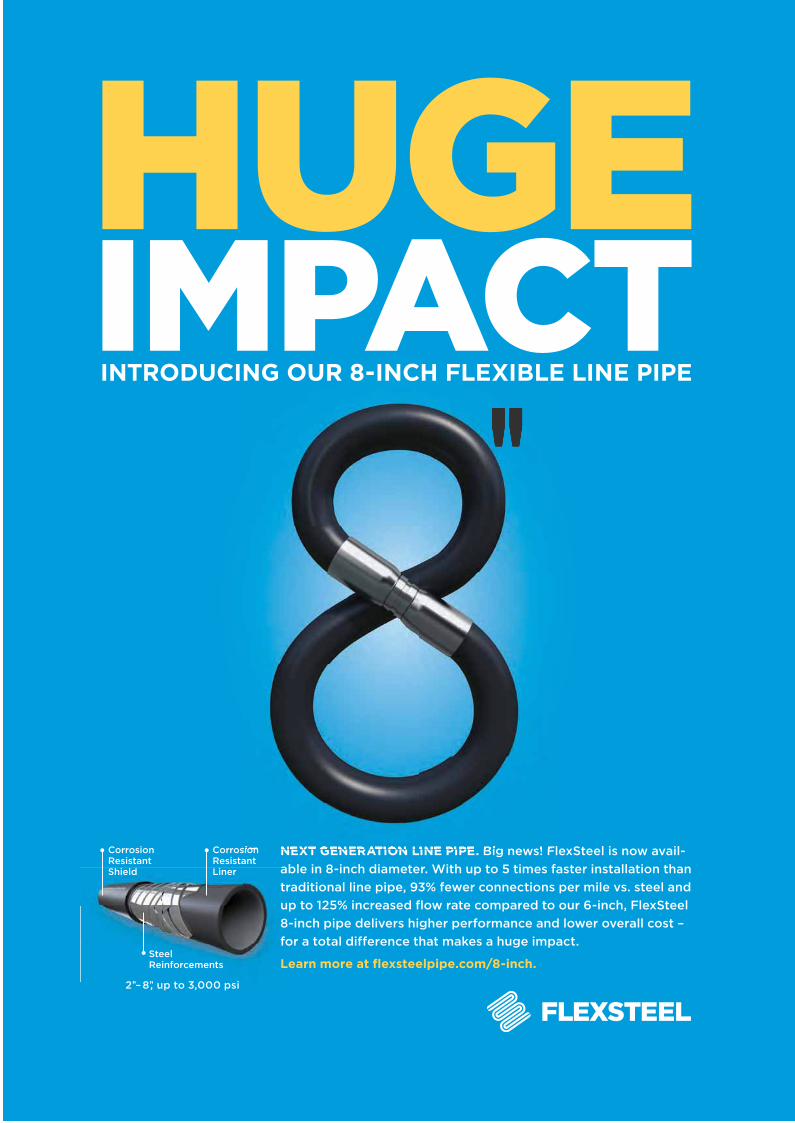
Corrosion Resistant Shield
Corrosion Resistant Liner
Steel Reinforcements
2"–8", up to 3,000 psi
NEXT GENERATION LINE PIPE. Big news! FlexSteel is now avail-
able in 8-inch diameter. With up to 5 times faster installation than
traditional line pipe, 93% fewer connections per mile vs. steel and
up to 125% increased flow rate compared to our 6-inch, FlexSteel
8-inch pipe delivers higher performance and lower overall cost –
for a total difference that makes a huge impact.
Learn more at flexsteelpipe.com/8-inch.
4. There are also representatives who report to management on the performance of the programme.
5. The programme should be reviewed regularly.
6. A written description of the organisation and lines of responsibility is required.
7. The expertise of personnel should be utilised in areas such as the identification of hazards, the development of safe work practices, the development of training programmes and the investigation of incidents.
8. The owner, operator and contractor management have their own responsibility for assuring safe operations.
9. Industry codes should be used in the design, construction, maintenance, and operation of the facility.
10. The management of safety is an integral part of the design and operation of the facility.
11. All persons involved in the programme must be properly trained.
12. The programme should be regularly audited.
A general safety compassRP 75 recommendations do address the effects of human error and encourage offshore businesses to concentrate on minimising these effects. They also promote a culture of safety and stimulates companies to set up safe operating procedures. What is good about RP 75 in particular, is that it stresses to make safety and environmental information available at every facility. BSEE recognises that local availability of information such as design data, flow charts of facility processes, and diagrams of mechanical components and instruments highly contributes to process safety as a whole.
What RP 75 generally lacks however is the recognition of the fact that human error cannot always be prevented by formal procedures alone. Some processes can have catastrophic results if not carried out the right way and within these processes there is the opportunity to physically help and ensure that operators follow the safe procedure.
One way to establish this is by using mechanical interlocks. Interlocks eliminate human error by only allowing the right valves to be opened or closed in the correct order, leading operators safely through the strict work order of the task.
Linked to information systems or mimic panels, they not only eliminate human error, but also highlight any Permit Procedure
applicable to a specific process. This allows the operator to request and receive all data needed in order to safely proceed to the next stage of a process. Flow charts, sequence diagrams and any other important information can be offered in an organised manner and make important process information locally available so that not only is the process completed safely, but the operators are aware of the reasoning behind the procedures.
No clear guidelines or preventive actionsAlbeit a sound safety concept, RP 75 also creates some confusion as to which equipment it applies to. RP 75 simply states that it applies to ‘critical equipment’, which it defines as: “equipment and other systems determined to be essential in preventing the occurrence of or mitigating the consequences of an uncontrolled release. Such equipment may include vessels, machinery, piping, blowout preventers, wellheads and related valves, flares, alarms, interlocks, fire protection equipment and other monitoring, control and response systems.”1
Moreover, the regulations in RP 75 sometimes discusses safety in general terms, stating that you must ensure “the mechanical integrity and safe operation of equipment through inspection, testing and quality assurance”. It also mentions that “your mechanical integrity programme must encompass all equipment and systems used to prevent or mitigate uncontrolled releases of hydrocarbons, toxic substances, or other materials that may cause environmental or safety consequences.”1
Ultimately, then, it is left up to the operator to decide which equipment the mechanical integrity section must cover. One BSEE representative did offer one view of how an operator can decide whether equipment is critical, but it still remains indefinite: “For example, if shutting down a piece of equipment impacts the ability to carry on with the operation, that’s a good indication that it’s a critical piece of equipment.”1
Eliminating human errorProcess safety should leave no room for confusion and ambiguity. Taking into account the disastrous effects that failing mechanical integrity can cause, BSEE could therefore consider other important Recommended Practices that can maybe replace some of the ambiguous elements in RP 75.
One of these practices is RP 520. This API recommendation specifically applies to the sizing and selection of pressure relief devices that provide protection against excessive pressure accumulation and is quite precise as to how to ensure mechanical integrity. In articles 6.3.1 and 6.3.2 of this rule, it is mentioned that “consideration should be given to using an interlocking system between the inlet and outlet isolation valves to assist with proper sequencing”.2
What it means is that dual relief valves need to guarantee an open path to the relief valve at all times. The safety relief valve is clearly identified as a critical part of equipment, as it is the most important safety measure in a particular process or even an entire plant. Operating pressure relief valves in the right manner is not difficult, but even the possibility of both relief valves being accidently offline, creating less relief capacity, just cannot be accepted as ‘safe’ – yet it could currently happen. Many leading oil and gas companies have already acknowledged this fact, and, as a result, they have incorporated the use of mechanical interlocks as a mandatory requirement on pressure safety valves (PSVs).
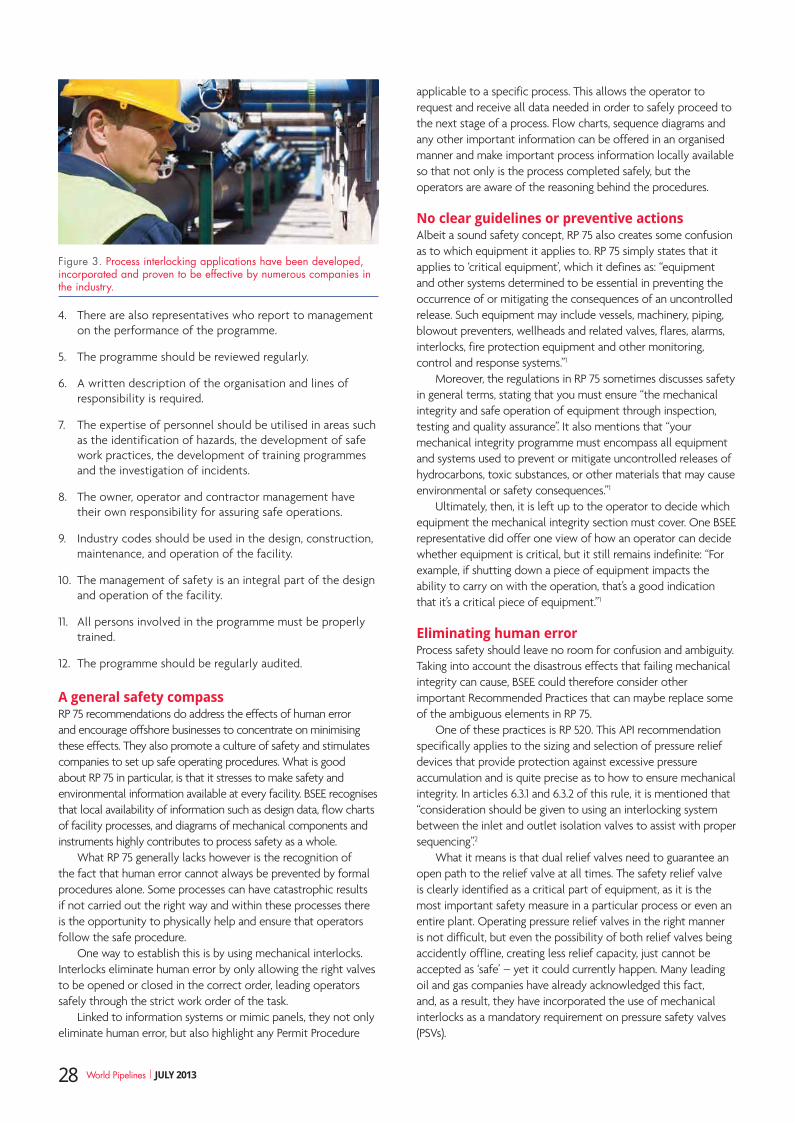
Figure 3. Process interlocking applications have been developed, incorporated and proven to be effective by numerous companies in the industry.
28 World Pipelines | JULY 2013

You can see that Polyguard has spent a lot of effort in sounding the alarm about pipeline cathodic shielding. You can also see that the
pipeline cathodic shielding problem is a real one.
Get involved, visit:e
Definition of cathodic shielding in pipelines.
NACE has formed TEG463X to understand this problem.
Papers and articles by Polyguard
about the cathodic shielding
problem.
Papers and articles by others about the cathodic shielding problem.
Links to Polyguard’s website
and information about our
RD-6® non-shielding coating.
Search Date: March 6, 2013 (sequence modified)
Web Search for
Analysing accidents RP 520 clearly identifies pressure relief devices as potentially dangerous, whereas RP 75 leaves room for different interpretations as to what equipment is to be regarded as ‘critical’. RP 520 only focuses on safe working practices for pressure relief valves though, so the question arises whether it would be possible to define other potentially dangerous devices or processes that can easily be categorised as such.
A closer look at any prevailing similarities between accidents in the oil and gas industry might give some clear clues. As a general rule of thumb, one can say that accidents in the industry are mostly related to procedures that do not occur frequently and at the same time can have catastrophic consequences when performed incorrectly: start-ups, shutdowns and shift handover processes are all good examples.
Other research also confirms this, for instance, a study from the Mary Kay O’Connor Process Safety Centre on ‘shift handover processes’3 revealed that these processes are the most commonly cited as a contributing cause in most accidents (Piper Alpha, Bhopal). A statement from a senior oil and gas industry executive, quoted in the same research, also underscores their importance in operations and safety incidents: “We have learned that while operating in the start-up and shutdown mode less than 5% of the time, more than 40% of the accidents take place during this ‘take off’ and ‘landing’ mode.”3,4
These revelations are supported by combined data from companies producing interlocking equipment. They have identified over 50 different processes that are part of a start-up or shutdown procedure. Pigging operations are an important example of this group, as they have already been internationally acknowledged as highly dangerous procedures where slight mistakes or lack in concentration can have severe and disastrous consequences.
For all these processes, process interlocking applications have been developed, incorporated and proven to be effective by numerous companies in the industry. Unfortunately, none of these applications appear in any of the current legislative standards. A remarkable fact, as the results of human error and mistakes,
particularly during start-up and shutdown procedures, can be seen to occur on a daily basis.
International standardsStart-up and shutdown procedures are clearly highly dangerous. Human error during these processes should therefore be avoided at all cost, as the effects can be truly disastrous.
International oil and gas companies such as Shell, Total, ADCO and PETRONAS have recognised this, and subsequently incorporated strict procedures into their engineering practices, reference documents and project guidelines. They have also implemented mechanical interlocks on a wide scale. Their procedures leave no room for different interpretations and process interlocking quite often is a formal and mandatory provision to ensure strict adherence to procedures on critical operations, such as start-up and shutdown procedures, relief valve change over and pigging operations. Following the instalment of these procedures, these companies established excellent safety records and were able to substantially minimise accidents and spills.
Creating business opportunity by avoiding spills and production lossRecent incidents and accidents have led to increased regulations on process safety. Quite often, and just as in RP 75, these regulations are broad in scope and primarily focus on the identification and management of safety hazards. What is good about new regulations such as those in SEMS II is the attention that is given to changing company culture with regard to safety, and accepting human error as an important aspect to take into account.
This acceptance is of huge importance and creates a challenge for all parties involved, but one with great rewards at the end of the road. US oil and gas companies are expected to follow the path that has already been set out by the BSEE, and changing company culture regarding safety (as advised by BSEE) will probably be the next challenge.
Importantly, as a result of this change in culture, human error will be accepted as an important factor in process safety. This will on its turn open the ‘mindset’ for products that contribute to safety explicitly by eliminating human error. These products will not limit operation as sometimes is argued, but effectively guide operators through a designated procedure and create better overall safety awareness.
On a national level, implementing some of the new codes and practices on process safety will directly lead to results; economically, environmentally and with regard to process safety. The advantages for individual operator companies are obvious: they will benefit with improved safety track records, large cost reductions and less production loss, with all the boons to business those important elements provide.
References1. PEC, SEMS Plans, ‘Keeping the Equipment Running Safely’.2. API RP 520, Articles 6.3.1 and 6.3.2.3. AVEVA Business Paper, ‘Playing it Safe – How Information Management technology
is essential to meet more stringent Process Safety and Regulatory Compliance’. 4. Sherman J. Glass, Jr., President, ExxonMobil Refining & Supply Company,
Keynote Address, National Petrochemical & Refiners 2009 Conference, (May 12, 2009).
Figure 4. Key exchange interlocks enforce a strict adherence to correct procedures, only allowing the right valve to be operated at the right stage of the process.
30 World Pipelines | JULY 2013
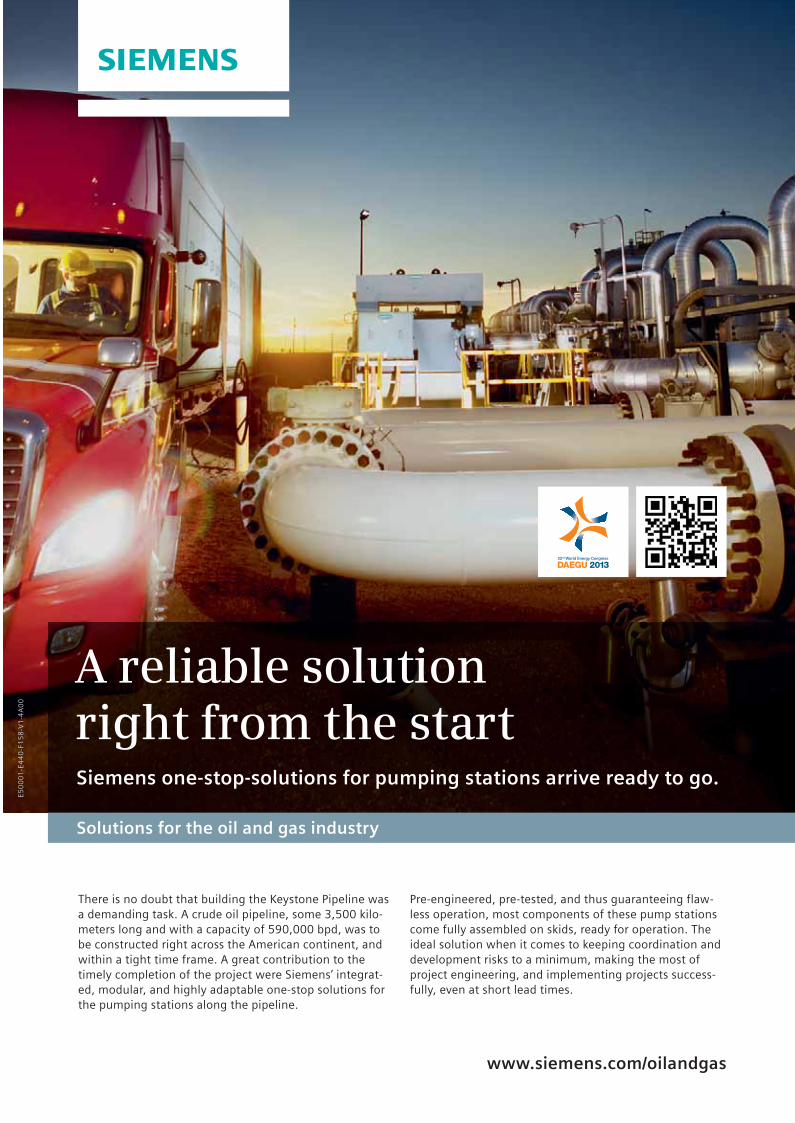
There is no doubt that building the Keystone Pipeline was a demanding task. A crude oil pipeline, some 3,500 kilo-meters long and with a capacity of 590,000 bpd, was to be constructed right across the American continent, and within a tight time frame. A great contribution to the timely completion of the project were Siemens’ integrat-ed, modular, and highly adaptable one-stop solutions for the pumping stations along the pipeline.
www.siemens.com/oilandgas
Solutions for the oil and gas industry
Pre-engineered, pre-tested, and thus guaranteeing flaw-less operation, most components of these pump stations come fully assembled on skids, ready for operation. The ideal solution when it comes to keeping coordination and development risks to a minimum, making the most of project engineering, and implementing projects success-fully, even at short lead times.
A reliable solutionright from the startSiemens one-stop-solutions for pumping stations arrive ready to go.
E50
00
1-E
44
0-F
15
8-V
1-4
A0
0

have valve tightness standards gone too far?
Controlling fugitive emissions is one of the most important technical challenges facing the pipeline industry, and valves play a central role in this, but is there a limit to the level of tightness operators should be aiming for? Paul Shillito, Oliver Valves, UK, explains.
EMISSION CREEP:
32

In 2012 the US Environmental Protection Agency (EPA) added new momentum to the longstanding issue of fugitive emissions – the small amount of leakage through the seals in components such as valves – when
it called for more stringent regulations governing leaks from the natural gas supply chain.
Fugitive emissions have always been a key issue for oil and gas producers because, although each individual leak may be tiny, the thousands of potential leak paths that exist along the route from extraction to end user can add up to significant lost revenue for the operator, as well as an increased impact on the environment.
To ensure these leaks are kept to a minimum, strict standards are in place governing what level
of emission is permissible from each individual component. To qualify for use, prototype valves are put through demanding test programmes to measure the level of tightness they deliver.
At the forefront of industry regulations is the ISO15848 standard, released in 2006. It classifies valves into three tightness classes – A, B and C – with Class A valves having the lowest leak rate.
Class B certifies an almost negligible level of emission, but Class A rating allows 100 times
less leakage again.
The quest for Class AAchieving the ISO’s highest tightness standard is
no mean feat. To pass the test, a valve has to demonstrate that, when placed in a vacuum and then opened and closed hundreds of times
at a wide range of temperatures, the volume of gas that leaks out of the valve is very nearly zero.
The rate of leakage is tested by enclosing the valve in a vacuum chamber, passing pressurised
liquid helium through the valve and using a mass
33
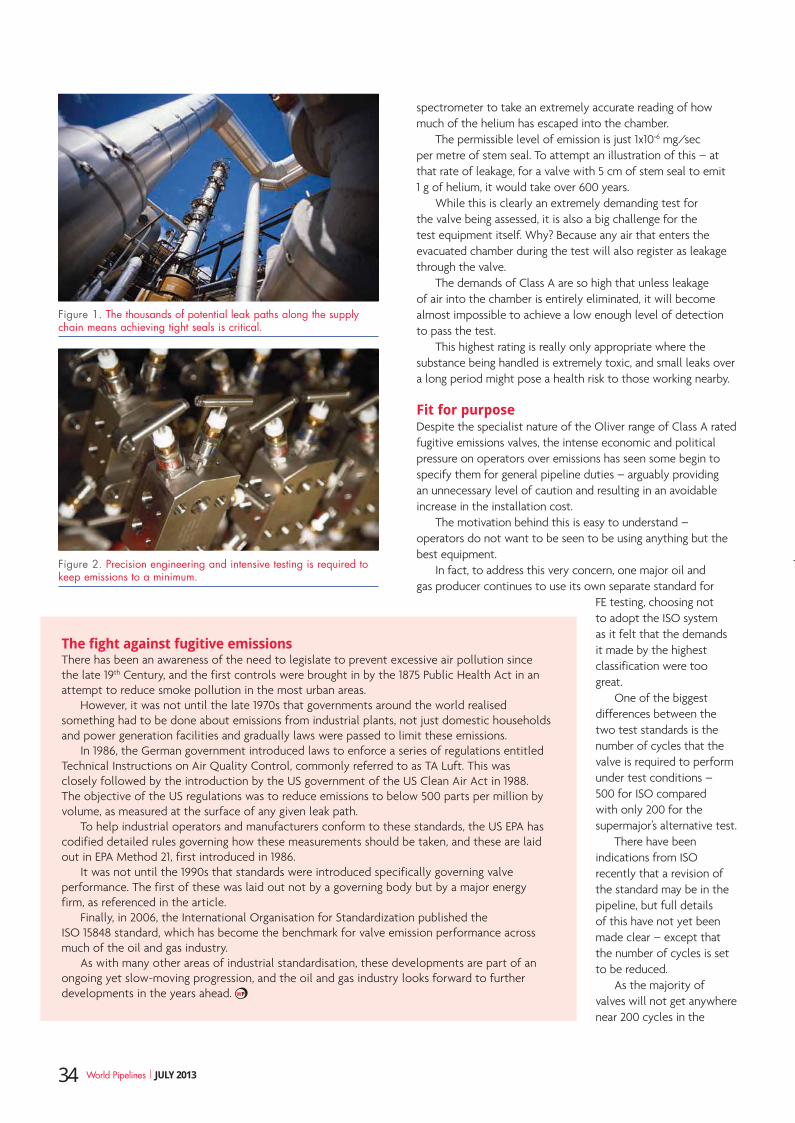
spectrometer to take an extremely accurate reading of how much of the helium has escaped into the chamber.
The permissible level of emission is just 1x10⁻⁶ mg/sec per metre of stem seal. To attempt an illustration of this – at that rate of leakage, for a valve with 5 cm of stem seal to emit 1 g of helium, it would take over 600 years.
While this is clearly an extremely demanding test for the valve being assessed, it is also a big challenge for the test equipment itself. Why? Because any air that enters the evacuated chamber during the test will also register as leakage through the valve.
The demands of Class A are so high that unless leakage of air into the chamber is entirely eliminated, it will become almost impossible to achieve a low enough level of detection to pass the test.
This highest rating is really only appropriate where the substance being handled is extremely toxic, and small leaks over a long period might pose a health risk to those working nearby.
Fit for purposeDespite the specialist nature of the Oliver range of Class A rated fugitive emissions valves, the intense economic and political pressure on operators over emissions has seen some begin to specify them for general pipeline duties – arguably providing an unnecessary level of caution and resulting in an avoidable increase in the installation cost.
The motivation behind this is easy to understand – operators do not want to be seen to be using anything but the best equipment.
In fact, to address this very concern, one major oil and gas producer continues to use its own separate standard for
FE testing, choosing not to adopt the ISO system as it felt that the demands it made by the highest classification were too great.
One of the biggest differences between the two test standards is the number of cycles that the valve is required to perform under test conditions – 500 for ISO compared with only 200 for the supermajor’s alternative test.
There have been indications from ISO recently that a revision of the standard may be in the pipeline, but full details of this have not yet been made clear – except that the number of cycles is set to be reduced.
As the majority of valves will not get anywhere near 200 cycles in the
The fight against fugitive emissionsThere has been an awareness of the need to legislate to prevent excessive air pollution since the late 19th Century, and the first controls were brought in by the 1875 Public Health Act in an attempt to reduce smoke pollution in the most urban areas.
However, it was not until the late 1970s that governments around the world realised something had to be done about emissions from industrial plants, not just domestic households and power generation facilities and gradually laws were passed to limit these emissions.
In 1986, the German government introduced laws to enforce a series of regulations entitled Technical Instructions on Air Quality Control, commonly referred to as TA Luft. This was closely followed by the introduction by the US government of the US Clean Air Act in 1988. The objective of the US regulations was to reduce emissions to below 500 parts per million by volume, as measured at the surface of any given leak path.
To help industrial operators and manufacturers conform to these standards, the US EPA has codified detailed rules governing how these measurements should be taken, and these are laid out in EPA Method 21, first introduced in 1986.
It was not until the 1990s that standards were introduced specifically governing valve performance. The first of these was laid out not by a governing body but by a major energy firm, as referenced in the article.
Finally, in 2006, the International Organisation for Standardization published the ISO 15848 standard, which has become the benchmark for valve emission performance across much of the oil and gas industry.
As with many other areas of industrial standardisation, these developments are part of an ongoing yet slow-moving progression, and the oil and gas industry looks forward to further developments in the years ahead.
Figure 1. The thousands of potential leak paths along the supply chain means achieving tight seals is critical.
Figure 2. Precision engineering and intensive testing is required to keep emissions to a minimum.
34 World Pipelines | JULY 2013
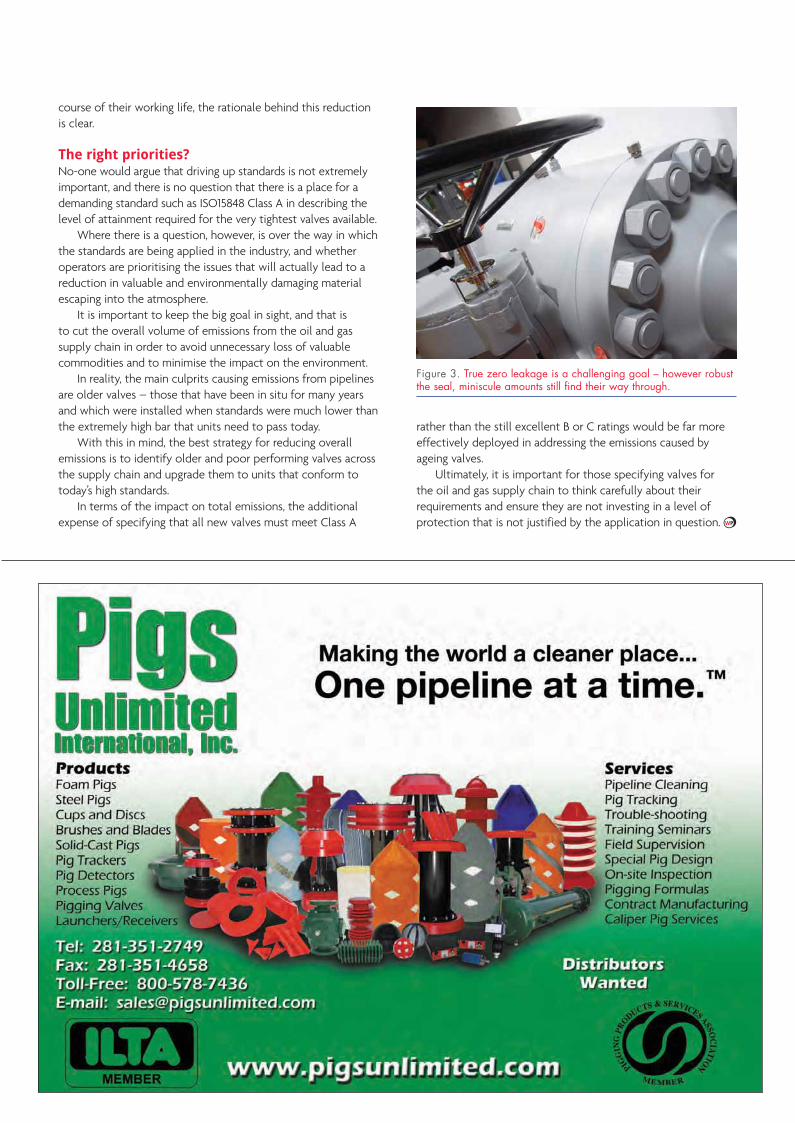
course of their working life, the rationale behind this reduction is clear.
The right priorities?No-one would argue that driving up standards is not extremely important, and there is no question that there is a place for a demanding standard such as ISO15848 Class A in describing the level of attainment required for the very tightest valves available.
Where there is a question, however, is over the way in which the standards are being applied in the industry, and whether operators are prioritising the issues that will actually lead to a reduction in valuable and environmentally damaging material escaping into the atmosphere.
It is important to keep the big goal in sight, and that is to cut the overall volume of emissions from the oil and gas supply chain in order to avoid unnecessary loss of valuable commodities and to minimise the impact on the environment.
In reality, the main culprits causing emissions from pipelines are older valves – those that have been in situ for many years and which were installed when standards were much lower than the extremely high bar that units need to pass today.
With this in mind, the best strategy for reducing overall emissions is to identify older and poor performing valves across the supply chain and upgrade them to units that conform to today’s high standards.
In terms of the impact on total emissions, the additional expense of specifying that all new valves must meet Class A
rather than the still excellent B or C ratings would be far more effectively deployed in addressing the emissions caused by ageing valves.
Ultimately, it is important for those specifying valves for the oil and gas supply chain to think carefully about their requirements and ensure they are not investing in a level of protection that is not justified by the application in question.
Figure 3. True zero leakage is a challenging goal – however robust the seal, miniscule amounts still find their way through.
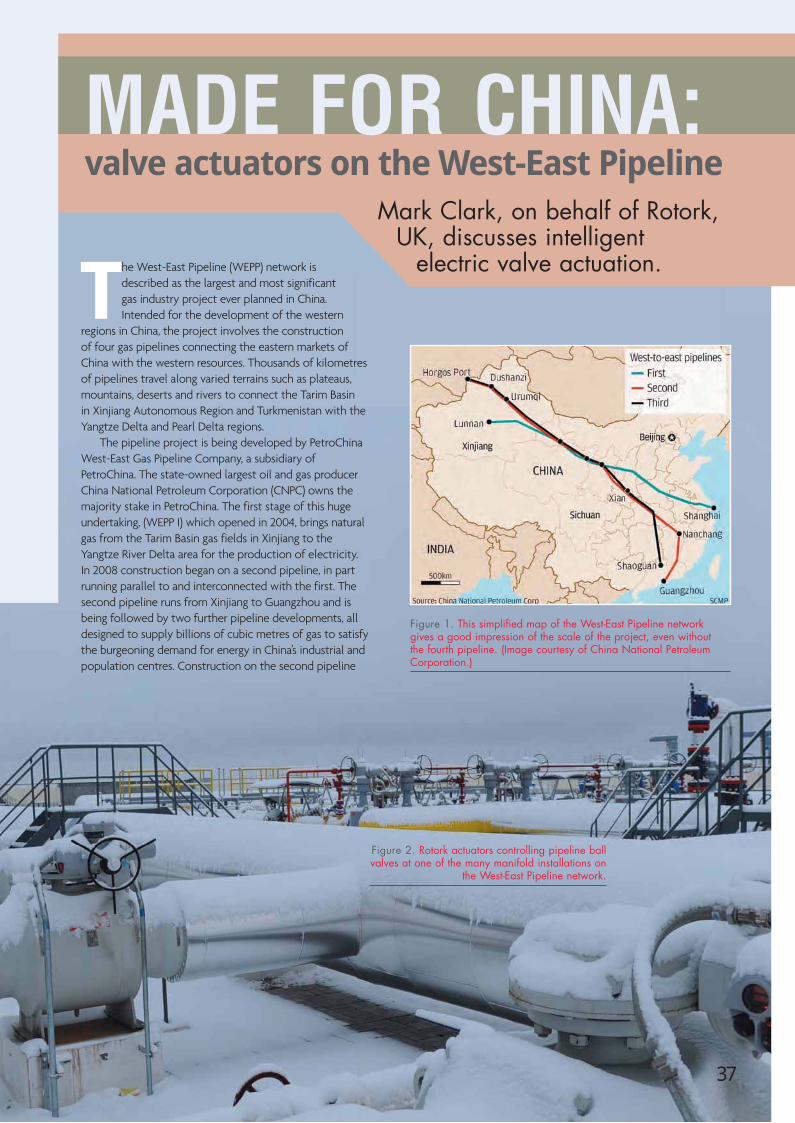
The West-East Pipeline (WEPP) network is described as the largest and most significant gas industry project ever planned in China. Intended for the development of the western
regions in China, the project involves the construction of four gas pipelines connecting the eastern markets of China with the western resources. Thousands of kilometres of pipelines travel along varied terrains such as plateaus, mountains, deserts and rivers to connect the Tarim Basin in Xinjiang Autonomous Region and Turkmenistan with the Yangtze Delta and Pearl Delta regions.
The pipeline project is being developed by PetroChina West-East Gas Pipeline Company, a subsidiary of PetroChina. The state-owned largest oil and gas producer China National Petroleum Corporation (CNPC) owns the majority stake in PetroChina. The first stage of this huge undertaking, (WEPP I) which opened in 2004, brings natural gas from the Tarim Basin gas fields in Xinjiang to the Yangtze River Delta area for the production of electricity. In 2008 construction began on a second pipeline, in part running parallel to and interconnected with the first. The second pipeline runs from Xinjiang to Guangzhou and is being followed by two further pipeline developments, all designed to supply billions of cubic metres of gas to satisfy the burgeoning demand for energy in China’s industrial and population centres. Construction on the second pipeline
Figure 2. Rotork actuators controlling pipeline ball valves at one of the many manifold installations on
the West-East Pipeline network.
Mark Clark, on behalf of Rotork, UK, discusses intelligent
electric valve actuation.
MADE FOR CHINA: valve actuators on the West-East Pipeline
Figure 1. This simplified map of the West-East Pipeline network gives a good impression of the scale of the project, even without the fourth pipeline. (Image courtesy of China National Petroleum Corporation.)
37

(WEPP II) started in February 2008 and groundbreaking for the third pipeline (WEPP III) took place in October 2012. WEPP IV is still in the planning stage.
The meaning of intelligent actuationIn 2002, when construction of the first pipeline started, IQ intelligent valve technology had been in existence for nearly 10 years and was established in many industries. The first generation of IQ actuators had recently been superseded by IQ Mark 2, adding new functionality that could not be found in the products of other manufacturers who were beginning to copy the original design.
At the time, Rotork was the only manufacturer to offer non-intrusive setting, commissioning with data logging and data transfer technologies in actuators that were already proven in the international oil and gas industries. The IQ actuator had pioneered non-intrusive data communication by means of an infra-red link to a hand-held setting tool when launched in 1993 and by 2000 the IQ was accounting for the majority of the company’s worldwide electric actuator sales.
Commissioning actuators non-intrusively, without removing electrical covers to set end of travel switches and torque settings, offered the operators many benefits. As well as improving the efficiency of the commissioning process, the technique ensured that internal electronic components were permanently protected from the possibility of contamination by moisture or dust, securing long-term reliability in the environmentally challenging conditions prevalent along the pipeline route. A ‘double-sealed’ terminal compartment for wiring up the power and control cables further enhances the technology. Terminals are separately sealed from the main body of the actuator to ensure that internal electrics are protected when the terminal cover is removed. As a result, actuators with the highest certification for hazardous area operation also feature a robust, watertight and temporarily submersible enclosure approved to IP68 and the equivalent international standards.
By 2006 the non-intrusive technology had been further developed by the introduction of bi-directional communication
between the actuator and setting tool, enabling actuator configuration data to be retrieved and re-transmitted to other actuators, with the potential to save immense amounts of time when many valves require near identical commissioning settings. The data can also be downloaded on to a PC, fine-tuned or adjusted and then re-transmitted via the hand tool to the actuator.
Integral data loggers in each actuator record the commissioning data ‘footprint’ and subsequent valve operating information, including the torque profiles in both valve directions. Extraction and analysis of this data on a PC running Rotork IQ-Insight software enables the accurate evaluation of valve performance and the identification of potential operational issues. Asset management programmes can then be planned with greater efficiency, eliminating the temptation to plan for over-cautious maintenance schedules. The risk of unexpected process interruptions is also minimised. Data can be downloaded by the hand-held setting tool or with a laptop running the software directly linked to the actuator.
New developmentsThe 4000 km length of the first pipeline is less than half of the total length of the second pipeline and its eight branch lines. Similarly, the 17 billion m3/yr capacity of the first pipeline has been eclipsed by the 30 billion m3/yr capacity of the larger bore second pipeline.
Construction of the third pipeline, which has similar statistics to WEPP II, is now underway and from the beginning of 2013 orders for this project are being fulfilled with another new generation of IQ actuation technology, designated IQ3. Experience and feedback from projects such as the first two West-East Pipelines has made a vital contribution to Rotork’s ability to introduce more functionality and asset
Figure 3. From the very beginning, electric valve actuation utilising Rotork IQ intelligent non-intrusive technology has been adopted throughout the project. For over a decade, thousands of these actuators have been installed during all stages of the project for valve control at compressor stations, manifolds and storage facilities.
Figure 4. Diagnostic valve torque data from a Rotork IQ3 actuator displayed with Insight2 software. As the valve ages it may become more difficult to open and close because of internal and external factors. By identifying such issues, the software can be used to improve overall asset management.
38 World Pipelines | JULY 2013
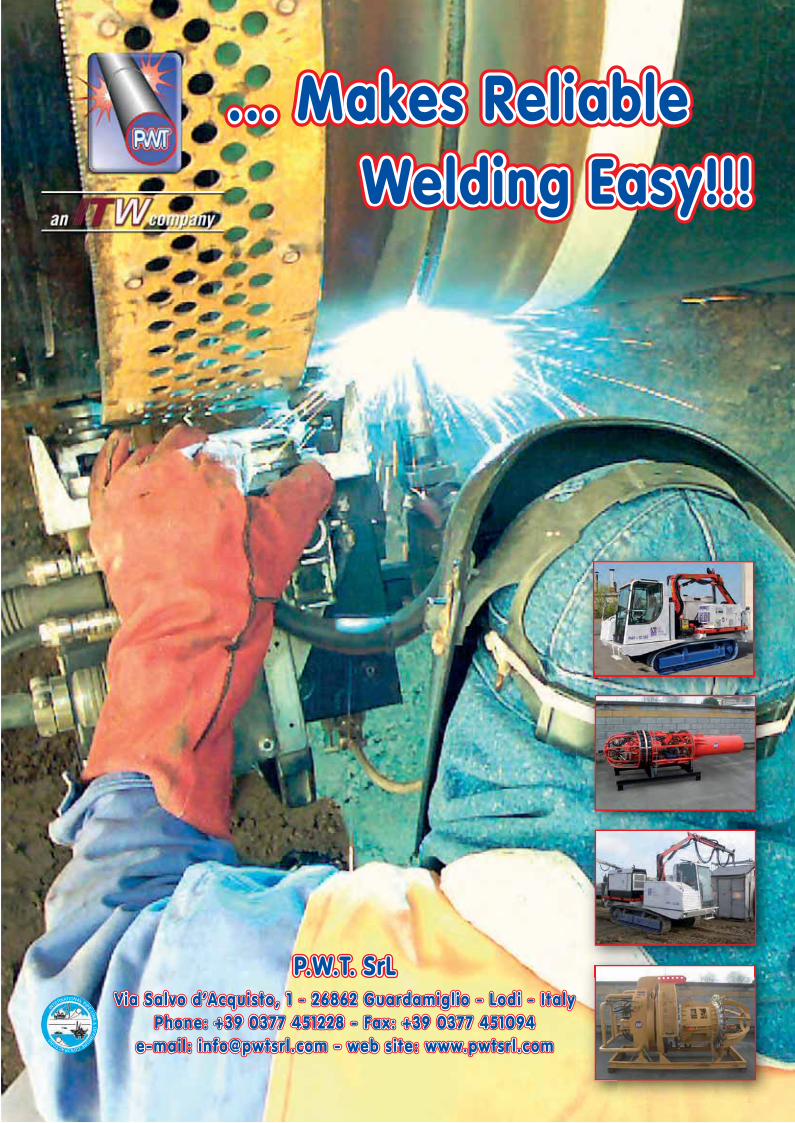
•
P.W.T. SrLVia Salvo d’Acquisto, 1 - 26862 Guardamigl io - Lodi - I ta ly
Phone: +39 0377 451228 - Fax: +39 0377 451094e-mai l : info@pwtsr l .com - web s i te: www.pwtsr l .com
... Makes Reliable Welding Easy!!!
IN
TERNA
TIONAL PIPELIN
E&OFFSHO
RECONTRACTORS
•

management features that dovetail seamlessly into existing installations and control protocols. Further advances to data logging, display and communication capabilities have been introduced in response to the recognised desire from end users to access even more data, both in the field and in the control room.
Included in the list of developments, there are three key features of the IQ3 design that are particularly important for long-term reliability, low maintenance and low cost of ownership.
First, the actuator local position indicator window has developed into a multi-functional display capable of providing local indication, valve and actuator status, menu screens for configuring and setting up the actuator, fault diagnostics and asset management information. What was once just a local position indicator is now a window to the plant process. In addition to local position indication, it also provides a graphic interface to assist set up and calibration and it displays – at the valve – critical performance data in relationship to actuator performance that allows a user to determine the service condition of the valve or predict when a problem may occur.
The display itself has been designed as a double display with a very wide viewing angle. The front segment display enables the actuator to be fully set up and operated, whilst the second enables detailed diagnostic and operating data screens to be permanently displayed, delivering the ‘view of the process’. Four selectable screens are available; depending on the information that the operator wishes to see at all times, including diagnostic graphics, simultaneous demand and position, torque and position and actuator settings. Valve position is displayed to one decimal point, offering accuracy and resolution for diagnostic
analysis. Diagnostic graphics offer a window into the process showing the valve torque graph and facilitating analysis of the situation in real-time.
Second, the accurate measurement of the actuator output torque is a function provided by the worm and wheel. The axial force of the worm shaft is always proportional to the torque produced by the worm wheel and this is not affected by changes in the efficiency of the gearing caused by long-term operation. The torque is measured by a force transducer rather than disc springs or any other mechanical devices that can wear and change their characteristics over time. This is very important for asset management, as the torque profile of the valve operating stroke is recorded by the actuator data logger as a ‘footprint’ during commissioning and subsequently recorded during every valve operation. This data forms a crucial part of the information that can be used for maintenance planning.
Third, reliable and sustainable valve control relies on accurate and repeatable position measurement by the actuator. To achieve this, the IQ3 now uses a patented absolute encoder. Absolute encoders are electro-mechanical position measurement devices that sense the relative positions of driven gears to calculate the position of the actuator output and therefore the valve position. Their advantage is that they require no power to track the position change; their disadvantage is that they add complexity and can reduce reliability.
Using the latest technology and after several years of testing, the IQ absolute encoder overcomes these problems. It is contactless, with only four moving parts and can measure up to 8000 output turns with high resolution, redundancy and self checking. The design increases position sensing reliability whilst providing position measurement with or without power connected.
Figure 5. In addition to pipeline isolating valve duties, intelligent electric actuators are also utilised for control valve duties at take-off stations that enable the gas to be transferred at a reduced pressure to downstream distribution networks. In this example, IQM modulating actuators control axial flow control valves in sizes between 100 - 250 mm. These Class 600 valves are described as the critical ‘first in line’ valves that reduce gas pressure from the main transmission line operating pressure of up to 99 Bar to the downstream distribution pressure of 25 - 45 Bar. On the first pipeline alone more than 50 of these take-off stations were built along the route. (Image courtesy of Mokveld Valves.)
Figure 6. IQ3 actuators continue to use a simple worm and wheel drive train, proven in over 50 years of reliable operation.
40 World Pipelines | JULY 2013

AN ADDITIONAL TOOL FOR CORROSION MANAGEMENT
Emma Perfect, Managing Director and CSO, LUX Assure Limited, UK, talks about the power of corrosion inhibitor micelle detection and its implications for pipeline corrosion management.
Management of internal corrosion typically involves monitoring a number of properties of a system with, for example, coupon testing, residual inhibitor monitoring, corrosion rate probes and intelligent pigs.
Pipeline corrosion manage ment has attracted ever-increasing attention over the past couple of decades due to a number of high profile pipeline failures. Preventing corrosion is a costly business and pipelines are increasingly subject to corrosion stresses caused by transporting multiple products, empty periods during product changeover and below capacity flow through the pipelines; risk assessment strategies and pipeline integrity management programmes have therefore gained greater importance.
41
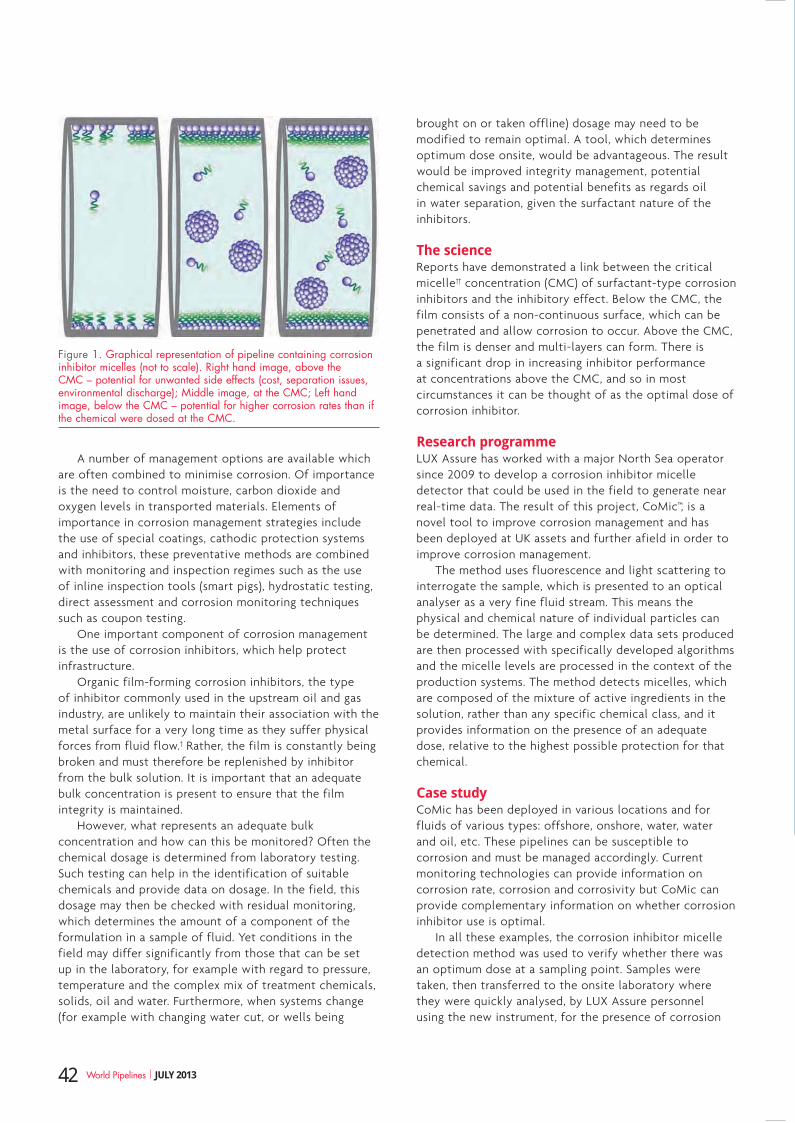
A number of management options are available which are often combined to minimise corrosion. Of importance is the need to control moisture, carbon dioxide and oxygen levels in transported materials. Elements of importance in corrosion management strategies include the use of special coatings, cathodic protection systems and inhibitors, these preventative methods are combined with monitoring and inspection regimes such as the use of inline inspection tools (smart pigs), hydrostatic testing, direct assessment and corrosion monitoring techniques such as coupon testing.
One important component of corrosion management is the use of corrosion inhibitors, which help protect infrastructure.
Organic film-forming corrosion inhibitors, the type of inhibitor commonly used in the upstream oil and gas industry, are unlikely to maintain their association with the metal surface for a very long time as they suffer physical forces from fluid flow.† Rather, the film is constantly being broken and must therefore be replenished by inhibitor from the bulk solution. It is important that an adequate bulk concentration is present to ensure that the film integrity is maintained.
However, what represents an adequate bulk concentration and how can this be monitored? Often the chemical dosage is determined from laboratory testing. Such testing can help in the identification of suitable chemicals and provide data on dosage. In the field, this dosage may then be checked with residual monitoring, which determines the amount of a component of the formulation in a sample of fluid. Yet conditions in the field may differ significantly from those that can be set up in the laboratory, for example with regard to pressure, temperature and the complex mix of treatment chemicals, solids, oil and water. Furthermore, when systems change (for example with changing water cut, or wells being
brought on or taken offline) dosage may need to be modified to remain optimal. A tool, which determines optimum dose onsite, would be advantageous. The result would be improved integrity management, potential chemical savings and potential benefits as regards oil in water separation, given the surfactant nature of the inhibitors.
The scienceReports have demonstrated a link between the critical micelle†† concentration (CMC) of surfactant-type corrosion inhibitors and the inhibitory effect. Below the CMC, the film consists of a non-continuous surface, which can be penetrated and allow corrosion to occur. Above the CMC, the film is denser and multi-layers can form. There is a significant drop in increasing inhibitor performance at concentrations above the CMC, and so in most circumstances it can be thought of as the optimal dose of corrosion inhibitor.
Research programmeLUX Assure has worked with a major North Sea operator since 2009 to develop a corrosion inhibitor micelle detector that could be used in the field to generate near real-time data. The result of this project, CoMic™, is a novel tool to improve corrosion management and has been deployed at UK assets and further afield in order to improve corrosion management.
The method uses fluorescence and light scattering to interrogate the sample, which is presented to an optical analyser as a very fine fluid stream. This means the physical and chemical nature of individual particles can be determined. The large and complex data sets produced are then processed with specifically developed algorithms and the micelle levels are processed in the context of the production systems. The method detects micelles, which are composed of the mixture of active ingredients in the solution, rather than any specific chemical class, and it provides information on the presence of an adequate dose, relative to the highest possible protection for that chemical.
Case studyCoMic has been deployed in various locations and for fluids of various types: offshore, onshore, water, water and oil, etc. These pipelines can be susceptible to corrosion and must be managed accordingly. Current monitoring technologies can provide information on corrosion rate, corrosion and corrosivity but CoMic can provide complementary information on whether corrosion inhibitor use is optimal.
In all these examples, the corrosion inhibitor micelle detection method was used to verify whether there was an optimum dose at a sampling point. Samples were taken, then transferred to the onsite laboratory where they were quickly analysed, by LUX Assure personnel using the new instrument, for the presence of corrosion
Figure 1. Graphical representation of pipeline containing corrosion inhibitor micelles (not to scale). Right hand image, above the CMC – potential for unwanted side effects (cost, separation issues, environmental discharge); Middle image, at the CMC; Left hand image, below the CMC – potential for higher corrosion rates than if the chemical were dosed at the CMC.
42 World Pipelines | JULY 2013


inhibitor micelles. Analysis then determines whether the samples are above the CMC. Note that adjustments to the instrument between analyses meant that the scales on ordinate axes of figures could not be directly compared. Timing is important as corrosion inhibitor micelles are known to change when left in a static oxygenated environment for the long periods associated with shipping samples, so onsite analysis is considered important to ensure accurate results.
Example A – testing at an oil receiving terminalPrior to the deployment, bubble tests, rotating cylinder electrode tests and a flow loop test were performed, with the micelle method being used alongside more traditional approaches. By using progressively more challenging conditions, strong evidence for the link between CMC and effective inhibitor dose under simulated field conditions was found. In the field, the instrumentation was set up in the onsite laboratory. Samples were taken from a receiving sphere and then transported to the lab for testing during which the number of corrosion inhibitor micelles in samples was determined. The fluid was found to be at a point just above the critical micelle concentration for this system.
Example B – testing at an offshore pipelineFlow lines must be protected from internal corrosion and in this deployment of the micelle detection technology, the input and output fluids from a short inter-platform pipeline were tested. By using the micelle particle detection system on the platform, samples could be quickly analysed. Samples were taken from the pipeline and transported to the offshore laboratory for testing. Results suggest corrosion inhibitor micelles were apparent in the brine phase of the fluids entering the pipeline, but had been consumed by the time they had arrived on the destination platform. This analysis provided information, beyond that already available from probes and residual
monitoring, for the facility manager to understand the corrosion risks that existed in the pipeline.
Example C – testing at an onshore production facility Samples taken from a number of points on an onshore production facility were tested. The fluids were diverse; some were water only and some had a significant oil component. Results suggested that whilst some fluids appeared to be dosed above the CMC some were below. New information was therefore provided to the facility manager to enable better-informed decisions about corrosion inhibitor injection to be made.
In summary, results shown here indicate that the critical micelle concentration had been reached for some fluids but not all. The technology therefore provides new information for the facility managers to understand the corrosion risks that existed in the pipeline.
ConclusionMonitoring corrosion inhibitor micelles offers a new, complementary approach to improve corrosion management. The variety of case studies presented in the article serves to demonstrate potential applications of the technology, which can provide insights into corrosion inhibitor management.
LUX Assure aims to become the world leader in providing new technology to monitor difficult-to-detect chemicals used by the oil industry. Having recently raised significant investment in 2013, the company plans a period of growth and transformation into a service provider.
Notes† Organic film-forming corrosion inhibitors that are used to prevent
corrosion in oil and gas production systems usually contain active ingredients defined by a small number of chemical classes, which are surfactants. These form a protective layer on the metal surface, which minimises corrosion.
†† A micelle is a nanoscale aggregate of corrosion inhibitor that forms when a system has reached saturation, i.e., corrosion inhibitor has adhered to every available surface (pipe, solid, interface).
Figure 2. Left hand graph shows data generated from tests conducted at an oil receiving terminal that indicate the fluid contained corrosion inhibitor at the CMC; Middle graph shows data generated from tests conducted at an offshore pipeline that indicate differences in micelle numbers between input and output fluids; Right hand graph shows data generated from tests conducted at an onshore production facility that indicate only some fluids tested were at, or above, the CMC.
44 World Pipelines | JULY 2013

Dr. Peter Collins, CEO, Permasense Ltd, UK, considers the benefits of continuous corrosion monitoring in oil and gas applications.
An ever-increasing proportion of oil and gas production is in areas of the world in which availability of suitably qualified inspection personnel is a challenge – the Arctic, politically unstable regions – or in which there are heightened risks to personnel – offshore, regions of kidnap risk. From wellhead, through feeder lines to processing facility, from offshore platform or FPSO to terminal, continuous corrosion monitoring systems are today proving an efficient and safe way for
these personnel to monitor the integrity of pipe work at their desks. Permasense’s continuous corrosion monitoring systems combine permanently installed, ultrasonic sensor technology with
wireless communication to deliver data to the corrosion engineer’s desk. The systems enable direct, accurate and frequent measurement of pipe wall thickness to identify corrosion or erosion trends in a timeframe and with accuracy not possible with manual inspection methods.
In the November 2012 edition of World Pipelines, an outline was given of how continuous monitoring provides asset and integrity managers with a picture of how their facility is coping with the demands placed on it by corrosive fluids or erosive fluids.1
This article provides an update of the latest developments with the Permasense solution in upstream and downstream applications.
45

Ultrasonic sensorsAt the core of all Permasense systems is an ultrasonic sensor mounted on stainless steel waveguides. The waveguides isolate the sensor electronics from extreme temperatures and guide the ultrasonic signals to the pipe wall and back.
The sensors are battery powered, and transmit their data by radio. This means that cabling to monitoring locations is not required, which minimises the cost of installation, and enables deployment in difficult to access and remote areas.
Solution now proven in far-flung locations The company’s long-range system provides for transmission distances of up to 40 km (25 miles) from monitoring location to data network access point (Figure 1). The long-range system has been developed to allow for easy deployment on pipeline and feeder lines upstream and midstream.
With the long-range system, the same ultrasonic wall thickness measurement sensors are utilised as for the short-range system, but sensors are cabled to a long-range antenna, enabling communication with a gateway up to 40 km (25 miles) away. Thus data can be retrieved even from remote monitoring locations, enabling systems to be configured to meet the needs of various upstream facilities.
This system is already in service across the feeder lines of an onshore production field.
Sensor installationSecuring sensors is straightforward, on studs that are mounted on the pipe, or, for pipe wall temperatures below 100 ˚C (200 ˚F), on girth clamps, that are in turn mounted on the pipe.
This allows the sensors to be dry coupled; no couplant is required between the sensor and the pipe. This, together with multi-year battery life, eliminates the need for expensive maintenance visits.
Sensors are now in service on a full range of materials including carbon and cast carbon steel, P5/5 chrome, P9/9 chrome, 1% Cr (5130), duplex, P265GH (430-161), 1.4571 (316Ti), P295GH (17Mn4), monel, HR120, Inconel, Incoloy and hastelloy.
Hammerfest experienceA Permasense corrosion monitoring system at the Statoil Hammerfest LNG facility included over 40 sensors being installed. This facility is the world’s most northerly and Europe’s first LNG export facility, located on Melkøya Island in Finnmark County, Norway.
The Permasense system has been put in place to assist with monitoring the thickness of pipeline walls to enable future detection of corrosion activity, and with reliable, continuous data help inform maintenance requirements and enhance reliable and safe operations. Key considerations in choosing the system were that it is non-intrusive, that it does not require maintenance, and that data is delivered to the desk, reducing personnel visits required to potentially dangerous process areas.
The sensors have been placed in circumferential rings, with sensors placed at multiple circumferential locations for each axial location. The piping varies from carbon steel with a 38 mm thickness, to duplex of 25 mm thickness, to SMO steel of 3 mm thickness. The pipe diameters range from 8 - 36 in. Generally these are operating at temperatures around 100 ˚C.
At this facility extremes of ambient temperature are also experienced and it was important that the sensors could reliably operate in these harsh environments.
Data management Data from installations reveals that where corrosion is taking place it is often intermittent rather than continuous. In such cases it is particularly valuable to be able to correlate thickness data over time with process and/or inhibitor parameters. Moreover, the data can highlight which prevention or mitigation strategies are most effective.
Sophisticated data management and viewing software is an integral part of the Permasense solution to support the interpretation of data provided from continuous monitoring. The system’s data management and visualisation suite, Data Manager, offers an overview of all locations monitored, direct to desk.
With drill-down functionality, the latest version of Data Manager offers additional analysis features including rates over various periods of time, remaining wall thickness to retirement and seven day average measurement.
Figure 1. The Permasense long-range system.
Figure 2. Flexibility of monitoring locations – here, on an insulated line.
46 World Pipelines | JULY 2013

RAISING PERFORMANCE. TOGETHER™
Upstream to downstream, onshore to offshore, count on
Cameron for complete valve expertise. We offer the broadest
range of quality valves in the industry. Life cycle management
programs that optimize performance and reduce costs. And
the unmatched experience that comes with solving problems
for our customers around the globe. For every market segment, from up-front
planning to aftermarket services, look to the valve experts at Cameron.
www.c-a-m.com/valves
F L O W E Q U I P M E N T L E A D E R S H I P
The broadest portfolio of valves.The most comprehensive life cycle programs.
BROADEST VALVE PORTFOLIO
PREMIUM VALVE BRANDS
PROJECT VALVE MANAGEMENTSM (PVM)
CAMSERV™ AFTERMARKET SERVICES
TOTAL VALVE CARESM
DISCOVER VALVE EXPERTISE
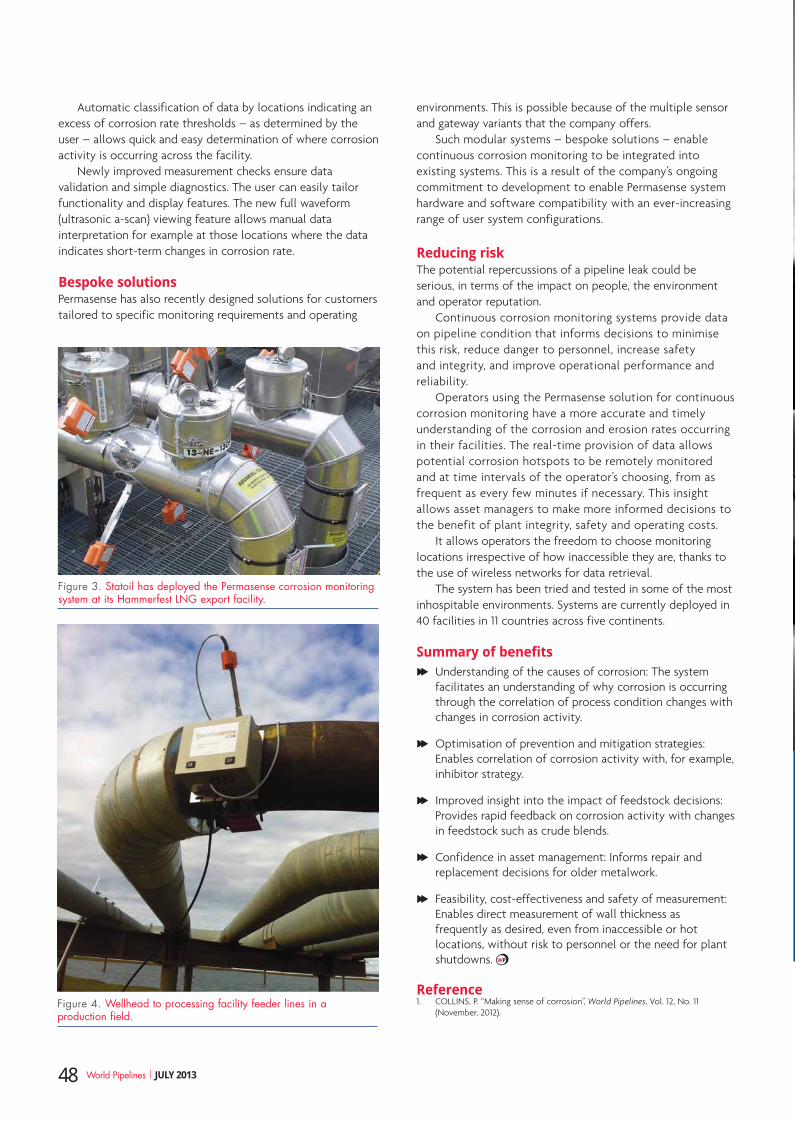
Automatic classification of data by locations indicating an excess of corrosion rate thresholds – as determined by the user – allows quick and easy determination of where corrosion activity is occurring across the facility.
Newly improved measurement checks ensure data validation and simple diagnostics. The user can easily tailor functionality and display features. The new full waveform (ultrasonic a-scan) viewing feature allows manual data interpretation for example at those locations where the data indicates short-term changes in corrosion rate.
Bespoke solutionsPermasense has also recently designed solutions for customers tailored to specific monitoring requirements and operating
environments. This is possible because of the multiple sensor and gateway variants that the company offers.
Such modular systems – bespoke solutions – enable continuous corrosion monitoring to be integrated into existing systems. This is a result of the company’s ongoing commitment to development to enable Permasense system hardware and software compatibility with an ever-increasing range of user system configurations.
Reducing risk The potential repercussions of a pipeline leak could be serious, in terms of the impact on people, the environment and operator reputation.
Continuous corrosion monitoring systems provide data on pipeline condition that informs decisions to minimise this risk, reduce danger to personnel, increase safety and integrity, and improve operational performance and reliability.
Operators using the Permasense solution for continuous corrosion monitoring have a more accurate and timely understanding of the corrosion and erosion rates occurring in their facilities. The real-time provision of data allows potential corrosion hotspots to be remotely monitored and at time intervals of the operator’s choosing, from as frequent as every few minutes if necessary. This insight allows asset managers to make more informed decisions to the benefit of plant integrity, safety and operating costs.
It allows operators the freedom to choose monitoring locations irrespective of how inaccessible they are, thanks to the use of wireless networks for data retrieval.
The system has been tried and tested in some of the most inhospitable environments. Systems are currently deployed in 40 facilities in 11 countries across five continents.
Summary of benefits F Understanding of the causes of corrosion: The system
facilitates an understanding of why corrosion is occurring through the correlation of process condition changes with changes in corrosion activity.
F Optimisation of prevention and mitigation strategies: Enables correlation of corrosion activity with, for example, inhibitor strategy.
F Improved insight into the impact of feedstock decisions: Provides rapid feedback on corrosion activity with changes in feedstock such as crude blends.
F Confidence in asset management: Informs repair and replacement decisions for older metalwork.
F Feasibility, cost-effectiveness and safety of measurement: Enables direct measurement of wall thickness as frequently as desired, even from inaccessible or hot locations, without risk to personnel or the need for plant shutdowns.
Reference1. COLLINS, P. “Making sense of corrosion”, World Pipelines, Vol. 12, No. 11
(November, 2012).
Figure 3. Statoil has deployed the Permasense corrosion monitoring system at its Hammerfest LNG export facility.
Figure 4. Wellhead to processing facility feeder lines in a production field.
48 World Pipelines | JULY 2013

Since 1953, Midwestern has converted new and used tractors into the industry’s
most reliable pipelayers. We design and manufacture sidebooms ranging from
10,000 to 230,000 lb (4 to 104t) capacities for all types of tractors and pipeline
projects on every continent. From pipe-laying equipment to comprehensive
pipeline products, no company is better equipped to exceed your expectations.
We carry weight in the industry.
Sidebooms.comMidwesternPipeline.com
011-918-858-4234

The global oil and gas pipeline industry is one of the most challenging and tough industries to work in – from oil’s price swings and resulting budget changes, to extreme equipment requirements, to increasing
environmental regulations, to the safety of personnel on and offshore. This backdrop demands that a company define and prioritise a procurement strategy that takes into
TODD SNELGROVE, SKF, GLOBAL MANAGER (VALUE), ON WHY
PROCUREMENT DECISIONS NEED TO TAKE INTO ACCOUNT
THE TOTAL COST OF OWNERSHIP.
50
account the needs of key stakeholders in maintenance, reliability, scheduling, and production while meeting the corporation’s goals of delivering sustainable profits. Best-in-class companies have found the way in defining a company goal and strategy with regards to procuring, prioritising, and implementing projects and programmes focused on creating and obtaining maximum value. The
best methodology for understanding and choosing those options is to analyse the total cost of ownership (TCO) and the benefits created and received with different options.
The business world is not a zero sum game; meaning any win one has is not at the expense of the other person at the negotiating table. Incremental value needs
51
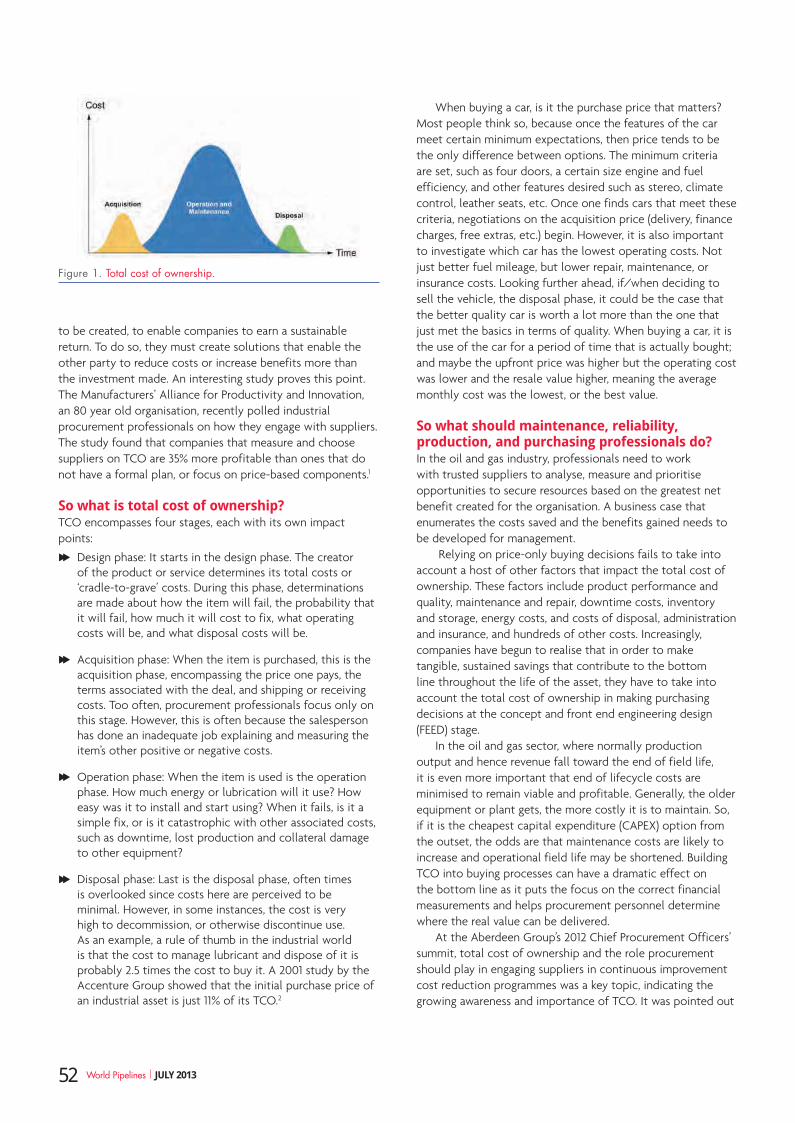
to be created, to enable companies to earn a sustainable return. To do so, they must create solutions that enable the other party to reduce costs or increase benefits more than the investment made. An interesting study proves this point. The Manufacturers’ Alliance for Productivity and Innovation, an 80 year old organisation, recently polled industrial procurement professionals on how they engage with suppliers. The study found that companies that measure and choose suppliers on TCO are 35% more profitable than ones that do not have a formal plan, or focus on price-based components.1
So what is total cost of ownership?TCO encompasses four stages, each with its own impact points:
F Design phase: It starts in the design phase. The creator of the product or service determines its total costs or ‘cradle-to-grave’ costs. During this phase, determinations are made about how the item will fail, the probability that it will fail, how much it will cost to fix, what operating costs will be, and what disposal costs will be.
F Acquisition phase: When the item is purchased, this is the acquisition phase, encompassing the price one pays, the terms associated with the deal, and shipping or receiving costs. Too often, procurement professionals focus only on this stage. However, this is often because the salesperson has done an inadequate job explaining and measuring the item’s other positive or negative costs.
F Operation phase: When the item is used is the operation phase. How much energy or lubrication will it use? How easy was it to install and start using? When it fails, is it a simple fix, or is it catastrophic with other associated costs, such as downtime, lost production and collateral damage to other equipment?
F Disposal phase: Last is the disposal phase, often times is overlooked since costs here are perceived to be minimal. However, in some instances, the cost is very high to decommission, or otherwise discontinue use. As an example, a rule of thumb in the industrial world is that the cost to manage lubricant and dispose of it is probably 2.5 times the cost to buy it. A 2001 study by the Accenture Group showed that the initial purchase price of an industrial asset is just 11% of its TCO.2
When buying a car, is it the purchase price that matters? Most people think so, because once the features of the car meet certain minimum expectations, then price tends to be the only difference between options. The minimum criteria are set, such as four doors, a certain size engine and fuel efficiency, and other features desired such as stereo, climate control, leather seats, etc. Once one finds cars that meet these criteria, negotiations on the acquisition price (delivery, finance charges, free extras, etc.) begin. However, it is also important to investigate which car has the lowest operating costs. Not just better fuel mileage, but lower repair, maintenance, or insurance costs. Looking further ahead, if/when deciding to sell the vehicle, the disposal phase, it could be the case that the better quality car is worth a lot more than the one that just met the basics in terms of quality. When buying a car, it is the use of the car for a period of time that is actually bought; and maybe the upfront price was higher but the operating cost was lower and the resale value higher, meaning the average monthly cost was the lowest, or the best value.
So what should maintenance, reliability, production, and purchasing professionals do?In the oil and gas industry, professionals need to work with trusted suppliers to analyse, measure and prioritise opportunities to secure resources based on the greatest net benefit created for the organisation. A business case that enumerates the costs saved and the benefits gained needs to be developed for management.
Relying on price-only buying decisions fails to take into account a host of other factors that impact the total cost of ownership. These factors include product performance and quality, maintenance and repair, downtime costs, inventory and storage, energy costs, and costs of disposal, administration and insurance, and hundreds of other costs. Increasingly, companies have begun to realise that in order to make tangible, sustained savings that contribute to the bottom line throughout the life of the asset, they have to take into account the total cost of ownership in making purchasing decisions at the concept and front end engineering design (FEED) stage.
In the oil and gas sector, where normally production output and hence revenue fall toward the end of field life, it is even more important that end of lifecycle costs are minimised to remain viable and profitable. Generally, the older equipment or plant gets, the more costly it is to maintain. So, if it is the cheapest capital expenditure (CAPEX) option from the outset, the odds are that maintenance costs are likely to increase and operational field life may be shortened. Building TCO into buying processes can have a dramatic effect on the bottom line as it puts the focus on the correct financial measurements and helps procurement personnel determine where the real value can be delivered.
At the Aberdeen Group’s 2012 Chief Procurement Officers’ summit, total cost of ownership and the role procurement should play in engaging suppliers in continuous improvement cost reduction programmes was a key topic, indicating the growing awareness and importance of TCO. It was pointed out
Figure 1. Total cost of ownership.
52 World Pipelines | JULY 2013

Continuous analyzer performance verification is now as easy as:
OneTwo
Only AMETEK Model 5100 Series analyzers have a built-in sealed reference cell for continuous on-line verification and laser line-lockfunction. Each and every second, analyzer response is compared tothe value of the analyte concentration in the sealed reference cell. Soyou know the analyzer is operating reliably.
Model 5100 analyzers are based on Tunable Diode Laser AbsorptionSpectroscopy (TDLAS), which ensures high specificity, dramatic sensitivity, andextremely fast response times. The analyzers are available in both single and multipleanalyte configurations with single or dual cells permitting wide measurement ranges.And they are available for dual stream analysis where cost effectiveness is important.Plus, there’s a new compact portable unit that’s ideal for field spot checks.
AMETEK designs better solutions to your on-line analyzer requirements and wemake the choice as easy as 1, 2, 3.
Three
www.ametekpi.com
© 2013 AMETEK Inc., All rights reserved

that a 5% annual total cost reduction programme is 2.5 times more valuable than a 5% price reduction over a five year period. This is because price reductions are one time ‘benefits’ that only last for a set time period, and the savings are assumed to drop to the bottom line, whereas TCO is ongoing, incremental and sustainable and does drop to the bottom line. TCO is the financial measurement of lifecycle management.
Quantifying cost reductionsEvery company wants to reduce costs. But it is necessary to have the tools to quantify it; a process to find it; and the people, products and services to realise it. SKF has applied the principles of lifecycle management (LCM), and developed TCO tools for use in its own operations to drive manufacturing and operating efficiencies. It is recognised as a company that has developed processes and tools that help it quantify in financial terms the benefits of employing LCM.
SKF has served a multitude of industries for more than 100 years and has unique knowledge in rotating machines, machine components and industrial processes and is backed by expertise in sealing solutions, lubrication systems, linear motion, machinery maintenance and condition monitoring, mechatronics (the combination of electronics with mechanical systems) and services. The company is increasingly combining these platforms to deliver real world solutions and services that can help maximise performance over the entire lifecycle of oil and gas assets and make companies more profitable. SKF’s in-depth knowledge of machines, including failure mechanisms, means that at the design phase, the company can select the best solution for a particular application and can support improvements to future designs of existing equipment.
Through the SKF Documented Solutions Programme (DSP), the company has been able to help customers predict and measure the actual annual net savings they could achieve by using its products and services. The programme helps to accurately measure the total cost of ownership as well as identify total cost reductions in areas such as energy use, lubrication, warranty costs, manpower, machine life, reliability, output and quality, or 358 other variables. By March 2013, SKF had delivered over US$ 3.5 billion in customer savings over a 10 year period. These savings were calculated from over 39 700 customer cases across many industries where the company provided knowledge and solutions.
SKF DSP is supported by a web-based software tool that calculates the expected and actual value of a solution in a particular application. It can be related to a host of different types of machines from gearboxes, pumps, motors and fans to industry specific machinery such as wind turbines, cranes or material handling equipment. The programme enables customers to see how they can benefit from the products, solutions and services across SKF’s range of core technology platforms.
The company’s approach is to work closely with its customers, whether it is OEMs providing equipment to the oil and gas sector or the operators themselves to bring benefits throughout the lifecycle. It is not simply about delivering a quality product, but also offering technical support on
installation, maintenance, training and better understanding and controlling the operating environment. These services are delivered in a number of ways such as through the growing network of SKF Solution Factory, Industry Service Centres and via a dedicated entity called SKF Reliability Systems. It offers highly effective methods to help organisations reduce total machine related costs, enhance productivity and strengthen profitability.
As an example, by designing sensors and monitoring electronics into the equipment from conception, rather than considering this as an aftermarket issue, maintenance activities can be planned which will maximise the life and reduce the total cost of the asset. Often, condition monitoring devices are retrofitted by the end user after a failure has occurred to reduce the risk of repeat failures, while building condition monitoring into the original product could have increased reliability from the outset. One trend in industry is that OEMs are being asked by operators to manage equipment assets beyond the warranty period through maintenance contracts. This is driving OEMs to consider long-term lifecycle costs of their own products. Forward thinking OEMs are starting to see the value of selling on TCO rather than price.
Tangible benefitsOne North Sea customer was able to reduce annual maintenance costs by 20% after SKF carried out a maintenance strategy review. A Canadian customer was able to extend maintenance intervals from three months to three years by installing SKF’s ‘sour gas’ bearings in a gas compressor. The installation of SKF magnetic bearings in turbo expanders at a Norwegian company achieved a reliability rating of 99.6% and significantly reduced maintenance costs. In another application on an ageing platform, the recommendation to replace several reciprocating compressors with a single screw compressor resulted in the reduction of failures, less maintenance and greater reliability and availability. Other solutions that have reduced TCO involved specialised bearings for rig surface equipment, sealed pressure-compensated bearing units for downhole drilling and production environments and condition monitoring, consultancy and reliability services for both OEMs and operators. All of these examples drove hard dollars to their company’s bottom lines well into the millions of dollars.
A major benefit of true LCM, when used properly, is that lessons learned about the use of a machine or product is fed back into the improvement cycle so that the next generation incorporates that experience, thereby making additional contributions to TCO. As competition intensifies on a global scale, industrial managers are being challenged to produce more with less; less CAPEX investment, fewer people, and reduced maintenance budgets. Despite these challenges, taking TCO into consideration when purchasing and then efficiently managing existing equipment assets is a key way to maintain and increase profitability.
References1. Manufacturer Alliance for Productivity Improvements, ‘Approaches Towards
Purchasing on Total Cost of Ownership’ (2012).2. Accenture, ‘Equipment Today, Service Tomorrow – The Total Cost of Ownership
Vision’ (2001).
54 World Pipelines | JULY 2013
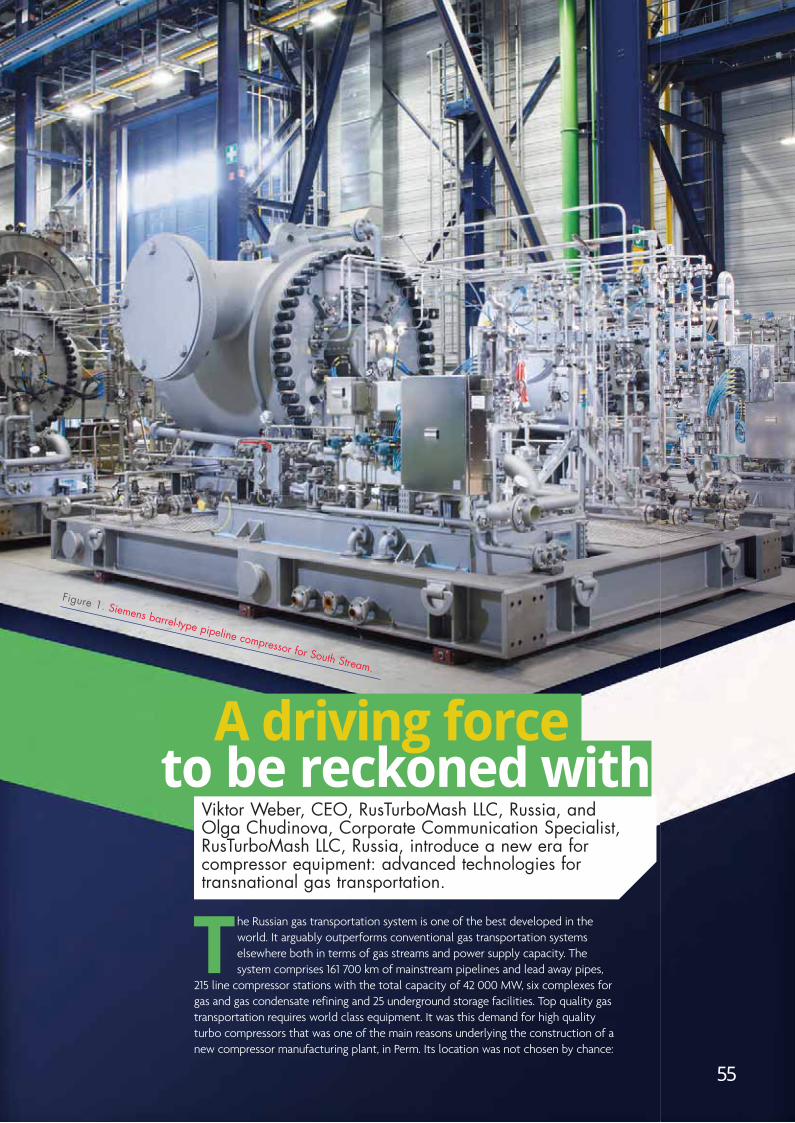
Viktor Weber, CEO, RusTurboMash LLC, Russia, and Olga Chudinova, Corporate Communication Specialist, RusTurboMash LLC, Russia, introduce a new era for compressor equipment: advanced technologies for transnational gas transportation.
The Russian gas transportation system is one of the best developed in the world. It arguably outperforms conventional gas transportation systems elsewhere both in terms of gas streams and power supply capacity. The system comprises 161 700 km of mainstream pipelines and lead away pipes,
215 line compressor stations with the total capacity of 42 000 MW, six complexes for gas and gas condensate refining and 25 underground storage facilities. Top quality gas transportation requires world class equipment. It was this demand for high quality turbo compressors that was one of the main reasons underlying the construction of a new compressor manufacturing plant, in Perm. Its location was not chosen by chance:
A driving force to be reckoned with
Figure 1. Siemens barrel-type pipeline compressor for South Stream.
55

the city of Perm lies on the border of two continents (Europe and Asia) and serves as a meeting point of gas transportation systems to European and Asian countries.
A joint venture for the futureSiemens AG signed a joint venture with ZAO Iskra-Avigaz for the manufacture of its line of pipeline centrifugal compressors in Russia in February 2010. This company, named LLC Russian Turbo Machinery or RusTurboMash (RTM) for short is based in Perm, Russia. The main activities of ZAO Iskra-Avigaz include engineering (customising), management of gas turbines package design; supervision, gas turbine installation and commissioning; management of gas turbine overhauling; supply chain management for components; service and spare parts delivery. The Perm manufacturing plant is a completely new facility with a focus on environmental friendly design, e.g. through utilisation of heat exchangers to reduce emissions, aeration of sewage water and ecologically benign chip processing systems; all that is built incorporates the latest eco-techniques.
Majority owned (51%) owned by Siemens, the new compressor manufacturing plant RTM is a vivid example of successful fusion of German technologies and a market oriented manufacturing approach. Compressors produced at RTM are made with Russian enthusiasm, commitments and strict requirements to the quality of the products.
The enterprise was established according to the greenfield concept, and has been operating since 2011. The spacious production area allowed installation of advanced, high precision equipment for compressor production. The production line is set up in accordance with eco-friendly principles. Applying sewage and gas treatment systems protects the atmosphere and environment from pollution, while implementation of other latest technologies (such as Milkrun, Kanban, and Five S) ensures that production is lean.
The total amount of investment has reached some e60 million.
The manufacturing programme encompasses the Siemens state-of-the-art pipeline compressor line, with power ratings from 6.3 - 32 MW. Besides manufacturing of the whole compressor, packaging of the compressor unit will be conducted in-house, utilising components sourced from the local market to the greatest extent possible. Siemens localises 100% of the respective compressor technology based on a step-by-step approach. Engineering activities are foreseen for technology adaptation and customer order engineering in a first step.
Practically all pipeline compressors manufactured in Perm will be driven by gas turbines, as most of the compressor stations of the Gazprom pipeline network are equipped with gas turbine-driven pipeline compressors and Gazprom will be the main customer for RTM.
Siemens has already transferred its most advanced technologies for compressor production to the new enterprise. As a result, the company’s products are high in service efficiency and reliability, with an operating life in excess of 30 years.
RTM compressors have high efficiency and a wide range of technical characteristics which are achieved thanks to the advanced 3D bundle and rotor designing methods. Only high tensile corrosion-proof materials and high quality components are used. Due to the unified design for the compressors, their production cycle lasts from 8 - 12 months
RTM compressors are assembled on a separate base frame, equipped with cable and pipeline connections and fully tested together with all package elements. One of the main competitive advantages is the inclusion in the scope of supply of oil system elements together with seal gas panels.
Compressors for South StreamIn 2005 Gazprom OJSC started the construction of the Nord Stream gas transportation system from Russia to the West European countries across the Baltic Sea. The remarkable feature of the gas pipeline is the fact that there are no transit countries on its way, minimising gas transportation risks and costs, while increasing the safety of gas export.
In September 2011, Nord Stream started supplying gas via Vyborg, and the corresponding gas supply via South Stream is planned to start in December 2015, supplying gas directly from the producer to the supplier. The South Stream pipeline will transport around 63 billion m3/yr of gas. The total length of the pipeline system reaches 900 km offshore and 2700 km onshore, while the maximum burial depth of the pipeline on the Black Sea seabed is 2250 m. According to the experts’ opinion, the mainstream gas pipeline will transport some 35% of the Russian gas to European countries.
The project is aimed at strengthening the security of energy supply in Europe within the frames of the diversification strategy of the gas supply routes to the EU. Having connected gas suppliers with the consumers, the South Stream gas pipeline will significantly improve the security of the energy supply of all European countries.
RTM will provide innovative solutions for the South Stream compressor stations and will act as a supplier of centrifugal gas compressors for four compressor stations along the gas pipeline.
The supply contract includes 14 RTM compressors to be installed at the main compressor station of the South Stream under the name ‘Russkaya’, and a further 22 compressors will be installed at ‘Shakhtinskaya’, ‘Korenovskaya’ and ‘Kazachya’. The time frames for completing the individual projects vary from 2013 - 2019.
Compressor station (CS) ‘Russkaya’ will be the most advanced CS in the world in terms of designed capacity (448 MW) and will be equipped with 32 MW capacity compressors (outlet pressure 28 MPa). Characterised by high efficiency and low emission levels, they are intended for use
Figure 2. Compressor of RTM, modular configuration delivery.
56 World Pipelines | JULY 2013
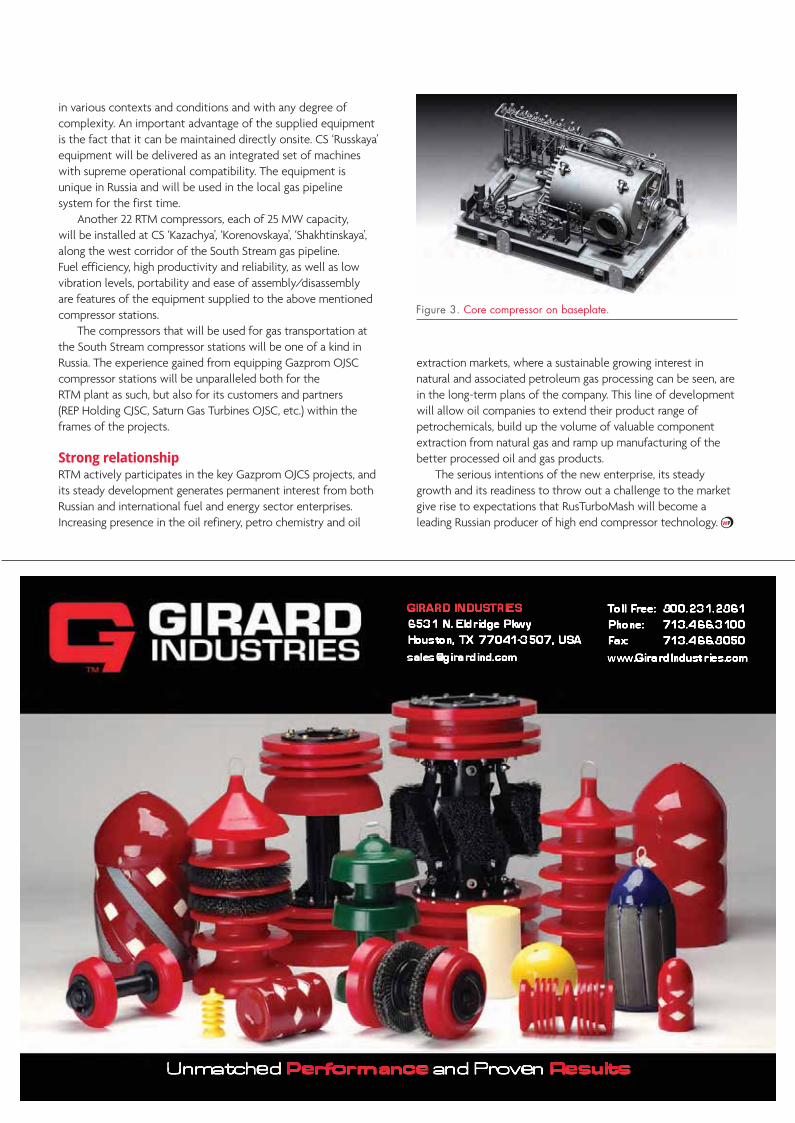
in various contexts and conditions and with any degree of complexity. An important advantage of the supplied equipment is the fact that it can be maintained directly onsite. CS ‘Russkaya’ equipment will be delivered as an integrated set of machines with supreme operational compatibility. The equipment is unique in Russia and will be used in the local gas pipeline system for the first time.
Another 22 RTM compressors, each of 25 MW capacity, will be installed at CS ‘Kazachya’, ‘Korenovskaya’, ‘Shakhtinskaya’, along the west corridor of the South Stream gas pipeline. Fuel efficiency, high productivity and reliability, as well as low vibration levels, portability and ease of assembly/disassembly are features of the equipment supplied to the above mentioned compressor stations.
The compressors that will be used for gas transportation at the South Stream compressor stations will be one of a kind in Russia. The experience gained from equipping Gazprom OJSC compressor stations will be unparalleled both for the RTM plant as such, but also for its customers and partners (REP Holding CJSC, Saturn Gas Turbines OJSC, etc.) within the frames of the projects.
Strong relationship RTM actively participates in the key Gazprom OJCS projects, and its steady development generates permanent interest from both Russian and international fuel and energy sector enterprises. Increasing presence in the oil refinery, petro chemistry and oil
extraction markets, where a sustainable growing interest in natural and associated petroleum gas processing can be seen, are in the long-term plans of the company. This line of development will allow oil companies to extend their product range of petrochemicals, build up the volume of valuable component extraction from natural gas and ramp up manufacturing of the better processed oil and gas products.
The serious intentions of the new enterprise, its steady growth and its readiness to throw out a challenge to the market give rise to expectations that RusTurboMash will become a leading Russian producer of high end compressor technology.
Figure 3. Core compressor on baseplate.

@energy_global Energy Global Energy Global
follow us on twitter
likeus on facebook
join us on LinkedIn™
Join us!

Since 1953, Midwestern has provided the pipeline industry with reliable, safe, and cost-effective hydraulic winch-operated sidebooms. The sidebooms are on construction sites throughout the world and on every shale play in North America. Midwestern is recognised for its
development, engineering and manufacturing of quality products and its commitment to collaborating with customers to meet their specific needs. The company’s history is one of innovative product designs that draw upon decades of experience and success.
The company offers 21 different models of sidebooms for an array of platforms, including oval and high-track dozers, wheel loaders, and backhoe loaders. Covering lifting capacities from 10 000 - 230 000 lb (4536 - 104 326 kg), the sidebooms can be fitted on new, refurbished, or used machines, including Caterpillar, Komatsu, John Deere, New Holland, Liebherr, and Case. The sidebooms
Adhering to the principles of its founder has helped a leading sideboom manufacturer retain its position as invaluable support for the pipeline construction industry. Laura Golden Shannon, Midwestern, USA, explains.
Figure 1. Armon H. Bost operated a Caterpillar Twenty-Two mechanical pipelayer in Chicago, Illinois circa 1934.
59

handle pipe ranging in size from 4 - 56 in. (100 - 1400 mm), a portfolio constituting one of the most extensive sideboom product lines in the industry.
Midwestern pioneered the conversion of a Caterpillar mechanical boom into a hydraulic pipelayer. Today, the company manufactures sidebooms for tractors, old and new, including the latest models, such as Caterpillar’s D6T LGP.
Brief historyMidwestern, located in Tulsa, Oklahoma, USA, is a family owned company started in 1948 by Armon H. Bost and partners. Its manufacturing and products divisions were incorporated in 1956. After serving in World War II, Colonel Bost travelled from Oklahoma to Chicago, Illinois, to find work on a pipeline. He returned to Oklahoma with his family to embark on entrepreneurial efforts in the construction and pipeline equipment business. Due to his pipeline work experience, Bost recognised the need for safe, efficient, and operator-friendly pipelayers. With a
vision, Bost pulled together a mechanic, a welder, and an aviation engineer to design and produce the first hydraulic sideboom for an Oliver OC3 tractor. These first ‘baby boomers’ were quickly developed for the construction and pipeline industries with the ability to lift 10 000 - 30 000 lb (4536 - 13 608 kg), which led to Butch Graham of Ritchie Brothers calling Bost “the father of the modern hydraulic sideboom.” The hydraulic system was quickly adopted due to the reduction in time for operator training, the increase in operator safety, and enhanced accuracy in the laying of the pipe. Midwestern experienced early success due to the innovation of the design, improved safety, and durable products.
As a pioneer in the pipeline industry, Bost helped establish the Pipe Line Contractors Association (PLCA) in 1948. Bost was a founding member and the first Associate Director of the Distribution Contractors Association (DCA) and he played significant roles in the early years of the American Pipeline Contractors Association (APCA). Midwestern was an early member of the International Pipe Line & Offshore Contractors Association (IPLOCA), which offered abundant access to international business contacts and opportunities. In early 1962, Midwestern turned its focus to the international export business; that same year the company shipped products to South America, Europe, Asia, Africa and Australia.
Bost travelled extensively throughout the world, calling on contractors wherever pipelayers were needed. The contacts he made during his travels turned into trusted and loyal business relationships. Throughout the years, Midwestern’s focus has emulated Bost’s by pursuing and maintaining strong business relationships. Today, contacts made domestically and internationally are still viable due to the integrity of the company, mutual respect, collaborative relationships, and product reliability.
With a strong domestic and international customer base, Midwestern continued to advance its product line. In the 1970s, the company contracted with John Deere to design and manufacture sidebooms for all of their tractor models starting with crawlers (350 and 450 series) and articulated loaders (544 and 644 series). Many of these tractors were small and mid-sized machines with lifts ranging from 10 000 - 40 000 lb (4536 - 18 144 kg). This partnership affirmed the integrity of Midwestern products and greatly increased its manufacturing volume.
In 2007, a 100 000 lb (45 359 kg) lift M572CH sideboom was designed for the John Deere 850J LGP. The combination of the sideboom and
Figure 2. The M572CXL on a John Deere 850K WLT has a 90 000 lb (40 824 kg) lift capacity.
Figure 3. The M572CH on a Caterpillar D6T LGP working on a North American shale play in Texas.
60 World Pipelines | JULY 2013

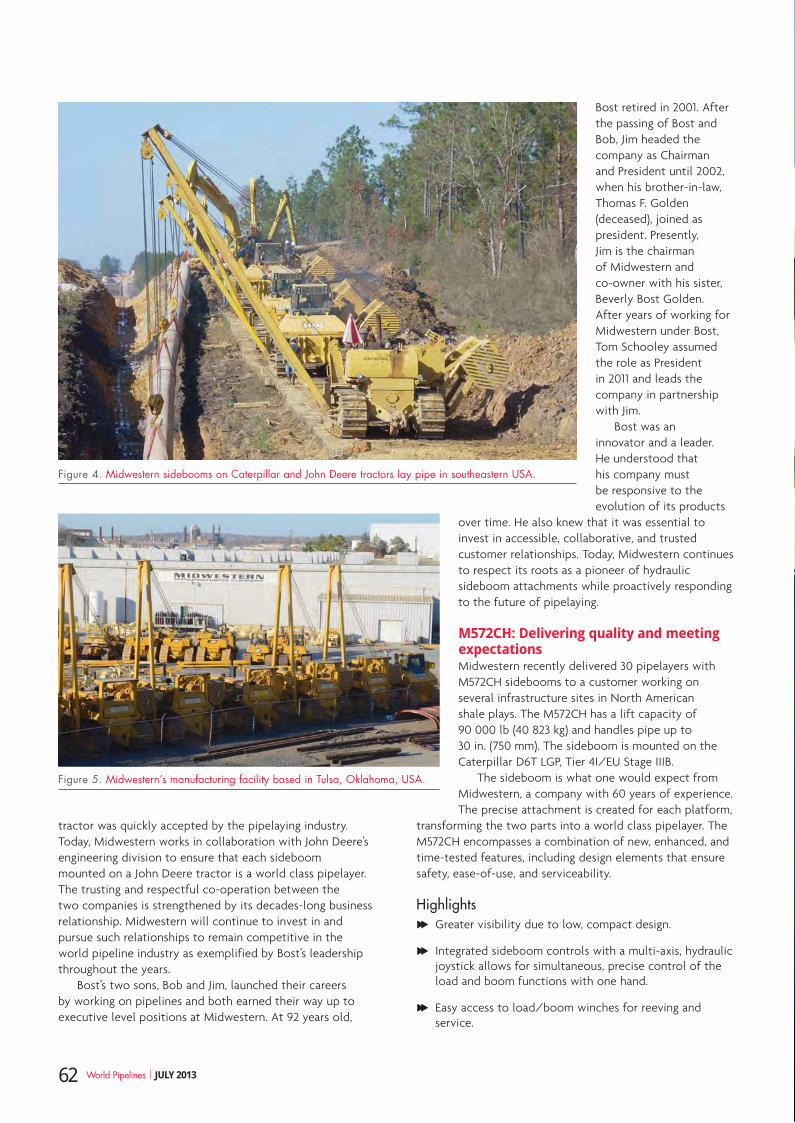
tractor was quickly accepted by the pipelaying industry. Today, Midwestern works in collaboration with John Deere’s engineering division to ensure that each sideboom mounted on a John Deere tractor is a world class pipelayer. The trusting and respectful co-operation between the two companies is strengthened by its decades-long business relationship. Midwestern will continue to invest in and pursue such relationships to remain competitive in the world pipeline industry as exemplified by Bost’s leadership throughout the years.
Bost’s two sons, Bob and Jim, launched their careers by working on pipelines and both earned their way up to executive level positions at Midwestern. At 92 years old,
Bost retired in 2001. After the passing of Bost and Bob, Jim headed the company as Chairman and President until 2002, when his brother-in-law, Thomas F. Golden (deceased), joined as president. Presently, Jim is the chairman of Midwestern and co-owner with his sister, Beverly Bost Golden. After years of working for Midwestern under Bost, Tom Schooley assumed the role as President in 2011 and leads the company in partnership with Jim.
Bost was an innovator and a leader. He understood that his company must be responsive to the evolution of its products
over time. He also knew that it was essential to invest in accessible, collaborative, and trusted customer relationships. Today, Midwestern continues to respect its roots as a pioneer of hydraulic sideboom attachments while proactively responding to the future of pipelaying.
M572CH: Delivering quality and meeting expectationsMidwestern recently delivered 30 pipelayers with M572CH sidebooms to a customer working on several infrastructure sites in North American shale plays. The M572CH has a lift capacity of 90 000 lb (40 823 kg) and handles pipe up to 30 in. (750 mm). The sideboom is mounted on the Caterpillar D6T LGP, Tier 4I/EU Stage IIIB.
The sideboom is what one would expect from Midwestern, a company with 60 years of experience. The precise attachment is created for each platform,
transforming the two parts into a world class pipelayer. The M572CH encompasses a combination of new, enhanced, and time-tested features, including design elements that ensure safety, ease-of-use, and serviceability.
Highlights F Greater visibility due to low, compact design.
F Integrated sideboom controls with a multi-axis, hydraulic joystick allows for simultaneous, precise control of the load and boom functions with one hand.
F Easy access to load/boom winches for reeving and service.
Figure 4. Midwestern sidebooms on Caterpillar and John Deere tractors lay pipe in southeastern USA.
Figure 5. Midwestern’s manufacturing facility based in Tulsa, Oklahoma, USA.
62 World Pipelines | JULY 2013

Leaders in Corrosion Prevention& Sealing Technology
Leaders in Corrosion Prevention& Sealing Technology
Winn & Coales International Ltd.
Denso, Protal, SeaShield and Archco-Rigidon products are available from Denso subsidary companies located in the following countries:
Petrolatum Systems Bitumen & Butyl Tapes Pipeline Liquid Coatings Tank Linings Pile Protection
www.densoaustralia.com.auAustralia New ZealandUSA Canada
www.densona.comUnited Kingdomwww.denso.net
Republic of South Africawww.denso.co.za

F Employs new compact designed blocks for high-capacity rating and greater efficiency.
F When loaded for transport, the pipelayer is under 12 ft (3.65 m) in width, eliminating any need for escort when transporting in the US.
F Optional high capacity rollover protective structure (ROPS), developed by Canada-based Weldco-Beales, rated for 81 000 lb (36 741 kg) machine weight.
Safety F A hydraulically operated, four-bar linkage counterweight
system delivers maximum stability and lifting capability to provide balanced weight distribution.
F A hydraulic boom stop valve prevents component damage and provides greater protection for operator.
F Integrated ladder and platform structure allows for safe and easy ingress/egress.
F Emergency free-fall function on the load winch allows operator to drop load quickly.
F Optional load monitoring, anti-two-block, and high voltage power line warning systems available.
Ease-of-use and serviceability F Single lever, hydraulic remote control valves are used for
counterweight and two speed functions.
F Replacement parts are readily available and products are ‘service friendly’ for operators and the mechanics working on the machine.
F The controls are ergonomic, precise and require minimal operator training.
F To minimise downtime due to maintenance and repairs, the M572CH employs the tractor’s existing hydraulic pump, filter and reservoir.
F A tubular A-frame boom is equipped with quick release hinge pins for easy boom removal and maintenance.
Options F Enclosed cab.
F Various booms lengths.
F High capacity rollover protective structure (ROPS).
F Load monitoring.
F Anti-two-block.
F High voltage power line warning systems.
The M572CH is an example of how the dedication, talent and experience of Midwestern employees have been
combined with input from the customer to produce a world class pipelayer. The sideboom responds to the new generation of platforms, such as the Caterpillar D6T LGP, by integrating technologically advanced engineering, decades of experience, and a design concept with 60 years of proven success.
Serving the pipeline construction industryEvery Midwestern sideboom is designed, engineered, manufactured, and tested specifically for each platform. The sidebooms serve the pipeline construction industry by enabling the conversion of the customer’s choice of a new, used, or refurbished tractor into a pipelayer, taking advantage of the safety of hydraulic control. This allows contractors the ability to have more flexibility with their fleet, which impacts cost, time, and efficiency.
Midwestern’s products are proven to be reliable and dependable. A reoccurring theme from contractors and operators alike is that these products perform with excellence and reliability. Chad DeVore, Superintendent of US-based Two Rivers Pipeline Construction in Texas, said of Midwestern sidebooms: “They are durable and dependable. They are well designed and easy to use, which means more production. Lost time means lost money. Dependability is essential.”
Midwestern’s goal is to exceed its customer’s expectations. Its employees have consistently invested in relationships with pipeline owners, contractors, fleet owners, dealers, and associations. Some of these relationships are decades old, attesting to the commitment that the company has to its customers on specific modifications, delivery, and in-field service. New customers are appreciative of the accessible, attentive and collaborative customer service on offer.
The company has an extensive product line, including hydraulic conversion kits for mechanical pipelayers, hydrostatic fill and test units from 350 - 1000 ft (106 - 304 m) of head pressure, power-transmission line sagging units, rear-mounted hydraulic recovery winches and sidebooms for railroad applications. Midwestern’s pipeline products division carries an extensive line of pipe coatings, rock shields, anodes, and insulators.
ConclusionIn 1952, Bost said: “We must have initiative. We must always use our ingenuity if we want to remain a leader.” By adhering to its founding principles, including a passion for quality products, a time-tested design, a commitment to safety, and responsive customer service, Midwestern has solidified its position as a leading member of the worldwide pipeline industry. As globalisation, technology, and regulations impact the future of the pipeline industry, Midwestern will continue to expand its role as an industry leader by investing in technological innovation and customer relationships to ensure each product meets, or exceeds, the needs of each project.
64 World Pipelines | JULY 2013

Detection decisionsW
hen choosing a pipeline leak detection system (LDS), pipeline operators are faced with a choice of hundreds of systems using many different physical principles. Although this may initially
seem like a bewildering choice, the particular pipeline topology and current situation may drastically reduce the number of systems that can be applied. If, for example, the pipeline in question is operational and has long subsea sections it will be impossible to add new equipment, which will rule out the use of many of the systems currently available. Alternatively, the importance of leak detection may be much greater for a sour gas pipeline running through a built up area than a water pipeline running through a remote area. When considering a leak detection system, the route of the pipeline, the fluid it transports and its age are key factors.
In a 2012 Leak Detection Study1, the US Department of Transportation asserts that the public is the biggest source of leaks found in the US, which would make the public the single greatest method for leak detection. Leaks are also found by pipeline workers and other periodic survey methods such as smart pig runs or helicopter fly-overs. By the time these methods detect leaks, the leak has most likely been present for a period of time and the environmental damage is already significant. Therefore, it is important to have a leak detection system that permanently monitors the pipeline and of those, there are two main types, external and internal.
External leak detection systems normally directly detect the fluid once it is in the environment and the most common examples of these systems are fibre optic cables, vapour sensing tubes, liquid sensing cables, acoustic sensors, vapour sensors and infrared cameras. These methods require the leaked fluid to come into direct contact with the device or for it to be in the field of vision of the device. Fields of vision tend to be rather narrow and a lot of fluid would have to be on the ground for it to reach the sensor. To detect leaks on a long pipeline it requires a lot of hardware, which makes external options expensive, difficult to retrofit and impossible to fit in certain
Adrian Kane, ATMOS International, UK, studies various pipeline leak detection systems and their differences.
65
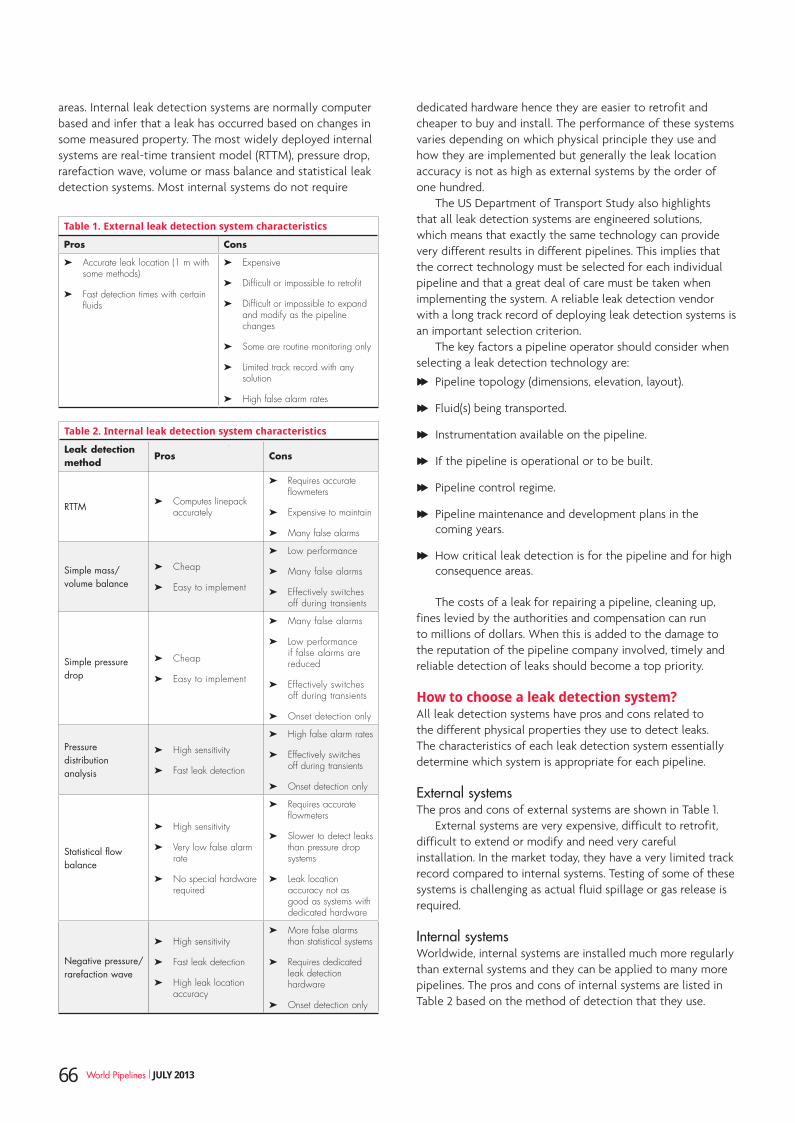
areas. Internal leak detection systems are normally computer based and infer that a leak has occurred based on changes in some measured property. The most widely deployed internal systems are real-time transient model (RTTM), pressure drop, rarefaction wave, volume or mass balance and statistical leak detection systems. Most internal systems do not require
dedicated hardware hence they are easier to retrofit and cheaper to buy and install. The performance of these systems varies depending on which physical principle they use and how they are implemented but generally the leak location accuracy is not as high as external systems by the order of one hundred.
The US Department of Transport Study also highlights that all leak detection systems are engineered solutions, which means that exactly the same technology can provide very different results in different pipelines. This implies that the correct technology must be selected for each individual pipeline and that a great deal of care must be taken when implementing the system. A reliable leak detection vendor with a long track record of deploying leak detection systems is an important selection criterion.
The key factors a pipeline operator should consider when selecting a leak detection technology are:
F Pipeline topology (dimensions, elevation, layout).
F Fluid(s) being transported.
F Instrumentation available on the pipeline.
F If the pipeline is operational or to be built.
F Pipeline control regime.
F Pipeline maintenance and development plans in the coming years.
F How critical leak detection is for the pipeline and for high consequence areas.
The costs of a leak for repairing a pipeline, cleaning up, fines levied by the authorities and compensation can run to millions of dollars. When this is added to the damage to the reputation of the pipeline company involved, timely and reliable detection of leaks should become a top priority.
How to choose a leak detection system?All leak detection systems have pros and cons related to the different physical properties they use to detect leaks. The characteristics of each leak detection system essentially determine which system is appropriate for each pipeline.
External systemsThe pros and cons of external systems are shown in Table 1.
External systems are very expensive, difficult to retrofit, difficult to extend or modify and need very careful installation. In the market today, they have a very limited track record compared to internal systems. Testing of some of these systems is challenging as actual fluid spillage or gas release is required.
Internal systemsWorldwide, internal systems are installed much more regularly than external systems and they can be applied to many more pipelines. The pros and cons of internal systems are listed in Table 2 based on the method of detection that they use.
Table 1. External leak detection system characteristics
Pros Cons
Accurate leak location (1 m with some methods)
Fast detection times with certain fluids
Expensive
Difficult or impossible to retrofit
Difficult or impossible to expand and modify as the pipeline changes
Some are routine monitoring only
Limited track record with any solution
High false alarm rates
Table 2. Internal leak detection system characteristics
Leak detection method
Pros Cons
RTTM Computes linepack accurately
Requires accurate flowmeters
Expensive to maintain
Many false alarms
Simple mass/volume balance
Cheap
Easy to implement
Low performance
Many false alarms
Effectively switches off during transients
Simple pressure drop
Cheap
Easy to implement
Many false alarms
Low performance if false alarms are reduced
Effectively switches off during transients
Onset detection only
Pressure distribution analysis
High sensitivity
Fast leak detection
High false alarm rates
Effectively switches off during transients
Onset detection only
Statistical flow balance
High sensitivity
Very low false alarm rate
No special hardware required
Requires accurate flowmeters
Slower to detect leaks than pressure drop systems
Leak location accuracy not as good as systems with dedicated hardware
Negative pressure/rarefaction wave
High sensitivity
Fast leak detection
High leak location accuracy
More false alarms than statistical systems
Requires dedicated leak detection hardware
Onset detection only
66 World Pipelines | JULY 2013
Relevance of pipeline characteristics when choosing a leak detection systemTable 2 highlights some key factors that influence the choice of a leak detection system.
Systems that rely on having high quality flowmeters at all ingress and egress points have the disadvantage that the flowmeters are expensive to buy and maintain. In addition, the system’s sensitivity can be limited by poorly performing flowmeters.
RTTM systems rely on comparing parameters calculated by a hydraulic simulator with measured variables and analysing the results for a leak pattern. For this to work, the hydraulic model must be extremely well tuned. In real life, pipeline parameters change continuously and as such the model requires almost continual tuning throughout its lifespan. This could be extremely expensive unless the model is deployed for other applications as well.
Large gas networks often use linepack to deliver at maximum demand while keeping the supply as constant as possible. As a result, changes in linepack are as important as the flowrates into and out of the pipeline. RTTMs can accurately calculate the linepack and tend to be the best type of system for these networks.
The more simple pressure drop and volume/mass balance systems often effectively turn themselves off during transients.
Many negative pressure/rarefaction wave systems can only detect the onset of a leak and, therefore, if they miss a leak they will never get it. In addition, should a small leak occur at a time when the pressure is increasing in the pipeline, some of these systems might miss the leak.
Most negative pressure/rarefaction wave systems
cannot work in gas due to the transient nature of gas pipelines.
Expected performance of leak detection systemsWith leak detection systems there are trade-offs between many of the characteristics. For example, highly accurate systems may have many false alarms, which make them less reliable. It is always a case of finding the right system for each pipeline. The relative sensitivity and reliability of each type of
HAND HELD RECEIVER & WAND
PIG TRACKING
INSIDE & OUTFor over a decade SPY Pig Tracking Equipment has served the pipeline industry reliably and
consistently. With a choice of four transmitters, detection options and tracking accessories contact the company who can handle your pig tracking requirements inside and out!

system shown in Figure 1 while the leak location and costs are shown in Figure 2.
It should be noted that the detection time for fibre optic systems is usually less than 60 seconds after the fluid reaches the fibre, although this could be many hours after the leak starts depending on the pipeline and implementation. The detection time displayed for the other systems is the time after the leak starts.
Products to suit every pipeline ATMOS International recognises that one size does not fit all when it comes to leak detection and as a result provides multiple leak detection products to suit every pipeline (Table 3).
ATMOS Pipe was the first product brought to market and it remains one of the most reliable systems available today. Pipeline operators always want faster and more accurate leak detection systems and some operators have pipelines without flowmeters. At the request of customers, ATMOS International has developed ATMOS Wave, which detects the rarefaction wave caused by a leak using pressure sensors only. This will detect all leaks within 2 - 8 minutes depending on the
distance between sensors and has a leak location accuracy of a few hundred meters. ATMOS Wave has successfully undertaken real leak trials by many customers in different countries such as the USA, the UK, Taiwan, China, Norway, Denmark, the Netherlands, Indonesia, Chile and Azerbaijan. ATMOS Wave has detected leaks as small as 0.1% of flow with the pipeline running and 30 ppm under shut-in conditions.
In addition to developing new products, ATMOS International has been improving its existing systems. Some of the algorithms developed for ATMOS Wave have been added to the latest version of ATMOS Pipe (V7) and this has improved its performance. ATMOS Pipe Versions 6 and 7 were tested on a 27 km, 24 in. liquid pipeline and smallest leak detectable was 0.25% of the flowrate. Version 6 detected this 0.25% leak in 41:19 minutes and Version 7 detected the same leak in 5:34 minutes. The leak location accuracy for larger leaks was 11% with Version 6 and with Version 7 it was 0.2%, a mere 50 m location error.
All of the leak detection systems provided by ATMOS are part of one product suite, which allows any of the technologies to be deployed. By implementing more than one leak detection method on each pipeline ATMOS can provide the most optimum solution for that pipeline.
References1. Dr. Shaw, D., Dr. Phillips, M., Baker, R., Munoz, E., Rehman, H., Gibson, C. and
Mayernik, C., US Department of Transportation, Pipeline and Hazardous Materials Safety Administration, Final Report No. 12-173, ‘Leak Detection Study – DTPH56-11-D-000001’ (10th December 2012).
2. Dr Zhang, J., Hoffman, A., Murphy, K., Lewis, J. and Twomey, M., Pipeline Simulation Interest Group, PSIG 1303, ‘Review of Pipeline Leak Detection Technologies’ (17th April 2013).
Figure 3. Improvement in detection times with ATMOS Pipe V7 over V6.
Figure 1. Sensitivity (left) and reliability (right).
Figure 2. Location accuracy (left) and cost (right).
Table 3. ATMOS International leak detection systems
SystemDetection method
Normal application
ATMOS Pipe Statistical
Suitable for most pipelines that have reliable flow readings
Good sensitivity and accuracy and highly reliable
ATMOS WaveAdvanced rarefaction wave
Suitable for pipelines without reliable flow readings
Fast, highly sensitive leak detection with very accurate leak location (requires dedicated hardware)
ATMOS Wave Flow
Rarefaction wave and flow balance
Adds a flow balance solution to ATMOS Wave should the pipeline have flow readings
Has all the benefits of ATMOS Wave with increased reliability and ability to detect slowly developing leaks (requires dedicated hardware)
ATMOS MLDSReal-time transient model (RTTM)
Suitable for large gas networks where linepack is main parameter to consider from a leak detection perspective
Requires a hydraulic model
ATMOS Hydro Acoustic
Used during shut-in or hydrostatic testing to determine if there is a tiny leak or a theft below normal detection range
68 World Pipelines | JULY 2013
Devon Brendecke, Consulting Engineer, Quest Integrity Group, USA, looks at how ageing infrastructure integrity can be aided by new technology.
Damage mechanisms such as internal and external corrosion, dents and cracks can now be accurately quantified due to more advanced inline inspection (ILI) tools, which yield better data on pipeline condition. The drastic improvement in data quality and accompanying quantity drives the need for advanced assessment capabilities to leverage the improved data quality
and accuracy. The combination of better inspection data and superior assessment procedures is rapidly demonstrating the weaknesses in older procedures. Using these more advanced assessment technologies, which are validated and supported through extensive field research, operators can now assess defects in pipelines and determine fitness-for-service (FFS) quickly and confidently.
FFS assessments have become increasingly accepted across the pipeline industry over the past few years. FFS standard API 579/ASME FFS-1 (API 579-2007) provides guidelines for assessing types of damage affecting pipelines across all industries. Two common damage mechanisms are internal and external corrosion and cracks forming near welds, where residual stresses from the welding process have the potential to rapidly progress crack growth. FFS assessments are an alternative to costly repair or replacement.
Corrosion assessment applicationILI data, particularly ultrasonics (UT), radius and thickness readings, conveys a lot about the condition of a pipeline. Both wall loss due to corrosion and out of roundness due to external damage pose a risk to the integrity of a pipeline and must be assessed or repaired. Knowing the damage is present is the first step in remediation. Applying FFS rules to assess the damage as a second step can save enormous amounts of time and money in prioritising critical regions for digs and repairs.
UT data can quickly overwhelm an integrity engineer carrying out an assessment with a spreadsheet. There simply is not a practical way to leverage the full value of the ILI data in an assessment computed
69
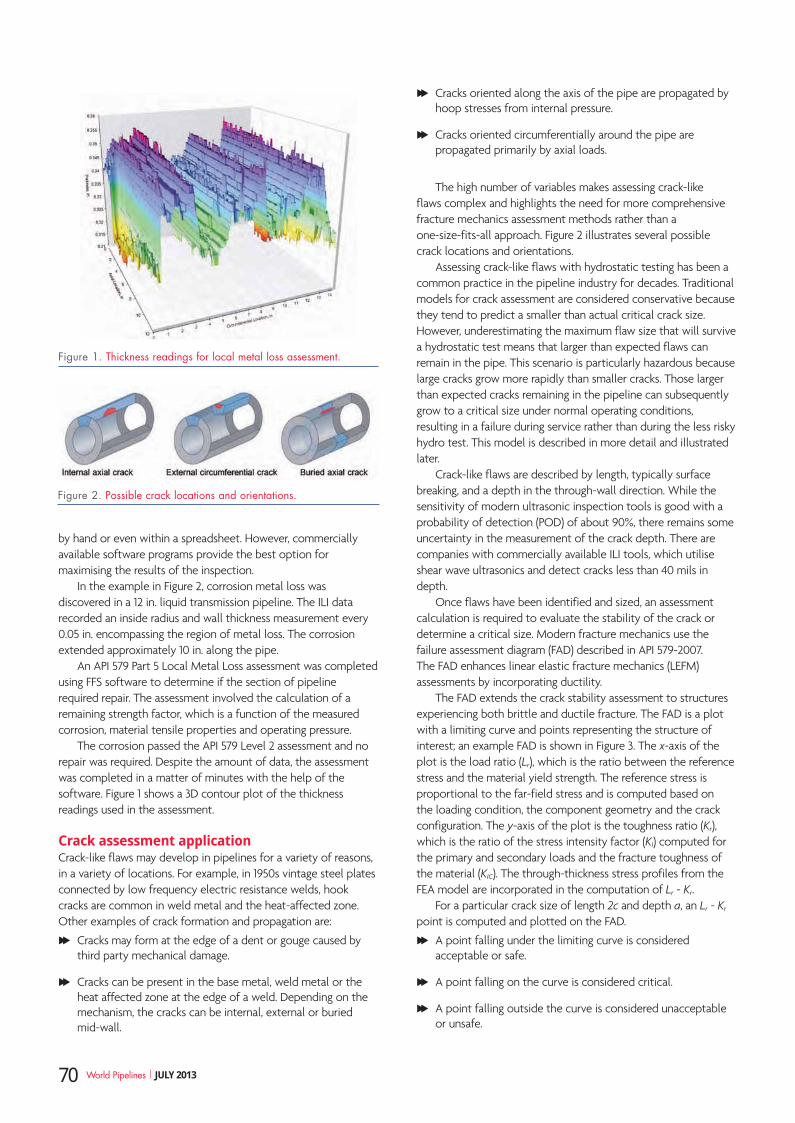
by hand or even within a spreadsheet. However, commercially available software programs provide the best option for maximising the results of the inspection.
In the example in Figure 2, corrosion metal loss was discovered in a 12 in. liquid transmission pipeline. The ILI data recorded an inside radius and wall thickness measurement every 0.05 in. encompassing the region of metal loss. The corrosion extended approximately 10 in. along the pipe.
An API 579 Part 5 Local Metal Loss assessment was completed using FFS software to determine if the section of pipeline required repair. The assessment involved the calculation of a remaining strength factor, which is a function of the measured corrosion, material tensile properties and operating pressure.
The corrosion passed the API 579 Level 2 assessment and no repair was required. Despite the amount of data, the assessment was completed in a matter of minutes with the help of the software. Figure 1 shows a 3D contour plot of the thickness readings used in the assessment.
Crack assessment applicationCrack-like flaws may develop in pipelines for a variety of reasons, in a variety of locations. For example, in 1950s vintage steel plates connected by low frequency electric resistance welds, hook cracks are common in weld metal and the heat-affected zone. Other examples of crack formation and propagation are:
F Cracks may form at the edge of a dent or gouge caused by third party mechanical damage.
F Cracks can be present in the base metal, weld metal or the heat affected zone at the edge of a weld. Depending on the mechanism, the cracks can be internal, external or buried mid-wall.
F Cracks oriented along the axis of the pipe are propagated by hoop stresses from internal pressure.
F Cracks oriented circumferentially around the pipe are propagated primarily by axial loads.
The high number of variables makes assessing crack-like flaws complex and highlights the need for more comprehensive fracture mechanics assessment methods rather than a one-size-fits-all approach. Figure 2 illustrates several possible crack locations and orientations.
Assessing crack-like flaws with hydrostatic testing has been a common practice in the pipeline industry for decades. Traditional models for crack assessment are considered conservative because they tend to predict a smaller than actual critical crack size. However, underestimating the maximum flaw size that will survive a hydrostatic test means that larger than expected flaws can remain in the pipe. This scenario is particularly hazardous because large cracks grow more rapidly than smaller cracks. Those larger than expected cracks remaining in the pipeline can subsequently grow to a critical size under normal operating conditions, resulting in a failure during service rather than during the less risky hydro test. This model is described in more detail and illustrated later.
Crack-like flaws are described by length, typically surface breaking, and a depth in the through-wall direction. While the sensitivity of modern ultrasonic inspection tools is good with a probability of detection (POD) of about 90%, there remains some uncertainty in the measurement of the crack depth. There are companies with commercially available ILI tools, which utilise shear wave ultrasonics and detect cracks less than 40 mils in depth.
Once flaws have been identified and sized, an assessment calculation is required to evaluate the stability of the crack or determine a critical size. Modern fracture mechanics use the failure assessment diagram (FAD) described in API 579-2007. The FAD enhances linear elastic fracture mechanics (LEFM) assessments by incorporating ductility.
The FAD extends the crack stability assessment to structures experiencing both brittle and ductile fracture. The FAD is a plot with a limiting curve and points representing the structure of interest; an example FAD is shown in Figure 3. The x-axis of the plot is the load ratio (Lr), which is the ratio between the reference stress and the material yield strength. The reference stress is proportional to the far-field stress and is computed based on the loading condition, the component geometry and the crack configuration. The y-axis of the plot is the toughness ratio (Kr), which is the ratio of the stress intensity factor (KI) computed for the primary and secondary loads and the fracture toughness of the material (KIC). The through-thickness stress profiles from the FEA model are incorporated in the computation of Lr - Kr.
For a particular crack size of length 2c and depth a, an Lr - Kr point is computed and plotted on the FAD.
F A point falling under the limiting curve is considered acceptable or safe.
F A point falling on the curve is considered critical.
F A point falling outside the curve is considered unacceptable or unsafe.
Figure 1. Thickness readings for local metal loss assessment.
Figure 2. Possible crack locations and orientations.
70 World Pipelines | JULY 2013
volvo construction equipment
Dedicated pipelayers,not just a pipe dream
Volvo Construction Equipment’s innovative pipelayers offer customers a competitive edge in the oil and gas industry. Boasting unique features, on a stable platform, these machines will lift your performance in the most demanding conditions. Featuring 360° swing capability for infinite pipe placement opportunities, a unique load management system, which allows operators to safely manage their load, and ease of transportation, these hard working machines will get the job done. With built in control, Volvo pipelayers are designed with tipping capacities from 50 - 110 tons. View the whole worksite,as well as into the trench, from our industry-leading, elevated cab for superior visibility and safety. Lift your productivity with Volvo pipelayers. Volvo pipelayers – a revolution. www.volvoce.com

F A point lying towards the right end of the diagram fails due to plastic collapse.
F A point lying towards the upper left corner of the diagram fails due to brittle fracture.
Assessing one or two flaws is reasonable when carried out within a spreadsheet. The calculations are not overly complicated and many of the critical parameters are publicly available. However, assessing hundreds of flaws along miles of pipelines is a different story. It can take weeks of an engineer’s time to create a spreadsheet tool that would be mildly reusable and it becomes obvious very quickly that the amount of data collected with an ILI tool requires automated assessment.
Commercially available software programs are capable of assessing hundreds of flaws at once as well as computing a range of critical flaw sizes. An automation tool such as this allows the computation of the ‘what if’ conditions in a matter of minutes. A user can not only assess hundreds of flaws along an entire pipeline at once, but the operating parameters, pipe sizes and material properties may all be varied for a probabilistic approach. A critical flaw size curve, describing the entire range of critical crack sizes for a particular set of operating conditions, can be completed as quickly as a spreadsheet or more manual-based assessment of a single flaw.
Automated flaw assessments can also be helpful in predicting the remaining life of a crack or determining the initial size of an existing flaw. Pipelines are typically subject to pressure cycles during normal operation and fatigue crack growth occurs during these cycles. Therefore, this type of calculation can prove to be much more cost-effective and accurate than periodic hydrostatic testing in predicting the remaining life of a pipeline.
ConclusionThe partnering of advanced inspection technologies with innovative assessment methods makes solutions to complex problems substantially more accessible. Costly repairs to pipelines may be averted or delayed immediately following inline inspection and rapid completion of a fitness-for-service assessment. Internal or external corrosion can be promptly assessed for reliability and automated crack assessment tools provide a probabilistic type solution to all potential cracks along an entire pipeline.
Figure 3. Example of the FAD method of assessing the stability of crack-like flaws.
CD42STS SubseaPig Locator
CD47 Benchmarker
CD43 GeoEar
CD52 Non-Intrusive Passage Detector
CDI Transmitters
CD42 Pig Detector
Locate stationary pigs in launchers and receivers. Stuck pigs in the fi eld can be quickly and clearly pinpointed to within mere inches with the CD42.
The CD52 Bandit offers a non-intrusive means of detecting and recording pipeline pig passages.
Using a CD42 STS you can track a pig as it moves by, or locate a stationary stuck pig in an underwater pipeline.
With the CD43 GeoEar a pig can be heard approaching for several miles.
The CD47-C is designed to record, within a few millisec-onds, the GPS time of a passing intelligent inspection tool.
Global Leader in Pig Tracking & Locating Solutions
www.pigging.com

Vivek Mittal, Global Product Manager, Hydratight, USA, looks at weld testing solutions.
Ageing infrastructure, including pipelines, can become a major problem for many established oil and gas producing nations. There is no escaping the fact that many pipelines around the world are reaching the end of their natural life. Indeed, some are probably already working beyond this point. The majority
were brought in to service in the 1970s in places including Europe’s North Sea and the ‘Mumbai High’ fields in India, and as such will need more rigorous maintenance in the coming years.
There has been a rapid expansion of oil and gas extraction activities, mainly due to demand for oil and gas having risen significantly as consumer habits altered and the income of the world’s population rose. It is estimated that around 25% of pipelines are now operating beyond their intended lifespan.
This creates a number of problems for the industry. Firstly, there will become an increasing need for a larger proportion of budgets to be spent on maintenance, which naturally cuts into bottom lines.
Secondly, in light of a number of high profile incidents, political and environmental pressure has grown on organisations to ensure that they maintain pipelines and joint integrity.
The industry needs to ensure that incidents like this do not happen again, in order to repair its badly tarnished image in some quarters of the mainstream media.
Finally, it is worth noting the cost implications of an unscheduled shutdown. These can run into millions of dollars in lost production time per day if an asset is taken out
Putting welds up to the test
73
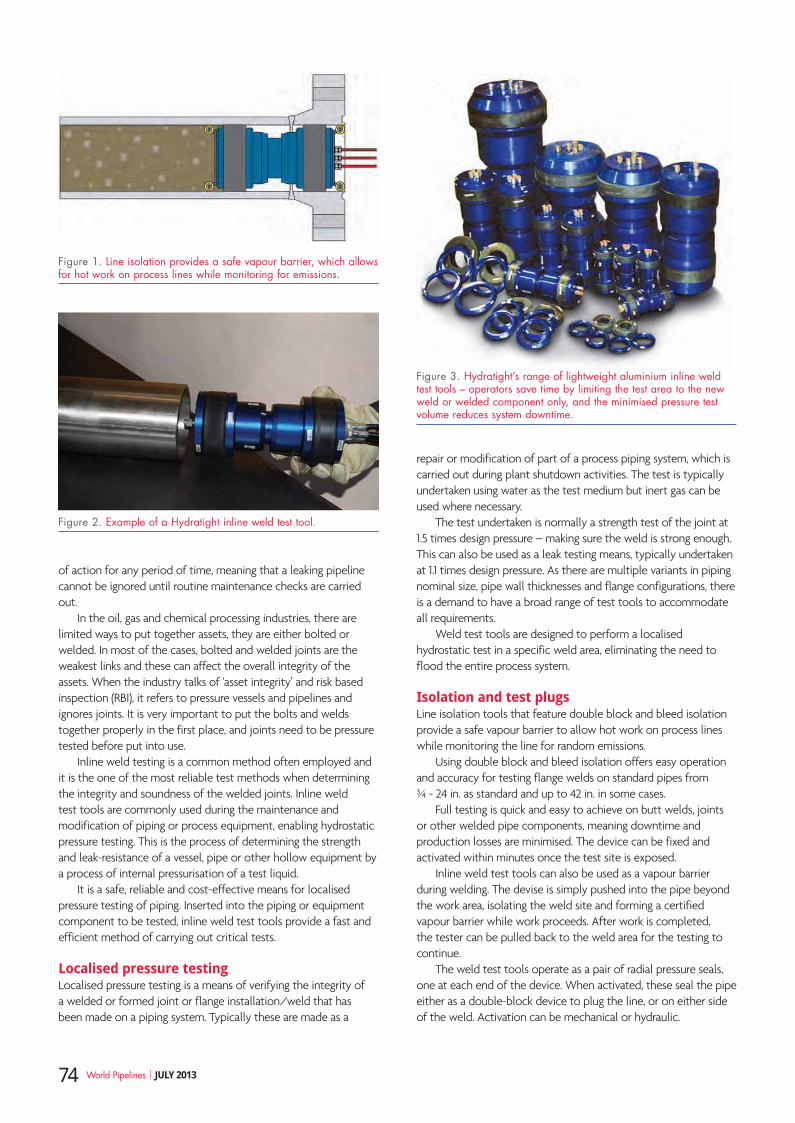
of action for any period of time, meaning that a leaking pipeline cannot be ignored until routine maintenance checks are carried out.
In the oil, gas and chemical processing industries, there are limited ways to put together assets, they are either bolted or welded. In most of the cases, bolted and welded joints are the weakest links and these can affect the overall integrity of the assets. When the industry talks of ‘asset integrity’ and risk based inspection (RBI), it refers to pressure vessels and pipelines and ignores joints. It is very important to put the bolts and welds together properly in the first place, and joints need to be pressure tested before put into use.
Inline weld testing is a common method often employed and it is the one of the most reliable test methods when determining the integrity and soundness of the welded joints. Inline weld test tools are commonly used during the maintenance and modification of piping or process equipment, enabling hydrostatic pressure testing. This is the process of determining the strength and leak-resistance of a vessel, pipe or other hollow equipment by a process of internal pressurisation of a test liquid.
It is a safe, reliable and cost-effective means for localised pressure testing of piping. Inserted into the piping or equipment component to be tested, inline weld test tools provide a fast and efficient method of carrying out critical tests.
Localised pressure testing Localised pressure testing is a means of verifying the integrity of a welded or formed joint or flange installation/weld that has been made on a piping system. Typically these are made as a
repair or modification of part of a process piping system, which is carried out during plant shutdown activities. The test is typically undertaken using water as the test medium but inert gas can be used where necessary.
The test undertaken is normally a strength test of the joint at 1.5 times design pressure – making sure the weld is strong enough. This can also be used as a leak testing means, typically undertaken at 1.1 times design pressure. As there are multiple variants in piping nominal size, pipe wall thicknesses and flange configurations, there is a demand to have a broad range of test tools to accommodate all requirements.
Weld test tools are designed to perform a localised hydrostatic test in a specific weld area, eliminating the need to flood the entire process system.
Isolation and test plugsLine isolation tools that feature double block and bleed isolation provide a safe vapour barrier to allow hot work on process lines while monitoring the line for random emissions.
Using double block and bleed isolation offers easy operation and accuracy for testing flange welds on standard pipes from ¾ - 24 in. as standard and up to 42 in. in some cases.
Full testing is quick and easy to achieve on butt welds, joints or other welded pipe components, meaning downtime and production losses are minimised. The device can be fixed and activated within minutes once the test site is exposed.
Inline weld test tools can also be used as a vapour barrier during welding. The devise is simply pushed into the pipe beyond the work area, isolating the weld site and forming a certified vapour barrier while work proceeds. After work is completed, the tester can be pulled back to the weld area for the testing to continue.
The weld test tools operate as a pair of radial pressure seals, one at each end of the device. When activated, these seal the pipe either as a double-block device to plug the line, or on either side of the weld. Activation can be mechanical or hydraulic.
Figure 3. Hydratight’s range of lightweight aluminium inline weld test tools – operators save time by limiting the test area to the new weld or welded component only, and the minimised pressure test volume reduces system downtime.
Figure 1. Line isolation provides a safe vapour barrier, which allows for hot work on process lines while monitoring for emissions.
Figure 2. Example of a Hydratight inline weld test tool.
74 World Pipelines | JULY 2013
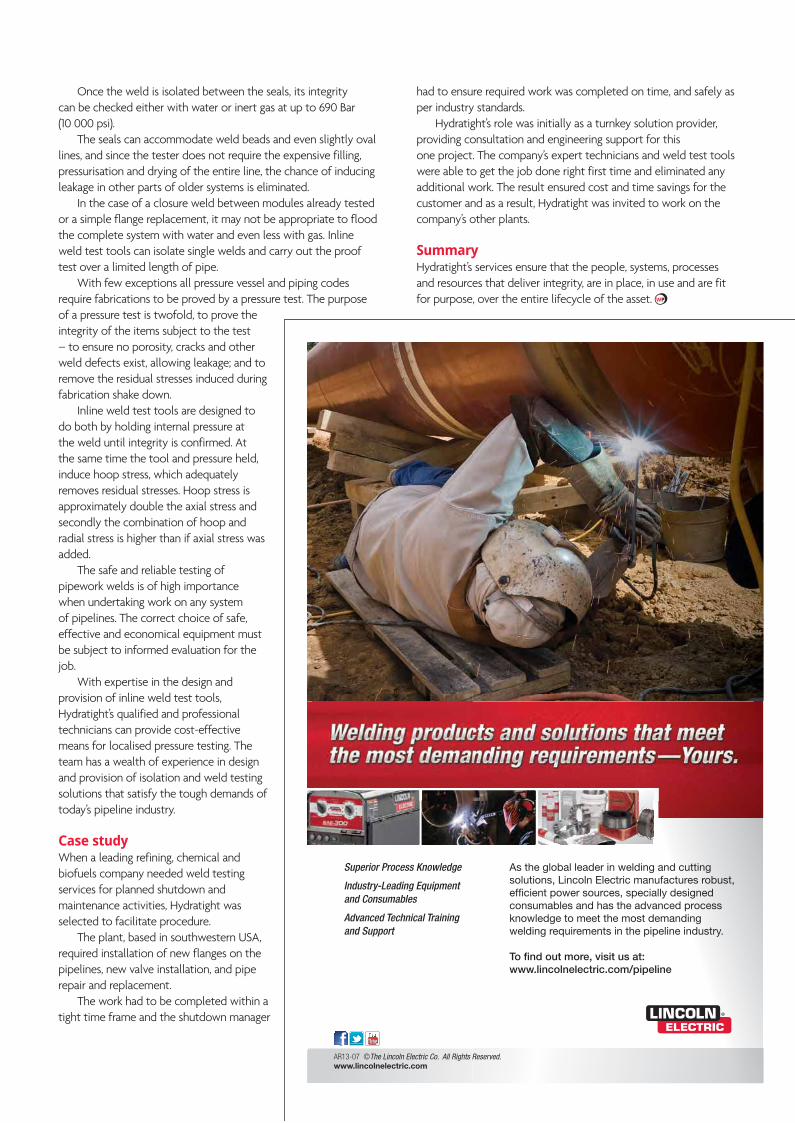
Once the weld is isolated between the seals, its integrity can be checked either with water or inert gas at up to 690 Bar (10 000 psi).
The seals can accommodate weld beads and even slightly oval lines, and since the tester does not require the expensive filling, pressurisation and drying of the entire line, the chance of inducing leakage in other parts of older systems is eliminated.
In the case of a closure weld between modules already tested or a simple flange replacement, it may not be appropriate to flood the complete system with water and even less with gas. Inline weld test tools can isolate single welds and carry out the proof test over a limited length of pipe.
With few exceptions all pressure vessel and piping codes require fabrications to be proved by a pressure test. The purpose of a pressure test is twofold, to prove the integrity of the items subject to the test – to ensure no porosity, cracks and other weld defects exist, allowing leakage; and to remove the residual stresses induced during fabrication shake down.
Inline weld test tools are designed to do both by holding internal pressure at the weld until integrity is confirmed. At the same time the tool and pressure held, induce hoop stress, which adequately removes residual stresses. Hoop stress is approximately double the axial stress and secondly the combination of hoop and radial stress is higher than if axial stress was added.
The safe and reliable testing of pipework welds is of high importance when undertaking work on any system of pipelines. The correct choice of safe, effective and economical equipment must be subject to informed evaluation for the job.
With expertise in the design and provision of inline weld test tools, Hydratight’s qualified and professional technicians can provide cost-effective means for localised pressure testing. The team has a wealth of experience in design and provision of isolation and weld testing solutions that satisfy the tough demands of today’s pipeline industry.
Case studyWhen a leading refining, chemical and biofuels company needed weld testing services for planned shutdown and maintenance activities, Hydratight was selected to facilitate procedure.
The plant, based in southwestern USA, required installation of new flanges on the pipelines, new valve installation, and pipe repair and replacement.
The work had to be completed within a tight time frame and the shutdown manager
had to ensure required work was completed on time, and safely as per industry standards.
Hydratight’s role was initially as a turnkey solution provider, providing consultation and engineering support for this one project. The company’s expert technicians and weld test tools were able to get the job done right first time and eliminated any additional work. The result ensured cost and time savings for the customer and as a result, Hydratight was invited to work on the company’s other plants.
SummaryHydratight’s services ensure that the people, systems, processes and resources that deliver integrity, are in place, in use and are fit for purpose, over the entire lifecycle of the asset.
Superior Process Knowledge
Industry-Leading Equipment and Consumables
Advanced Technical Training and Support
AR13-07 ©The Lincoln Electric Co. All Rights Reserved. www.lincolnelectric.com
As the global leader in welding and cutting solutions, Lincoln Electric manufactures robust, efficient power sources, specially designed consumables and has the advanced process knowledge to meet the most demanding welding requirements in the pipeline industry. To find out more, visit us at: www.lincolnelectric.com/pipeline

Holdtight Solutions Inc.P. O. Box 27907 Houston, TX 77227
(800) 319-8802 Fax (800) 728-8861www.holdtight.com
HoldTight Solutions pioneered the concept of low-cost, easy-to-achieve, and easy-to-measure contaminant-free surface preparation. Our HoldTight®102 salt remover and flash rush inhibitor prevents flash rust simply by removing surface contaminants. If there is NO FLASH RUST, there are NO CONTAMINANTS. Any “stuff” on the surface — chlorides, sulfates, nitrates, phosphates, shattered pieces of rust, abrasive, paint, or any other debris — will pull water to the surface and cause flash rust. And if you paint over any such stuff, sooner or later, it will pull moisture through the coating and cause coating failure. No flash rust = a clean surface. In other words, you know it when you see it! You don’t need to use cumbersome, expensive, and applicator-sensitive field tests to prove it. This is a revolutionary old concept: make it simple and it works better. “102” is used in conjunction with dry-blasting, wet-abrasive blasting, and water-jetting (“UHP”) blasting. It evaporates rapidly, lifting off moisture as it does, and leaves no residue. 102 is approved by most coating manufacturers for most coatings. Contact us for your nearest distributor or to find out how to use HoldTight®102 on your job.
t u l s a p i p e l i n e e x p o . c o m
Tulsa Pipeline Expo is a three-day event showcasing Oklahoma’s energy industry, providing opportunities to network with suppliers, businesses, potential clients & customers from across North America and around the world. The Expo includes a two-day trade
show, professional development training, expert industry speakers, job fair, Eagle Gift Foundation Silent Auction & Benefit Dinner with keynote speaker Mike Huckabee, benefit golf scramble and networking functions including concert featuring Bryan White.
Please contact us at [email protected]; 918.591.3885 or 877-300.4852 with any questions regarding registration, sponsor and exhibitor opportunities.
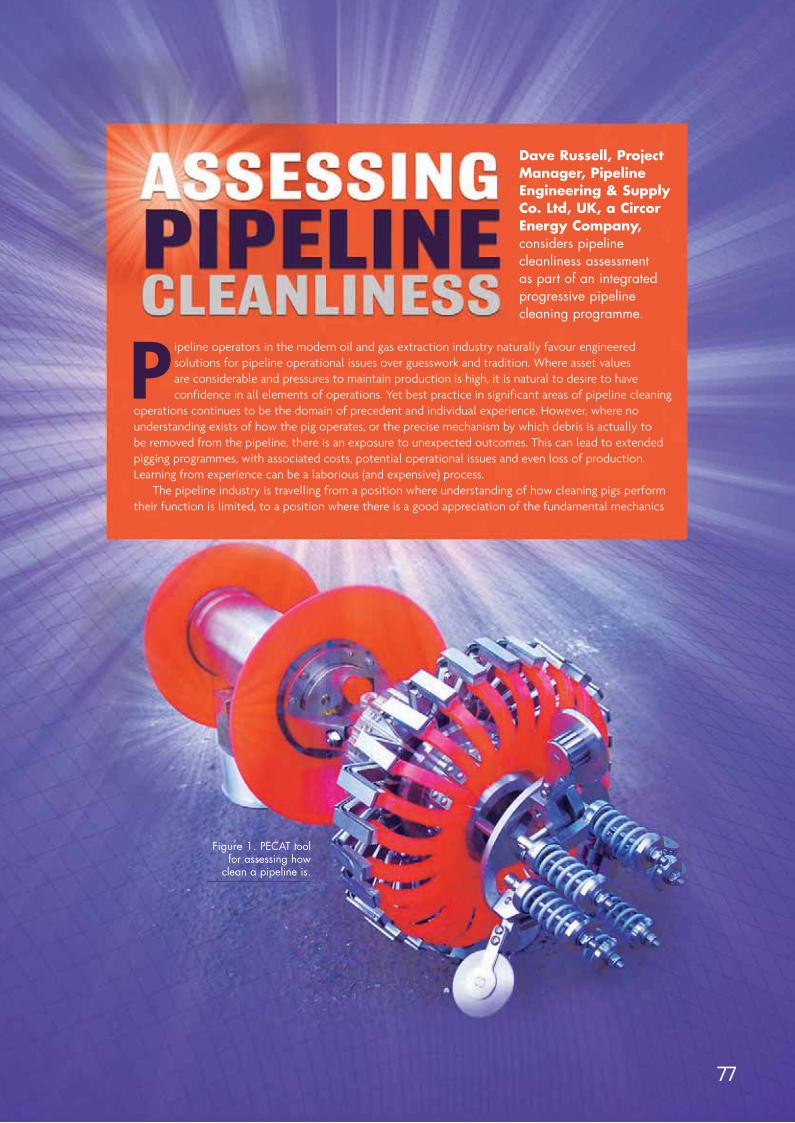
Dave Russell, Project Manager, Pipeline Engineering & Supply Co. Ltd, UK, a Circor Energy Company, considers pipeline cleanliness assessment as part of an integrated progressive pipeline cleaning programme.
Pipeline operators in the modern oil and gas extraction industry naturally favour engineered solutions for pipeline operational issues over guesswork and tradition. Where asset values are considerable and pressures to maintain production is high, it is natural to desire to have confidence in all elements of operations. Yet best practice in significant areas of pipeline cleaning
operations continues to be the domain of precedent and individual experience. However, where no understanding exists of how the pig operates, or the precise mechanism by which debris is actually to be removed from the pipeline, there is an exposure to unexpected outcomes. This can lead to extended pigging programmes, with associated costs, potential operational issues and even loss of production. Learning from experience can be a laborious (and expensive) process.
The pipeline industry is travelling from a position where understanding of how cleaning pigs perform their function is limited, to a position where there is a good appreciation of the fundamental mechanics
Figure 1. PECAT tool for assessing how
clean a pipeline is.
77
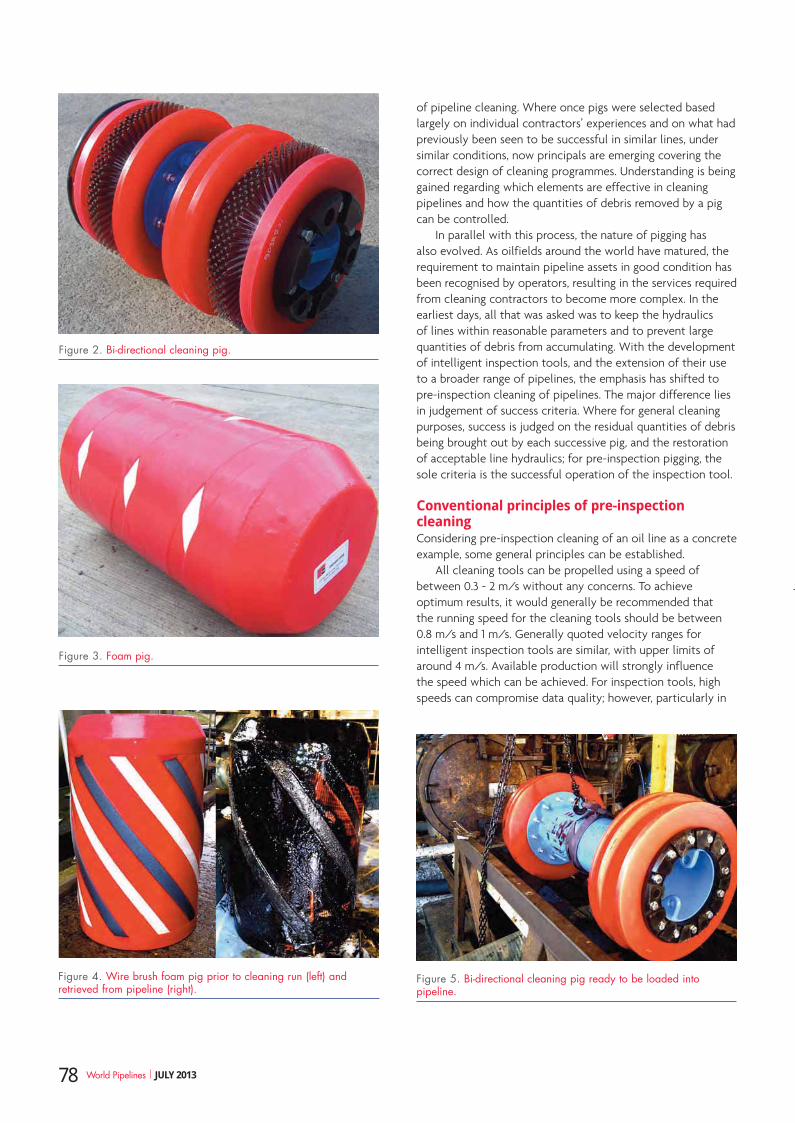
of pipeline cleaning. Where once pigs were selected based largely on individual contractors’ experiences and on what had previously been seen to be successful in similar lines, under similar conditions, now principals are emerging covering the correct design of cleaning programmes. Understanding is being gained regarding which elements are effective in cleaning pipelines and how the quantities of debris removed by a pig can be controlled.
In parallel with this process, the nature of pigging has also evolved. As oilfields around the world have matured, the requirement to maintain pipeline assets in good condition has been recognised by operators, resulting in the services required from cleaning contractors to become more complex. In the earliest days, all that was asked was to keep the hydraulics of lines within reasonable parameters and to prevent large quantities of debris from accumulating. With the development of intelligent inspection tools, and the extension of their use to a broader range of pipelines, the emphasis has shifted to pre-inspection cleaning of pipelines. The major difference lies in judgement of success criteria. Where for general cleaning purposes, success is judged on the residual quantities of debris being brought out by each successive pig, and the restoration of acceptable line hydraulics; for pre-inspection pigging, the sole criteria is the successful operation of the inspection tool.
Conventional principles of pre-inspection cleaningConsidering pre-inspection cleaning of an oil line as a concrete example, some general principles can be established.
All cleaning tools can be propelled using a speed of between 0.3 - 2 m/s without any concerns. To achieve optimum results, it would generally be recommended that the running speed for the cleaning tools should be between 0.8 m/s and 1 m/s. Generally quoted velocity ranges for intelligent inspection tools are similar, with upper limits of around 4 m/s. Available production will strongly influence the speed which can be achieved. For inspection tools, high speeds can compromise data quality; however, particularly in
Figure 2. Bi-directional cleaning pig.
Figure 3. Foam pig.
Figure 4. Wire brush foam pig prior to cleaning run (left) and retrieved from pipeline (right).
Figure 5. Bi-directional cleaning pig ready to be loaded into pipeline.
78 World Pipelines | JULY 2013
mature fields, low flowrate is likely to be more of an issue. Although the velocity of cleaning and inspection tools can be controlled to some extent by the operation of the production process and by monitoring of the displacement flowrate at the time of the cleaning programme, this can add a considerable burden on both cost and environmental issues.
It is now fairly well established that bi-directional disc pigs (Figure 2) will, as a rule, remove more debris from a pipeline than an equivalent cup pig.
Naturally this also depends on the driving differential pressure (DP) required to move the pig and again it is understood that high DPs are more effective. Desirable values will depend on line diameter.
As it is possible that the pipeline may have significant volumes of wax deposited on the internal wall, it is important that each cleaning run does not return large amounts of debris such that the downstream process may be affected. It is generally the case that the initial debris removed is likely to be of a soft consistency, and as the programme progresses, the consistency of any debris returned may become harder. At every stage of the cleaning programme the amount and composition of debris being removed should be observed to be able to make an assessment for the subsequent cleaning runs.
Variables affecting a cleaning programmeThe decision process of how and when to change the cleaning aggression or modify the pig designs during a cleaning programme is based on a number of variables such as:
F Returned pig condition.
F Volume of returned debris.
F Type and consistency of debris returned.
F Pressure and flow profiles.
F Pig availability.
Due to the nature of any cleaning programme there will be no definitive, one-size-fits-all running sequence of cleaning pig types and quantities. The type of pig to be used for each cleaning run will generally be determined from the observations and assessment made from the last run.
Where cleaning pigs have been routinely run, the preliminary proving runs may be curtailed or omitted. Where a pipeline has not been routinely cleaned, the initial approach should be one of caution and have the intention of proving that a pig will traverse the total pipeline length at each incremental step. Where lines are very heavily encrusted, the initial run may be at a pig diameter somewhat less than the actual line internal diameter (ID). Very often this proving of the pipeline will be carried out using a medium density foam pig (Figure 3).
Should the assessment of the pig performance highlight any concerns repeat runs may be required; otherwise the cleaning programme can proceed using a more aggressive wire brush foam pig (WBFP) (Figure 4). These pigs should provide an intermediary cleaning action prior to running the metal bodied bi-directional cleaning tools. These runs should also provide
WWHHEERREEVVEERR GGAASS IISS HHAANNDDLLEEDDWWEE CCAANN CCOONNTTRRIIBBUUTTEE WWIITTHHOOUURR RRAANNGGEE OOFF PPRROODDUUCCTTSS::
-- GGaass HHeeaatteerrss ((wwaatteerr && ooii ll bbaatthh))- GGaass FFii ll tteerrss-- GGaass SSeeppaarraattoorrss -- PPiigg LLaauunncchheerrss aanndd RReecceeiivveerrss-- SSkkiidd mmoouunntteedd ggaass tt rreeaattmmeenntt ppllaannttss-- QQuuiicckk ooppeenniinngg cc lloossuurreess..
Forain s.r.l. - Via G. Boeri, 11 - 20141 Milan - ITALYTel +3902.8467345 - Fax +3902.8465325
www.forain.it - email: [email protected]
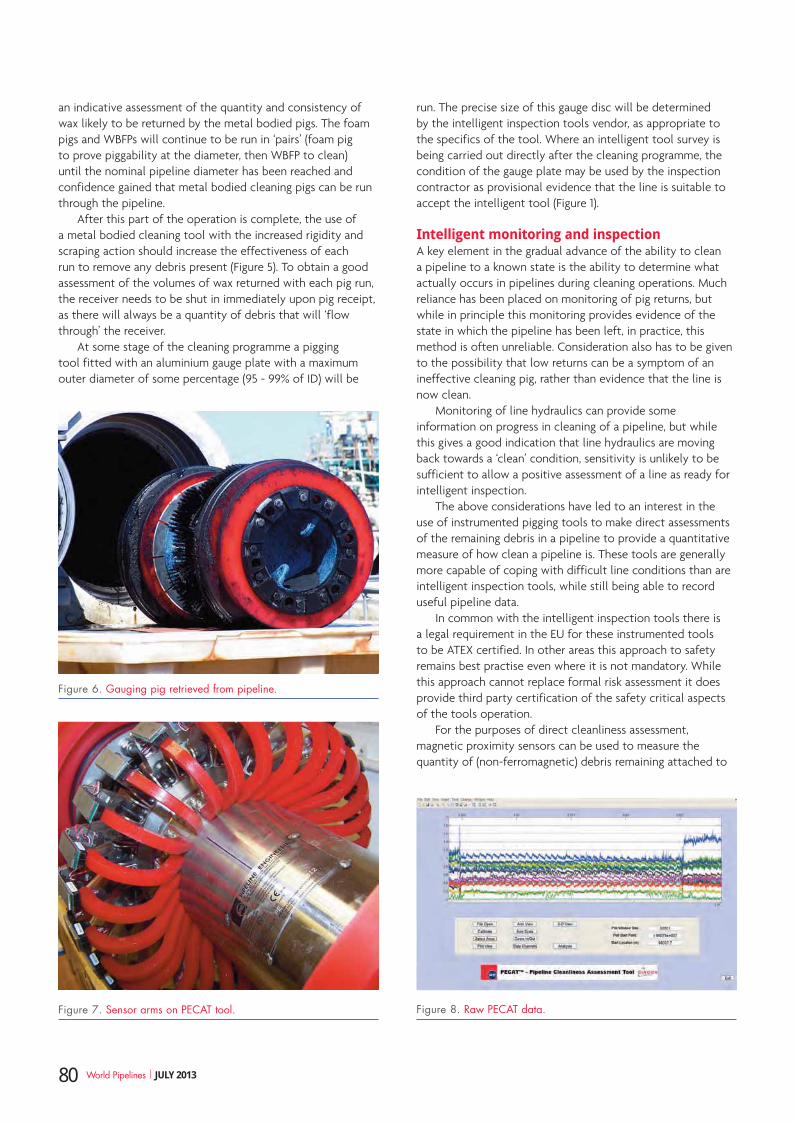
Figure 7. Sensor arms on PECAT tool.
an indicative assessment of the quantity and consistency of wax likely to be returned by the metal bodied pigs. The foam pigs and WBFPs will continue to be run in ‘pairs’ (foam pig to prove piggability at the diameter, then WBFP to clean) until the nominal pipeline diameter has been reached and confidence gained that metal bodied cleaning pigs can be run through the pipeline.
After this part of the operation is complete, the use of a metal bodied cleaning tool with the increased rigidity and scraping action should increase the effectiveness of each run to remove any debris present (Figure 5). To obtain a good assessment of the volumes of wax returned with each pig run, the receiver needs to be shut in immediately upon pig receipt, as there will always be a quantity of debris that will ‘flow through’ the receiver.
At some stage of the cleaning programme a pigging tool fitted with an aluminium gauge plate with a maximum outer diameter of some percentage (95 - 99% of ID) will be
run. The precise size of this gauge disc will be determined by the intelligent inspection tools vendor, as appropriate to the specifics of the tool. Where an intelligent tool survey is being carried out directly after the cleaning programme, the condition of the gauge plate may be used by the inspection contractor as provisional evidence that the line is suitable to accept the intelligent tool (Figure 1).
Intelligent monitoring and inspectionA key element in the gradual advance of the ability to clean a pipeline to a known state is the ability to determine what actually occurs in pipelines during cleaning operations. Much reliance has been placed on monitoring of pig returns, but while in principle this monitoring provides evidence of the state in which the pipeline has been left, in practice, this method is often unreliable. Consideration also has to be given to the possibility that low returns can be a symptom of an ineffective cleaning pig, rather than evidence that the line is now clean.
Monitoring of line hydraulics can provide some information on progress in cleaning of a pipeline, but while this gives a good indication that line hydraulics are moving back towards a ‘clean’ condition, sensitivity is unlikely to be sufficient to allow a positive assessment of a line as ready for intelligent inspection.
The above considerations have led to an interest in the use of instrumented pigging tools to make direct assessments of the remaining debris in a pipeline to provide a quantitative measure of how clean a pipeline is. These tools are generally more capable of coping with difficult line conditions than are intelligent inspection tools, while still being able to record useful pipeline data.
In common with the intelligent inspection tools there is a legal requirement in the EU for these instrumented tools to be ATEX certified. In other areas this approach to safety remains best practise even where it is not mandatory. While this approach cannot replace formal risk assessment it does provide third party certification of the safety critical aspects of the tools operation.
For the purposes of direct cleanliness assessment, magnetic proximity sensors can be used to measure the quantity of (non-ferromagnetic) debris remaining attached to
Figure 8. Raw PECAT data.
Figure 6. Gauging pig retrieved from pipeline.
80 World Pipelines | JULY 2013
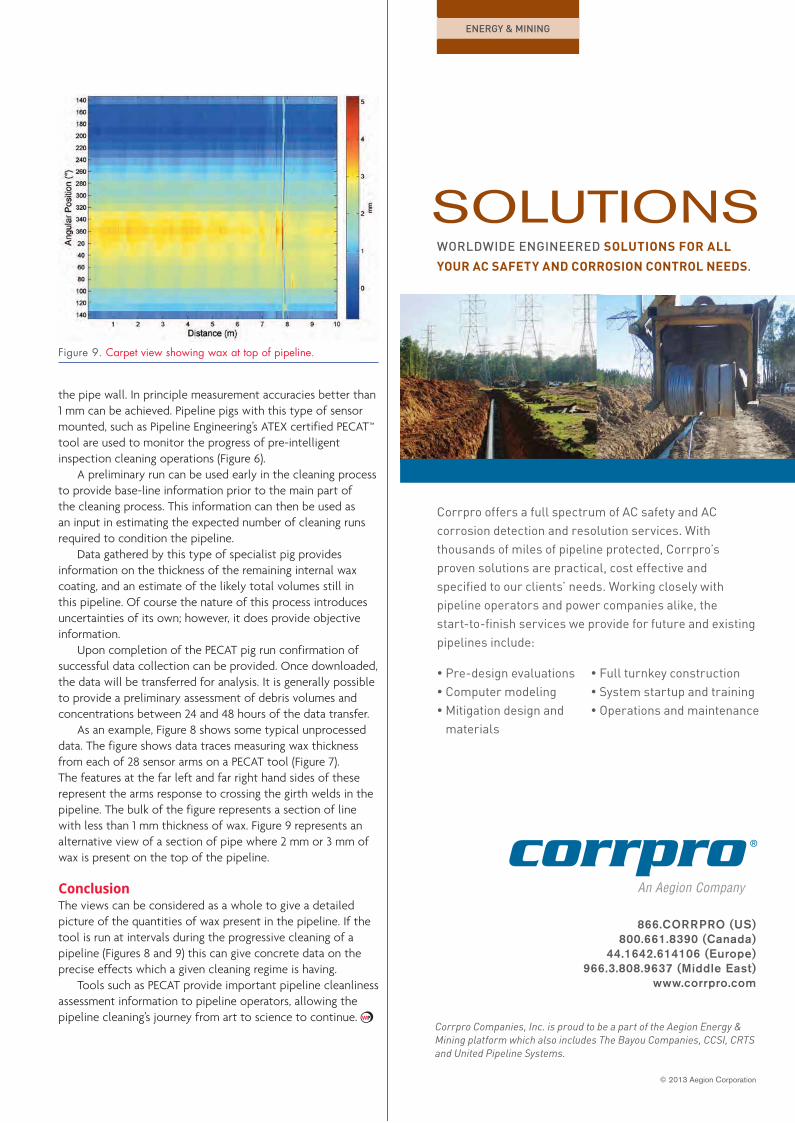
the pipe wall. In principle measurement accuracies better than 1 mm can be achieved. Pipeline pigs with this type of sensor mounted, such as Pipeline Engineering’s ATEX certified PECAT™ tool are used to monitor the progress of pre-intelligent inspection cleaning operations (Figure 6).
A preliminary run can be used early in the cleaning process to provide base-line information prior to the main part of the cleaning process. This information can then be used as an input in estimating the expected number of cleaning runs required to condition the pipeline.
Data gathered by this type of specialist pig provides information on the thickness of the remaining internal wax coating, and an estimate of the likely total volumes still in this pipeline. Of course the nature of this process introduces uncertainties of its own; however, it does provide objective information.
Upon completion of the PECAT pig run confirmation of successful data collection can be provided. Once downloaded, the data will be transferred for analysis. It is generally possible to provide a preliminary assessment of debris volumes and concentrations between 24 and 48 hours of the data transfer.
As an example, Figure 8 shows some typical unprocessed data. The figure shows data traces measuring wax thickness from each of 28 sensor arms on a PECAT tool (Figure 7). The features at the far left and far right hand sides of these represent the arms response to crossing the girth welds in the pipeline. The bulk of the figure represents a section of line with less than 1 mm thickness of wax. Figure 9 represents an alternative view of a section of pipe where 2 mm or 3 mm of wax is present on the top of the pipeline.
ConclusionThe views can be considered as a whole to give a detailed picture of the quantities of wax present in the pipeline. If the tool is run at intervals during the progressive cleaning of a pipeline (Figures 8 and 9) this can give concrete data on the precise effects which a given cleaning regime is having.
Tools such as PECAT provide important pipeline cleanliness assessment information to pipeline operators, allowing the pipeline cleaning’s journey from art to science to continue.
Figure 9. Carpet view showing wax at top of pipeline.

Vacuworx lifters increase load and unload cycles 7-12 times while improving job-site safety. Lift capacities range from 3 - 20 tonne, and can be customized for more. Vacuworx offers financing and rental options, and our service and parts departments are available 24/7 365 days a year.
With 14 years of proven track record, no one offers better selection or quality than Vacuworx.
At Vacuworx, the objective is very simple – to provide the safest heavy-duty
lifting equipment in the industry with products that allow project times to
be cut in half – and with a fraction of the number of ground personnel vs.
conventional methods. Vacuworx is all about allowing our customers
to leverage their bottom line in those areas with the most impact.
VACUWORX GLOBAL | 10105 East 55th Place, Tulsa, Oklahoma 74146 USAoffice 918-259-3050 | fax 918-259-3055 | [email protected] | www.vacuworx.com
...the global leader in innovative lifting solutions.
Leverage your bottom line... with every lift!

Clarence L. Lamb, International Projects Director,
UniversalPegasus International, USA, discusses data-driven design
services for the global pipeline market.
Advances in geomatics and spatially driven technology have provided opportunities for growth in nearly every area of pipeline design in the past decade. Coupled with
the growth and ubiquity of geographic information systems technology into aspects of everyday life, this technology has become a mission critical component that provides the designers and engineers of a pipeline a near real-time window into a project, but also provides a platform of operational and situational awareness for all parties concerned in the safe construction and operations of the pipelines of the future.
believingSEEING is
83
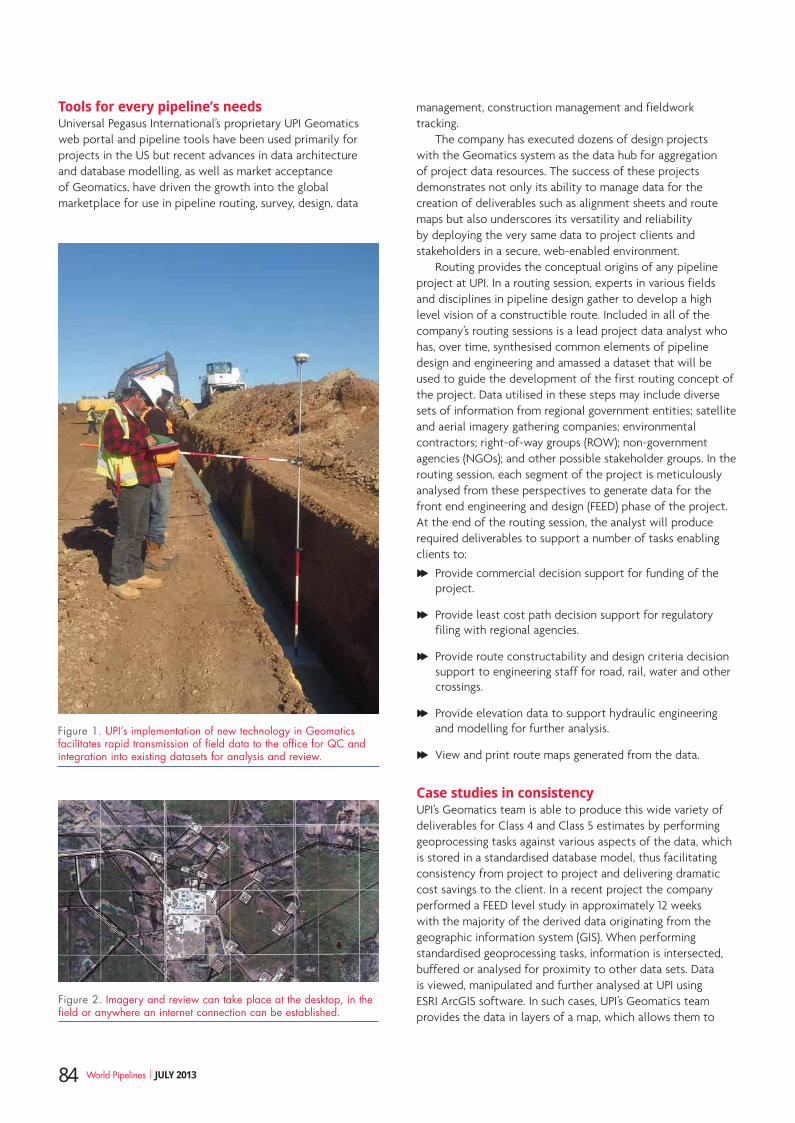
Tools for every pipeline’s needsUniversal Pegasus International’s proprietary UPI Geomatics web portal and pipeline tools have been used primarily for projects in the US but recent advances in data architecture and database modelling, as well as market acceptance of Geomatics, have driven the growth into the global marketplace for use in pipeline routing, survey, design, data
management, construction management and fieldwork tracking.
The company has executed dozens of design projects with the Geomatics system as the data hub for aggregation of project data resources. The success of these projects demonstrates not only its ability to manage data for the creation of deliverables such as alignment sheets and route maps but also underscores its versatility and reliability by deploying the very same data to project clients and stakeholders in a secure, web-enabled environment.
Routing provides the conceptual origins of any pipeline project at UPI. In a routing session, experts in various fields and disciplines in pipeline design gather to develop a high level vision of a constructible route. Included in all of the company’s routing sessions is a lead project data analyst who has, over time, synthesised common elements of pipeline design and engineering and amassed a dataset that will be used to guide the development of the first routing concept of the project. Data utilised in these steps may include diverse sets of information from regional government entities; satellite and aerial imagery gathering companies; environmental contractors; right-of-way groups (ROW); non-government agencies (NGOs); and other possible stakeholder groups. In the routing session, each segment of the project is meticulously analysed from these perspectives to generate data for the front end engineering and design (FEED) phase of the project. At the end of the routing session, the analyst will produce required deliverables to support a number of tasks enabling clients to:
F Provide commercial decision support for funding of the project.
F Provide least cost path decision support for regulatory filing with regional agencies.
F Provide route constructability and design criteria decision support to engineering staff for road, rail, water and other crossings.
F Provide elevation data to support hydraulic engineering and modelling for further analysis.
F View and print route maps generated from the data.
Case studies in consistencyUPI’s Geomatics team is able to produce this wide variety of deliverables for Class 4 and Class 5 estimates by performing geoprocessing tasks against various aspects of the data, which is stored in a standardised database model, thus facilitating consistency from project to project and delivering dramatic cost savings to the client. In a recent project the company performed a FEED level study in approximately 12 weeks with the majority of the derived data originating from the geographic information system (GIS). When performing standardised geoprocessing tasks, information is intersected, buffered or analysed for proximity to other data sets. Data is viewed, manipulated and further analysed at UPI using ESRI ArcGIS software. In such cases, UPI’s Geomatics team provides the data in layers of a map, which allows them to
Figure 1. UPI’s implementation of new technology in Geomatics facilitates rapid transmission of field data to the office for QC and integration into existing datasets for analysis and review.
Figure 2. Imagery and review can take place at the desktop, in the field or anywhere an internet connection can be established.
84 World Pipelines | JULY 2013
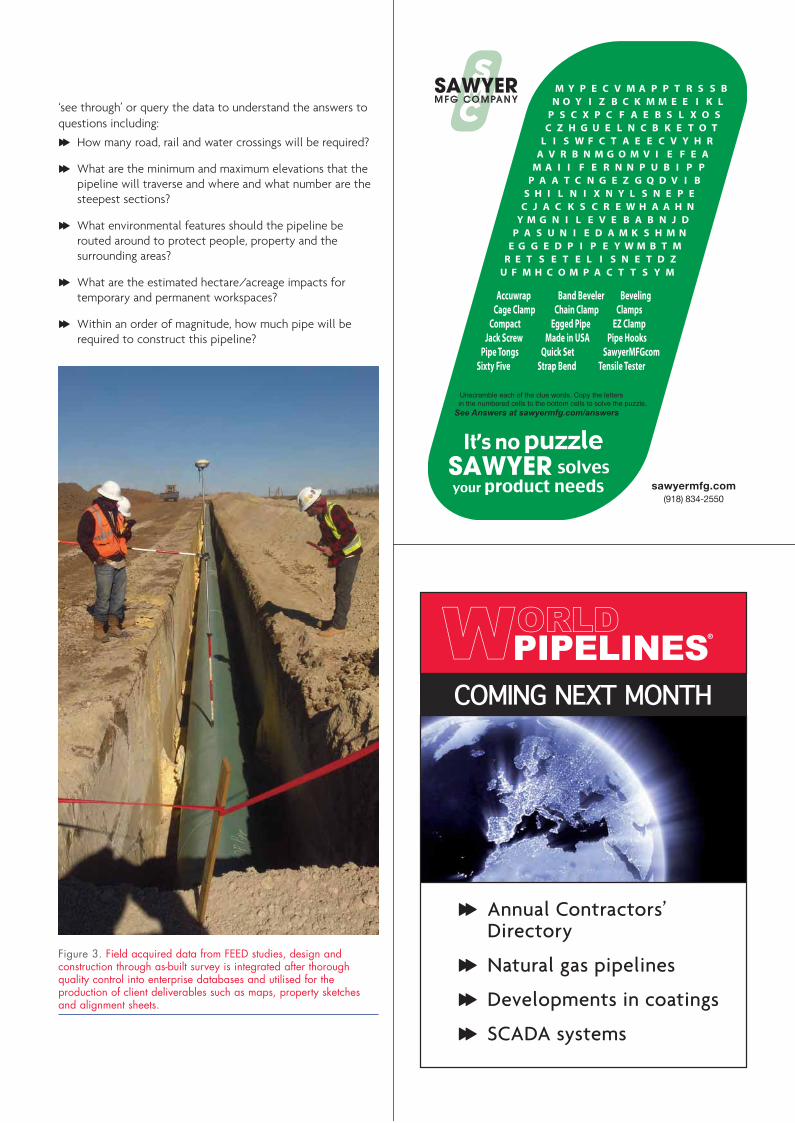
‘see through’ or query the data to understand the answers to questions including:
F How many road, rail and water crossings will be required?
F What are the minimum and maximum elevations that the pipeline will traverse and where and what number are the steepest sections?
F What environmental features should the pipeline be routed around to protect people, property and the surrounding areas?
F What are the estimated hectare/acreage impacts for temporary and permanent workspaces?
F Within an order of magnitude, how much pipe will be required to construct this pipeline?
Figure 3. Field acquired data from FEED studies, design and construction through as-built survey is integrated after thorough quality control into enterprise databases and utilised for the production of client deliverables such as maps, property sketches and alignment sheets.
®
COMING NEXT MONTH
Pipeline integrity
Trenching
Valves
Annual global round-up
F Annual Contractors’ Directory
F Natural gas pipelines
F Developments in coatings
F SCADA systems
‘no action has been taken’ or ‘requires immediate attention’. Data from the ROW system is used to generate status reports that answer questions such as:
F How many tracts of land require permission to be surveyed today?
F How much has the client paid for the land to date?
F How many acres/hectares are in a given parcel or tract of land?
F How many tracts have been inspected to date?
F Can a survey line list be printed for the field crews to carry in the truck?
Supporting field activitiesUPI has developed similar applications that provide data entry and analysis for other aspects of the detail design process for survey and field engineering. The applications are also secure, form-driven tools that facilitate rapid data gathering to support field activities. The forms range in purpose from the daily tailgate safety meeting for survey to field engineering activities. Information gathered from these activities may be viewed in a tabular row and column report, in its original completed format or as a colour bar of status for the various activities dropped onto the route itself. All of the data is stored in a secure Microsoft SQL Server database environment that is backed up periodically to ensure the integrity of the client’s data.
As the data accumulates, project teams will begin processing the data for use in the creation of various required deliverables. Details of the pipeline emerge from the survey data, crossing over changing property status and around, under and potentially over cultural, economic, environmental and geographic features. The culmination of the integration of data gathering and use of the tools is to create maps and reports that include:
F Alignment sheets.
F Regulatory permit drawings.
F HDD drawings.
F Crossing reports.
F Regulatory reports.
Concurrent with the design processes is the key issue of route management of change (RMOC). In recent years, RMOC was a daunting process complicated by file loss, unreliable and incomplete email strings and change registers. UPI has engineered a software tool that is revolutionary for the RMOC in the detail design phase of the pipeline lifecycle. The RMOC tool functions as a bridge between various project stakeholders to effectively communicate changes to routes in a real-time environment. The RMOC tool is integrated with the UPI web applications and web mapping in order to provide visualisation of proposed changes and potential impact upon the environment, budget, schedule, etc. In addition,
These types of desktop studies provide decision makers with the tools they need to further analyse the economic, social and cultural factors that impact the construction of a pipeline. In addition, all data from this stage may be utilised in the next stage of pipeline detail design as well as through the lifetime of the pipeline facility. Since the geospatial information is stored in a database, it can be added to as the project matures and comes nearer to completion.
During detail design many activities are ongoing including surveying of the physical attributes and the development of specific engineering details to solve the challenges of building the pipeline. UPI utilises a software development team and a Geomatics project production team to problem solve challenges that occur during the project. In many cases, the company will perform survey work in addition to the project management, engineering and other design tasks. UPI takes a two-pronged approach toward survey to ensure that data are processed in a streamlined and efficient fashion. Firstly, the survey department is tightly integrated with Geomatics and shares data dictionaries and models between next generation Trimble survey instruments and the GIS database to ensure that at every step of the survey process quality control and quality assurance are performed with the highest regard for data integrity. The second approach draws upon the lessons learned from performing survey. UPI uses its experience and client-driven data needs to improve personnel training and data gathering and usage to ensure that clients receive their data in the manner that they require to meet project goals.
GIS-streamlined softwareIn addition, UPI Geomatics has developed specialised application software for use in a wide range of situations where data management is tied directly to the GIS so that users can process and receive real-time information on a wide range of aspects of the ROW acquisition process including:
F Tract events.
F Tract issues.
F Tract offers.
F Tract title.
F Tract plan or individual ownership plan.
F Tract condemnation.
F Tract inspection.
UPI’s ROW system is a secure, form-driven series of web applications that can be processed anywhere between the desktop and the field using an internet connection. The forms feature intelligent and convenient features such as auto-fill, drop-down menus and entry validation to ensure consistency and accuracy in every entry. The system is designed to be utilised to its full potential with minimal user training, and data can be accessed via graphs, tabular reports and map views. When viewing ROW data on the map, properties are displayed in colours that depict the property status; green stands for ‘acquired’, blue for ‘requiring attention’, and red for
86 World Pipelines | JULY 2013
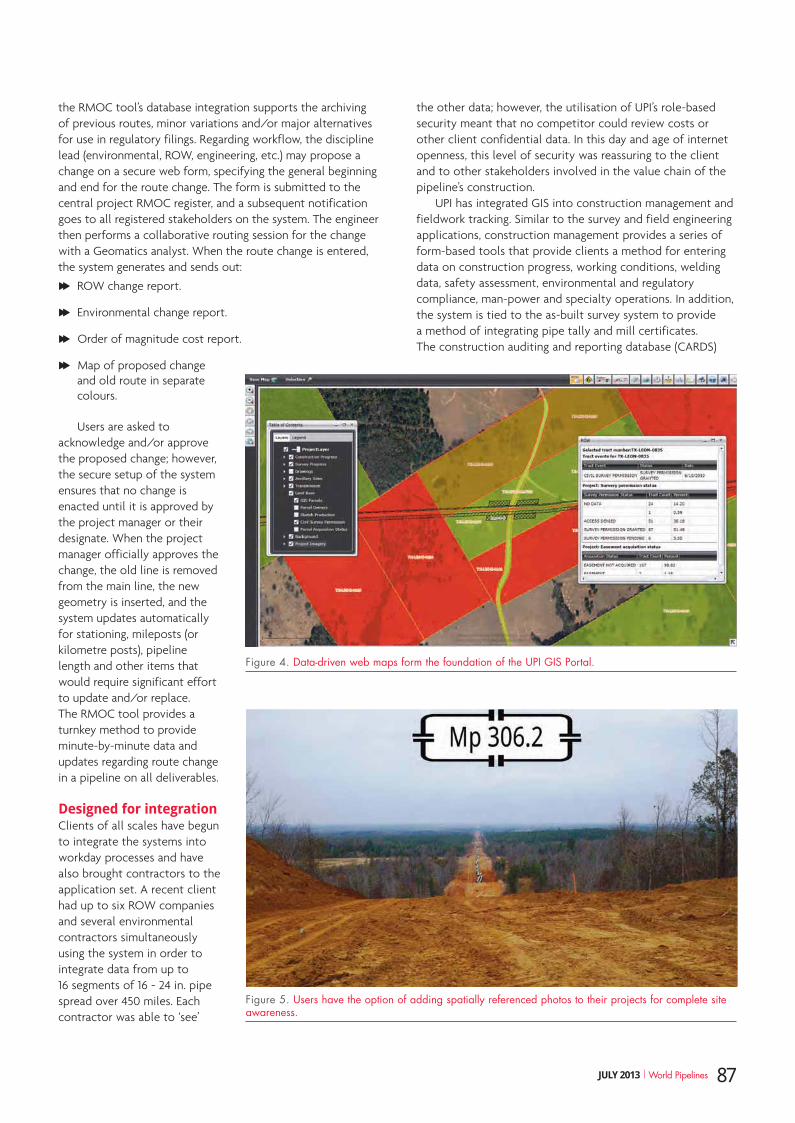
the RMOC tool’s database integration supports the archiving of previous routes, minor variations and/or major alternatives for use in regulatory filings. Regarding workflow, the discipline lead (environmental, ROW, engineering, etc.) may propose a change on a secure web form, specifying the general beginning and end for the route change. The form is submitted to the central project RMOC register, and a subsequent notification goes to all registered stakeholders on the system. The engineer then performs a collaborative routing session for the change with a Geomatics analyst. When the route change is entered, the system generates and sends out:
F ROW change report.
F Environmental change report.
F Order of magnitude cost report.
F Map of proposed change and old route in separate colours.
Users are asked to acknowledge and/or approve the proposed change; however, the secure setup of the system ensures that no change is enacted until it is approved by the project manager or their designate. When the project manager officially approves the change, the old line is removed from the main line, the new geometry is inserted, and the system updates automatically for stationing, mileposts (or kilometre posts), pipeline length and other items that would require significant effort to update and/or replace. The RMOC tool provides a turnkey method to provide minute-by-minute data and updates regarding route change in a pipeline on all deliverables.
Designed for integrationClients of all scales have begun to integrate the systems into workday processes and have also brought contractors to the application set. A recent client had up to six ROW companies and several environmental contractors simultaneously using the system in order to integrate data from up to 16 segments of 16 - 24 in. pipe spread over 450 miles. Each contractor was able to ‘see’
the other data; however, the utilisation of UPI’s role-based security meant that no competitor could review costs or other client confidential data. In this day and age of internet openness, this level of security was reassuring to the client and to other stakeholders involved in the value chain of the pipeline’s construction.
UPI has integrated GIS into construction management and fieldwork tracking. Similar to the survey and field engineering applications, construction management provides a series of form-based tools that provide clients a method for entering data on construction progress, working conditions, welding data, safety assessment, environmental and regulatory compliance, man-power and specialty operations. In addition, the system is tied to the as-built survey system to provide a method of integrating pipe tally and mill certificates. The construction auditing and reporting database (CARDS)
Figure 4. Data-driven web maps form the foundation of the UPI GIS Portal.
Figure 5. Users have the option of adding spatially referenced photos to their projects for complete site awareness.
87JULY 2013 | World Pipelines

inspection portal and associated application software is used by project managers, inspection personnel and other pipeline project stakeholders to add, update and display mill certificate, pipe tally and inspection data and documents. These same stakeholders may also utilise the system to review the data through reports, lists and map displays. The CARDS solution provides users with a method of tracking all relevant pipeline field data in a single, searchable database. All project data is stored in an industry standard database for quick access to support a variety of needs.
CARDS is designed to help reduce the time spent on audits from weeks and days to hours so that effort can be focused on quality data processing as well as progress in the field. Furthermore, data captured with the CARDS system provides users with a method of tracking individual inspector performance as well as progress and status against baseline schedules. Digitally captured data and forms are spatialised and represented along the route of a pipeline or at a particular spatial location. This allows stakeholders seeking current and historical information an intuitive and map-based method of accessing documents based on station, milepost, parcel or co-ordinate pair.
The processed and loaded data is accessed using one of several UPI custom search tools to query and review data by linear station location and other unique location and file identifiers. The system consists of several components, divided by construction phase – mill certificate and pipe tally, inspection reports, alarm reports and a web map site that allows visual query of all data from its spatial location within the project. On recent projects, prior to commissioning and start-up, UPI Geomatics staff worked directly with clients and regulators to retrieve data from the database during audits. During one such audit, UPI personnel estimated that the audit time was reduced to less than a quarter of the time of a traditional ‘paper-trail’ audit due to the fact that all of the information regarding the project was available at the user and auditor’s fingertips. This has the additional benefit of making it possible to reduce response times in the event of an emergency.
ConclusionUPI has put tremendous effort into creating value from the data that is gathered on its clients’ behalf. All of the referenced applications can be bundled into a single suite or supplied separately to suit the client’s needs at a particular point in time. The Geomatics tools and techniques have provided numerous clients with the opportunity to save money and time while increasing data value and clearing a path for any required integrity management programme.
Advertisers’ Directory
Advertiser Page
Ametek Inc. 53
Cameron Valves 47
CDI 72
Corrpro Companies, Inc. 81
Denso 63
Enduro Pipeline Services Inc. 02
Energy Global 58
FlexSteel 27
Forain s.r.l. 79
Girard Industries 57
Gulf Interstate Engineering 43
HoldTight Solutions 76
Lincoln Electric 75
Maats Pipeline Equipment 04
Magnatech International IBC
Midwestern OFC, 49
NACE International 61
P.W.T. Srl 39
Pigs Unlimited International, Inc. 35
Pipeline Inspection Co. Ltd 67
Polyguard Products 29
Rosen IFC
Sawyer MFG Company 85
Siemens 31
Stanley CRC-Evans 07
STOPAQ, Seal for Life Industries, part of the Berry Plastics Engineered Materials Division OBC
T.D. Williamson 11
Tulsa Pipeline Expo 76
Vacuworx Global 82
Vermeer 23
Vietz GmbH 36
Volvo Construction Equipment 71
Weatherford 21
World Pipelines 16, 85
Worldwide Machinery 09
Zwick Armaturen GmbH 15

MAGNATECH INTERNATIONAL The Netherlands P (+31) 321 386 677 E [email protected]
WWW.MAGNATECH-INTERNATIONAL.COM
Your all round partner
ALL AROUND THE WORLD User friendly interface Robust design for any
operating environment Use of local labour
Increase productivity Increase quality Lower repair rates High level of support
INCREASE PIPE WELDINGPRODUCTIVITY & QUALITY
lifeguardsLet’s extend pipeline lifetime
Seal For Life Offi ce: Gasselterstraat 20, 9503 JB, Stadskanaal, the NetherlandsManufacturing sites: Houston - USA, Tijuana - Mexico, Westerlo - Belgium, Baroda - India, Stadskanaal - the Netherlands, Dammam - Saudi Arabia