Pioneer Venus Mechanical Roots Pump Test and … · Pioneer Venus Mechanical Roots Pump Test and...
45
NASA CR114660 BSR 4090 Available to the Public Pioneer Venus Mechanical Roots Pump Test and Evaluation (NASA-CR-114660) PIONEER VENUS MECHANICAL N73-31448 ROOTS PUMP TEST AND EVALUATION Final. Report (Bendix Corp.) 44 p HC $4.25 CSCL 13G Unclas G3/15 14355 September 1973 Bendi Aerospace Systems Division https://ntrs.nasa.gov/search.jsp?R=19730022716 2018-06-16T07:59:06+00:00Z
Transcript of Pioneer Venus Mechanical Roots Pump Test and … · Pioneer Venus Mechanical Roots Pump Test and...

NASA CR114660BSR 4090Available tothe Public
Pioneer Venus Mechanical
Roots PumpTest and Evaluation
(NASA-CR-114660) PIONEER VENUS MECHANICAL N73-31448ROOTS PUMP TEST AND EVALUATION Final.Report (Bendix Corp.) 44 p HC $4.25
CSCL 13G UnclasG3/15 14355
September 1973
Bendi AerospaceSystems Division
https://ntrs.nasa.gov/search.jsp?R=19730022716 2018-06-16T07:59:06+00:00Z

ATTENTION REPRO:
,BEFORE PFINTING, CONTACT INPUT FOR PAGINATION
PROCESSOR ___
~iLE O
ar r"7rR~

NASA CR114660BSR 4090Available tothe Public
Pioneer Venus Mechanical
Roots PumpTest and Evaluation
By N. C. Thomas and W. E. Crosmer
Distribution of this report is providedin the interest of information exchange.Responsibility for the contents residesin the author or organization thatprepared it.
Prepared under Contract No. NAS 2-7384 byThe Bendix Corporation
Aerospace Systems DivisionAnn Arbor, Michigan
for
AMES RESEARCH CENTERNATIONAL AERONAUTICS AND SPACE ADMINISTRATION
September 1973
Bendi AerospaceSystems Division

BSR 4090
CONTENTS
Page
1 SUMMARY 1-1
2 INTRODUCTION 2-1
3 PUMP DESIGN AND CONSTRUCTION 3-1
4 TEST PLAN 4-1
4. 1 COMPRESSION RATIO - ULTIMATE PRESSURE 4-1
4. 1. 1 General Description 4-14. 1. 2 Test Procedure 4-1
4.2 THROUGHPUT 4-3
4. 2. 1 General Description 4-34.2.2 Test Procedure 4-3
4.3 EFFECTS OF TEMPERATURE 4-7
4. 3. 1 General Description 4-74. 3. 2 Test Procedure 4-7
5 TEST RESULTS 5-1
5. 1 COMPRESSION RATIO ULTIMATE TESTS 5-1
5.2 THROUGHPUT 5-5
5.3 EFFECTS OF TEMPERATURE 5-5
6 RECOMMENDATIONS AND CONCLUSIONS 6-1
APPENDIX A A-1
ii

BSR 4090
ILLUSTRATIONS
Figure Title Page
3-1 Mechanical Roots Pump 3-23-2 Roots Pump Construction and Assembly 3-33-3 Pump Drive Circuit 3-53-4 Circuit Board Layout 3-74-1 Compression Ratio - Ultimate Pressure Test Setup 4-24-2 Torr - Pascal Conversion Chart 4-44-3 Compression Test Data Sheet 4-54-4 Throughput Test Setup 4-64-5 Throughput Test Data Sheet 4-85-1 Compression Ratio as a Function of Backing Pressure 5-25-2 Thermocouple Calibration Curve 5-35-3 Pumping Speed versus Suction Pressure at 1, 333 Pascals 5-6
Backing Pressure5-4 Pumping Speed versus Suction Pressure at 667 Pascals 5-7
Backing Pressure5-5 Gilmont Flowmeter Calibration Curve 5-8
TABLES
Table Title Page
3-1 Drive Circuit Components 3-63-2 Board Interconnections and Cable Color Code 3-85-1 Pump Input Power 5-4
iii

BSR 4090
SECTION 1
SUMMARY
This is the final report of a follow-on task to "A Study of the Feasibilityof Mechanical Pumps for Use with the Pioneer-Venus Probe Mass Spectrom-eter Inlet System, " Contract NAS2-7384. The objective of this effort was toobtain a small Roots blower from the Arthur Pfeiffer Company of Wetzlar,Germany and to evaluate its performance characteristics.
The pump was obtained, and a limited performance testing program, in-cluding ultimate/compression ratio tests and throughput tests at three differentpump speeds, was performed. Considerable operating experience with thepump was obtained over approximately 200 hours of running. The test resultsshow general agreement with the pump specifications as established by theArthur Pfeiffer Company. The pump was also disassembled and reassembled,in our presence by a representative of the Arthur Pfeiffer Company, so thatwe could perform this operation and so that we might view the design detailsof the pump.
The report presents a description of the pump design and construction,the overall test plan, procedures, test results, and conclusions. Raw dataobtained during the testing is contained in Appendix A.
1-1

BSR 4090
SECTION 2
INTRODUCTION
This report contains the results of a mechanical Roots pump test pro-gram, conducted as a follow-on task to the study effort reported in NASACR 114581. The specific tasks undertaken in this program are:
* Obtain an improved model of the Roots pump produced by theArthur Pfeiffer Company of Germany, consistent with thespecifications contained in NASA CR 114581.
Obtain engineering assistance from the Arthur Pfeiffer Companyfor operational instruction.
* Prepare a test plan and experimentally determine the followingcharacteristics of the Roots pump over its operational range:
Compression ratio as a function of backing pressure.
Pumping speed as a function of backing pressure.
Temperature rise during operational performance testing.
Effect of cooling on pumping characteristics.
Power requirements as related to pumping characteristics.
* Analyze the test results and, from the raw data, calculate theinformation necessary to prepare a graphical representation ofthe pump characteristics.
* Prepare a detailed engineering report containing these results,the raw test data, the conclusions, and the recommendations.
2-1

BSR 4090
SECTION 3
PUMP DESIGN AND CONSTRUCTION
The Roots pump is a small, three-stage pump produced by ArthurPfeiffer Vakuumtechnik GmbH of Wetzlar, Germany. Figure 3-1 shows theexternal configuration of the pump. The pump is a cylinder approximately11 cm in diameter by 14. 7 cm high weighing 3. 4 kg. This pump is a secondgeneration feasibility demonstration model of the pump. Further flight unitdesign refinements would result in a weight reduction of from 0. 5 to 1. 0 kgand materials changes required to make the pump compatible with the expectedflight environment. Details of the pump construction and assembly are shownin Figure 3-2.
Figure 3-2(a) shows the pump main shaft. From left to right, the com-ponents are a nut, a washer, a spring, a ball bearing, the first (suction)piston, a spacer ring, the second piston, a spacer ring, the third piston, agrooved spacer ring, a self-aligning bearing, gear hexagonal nut, and therotor (permanent magnet) of the drive motor. Figure 3-2(b) is the housing ofthe first stage viewed from the top and Figure 3-2(c) is the housing viewedfrom below. Figure 3-2(d) shows the first stage assembly complete. Fig-ure 3-2(e) shows the partitions between the first and second stage and thesecond and third stage. Figure 3-2(f) shows the completely assembled secondstage with the partition and the pistons and spacer rings of the third stage.Figure 3 -2(g) shows the housing of the third stage, with the self-aligningbearings in place. Figure 3-2(h) shows the completed assembly of the stages,with the rotor of the drive motor in place.
Figure 3-3 is a schematic diagram of the drive circuit. Table 3-1 liststhe component values. The electronics unit and the pump are interconnectedthrough a cable and a 19-pin connector. Figure 3-4 shows the top and bottomof the circuit board contained within the package. The board interconnectionsand cable color-coding are given in Table 3-2.
To adjust the electronics for proper motor operation, the switch pointsof operational amplifiers OP 1 through OP 4 are adjusted by potentiometersP 1 through P 4 so that square-wave signals of equal width appear on the out-puts of resistors R 21 through R 24. Clockwise adjustment of the potentiom-eters results in shortening the switching time of transistors T 5 through T 8.Speed control is provided by adjustment of potentiometer P 5. Clockwise ad-justment reduces the speed.'
3-1

I
1
1 1II
I~aI
50,
a 'a
I-:3~ ~ Fiur -1MehnialRot P
3- 3-2a- ~ -r --

BSR 4090
I ~ ;-1
Ii-I- '00:IiI-;
I (a Pum Man Shft b) FrstStag Hosing To
I:I -V-
(c)~~~~: Fis tg osng otm()Cmpee is tgI :: ~
13-

BSR 4090
I
(e) Stage Partitions if) Completed Second Stage
, ... .. . - ,
(g) Third Stage Housing (hi Completed Assembly with Drive Motor Rotor
Figure 3-2 Roots Pump Construction and Assembly (Cont. )
I
I -

11619-1
OP OP2 OP3 OPP
RI 13 R13 T5 R15 R3 I R17 T 19 8a
2 3 1 R5 R21 5 R R 2 6 11 12 R R2 3 7 Rg R24
T1 51 S3 T2 H 2 S 18
C C 3C1 C2 1 C
R2 1 16 18 20
1 22 [ R30 35 R3 3 18
DR
R11 CD
3,15.16 "
Figure
R32
3-3 Pum Drive
Circui
Figure 3-3 Pump Drive Circuit

BSR 4090
Table 3-1
Drive Circuit Components
ReferenceDesignation Part Value
C1 - C4 Capacitor 33 pF (20 V)C5 Capacitor 100 nF (20 V)C6, C7 Capacitor, Electrolytic 4. 7 p.F (20 V)C8 Capacitor, Electrolytic 0. 1 gF (20 V)C9 Capacitor 56 pF (20 V)C10 Capacitor 22 nF (20 V)D1 - D3 Diode, Silicon BAY 19H1, H2 Hall Probe SBV 556OP1-OP5 Operational Amplifier TAA 861AP1 - P4 Potentiometer 1 kohm (0. 3 W)P5 Potentiometer 500 ohms (0.3 W)RI - R4 Resistor 240 ohms (0. 3 W)R5 - R10 Resistor 12 kohms (0.3 W)R11 Resistor 2 kohms (0. 3 W)R12 Resistor 5.6 kohms (0.3 W)R13 - R20 Resistor 2. 2 kohms (0. 3 W)R21 - R24 Resistor 470 ohms (0. 3 W)R25, R26 Resistor 33 kohms (0. 3 W)R27, R28 Resistor 2.7 kohms (0. 3 W)R29 Resistor 20 kohms (0. 3 W)R30 Resistor 4.7 kohms (0. 3 W)R31 Resistor 1. 2 kohms (0. 3 W)R32 Resistor 13 kohms (0. 3 W)R33 Resistor 390 ohms (0. 3 W)R34 Resistor 270 ohms (0.3 W)R35 Resistor, Adjustable 250 kohms (0. 3 W)T1 - T4 Transistor, NPN BC 107BT5 - T8 Transistor, PNP BD 136-10T9 Transistor, NPN 2 N 3055S1 - S4 Motor Coil
3-6

BSR 4090
0- - .
4 3 o15
S11' 2
708 AS0 o
S' e
1Pjo b0,2- 0 R 2 2
708006 0
21o F
.. , // 0080~811-I1
Figure 3-4 Circuit Board Layout
3-7

BSR 4090
Table 3-2
Board Interconnections and Cable Color Code
SolderingLug Strip Connection Cable Color Plug Pin
1 HZ control current green F
2 HZ control current green G
3 T9 emitter (connectedwith 15)
4 T9 base yellow
5 T5 collector red A
6 T6 collector red B
7 T7 collector red C
8 T8 collector red D
9 + 12 V power supply(connected with 21)
10 Not used
11 H2 signal green H
12 H2 signal green J
13 Hl control current yellow K
14 HI control current yellow L
15 Power supply ground black socket on front panel
16 Power supply ground(connected with 15)
17 Star point of motor coils black E
18 T9 collector (connectedwith 17)
19 Output for rpm indicatof yellow socket on front panel
20 Not used
21 +12 V power supply red socket on front panel
22 Not used
23 HI signal yellow M
24 HI signal yellow N
B K M "r" figure stamp on
C 0 0O' L stator laminations
A 0 2 3 001 ONDO
JO
G00 0 E Motor Socket
H F
3-8

BSR 4090
SECTION 4
TEST PLAN
This section of the report contains the test plan for the Pfeiffer Rootspump. Three types of tests are performed: (1) compression ratio-ultimatepressure, (2) throughput, and (3) effects of temperature and power character-istics.
4. 1 COMPRESSION RATIO - ULTIMATE PRESSURE
4. 1. 1 General Description
A series of tests under "no flow" conditions are performed to determinethe ultimate obtainable pressure and compression ratio as a function of thebacking pressure. Pump power and temperature are monitored during the tests.Figure 4-1 shows, schematically, the test manifold that is used for this pur-pose. It is constructed from 3/8 in. stainless-steel tubing and Teflon-sealedbrass Swagelok fittings and valves. The combination of a mechanical pump,throttle valve, and air leak on the output side of the pump are used to main-tain a desired output pressure. Beryllium copper and molecular sieve trapsare used to minimize mechanical pump oil backstreaming. The test dome isactually nothing more than a 3/8 in. Swagelok cross.
4. 1. 2 Test Procedure
4. 1. 2. 1 Preparation
With the throttle valve open, the entire system is evacuatedand purged with dry nitrogen (LN 2 boil off) to ensure a controlled atmos -phere.
4. 1. 2. 2 Setup
Once purged, P 2 is set to 10 3 pascals (Pa), the first test pressure,and allowed to stabilize. A combination of valve throttling and N 2 flow is usedto establish the test condition. It is not essential that the pressure be accu-rately set.
4-1

11619-4
Alphatron Filter N 2
Gauge
LeakPl1
Ion Gauge Test 1Dome
Si Throttle
Roots Pump Valve
Cold MechanicalTrap Backer
Figure 4-1 Compression Ratio - Ultimate Pressure Test Setup

BSR 4090
4. 1. 2. 3 Pump Performance
Once stabilized, the pump is turned on and set at the lowest test speed.This causes a transient change in P 2 , and time must be allowed for conditionsto restabilize. Pressure (in and out), temperature, and power are recorded.
Next, the pump power is changed to increase the rotation rate to thenext test level. Again, time must be allowed for pressure stabilization beforethe data are recorded. A third pump speed is desirable and is used, subjectto the recommendations of the Pfeiffer Company.
After the above-described test is completed, the throttle valve isslowly opened and power to the pump is reduced for slow rotation operation.P 2 is set at the second value, and the performance test is repeated as above.Figure 4-2 is, essentially, a conversion chart of torr to pascals, but thevarious settings of P 2 anticipated for this test are also shown. Figure 4-3 isan example of the type of data sheet used.
4.2 THROUGHPUT
4. 2. 1 General Description
The test manifold used for ultimate pressure testing includes plumbingwhich permits a controlled flow of nitrogen to be added at the input of the pumpfor throughput measurements, as shown in Figure 4-4. Because of the through-put condition, the backing pressure, P2 , can be adjusted by the throttle valvealone.
4.2.2 Test Procedure
4. 2. 2. 1 Preparation
No additional preparation steps are necessary if the throughput testsdirectly follow the ultimate tests. However, if the pump or manifold were re-exposed to the atmosphere, the procedure described in Section 4. 1. 2. 1 shouldbe repeated.
4. 2. 2.2 Setup
First, a throughput of 2.5 x 10 - 3 torr 1/s (the lowest measurablequantity in this manifold) is established. Next, pressure P 2 is set to 10-3 P aand allowed to stabilize. As noted, this can be accomplished through the useof the throttle valve alone.
4-3

BSR 4090
102
104
Torr Pascals
G P2
1
101
1010
10
10-2
I-. 10 .3
10"1
Figure 4-2 Torr - Pascal Conversion Chart
4-4

BSR 4090
Test: Compres sion/Ultimate Date:
Pz (Set) P1 P1 (Read)
Pa Torr Actual Torr Pa I V T
rpm-3
1 7.4x 10-Z
4 3x 10_ 1 2
1 x 10 7.4x 101 -1
4 x 10 3 x 10
1 x 10 7.4x 10
4x10 33
xl10 7.4
rpm ---
-31 7.4x 10
-24 3x10
-21x 10 7.4x 10 ..-- - -- , - -- i
-14x 10 3x 10
1 x 10 7.4 x 10..... ..i--- . - -.. -
4x 10 33
xl10 7.4
rpm
1 7.4 x 10- 3
4 3x 10 2
-2Sx 10 7.4x10⁻¹ ---- .-- -
4x 10 3 x 10
1x 10² 7.4x 10 -
O 4x 10 3~ - -2
-- ----__i_ _ II1 x 10 7.4
Figure 4-3 Compression Test Data Sheet
4-5

11619-3
Ion GaugeAlphatron
GaugeVI TI T2R
Gilmot Flow Meter LeakVal
. . 0 Leak Filter NThermal Valve
N 2 Filter - onductivity Test" I I Flow Dome PO
a Meter
Roots Pump hrottle 1Valve o
lphatronGauge Mechanical
Pump
Figure 4-4 Throughput Test Setup

BSR 4090
4. 2. 2. 3 Pump Performance
Once stabilized, the pump is turned on at the lowest test speed. Thiswill cause a transient change in P?, and time must be allowed for conditions torestabilize. Pressure (in and out), temperature, and power is then recorded.
Next, the pump power is changed to increase the rotation rate to thenext test level. Time must be allowed for pressure stabilization before thedata are recorded. If possible, a third rotation rate is used.
Having completed tests using one flow rate, the pump power is re-duced and the flow rate is increased to the next test level. Figure 4-5 showsthe data sheets used in this test.
4.3 EFFECTS OF TEMPERATURE
4.3. 1 General Description
The Roots pump performance is affected by temperature, especiallywhere the heat of compression becomes a major factor. Some selected testsare performed to determine the extent of the problem.
From the previous tests, two conditions can be chosen; one wheretemperature rise was a minimum (zero throughput most likely) and the otherwhere the temperature rise of the pump was significant. These tests are re-run with an attempt to increase and/or decrease the temperature of the firsttest.
4. 3. 2 Test Procedure
4. 3. 2. 1 From the previous data, a test of approximately two hours durationis selected in which there was a minimum temperature rise. Duplicating con-ditions are set up and the test is rerun. During the test, thermal insulationis added and the test is rerun.
4. 3. 2. 2 From the data of the tests described in Sections 4. 1 or 4. 2 where asignificant temperature rise was observed, a test is selected. Duplicatingconditions are set up and the test is rerun. Forced air cooling is added andthe test is rerun.
4. 3. 2. 3 The test described in Section 4. 3. 2. 2 is rerun but with insulationadded (no cooling).
4-7

11619-9
rpm Date
Torr Backing Pressure Pa
Pump1 1 Flow Speed Temper-
Flowmeter (Torr) (Pa)j(Pa liters/sec) (liter/sec) ature Voltage Current
Reading Std ml/min
'0
Figure 4-5 Throughput Test Data Sheet

BSR 4090
SEC TION 5
TEST RESULTS
This section of the report contains the test results as reduced from theraw data contained in Appendix A.
5. 1 COMPRESSION RATIO ULTIMATE TESTS
Tests were performed for 8, 000, 7, 000, and 6,000 rpm rotation. Theresults are plotted in Figure 5-1. The results show a maximum compressionratio of 6,500 at 400 pascals. The Pfeiffer Company data presented in CR114581 shows a compression ratio of about 2200. Pfeiffer subtracts the back-ground pressure from the pressure reading before computing the compressionratio. Our data was computed directly from the pressure readings. When thePfeiffer data is computed in this manner, good agreement is obtained. As aresult of this test, it was found that an ultimate pressure of 6. 1 x 10⁻² pascals(5 x 10- 4 torr) could be obtained at 400 pascals (3 torr) backing pressure and anultimate pressure of 2.5 x 10⁻¹ pascals (1. 9 x 10- 3 torr) could be obtained at1, 333 pascals (10 torr) backing pressure. However, it should be clearly notedthat complete bakeout and sealing of the test setup was not accomplished priorto the test.
During the tests, difficulties were experienced in attempting to achievea leak-tight test setup. The difficulties were primarily experienced in the testarticle (pump) itself. It was found to leak around the inlet and outlet joints,where an epoxy cement had been used to join the tubing to the pump body, andaround the interstage structure, where O-rings are used for sealing. Thesedifficulties were overcome through the use of vacuum sealing compound andit was possible to proceed with the tests.
Maximum temperature rise experienced during the tests was 3. 9C.Figure 5-2 shows the thermocouple calibration curve used. Thermocoupleswere mounted on the top and bottom of the pump. The thermocouples werenearly in agreement (within 2.5 °C), indicating nearly uniform temperaturethroughout the pump. Power level was found to remain constant up to a backingpressure of 40 pascals (0. 3 torr), where it began to rise. Maximum powerinput at 1, 333 pascals (10 torr) backing pressure and an 8, 000 rpm rotationrate was found to be 11. 25 watts. The input power required is summarizedin Table 5-1.
5-1

11619-10
104
- 8000 rpm
7000 rpm
6000 rpm
103
CL
Eo
10
10 1 100 101 102 103 104
Backing Pressure (Pascals)
Figure 5-1 Compression Ratio as a Function of Backing Pressure

BSR 4090
45
40
35
E
20
0.9 1.0 1.1 1.2 1.3 1.4 1.5 1.6 1.7 1.8Output (mV)
Figure 5-2 Thermocouple Calibration Curve
5-3

BSR 4090
Table 5-1
Pump Input Power
Backing InputSpeed Pressure Compression Power(rpm) (pascal) Ratio (watts)
8,000 1.933 181 9.43.999 375 9.4
10.131 950 9.439.99 2,609 9.498.64 3,895 9.6
399.9 6,521 10.0926.4 5,792 11.1
1,333.0 5,263 11.2
7,000 1.08 85.3 9.24.07 321 9.29.998 789 9.2
39.99 2, 143 9.299. 31 2,980 9.3
386.6 4,874 9.7979.8 4,742 10.5
1, 333. 0 4,167 11.3
6,000 1. 12 65 8.83.73 215 8. 810.0 556 8. 841. 3 1,550 8. 898.6 2,508 9. 1
386.6 4,028 9.3973. 1 3,560 10.2
1,333. 0 3,175 10.5
5-4

BSR 4090
5. 2 THROUGHPUT
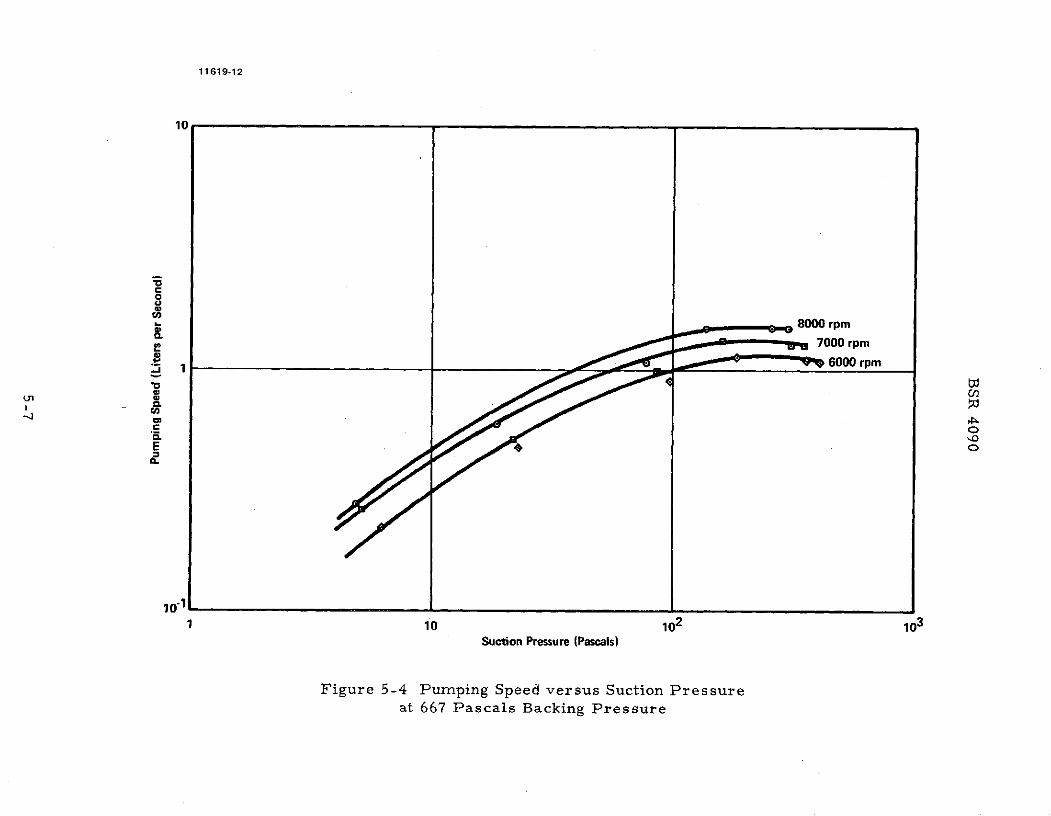
As a result of initial testing, it was found to be much simpler to set aspecific backing pressure and make measurements at various flow levels thanto set the flow level and vary the backing pressure. Therefore, the data weretaken in this manner. Figure 5-3 is a plot of pump speed versus inlet pres-sure for speeds of 8, 000, 7, 000, and 6, 000 rpm and a backing pressure of1, 333 pascals (10 torr). Figure 5-4 is the data obtained at 666. 5 pascals(5 torr). Maximum temperature rise during these tests was about 2"C. Maxi-mum power input at 8, 000 rpm and 1, 333 pascals (10 torr) backing pressurewas 16. 4 watts. At 667 pascals (5 torr) and 8, 000 rpm, the power input was12. 5 watts.
The calibration curve utilized for the Gilmont flow meter is given inFigure 5-5. The figure can be used to convert flowmeter readings to standardmilliliters per minute. Milliliters per minute were then converted to pascalliters per second by multiplying by 1.685.
The data show a maximum pumping speed of 1. 5 liters per second at8, 000 rpm and 1, 333 and 667 pascals backing pressure. This agrees withthe Pfeiffer Company data.
5. 3 EFFECTS OF TEMPERATURE
Since no noticeable temperature effects were observed during the com-pression and throughput testing, the temperature effect test was deleted fromthe effort.
5-5

11619-11
10
8000 rpm
,K 7000 rpm
1 __ 6000 rpm
C
10-11 10 102 103
Suction Pressure (Pascals)
Figure 5-3 Pumping Speed versus Suction Pressureat 1, 333 Pascals Backing Pressure
11619-12
10
0
8000 rpm
- 7000 rpm
S1 '6000 rpm
• rn
10-11 10 102 103
Suction Pressure (Pascals)
Figure 5-4 Pumping Speed versus Suction Pressure
at 667 Pascals Backing Pressure

11619-13
STD* D .0625" W, .00530 GM p v 2.53 GM/ML STD*
AIR ML/MIN /-,- " R WATER ML/MINAIR M MIN MEASURED AND FLOWING AT 1 ATM. AND 70' F. 25
260 -- .0
240
220 .i.t*t ii t- : ::t i : i 40
40 . :.0.
0::
++; r ... ..'' ... iI t I • , . . . . . . .. . . . . . . . . . . . . . . . . . , i. ' .. ..
0.540
t- - .010 0.1i 1 T-110 .0
0 10 20 30 40 50 60 70 80 90 100
SCALE READING AT CENTER OF BALL
Figure 5-5 Gilmont Flowmeter Calibration Curve
t: t~ ;i;fSCALE READING AT CENTER OF BALLt' . -. - t -r :

BSR 4090
SECTION 6
RECOMMENDATIONS AND CONCLUSIONS
Because of limited budget and test time restrictions, it was impossible
to establish a clean, leak-free, test setup. Therefore, it is rather difficultto establish any conclusive, quantitative data regarding the Roots pump. How-
ever, the general performance from some data points has been achieved. In
general, the data are in agreement with the pump specifications as establishedby the Arthur Pfeiffer Company, i.e. , compression ratio about 5,000 at 1. 33x103 pascals and pumping speed about 1. 5 liters per second at 1. 33 x 103pascals. However, ultimate pressure measurements of 3. 33 x 10-1 pascalsat 1.33 x 10³ pascals backing pressure or 10-1 pascals at 6.67 x 10² pascalsbacking pressure are very uncertain because of the test setup and pump leak-age problems. Consequently, it is recommended that further tests be con-ducted to establish quantitative performance figures for the pump. To performthese tests, it is recommended that the Roots pump be completely disassembled,cleaned, and lubricated with appropriate lubricants for long-term high-vacuumoperation, and that all joints and fittings be reworked to accept O-ring sealsfor leak-tight operation. (It is noted that the input/output plumbing and inter-stage plumbing was attached to the pump and sealed with epoxy. This shouldnot be done if any handling, particularly with respect to making or breakingof joints in the lines, is required. ) The interstage structure of the pump shouldbe cleaned and properly sealed with fitted O-rings. A complete vacuum bake-out of the pump at about 100°C for at least 24 hours should then be accomplishedto clean it up. Provisions should be made to test the three stages separately.
Insofar as possible, the test setup was leak-tested with a mass spec-trometer leak detector and found to be leak-free. However, considerablechanges were made during the testing, the most notable being the addition ofthe two Alphatron gauges required to accommodate the wide pressure rangeexperienced. One of these gauges was found to be dirty and extensive bakeoutwas required to clean it up. A new, clean test setup should be assembled.
Finally, it is recommended that a Pioneer-Venus mass spectrometerinlet engineering breadboard model be built and tested to achieve the objectiveof an inlet system preliminary design. The following specific tasks are recom-mended:
* Build engineering breadboard model, complete with vacuum orchemical ballast, restrictors, etc.
* Test over the entire operating range with a Venus model test gas.
6-1

BSR 4090
* Make mass spectrometer measurements to determine extentof chemical pump or lubrication problems.
* Analyze and test system for worst-case conditions and single-point failure possibilities.
* Provide an inlet system preliminary design.
As a first step in the buildup of the engineering breadboard, the presentmechanical pump should be tested in combination with the available chemicalpump ballast to determine if a compatible operation can be achieved and toobtain preliminary test data. More extensive inlet system breadboard testsshould utilize a third generation pump which should be built more along theflight specification lines, i. e. , materials should be selected for compatibilitywith higher temperature bakeout, construction should be lighter and in theflight configuration, and complete interstage sealing including welding shouldbe used (this might include flanges which could be ground off if disassemblywere required).
6-2

BSR 4090
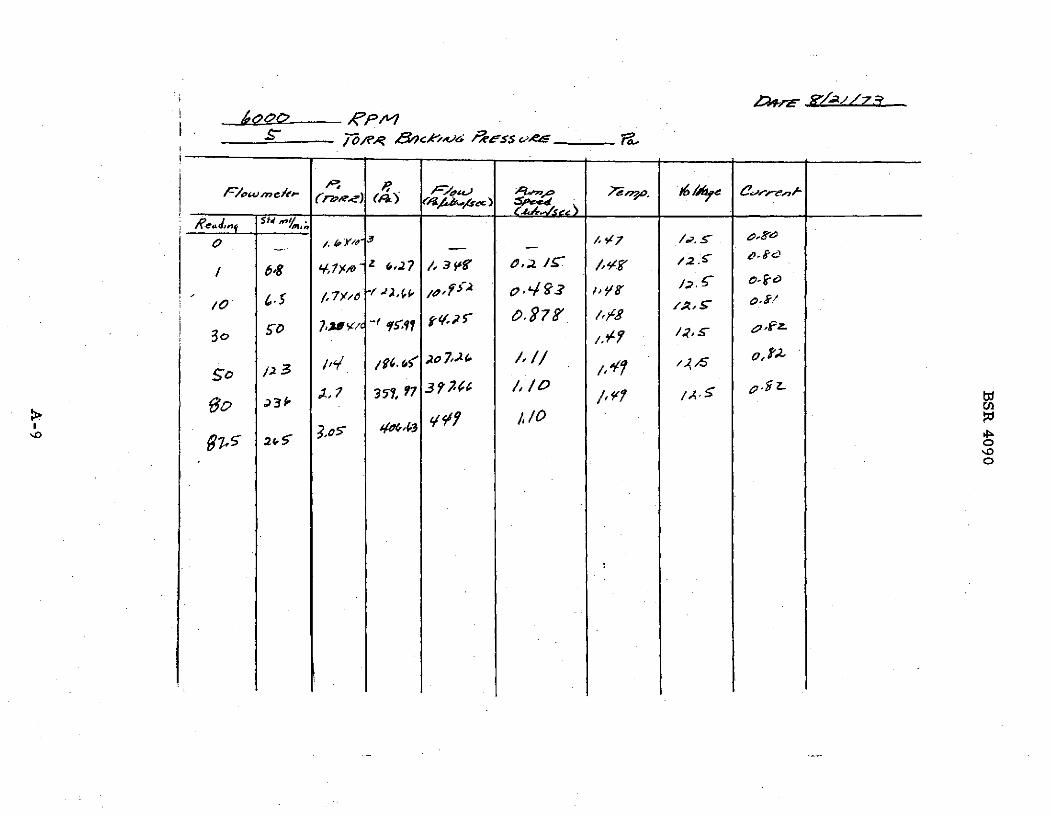
APPENDIX A
This appendix contains the raw data obtained during testing, along withthe calculations performed.
A-i

BSR 4090
TEST: _'_' _ . .. DATE: ' 7-3
FLOW: -_ K .
Pl. SET) P2 PI (RIAJD)
PA TORR ACTUAL TORR - I V Ta
A 3RPM IY/d o /4/ ,7Y6 / , _
1 7.4x 10 - 3
4 3x 10 - 0. ioo. o 3 .7 o 2. /,24 12 ,,o
x 101 7.4x 10⁻² -7Y; O..pgy o7 0 /.(-, /.2- z
4x101 3x10⁻¹ 3,2:Y 0 - ! 4. " 2,0GO .7/3 / /5 z .
1 x 10 7.4 x 10 - 1 .q7,, 1 o 1 o'3 75' . /. '.3 /,17
4 x 10² 3 3 / 652.1 0.790 Iz,. /3 o
I x 103 7.4 (,9 .L'//D' f--7 L ,
I -,-ooo -/ - ---- " r1 7.4x 10- g/;,/'-3 o.os ' .3 0.4o , (3/ . 3//,
4 3x 1o-2 3.ox/o .o)cs 3Z/ 0.730 /, , ,_-
1 x 10 7.4 x 10 - 2 4 0) 0 W ,0d, 7Al 3 , -
4x10 3 x 10- 1 ", / '
S x 10 7.4x101 o -/I , '~~-$3 1 , .70 /.4 ?o.,
4x 10² 3 .__ X/.,37 i.q o.7 70 13 21 x 10 3 7.4 7,J5" . . 7r. . A
/ , /G7 O0 , C / /7
Td- 2z-7 RPM
1 7.4 x 10⁻³ //o 1 .7tG , 7 3
4 3 x 10o- 13 .//o'0 o.7o0 /, 3 L.
1 x 10 7.4x 10" 7,5$/0.Z I ,/ o " .700 , '
4 x10 3 x 10 "' .... _Z )// 1 o j _Io 700 /,2, , / ,
1x 1 0 2 7.4x 10⁻¹ 7-,4-/z o.z'9 -<'J "O 2.72o /1 ,(, /'37 /.30
4x 10² 3 .1. ' 72L/ 7 / 7 O 12-6 137:/,31x 10 3 7.4 7,3 Z05)qS f 335o O'lto 12, / ,3,
/O 4 X-s,9175' O3 /.. /Fl S-.A.
A-2

BSR 4090
TEST: DATE: - 7 Z-
FLOW: ___ ___ _ 3 , ,
P?, ISET) 2 P (READ) I
PA TORR ACTUAL TORR _____ I V T3S00 RPM I. 1
1 7.4x10 3 fe/O 3 o007o /23 P /z, /13- L3z
4 3 x 10 -2 3xIo f -0-4V3 0.<90 / ~ /5
Ix 101 7.4 x 1 0-2 71 04 I 9 2 /" 1
4 x 101 3 x.10- 1 / ~ " /,I
1 x 10² 7.4 x 10⁻¹ 7 -,551 04X -s 2 0,690 /z, 6 ~35 ~o
4x10² 3 z 9 __ 347/x'O
1x 10³ 7.4 7,3 77-5- So / , Af-
RPM
1 7. 4 x 10
4 3 x 10⁻² - 00 __
1 x 10 7.4 x 10⁻², 7
4 x 10 3 x 10⁻¹ . ' 7/ '
1 x 10 2 7.4 x 10⁻¹
4x 10 2 3
1 x 10³ 7.4
RPM
1 7.4 x 10 - 3
4 3 x 10-2
Sx 10 7.4 x 10⁻²
4 x 10 3x 10⁻¹
1 x 10² 7.4 x 10⁻¹
4x 10² 3
1 x 10 3 7.4
A-3

-7, g E,,Lk, ,d$ .2d
-,7~~11 g /~ /,//4 Idt9E~4P
04 ~0 1.31N? O.A5 A
/ /33.3/o ~o o. LT / 75 ~ P /.go (0'(P /40- S 9'7 /1 133/0
3 0 s o /33,37- ;2o7. 2 / z
S0 103 9, ,20
go .236 3,7 Z AL
A '17 3 E
47 d- 3 3o 9 d "~ "c
C>

"PI Yon~. I'fe C ,v-l
/,S I v~t.?~2B
e0Z-4-.O 3 8 Y CO,5- 4VcA to
8.70. 0AIZP47' 361,76 S4-i-. 5,2

SO /.P4
F/owZcode - for rdJ744~r/c /3(se ) x 5",go d <&/*,er/
/en anr 1A IH ayo ,s x/u - / I 3 7 /d. o- 95
/,7o ZaL 7, oI*V3 7, a ,75
.ggo &<{,a 0.J -, 3 < 7sJo fo ,,ag /LG.65do 7,26 /,;Z// */ ,e-7
So /3.9tr,sr 3 9.4/ 377- /
Go '3
a ct ;Iq 313)o 4V9,# /1 /9 wOsls.sl
0 II ' iI'

F/owCI, Ise,'-~
/~~~ 3w/o- '
3o VOW;X~ 77,97 Ah.~, 10 ~ /'
g5O C-y 4 I
E0
gt* -20

S4TY
/0 ~ ~ 133 2-7a I- ~ o."9
%0
lop"~ 16CW Af's e~~__ _
P=/owme/<~ -mr fa7or4 2;p 'o wra,
f y , #9- I~ /r eZ.-.-r-..
Sidrecad,,, so m,,y .(- A ~?. 9e7
/I I/ 1( 12.:!;V 7'o,
'/0
L9gy 02 SO/. N
30 5 c
$'o i3 ' /,,4* /o?/ / /
, 7 37, 17 37 ,& /, /
97,5- 2(. 5
BFo '0(
(7, E 2<e 0

BSR-4090
TEST: 7 .f 'F I , DATE: */'o/73
FLOW:
P? (SET) 2 P (READ) &-
PA TORR ACTUAL TORR PA m V
-RPM ,, /. a .
1 1 4x0'3- /2 S O,Y'k3- .zF
4 3 x10o- /O ,.. .o0 - 1 7 t ro 35- .1 14
IxlO x10-2 /o/v .o- Ioo /g. ,, I/4. - ' qg
4x 101 3 10-1 /O - 75,' 50,0 ,0.0 , L 6 8
Ix 102 7.4x10- 1 790 I__xl __.4 1 °1 /oo-' s.s~ .,," " 3-.o 6k0-T?I-.7z,
lx O 7.4 /OY,, Z,"," /',7- O. 4.0 i3,O,23- I2,d
1 4x.o- o-
4 sx 10-2 /c #<r, 2.35 3),3 O.o 23 -7,7 -/,2
1 x 1 7.4x 10⁻² / 19 7O 3(. .C) 2L7-. 90 9-I-1
4x10 x
1 x 102 7 x'10-1
4x 10² 3
1x 10 3 7.4
1 7.4 10-3
4 3 x 10⁻²
1 x 10 7. 4x 10⁻²
4x 10 3 x 10-
1 x 10² 7. 4x 10⁻¹
4x 10 2 3
1 x 10 3 7.4
A-10

5s; X3le 313 *ogqa
7q; (,7
/ , I5-
/0,0 & 33 t
57 3 .533 3 76 c
100
.4*jl

su 0.
-3 23.70 '
3,75-x "" o
6-0
93s10 o
/ 4
70. 44-cC,