Pinto Pm2 Ism Ch13
66
INSTRUCTOR’S RESOURCE MANUAL CHAPTER THIRTEEN Project Evaluation and Control To Accompany PROJECT MANAGEMENT: Achieving Competitive Advantage By Jeffrey K. Pinto Copyright © 2010 Pearson Education, Inc. Publishing as Prentice Hall 1
Transcript of Pinto Pm2 Ism Ch13
INSTRUCTOR’S RESOURCE MANUAL
CHAPTER THIRTEENProject Evaluation and Control
To Accompany
PROJECT MANAGEMENT: Achieving Competitive Advantage
ByJeffrey K. Pinto
Copyright © 2010 Pearson Education, Inc. Publishing as Prentice Hall
1
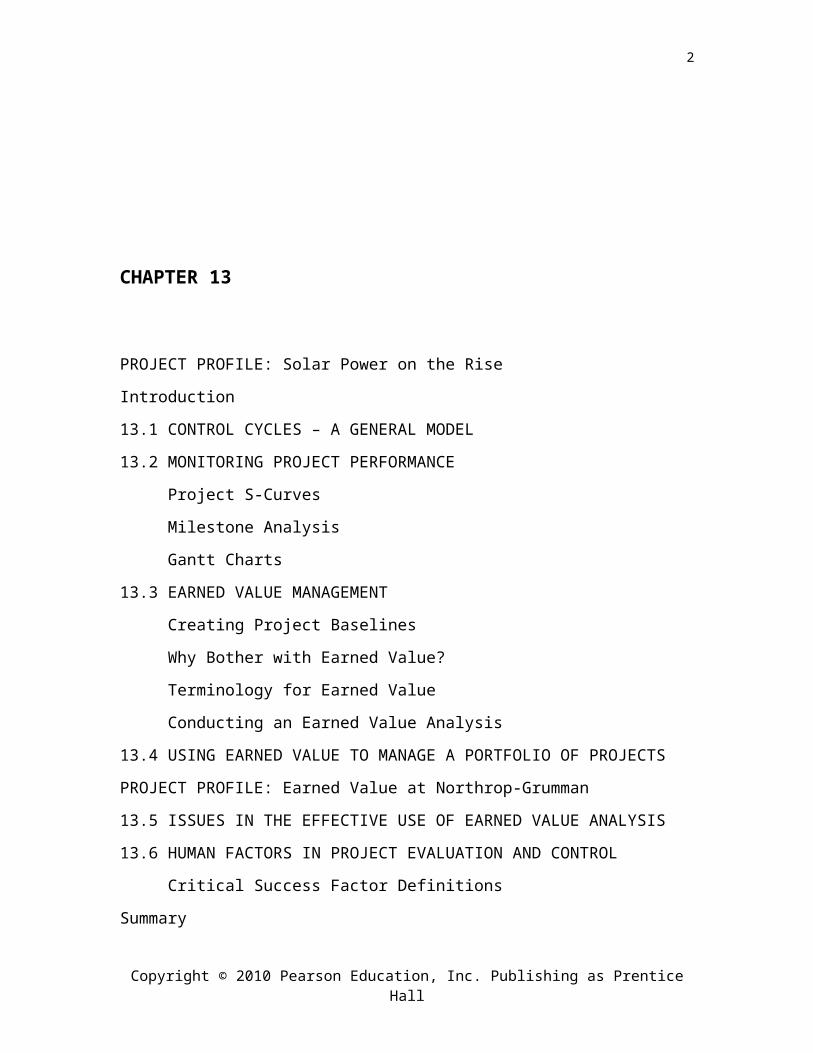
CHAPTER 13
PROJECT PROFILE: Solar Power on the Rise
Introduction
13.1 CONTROL CYCLES – A GENERAL MODEL
13.2 MONITORING PROJECT PERFORMANCE
Project S-Curves
Milestone Analysis
Gantt Charts
13.3 EARNED VALUE MANAGEMENT
Creating Project Baselines
Why Bother with Earned Value?
Terminology for Earned Value
Conducting an Earned Value Analysis
13.4 USING EARNED VALUE TO MANAGE A PORTFOLIO OF PROJECTS
PROJECT PROFILE: Earned Value at Northrop-Grumman
13.5 ISSUES IN THE EFFECTIVE USE OF EARNED VALUE ANALYSIS
13.6 HUMAN FACTORS IN PROJECT EVALUATION AND CONTROL
Critical Success Factor Definitions
Summary
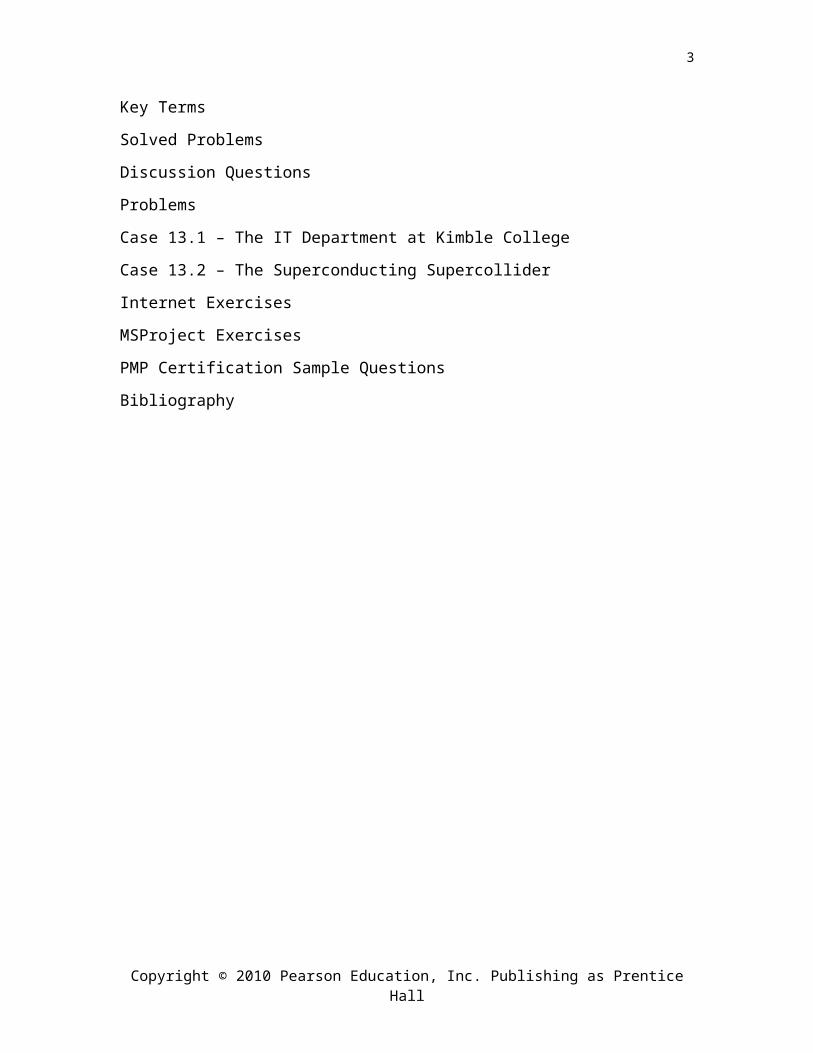
Key Terms
Solved Problems
Discussion Questions
Problems
Case 13.1 – The IT Department at Kimble College
Case 13.2 – The Superconducting Supercollider
Internet Exercises
MSProject Exercises
PMP Certification Sample Questions
Bibliography
Copyright © 2010 Pearson Education, Inc. Publishing as Prentice Hall
2
TRANSPARENCIES
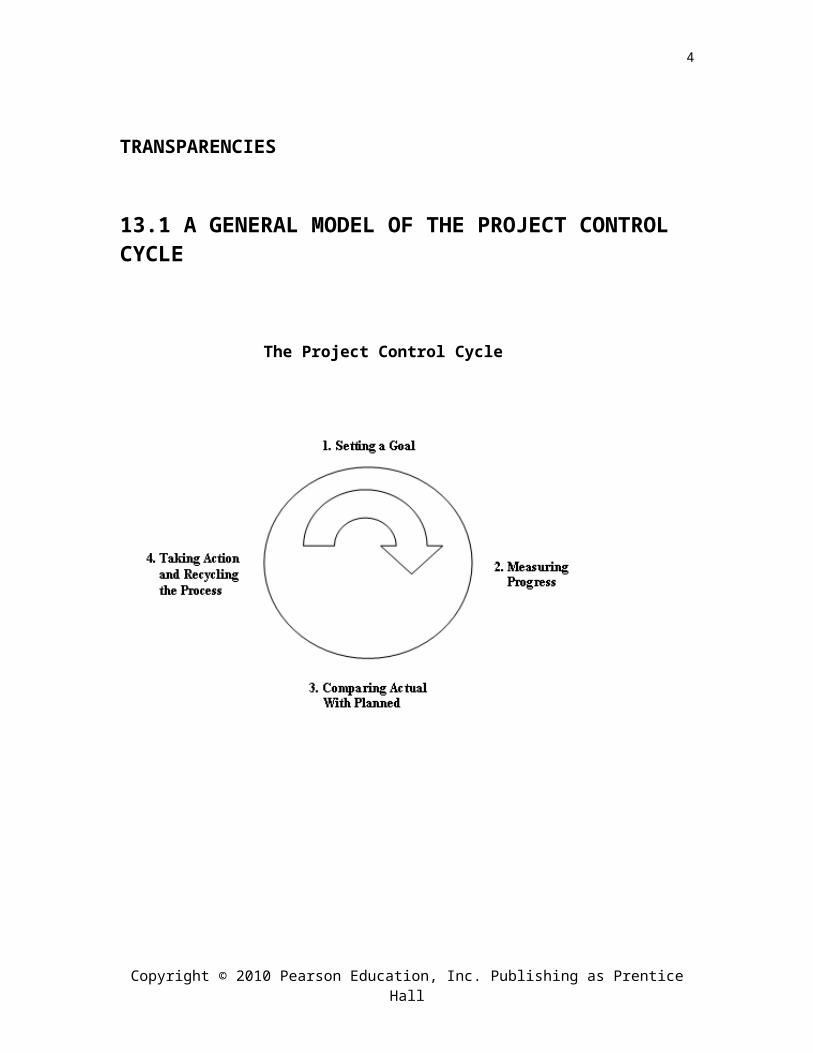
13.1 A GENERAL MODEL OF THE PROJECT CONTROL CYCLE
The Project Control Cycle
Copyright © 2010 Pearson Education, Inc. Publishing as Prentice Hall
3
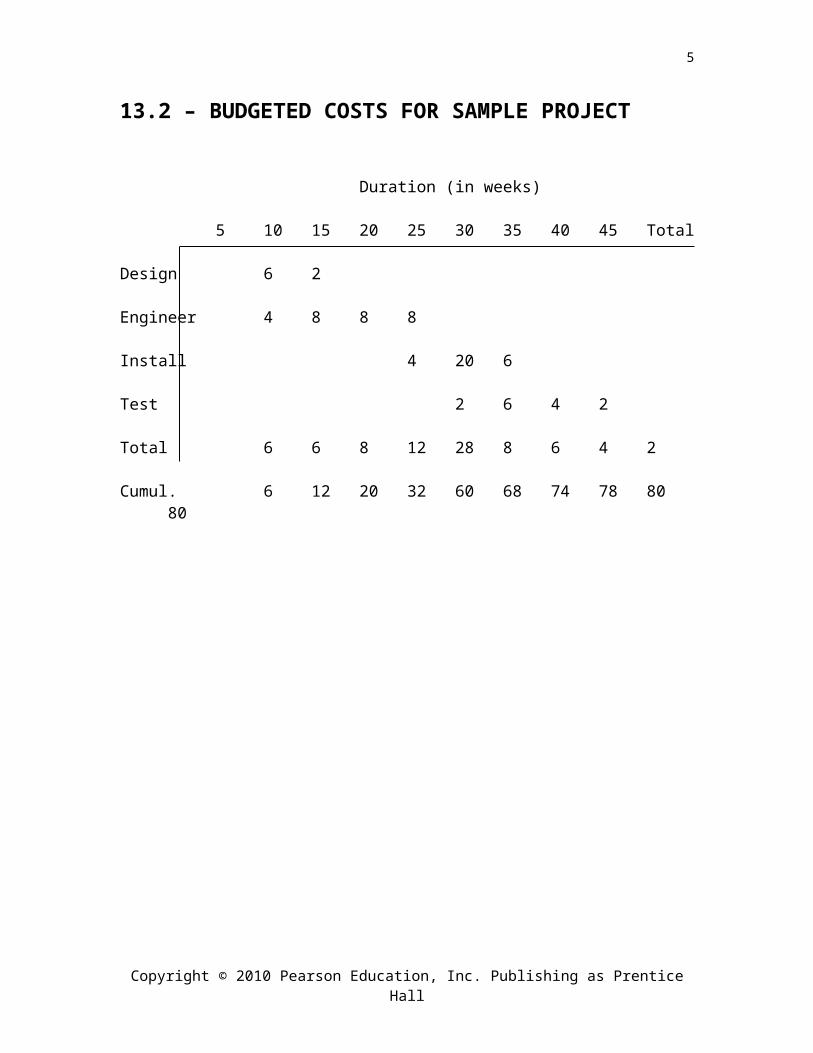
13.2 – BUDGETED COSTS FOR SAMPLE PROJECT
Duration (in weeks)
5 10 15 20 25 30 35 40 45 Total
Design 6 2
Engineer 4 8 8 8
Install 4 20 6
Test 2 6 4 2
Total 6 6 8 12 28 8 6 4 2
Cumul. 6 12 20 32 60 68 74 78 80 80
Copyright © 2010 Pearson Education, Inc. Publishing as Prentice Hall
4
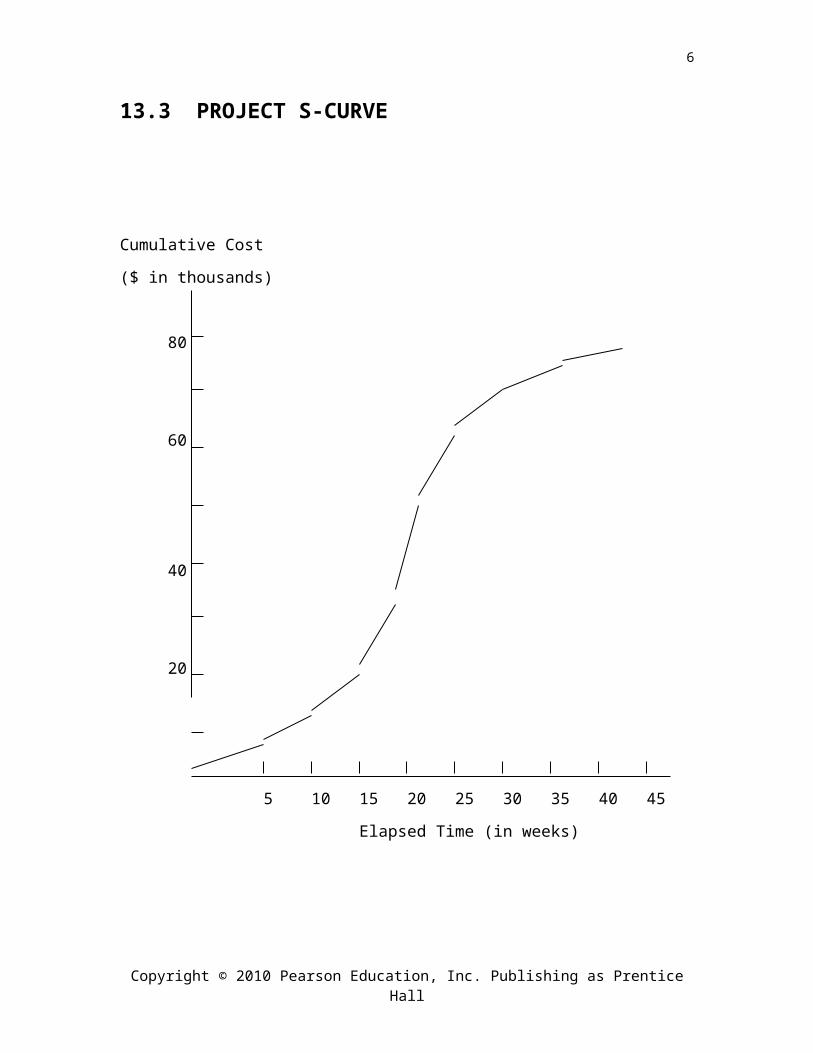
13.3 PROJECT S-CURVE
Cumulative Cost
($ in thousands)
80
60
40
20
5 10 15 20 25 30 35 40 45
Elapsed Time (in weeks)
Copyright © 2010 Pearson Education, Inc. Publishing as Prentice Hall
5
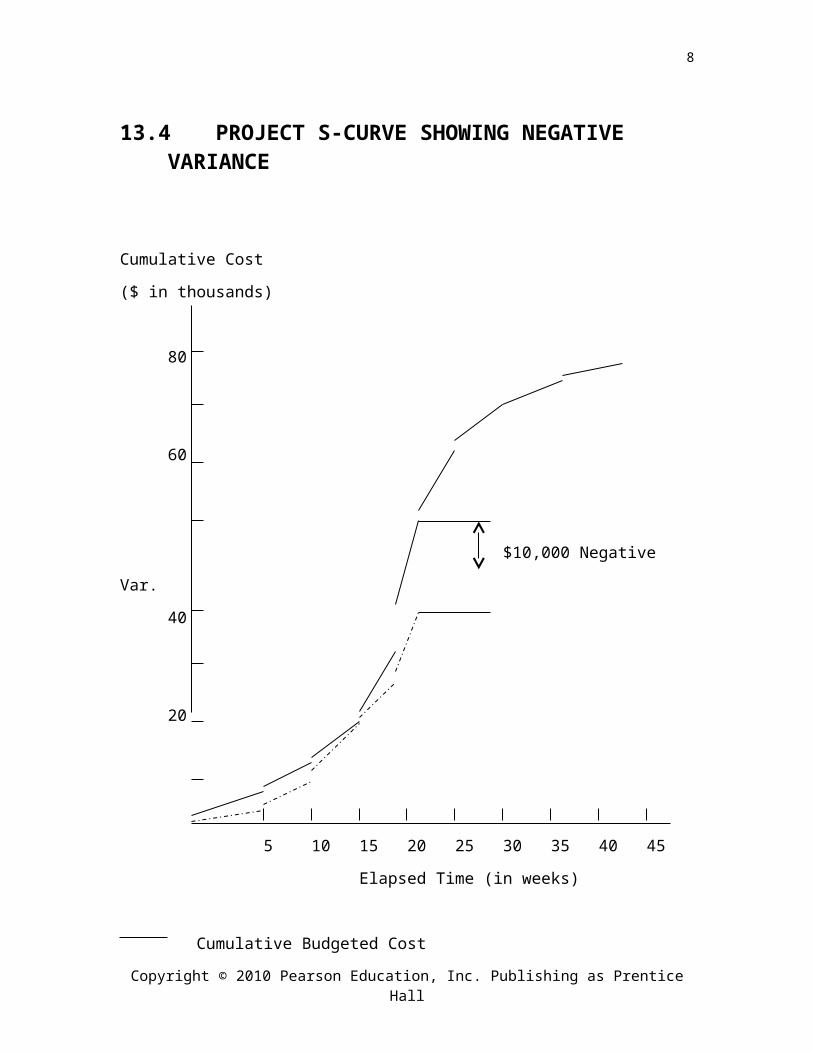
13.4 PROJECT S-CURVE SHOWING NEGATIVE VARIANCE
Cumulative Cost
($ in thousands)
80
60
$10,000 Negative Var.
40
20
5 10 15 20 25 30 35 40 45
Elapsed Time (in weeks)
Cumulative Budgeted Cost
Cumulative Actual Cost
Copyright © 2010 Pearson Education, Inc. Publishing as Prentice Hall
6

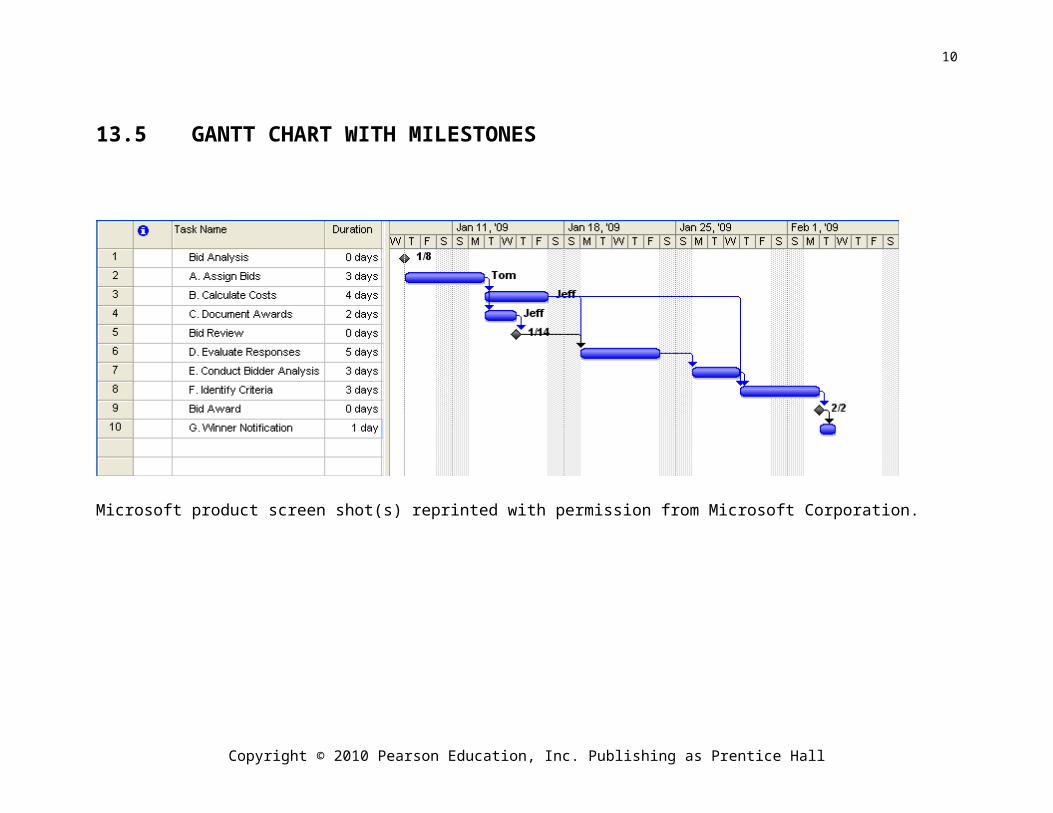
13.5 GANTT CHART WITH MILESTONES
Microsoft product screen shot(s) reprinted with permission from Microsoft Corporation.
Copyright © 2010 Pearson Education, Inc. Publishing as Prentice Hall
7
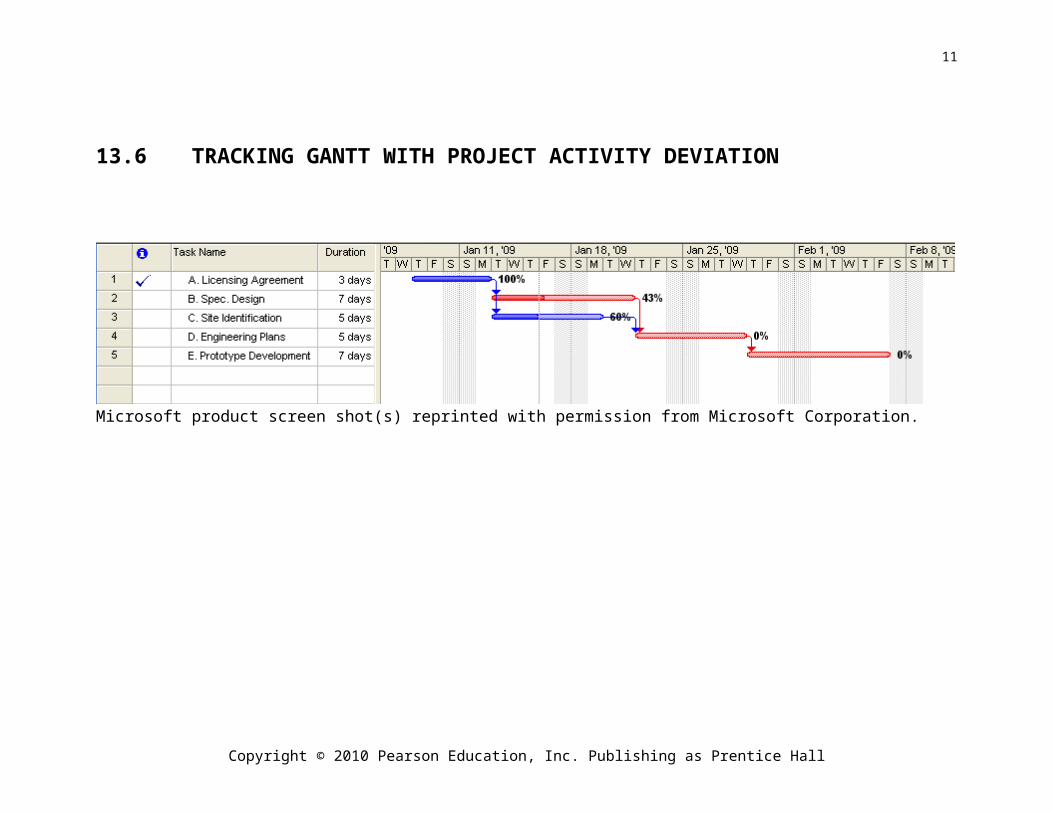
13.6 TRACKING GANTT WITH PROJECT ACTIVITY DEVIATION
Microsoft product screen shot(s) reprinted with permission from Microsoft Corporation.
Copyright © 2010 Pearson Education, Inc. Publishing as Prentice Hall
8

Copyright © 2010 Pearson Education, Inc. Publishing as Prentice Hall
9
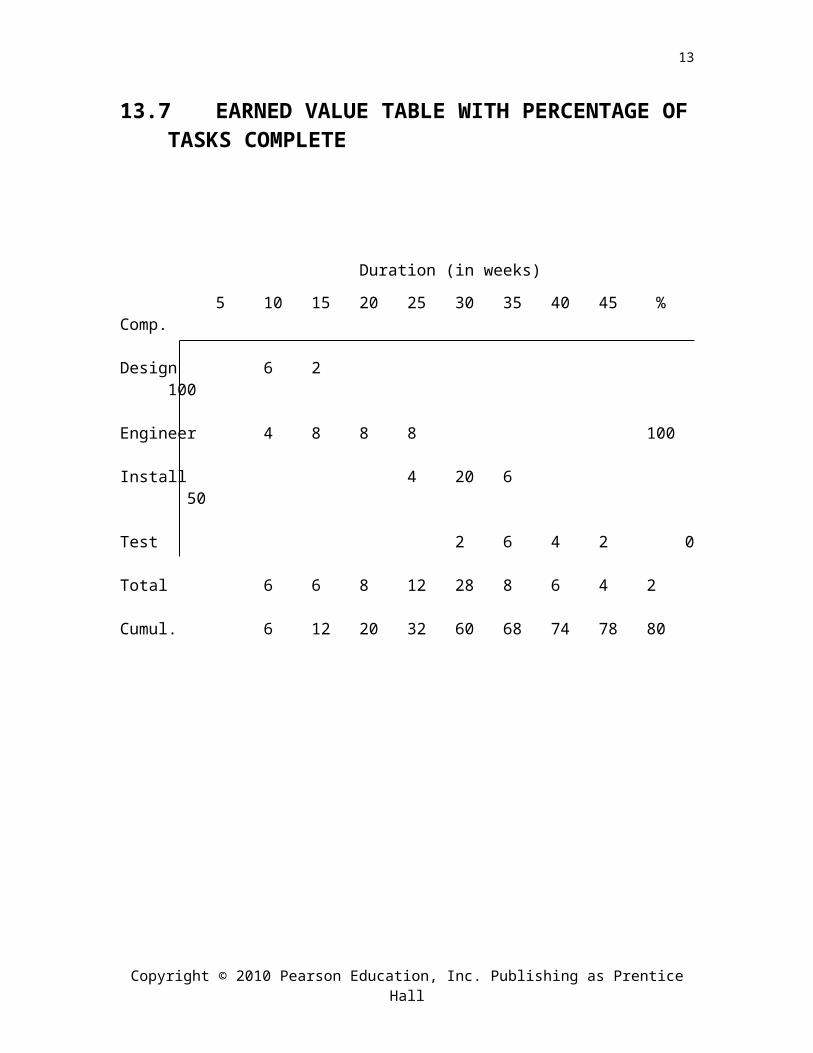
13.7 EARNED VALUE TABLE WITH PERCENTAGE OF TASKS COMPLETE
Duration (in weeks)
5 10 15 20 25 30 35 40 45 % Comp.
Design 6 2 100
Engineer 4 8 8 8 100
Install 4 20 6 50
Test 2 6 4 2 0
Total 6 6 8 12 28 8 6 4 2
Cumul. 6 12 20 32 60 68 74 78 80
Copyright © 2010 Pearson Education, Inc. Publishing as Prentice Hall
10
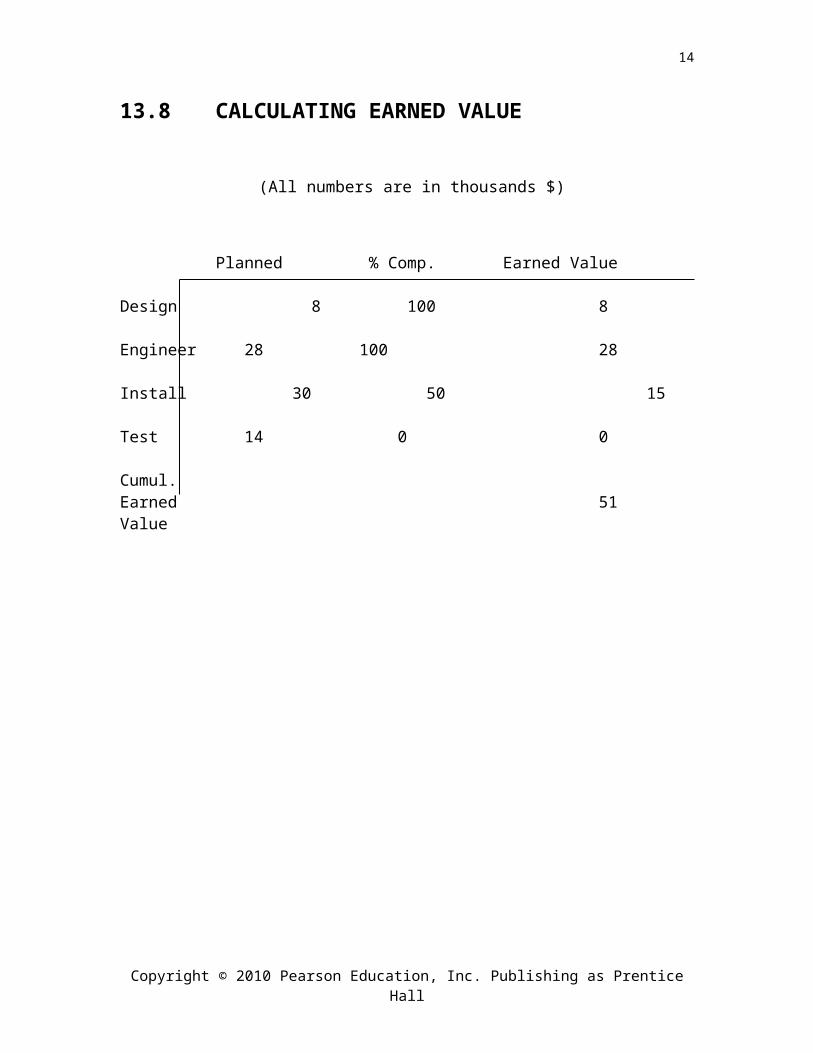
13.8 CALCULATING EARNED VALUE
(All numbers are in thousands $)
Planned % Comp. Earned Value
Design 8 100 8
Engineer 28 100 28
Install 30 50 15
Test 14 0 0
Cumul.Earned 51Value
Copyright © 2010 Pearson Education, Inc. Publishing as Prentice Hall
11

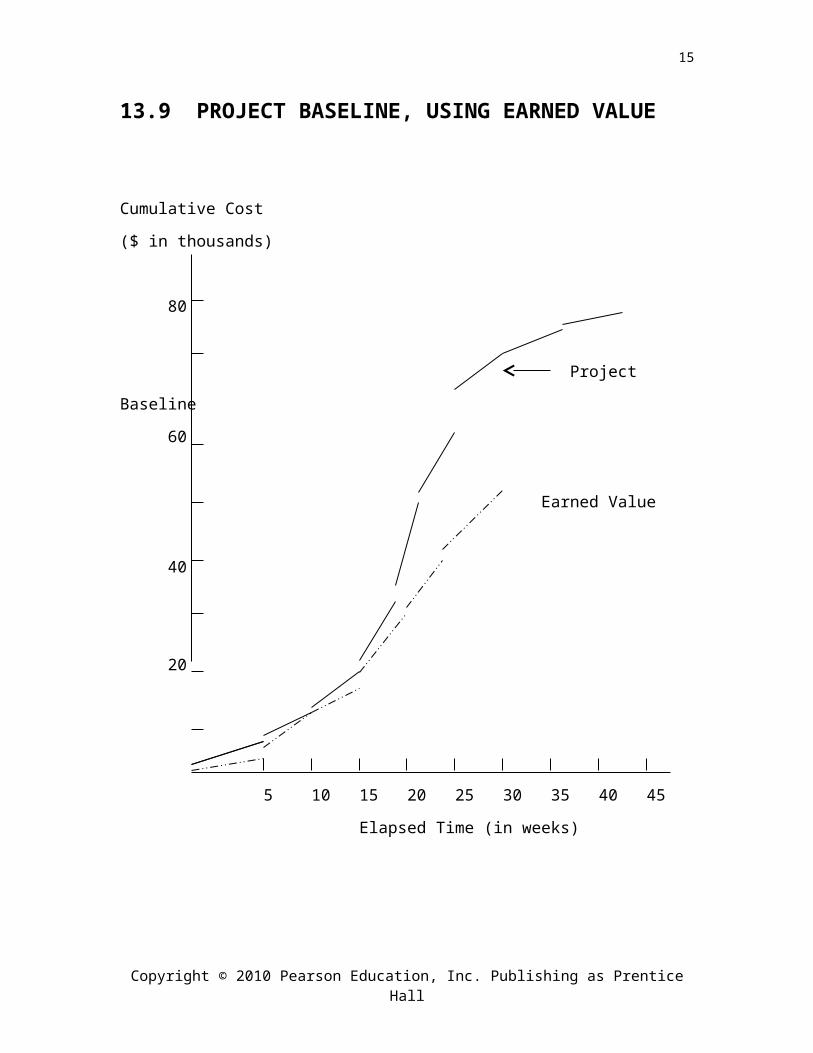
13.9 PROJECT BASELINE, USING EARNED VALUE
Cumulative Cost
($ in thousands)
80
Project Baseline
60
Earned Value
40
20
5 10 15 20 25 30 35 40 45
Elapsed Time (in weeks)
Copyright © 2010 Pearson Education, Inc. Publishing as Prentice Hall
12
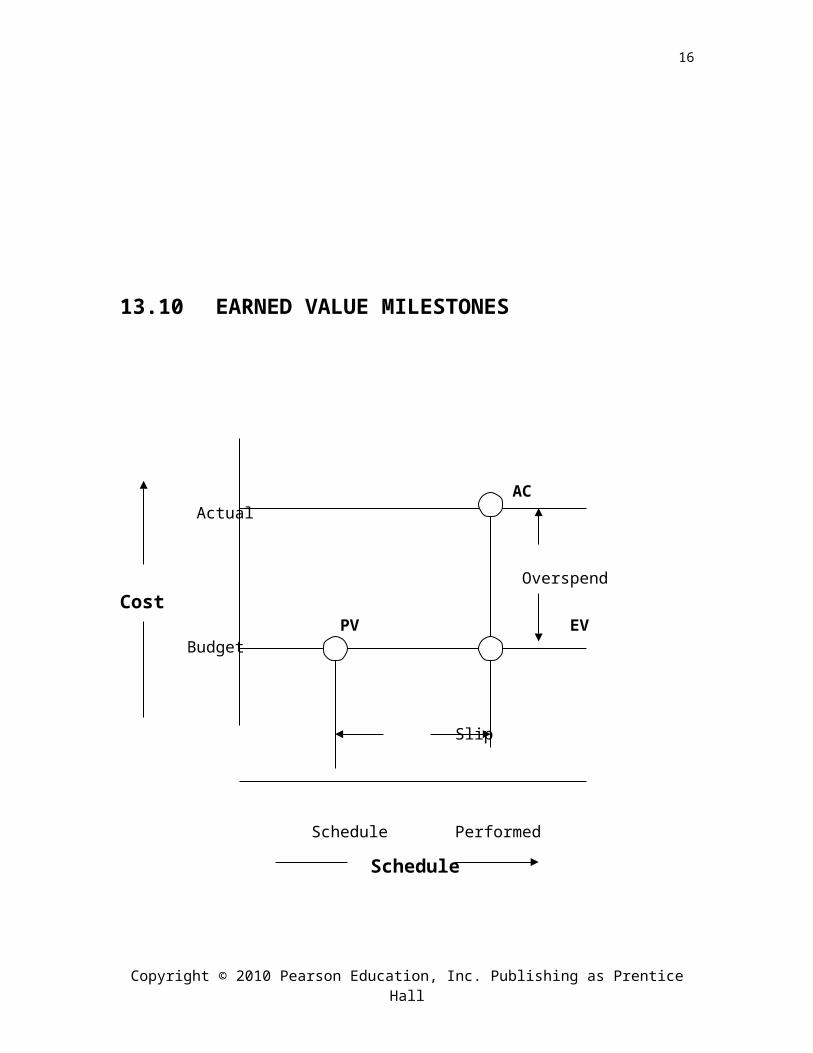
13.10EARNED VALUE MILESTONES
AC Actual
OverspendCost
PV EV Budget
Slip
Schedule Performed
Schedule
Copyright © 2010 Pearson Education, Inc. Publishing as Prentice Hall
13
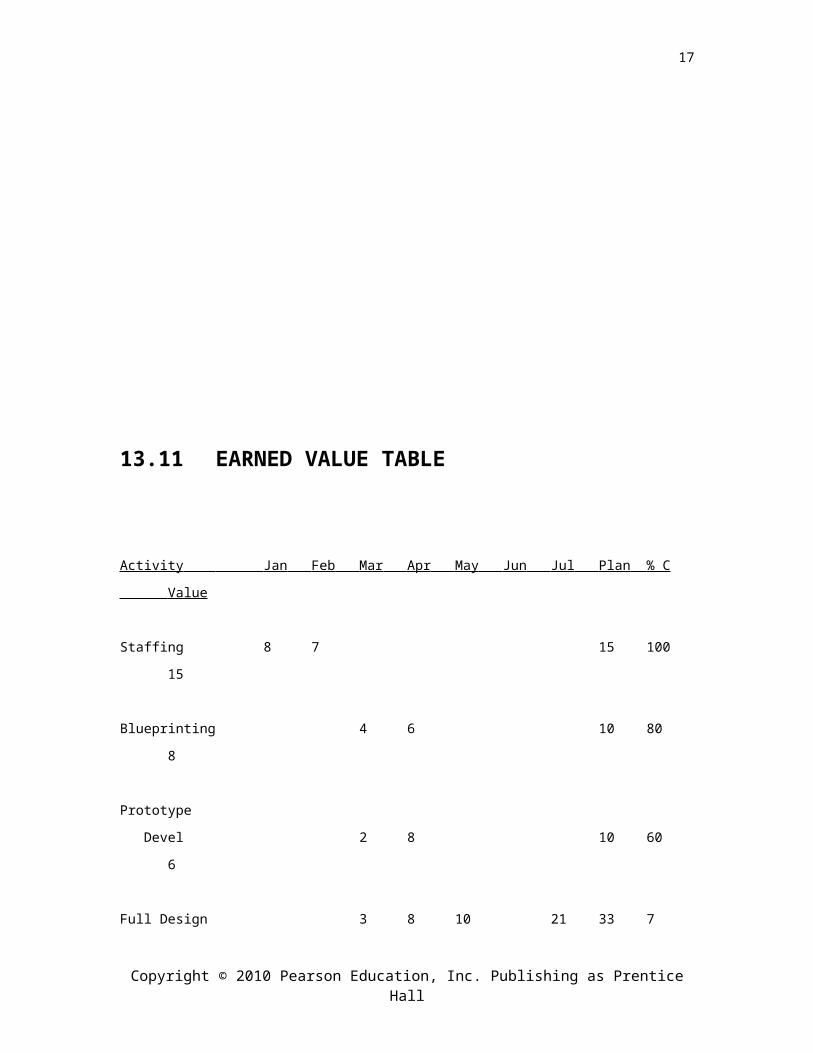
13.11EARNED VALUE TABLE
Activity Jan Feb Mar Apr May Jun Jul Plan % C Value
Staffing 8 7 15 100 15
Blueprinting 4 6 10 80 8
Prototype
Devel 2 8 10 60 6
Full Design 3 8 10 21 33 7
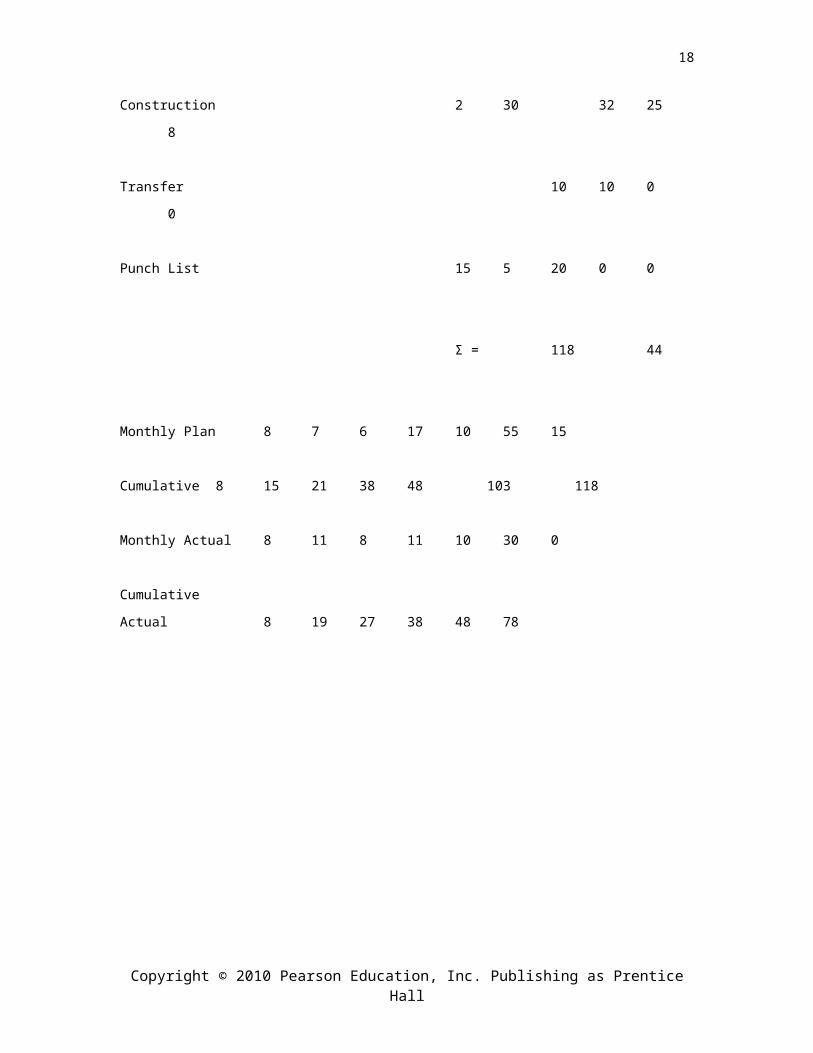
Construction 2 30 32 25 8
Transfer 10 10 0 0
Punch List 15 5 20 0 0
Σ = 118 44
Monthly Plan 8 7 6 17 10 55 15
Cumulative 8 15 21 38 48 103 118
Monthly Actual 8 11 8 11 10 30 0
Cumulative
Actual 8 19 27 38 48 78
Copyright © 2010 Pearson Education, Inc. Publishing as Prentice Hall
14
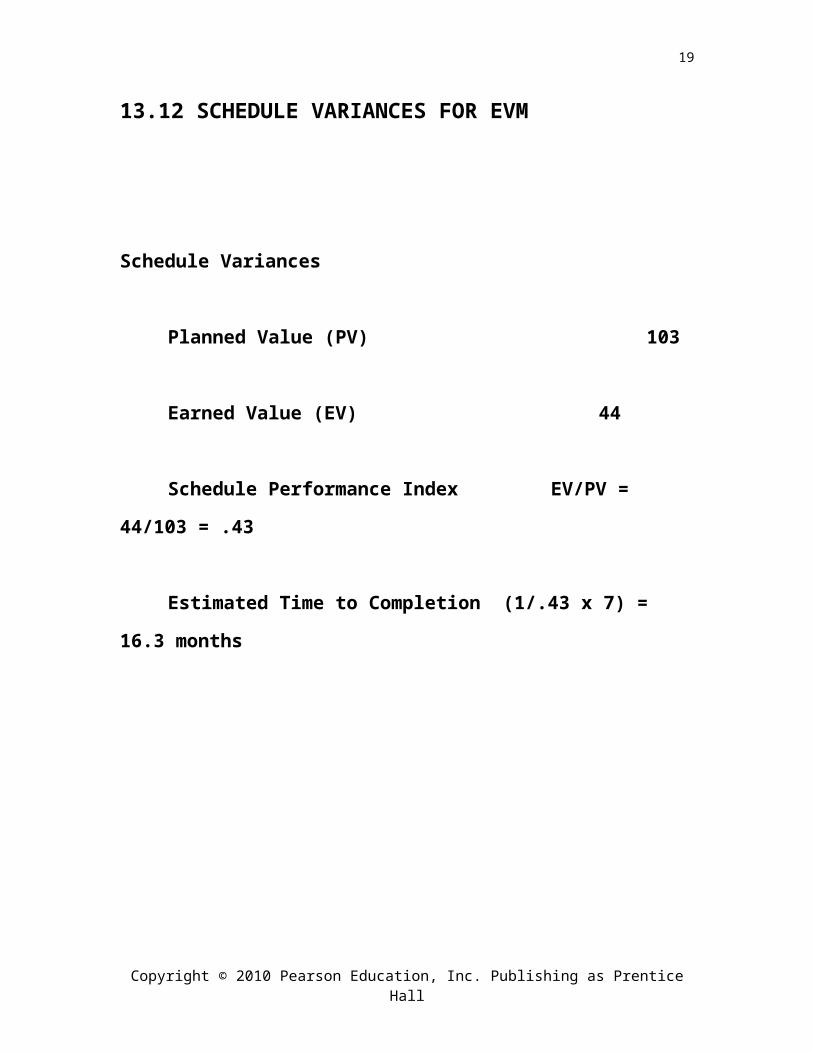
13.12 SCHEDULE VARIANCES FOR EVM
Schedule Variances
Planned Value (PV) 103
Earned Value (EV) 44
Schedule Performance Index EV/PV = 44/103 = .43
Estimated Time to Completion (1/.43 x 7) = 16.3 months
Copyright © 2010 Pearson Education, Inc. Publishing as Prentice Hall
15
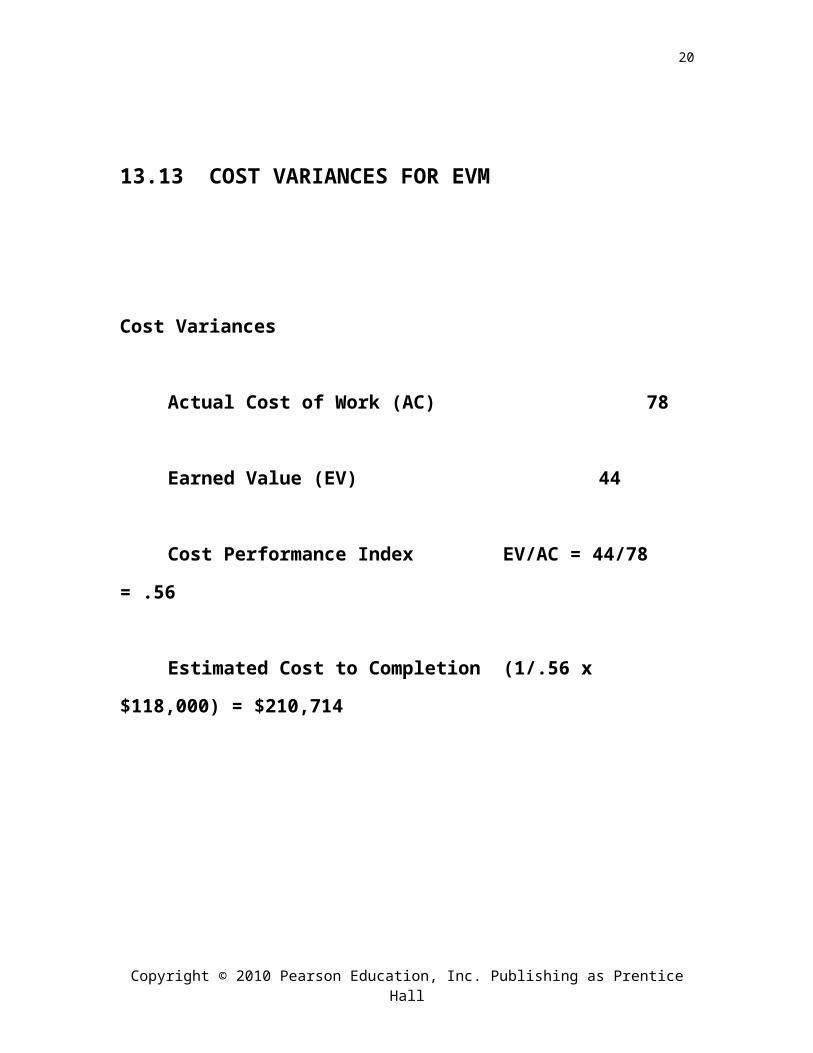
13.13 COST VARIANCES FOR EVM
Cost Variances
Actual Cost of Work (AC) 78
Earned Value (EV) 44
Cost Performance Index EV/AC = 44/78 = .56
Estimated Cost to Completion (1/.56 x $118,000) = $210,714
Copyright © 2010 Pearson Education, Inc. Publishing as Prentice Hall
16
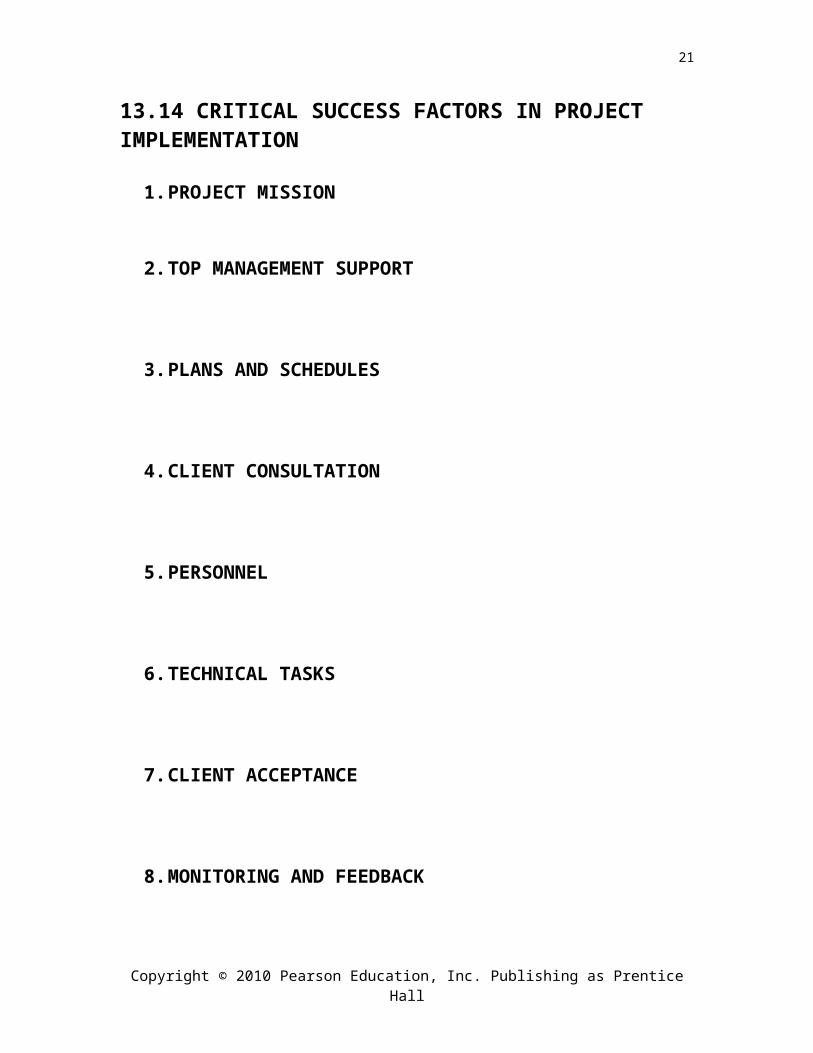
13.14 CRITICAL SUCCESS FACTORS IN PROJECT IMPLEMENTATION
1. PROJECT MISSION
2. TOP MANAGEMENT SUPPORT
3. PLANS AND SCHEDULES
4. CLIENT CONSULTATION
5. PERSONNEL
6. TECHNICAL TASKS
7. CLIENT ACCEPTANCE
8. MONITORING AND FEEDBACK
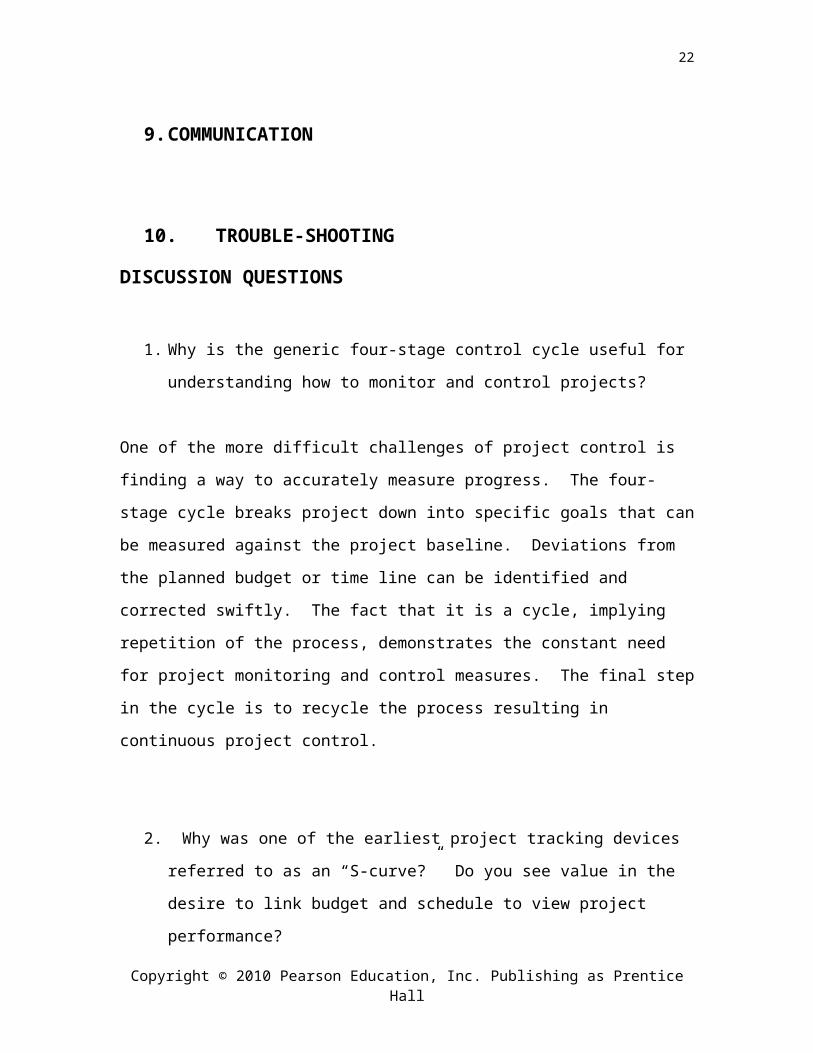
9. COMMUNICATION
10.TROUBLE-SHOOTING
Copyright © 2010 Pearson Education, Inc. Publishing as Prentice Hall
17
DISCUSSION QUESTIONS
1. Why is the generic four-stage control cycle useful for understanding how to
monitor and control projects?
One of the more difficult challenges of project control is finding a way to accurately
measure progress. The four-stage cycle breaks project down into specific goals that can
be measured against the project baseline. Deviations from the planned budget or time
line can be identified and corrected swiftly. The fact that it is a cycle, implying repetition
of the process, demonstrates the constant need for project monitoring and control
measures. The final step in the cycle is to recycle the process resulting in continuous
project control.
2. Why was one of the earliest project tracking devices referred to as an “S-curve?”
Do you see value in the desire to link budget and schedule to view project
performance?
This early device compared project time and cost graphically. The nature of project time
and costs creates an S when the points are plotted on a graph, hence the term “S-curve.”
There is value in linking the budget and schedule as an indicator of project performance.
Following the S-curve, managers can get a rough depiction of expected progress. They
can also see deviations of their own project from the typically expected progression.
3. What are some of the key drawbacks with S-curve analysis?
The cause of S-curve drawbacks lies mainly in its lack of tying the schedule and budget
to actual project progress. S-curves give little indication as to the cause of variations
from projections. The S-curve simply points out deviation of cost in relation to time. It
does not relation task completion to time or cost. Therefore, when a deviation is
Copyright © 2010 Pearson Education, Inc. Publishing as Prentice Hall
18
discovered it is unknown whether the project is on target so far as physical progress
(whether work is being completed on, ahead or behind the anticipated time and budget).
Without knowing the cause of the variance, managers may make incorrect assumptions
about the status of the project.
4. What are the benefits and drawbacks with the use of milestone analysis as a
monitoring device?
Milestone analysis is beneficial in signaling the completion of important project stages
and in creating distinctions between work packages. This increases the team’s ability to
respond to change and create logical review points. Milestones also provide periodic
goals that keep team members motivated. They represent significant accomplishments
within the larger picture of the project. It also draws the team’s attention to the project’s
status. Overall, the analysis provides a clear picture of project development. However,
this form of analysis only allows for reaction to problems, not foresight or prevention.
Problems are then able to compound and grow to the point of unmanageable resulting in
a significantly over budget/schedule project.
5. It has been said that Earned Value Management (EVM) came about because the
Federal Government often used “Cost plus” contractors with project
organizations. Cost plus contracting allows the contractor to recover full project
development costs plus accumulate profit from these contracts. Why would
requiring contractor firms to employ earned value management help the
government hold the line against project cost overruns?
Earned Value Management goes beyond reporting costs and progress. It links costs
incurred to the time and budget baseline as well as to measurable performance
milestones. By using EVM, the government is requiring that costs incurred during the
project be directly tied to performance or progress of the project. The cost of the project
Copyright © 2010 Pearson Education, Inc. Publishing as Prentice Hall
19
is based on the budgeted cost of work performed. Therefore, negative or positive
variances in performance are measured by the value of the work performed, not by the
costs spent to complete the work. This allows companies to have a better understanding
of what variances mean and their impact on the overall project. By understanding why
the meaning of variances, managers are in a better position to take corrective action and
to keep the project on schedule.
6. What are the major advantages of using EVM as a project control mechanism?
What do you perceive are its disadvantages?
The major advantages of EVM are that it is a comprehensive approach to measuring
progress (links cost, time and completion), its use of objective criteria, and it enables
more accurate information for decision making. Disadvantages may include the time
consuming nature of analysis in large scale projects, mathematical formulas used for
efficiency do not take into account unique problems that stall the project or spike costs in
one area (which may not lead to overall poor efficiency), and a lack of information
regarding what type of corrective action may need to be taken.
7. Consider the major findings of the research on human factors in project
implementation. What common themes seem to emerge from the research of
Baker, Morris, and Pinto?
The overarching theme is that in order to understand why a project is progressing the way
it is the project must be evaluated on human performance criteria. There are several
human factors proven to be influential in project success. Some of the main areas that
need to be measured are motivation, leadership, expertise and top management support.
The problem with this area of assessment is that it lacks a straightforward, objective
system for measurement.
Copyright © 2010 Pearson Education, Inc. Publishing as Prentice Hall
20
8. The ten critical success factors have been applied in a variety of settings and
project types. Consider a project with which you were involved. Did any sub-set
of these factors emerge as clearly the most important for project success? Why?
This question requires students to give a specific answer based on their own experience
with projects. Responses will vary depending upon the project they select to respond to
with the critical success factor model.
9. Identify the following terms: PV, EV, and AC. Why are these terms important?
How do they relate to each other?
PV refers to Planned Value. This is the expected (planned) budget for all project
activities that are planned to occur within a specific time period. Planned Value is
compared with Earned Value to determine the “real” progress that has been made on a
project.
EV refers to Earned Value. Earned value is the budgeted cost of the work performed.
This is important in establishing the true progress of the project and in understanding the
meaning of variances from the project baseline.
AC stands for Actual Cost. These are the total costs incurred to complete project work.
10. What do the schedule performance index and budget performance index
demonstrate? How can a project manager use this information to estimate future
project performance?
The indexes compare the planned value and actual cost of the project with the earned
value (EV) measure to assess “true” project performance. The goal for an organization is
Copyright © 2010 Pearson Education, Inc. Publishing as Prentice Hall
21
to maintain SPI and BPI of 1.0 or higher, indicating that the project’s progress is ahead of
schedule. The lower the project’s SPI and CPI are from 1.0, the less progress is being
made on the project and the higher the likely overruns on schedule and budget we can
anticipate.
11. Suppose the SPI is calculated as less than 1.0. Is this good news for the project or
bad news? Why?
This would probably be viewed as bad news. A performance index of less than 1.0
indicates that the project, based on current EV and PV information, is not progressing at
the planned rate. Depending upon how much less than 1.0 the SPI is, the project’s
schedule could either be marginally or significantly delayed.
Copyright © 2010 Pearson Education, Inc. Publishing as Prentice Hall
22
CASE STUDIES
Case Study 13.1 - The IT Department at Kimble College
This case identifies some of the serious problems and challenges involved in accurately
tracking and determining the status of ongoing projects. In this case, there is no clear
method for tracking and identifying project performance midstream. Either it succeeds,
or (more often) it comes in very late and over budget. Dan Gray, the new head of the IT
department, is not helping the process because he himself has a tendency to paint a rosy
picture of his projects.
Questions:
1. As a consultant monitoring this problem, what are your proposed solutions? To
what degree has Dan’s management style contributed to the problems?
This department needs to develop a monitoring and control system that allows project
managers and administrators the ability to get real-time information on project
development so there are no end-game surprises, when a project is “suddenly” late
and over budget. The use of earned value, milestones, or some other tracking
mechanism is critical.
2. What are some of the types of project status information you could suggest they
begin to collect to assess the status of their projects?
Use of standard monitoring and control metrics such as milestones would begin to
give some interim updates on project status. The problem with milestones is that they
are a reactive measure (you know you missed one only when you miss one). On the
other hand, earned value, combined with frequent updates regarding project activity
development, can provide real-time information and well as the ability to make
Copyright © 2010 Pearson Education, Inc. Publishing as Prentice Hall
23
reasonable projections into the future to avoid any surprises regarding how projects
are performing.
3. How would you blend “hard data” and “managerial or behavioral” information to
create a comprehensive view of the status of ongoing projects at Kimble College?
Using concepts such as earned value, coupled with “softer” information provided by tools
such as critical success factor analysis, will give project managers and top management a
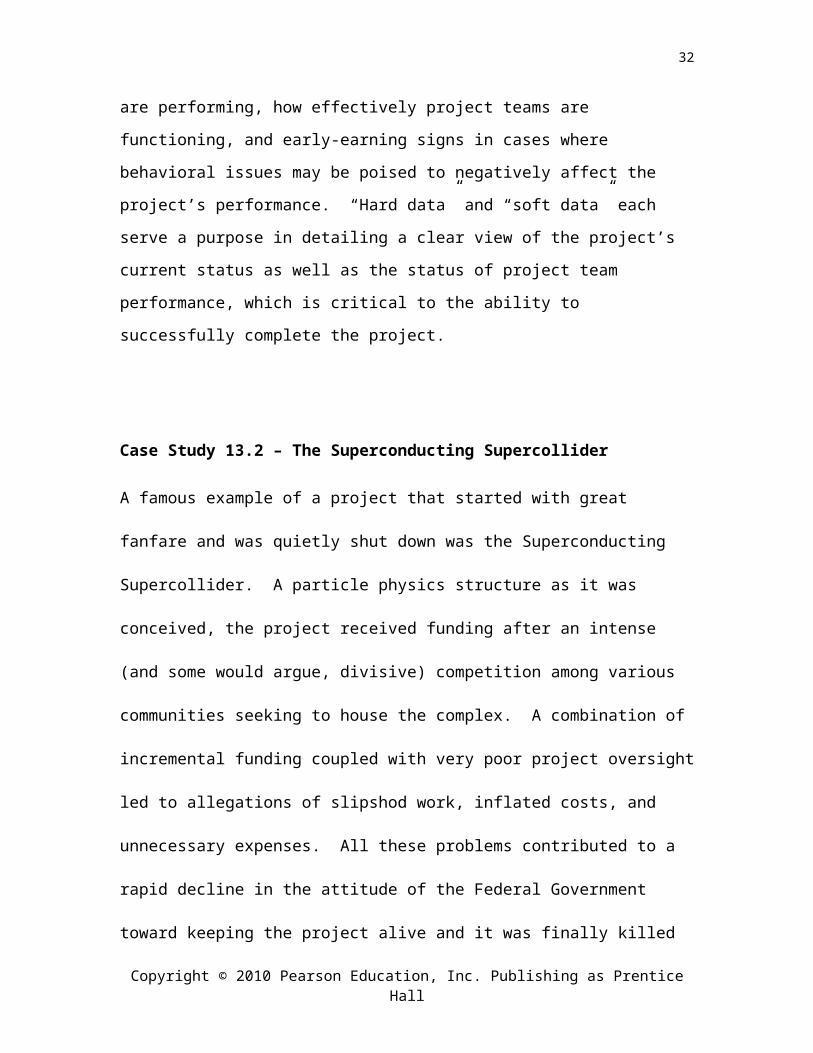
more comprehensive assessment or how projects are performing, how effectively project
teams are functioning, and early-earning signs in cases where behavioral issues may be
poised to negatively affect the project’s performance. “Hard data” and “soft data” each
serve a purpose in detailing a clear view of the project’s current status as well as the
status of project team performance, which is critical to the ability to successfully
complete the project.
Case Study 13.2 – The Superconducting Supercollider
A famous example of a project that started with great fanfare and was quietly shut down
was the Superconducting Supercollider. A particle physics structure as it was conceived,
the project received funding after an intense (and some would argue, divisive)
competition among various communities seeking to house the complex. A combination
of incremental funding coupled with very poor project oversight led to allegations of
slipshod work, inflated costs, and unnecessary expenses. All these problems contributed
to a rapid decline in the attitude of the Federal Government toward keeping the project
alive and it was finally killed through withdrawal of funding. This case also makes an
excellent discussion point for that argument that good project management also requires
Copyright © 2010 Pearson Education, Inc. Publishing as Prentice Hall
24
good stakeholder management; that is, keeping all the powerful project stakeholders
happy and supportive of the project.
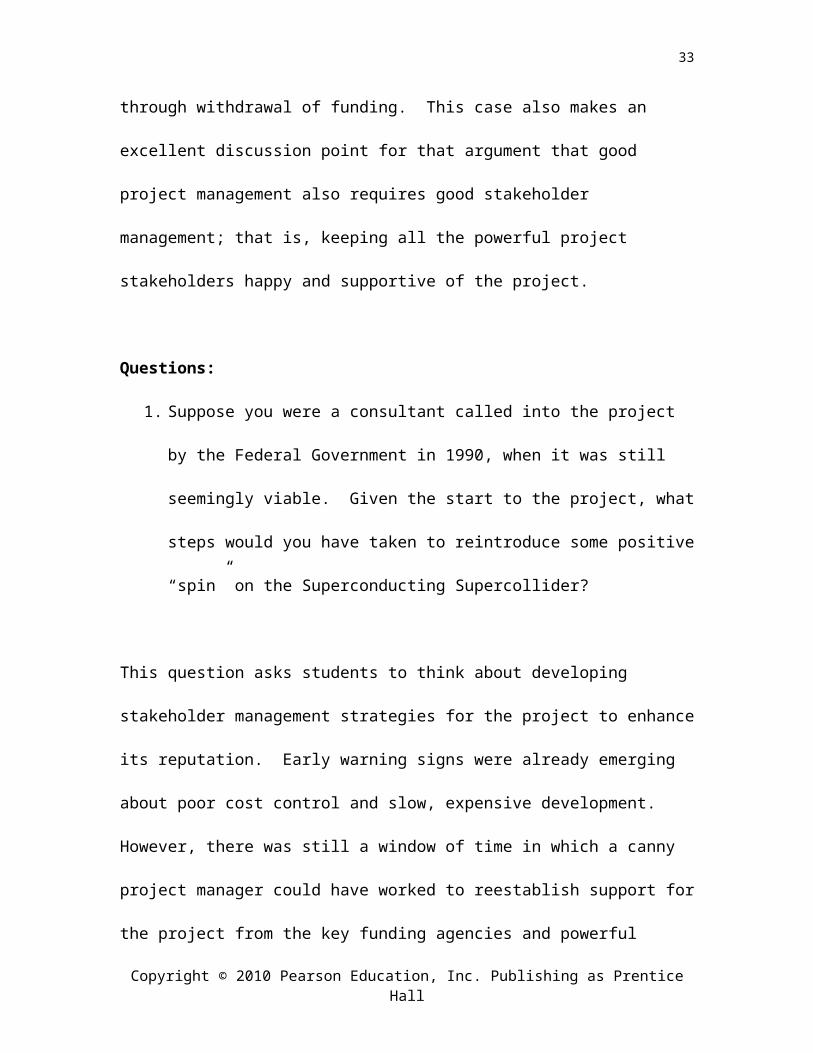
Questions:
1. Suppose you were a consultant called into the project by the Federal Government
in 1990, when it was still seemingly viable. Given the start to the project, what
steps would you have taken to reintroduce some positive “spin” on the
Superconducting Supercollider?
This question asks students to think about developing stakeholder management strategies
for the project to enhance its reputation. Early warning signs were already emerging
about poor cost control and slow, expensive development. However, there was still a
window of time in which a canny project manager could have worked to reestablish
support for the project from the key funding agencies and powerful congressional
members. Students should consider steps to reengage these crucial supporters.
2. What were the warning signs of impending failure as the project progressed.
Could these signs have been foreseen and addressed or, in your opinion, was the
project simply impossible to achieve? Take a position and argue its merits.
There are several points of departure that students can adopt in answering this question.
First, the divisive nature of the competition for the location of the Superconducting
Supercollider was guaranteed to ensure that losing communities, and their federal
Copyright © 2010 Pearson Education, Inc. Publishing as Prentice Hall
25
representatives, would be upset and unlikely to give the project the benefit of the doubt
downstream. Second, the way that project funding was initially doled out at a slow pace
(due to Federal budget deficit concerns) made it difficult for the project to kick off
strongly; in fact, they had to begin slowly and never were able to gain much momentum.
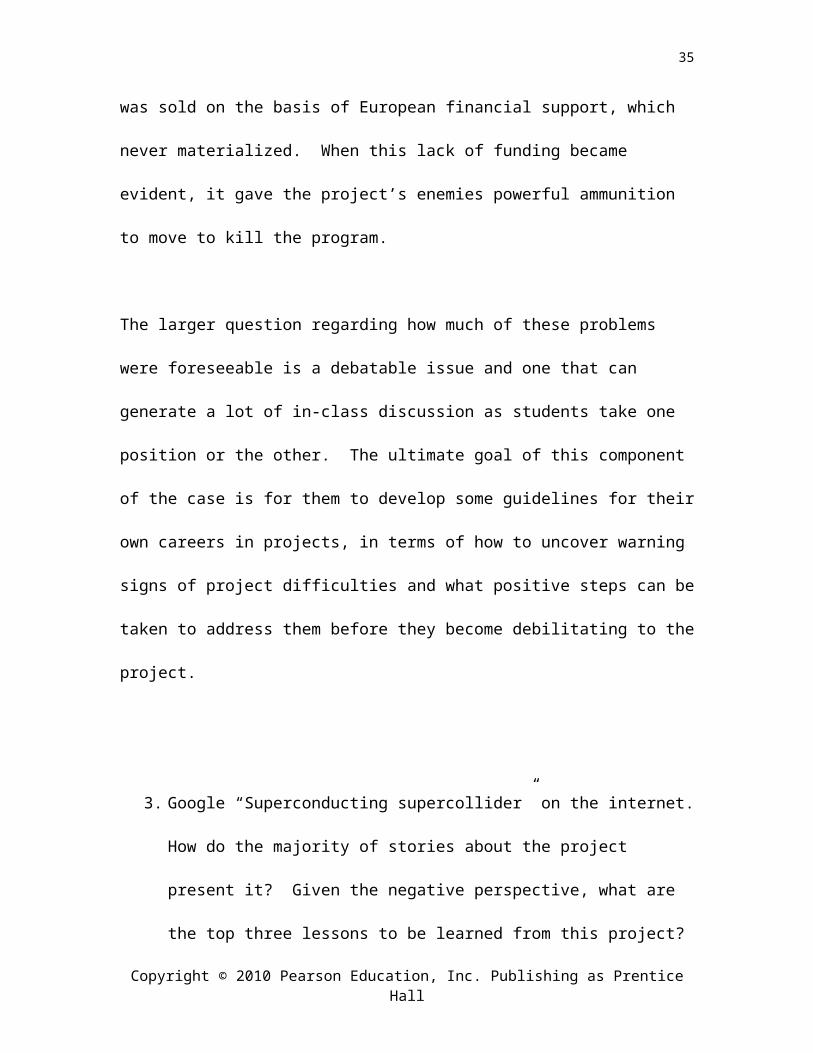
Third, the project also was sold on the basis of European financial support, which never
materialized. When this lack of funding became evident, it gave the project’s enemies
powerful ammunition to move to kill the program.
The larger question regarding how much of these problems were foreseeable is a
debatable issue and one that can generate a lot of in-class discussion as students take one
position or the other. The ultimate goal of this component of the case is for them to
develop some guidelines for their own careers in projects, in terms of how to uncover
warning signs of project difficulties and what positive steps can be taken to address them
before they become debilitating to the project.
3. Google “Superconducting supercollider” on the internet. How do the majority of
stories about the project present it? Given the negative perspective, what are the
top three lessons to be learned from this project?
This is a summary question that asks students to consider the lessons to be learned from
this disaster. Most internet sites that address just the science underlying the
Superconducting Supercollider offer a mixed view of it and are supportive of the particle
Copyright © 2010 Pearson Education, Inc. Publishing as Prentice Hall
26
physics science that drove its development. Federal watchdog groups, on the other hand,
view the project as a classic case of governmental waste with nothing to show for it.
Copyright © 2010 Pearson Education, Inc. Publishing as Prentice Hall
27
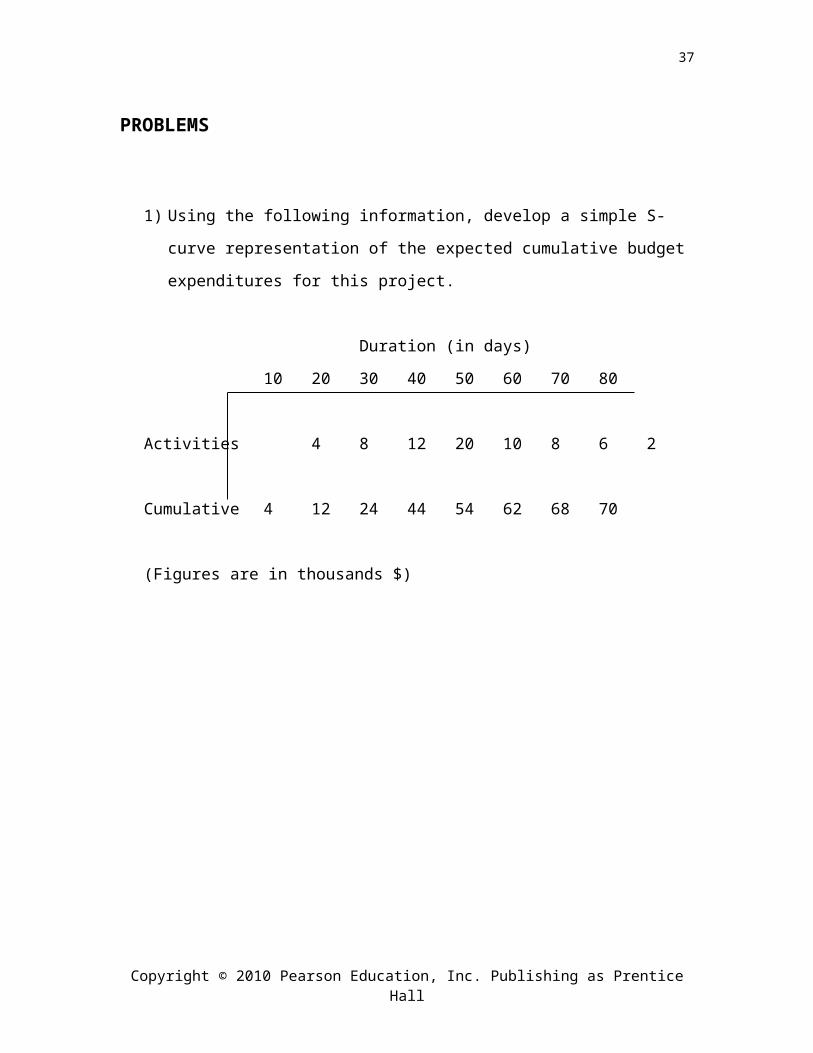
PROBLEMS
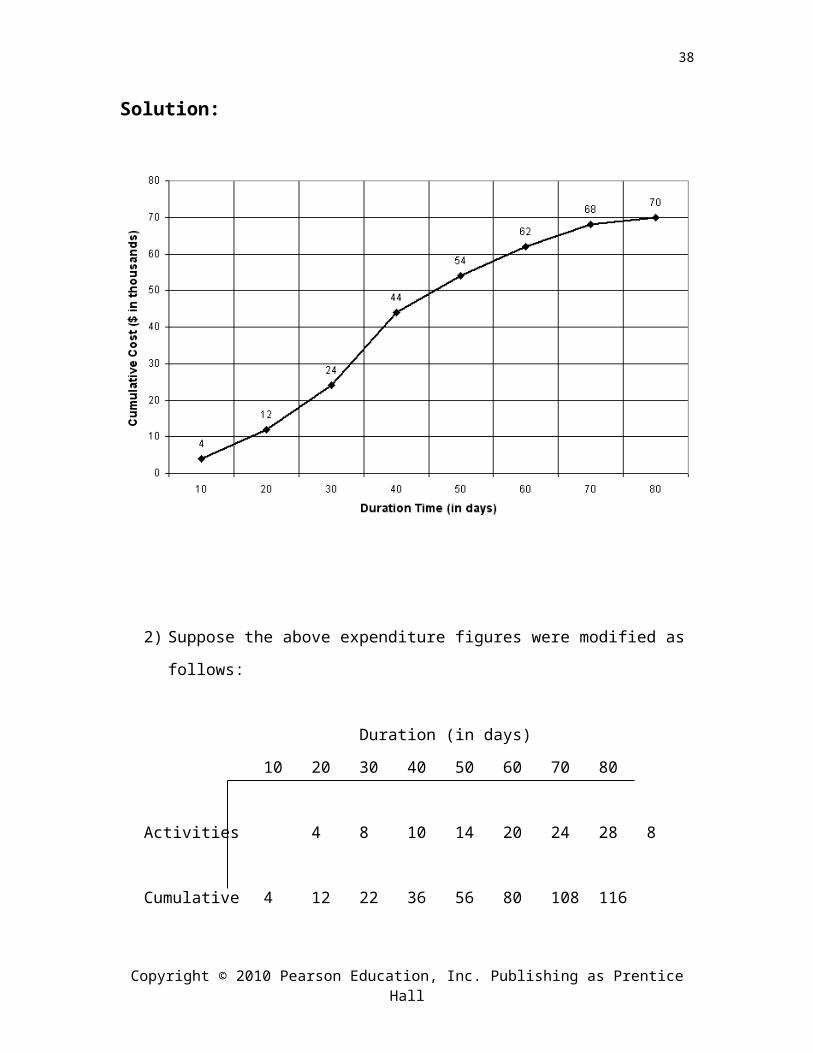
1) Using the following information, develop a simple S-curve representation of the
expected cumulative budget expenditures for this project.
Duration (in days)
10 20 30 40 50 60 70 80
Activities 4 8 12 20 10 8 6 2
Cumulative 4 12 24 44 54 62 68 70
(Figures are in thousands $)
Copyright © 2010 Pearson Education, Inc. Publishing as Prentice Hall
28

Solution:
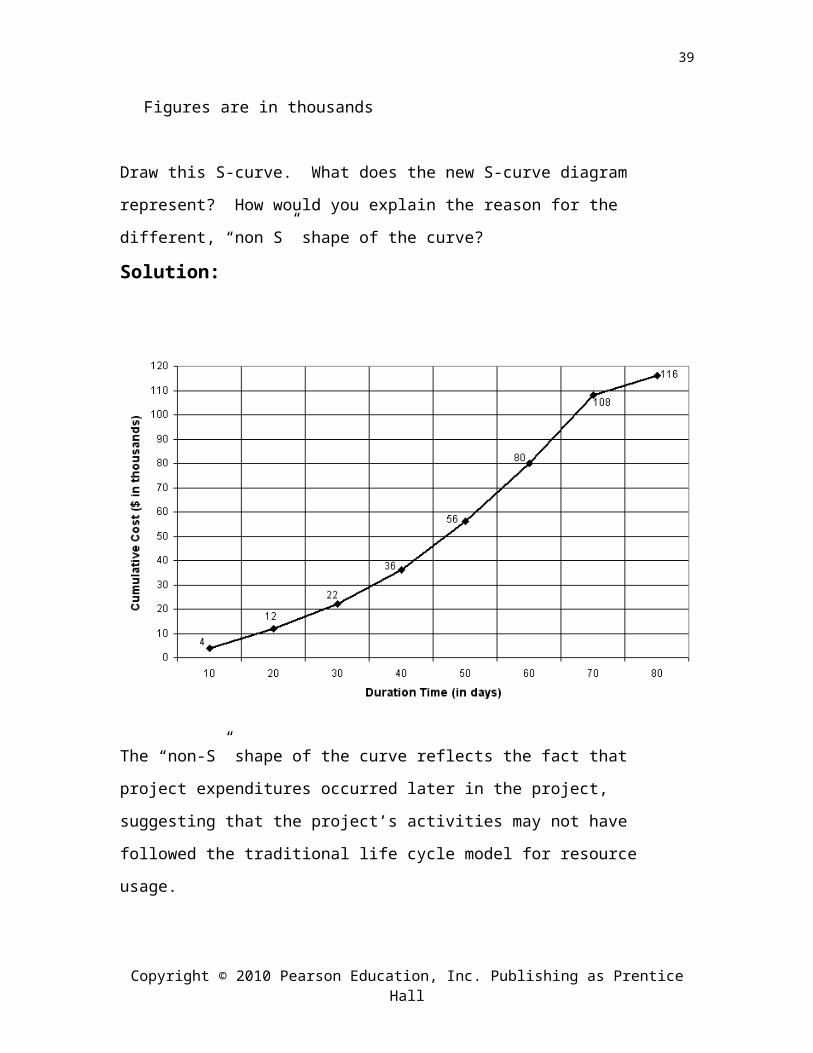
2) Suppose the above expenditure figures were modified as follows:
Duration (in days)
10 20 30 40 50 60 70 80
Activities 4 8 10 14 20 24 28 8
Cumulative 4 12 22 36 56 80 108 116
Figures are in thousands
Draw this S-curve. What does the new S-curve diagram represent? How would you
explain the reason for the different, “non S” shape of the curve?
Copyright © 2010 Pearson Education, Inc. Publishing as Prentice Hall
29
Solution:
The “non-S” shape of the curve reflects the fact that project expenditures occurred later in
the project, suggesting that the project’s activities may not have followed the traditional
life cycle model for resource usage.
Copyright © 2010 Pearson Education, Inc. Publishing as Prentice Hall
30
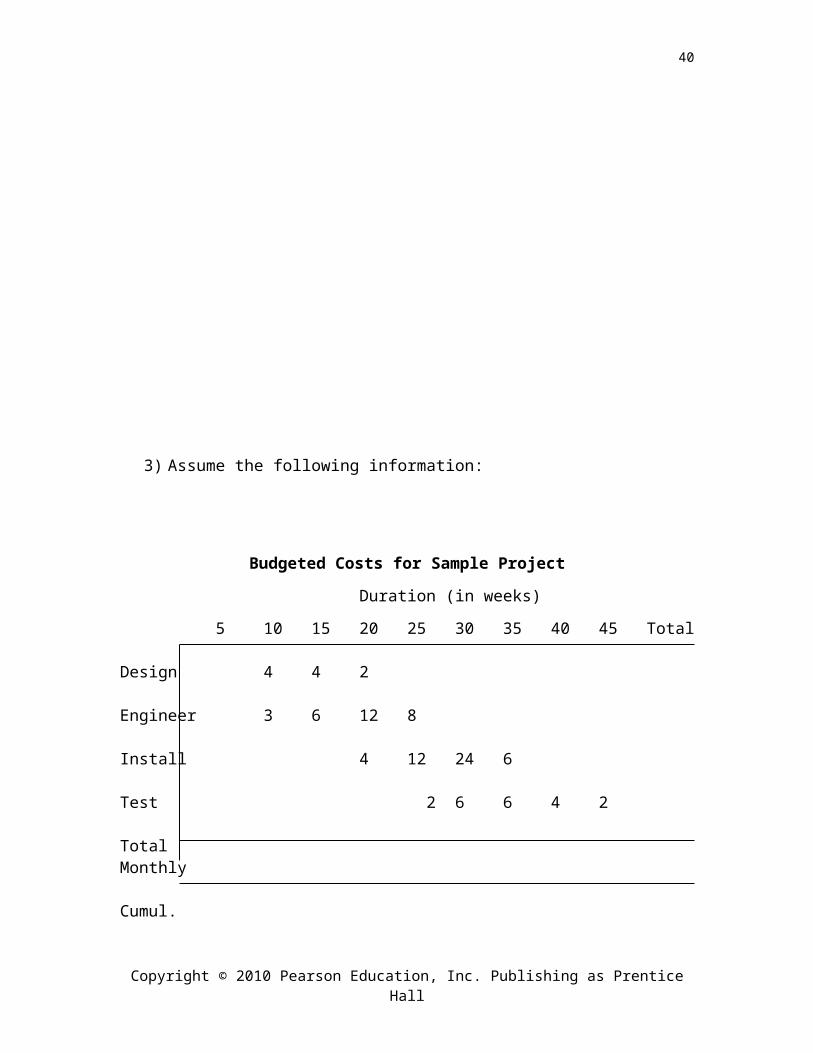
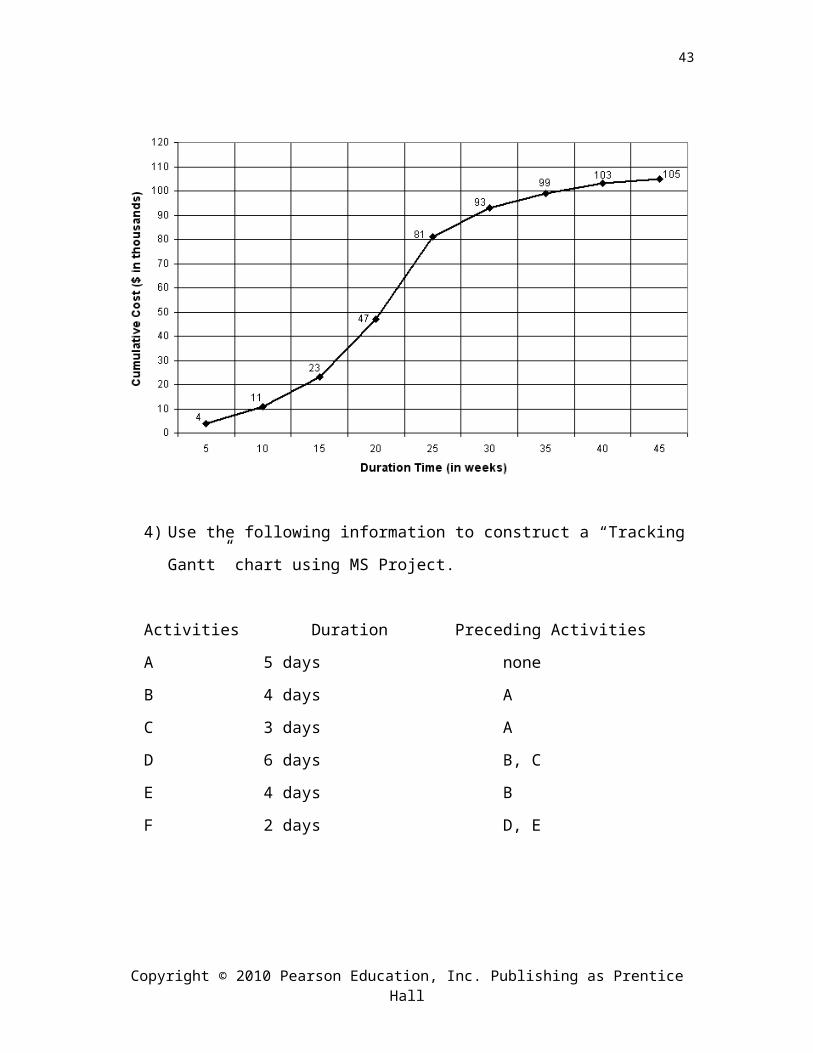
3) Assume the following information:
Budgeted Costs for Sample Project
Duration (in weeks)
5 10 15 20 25 30 35 40 45 Total
Design 4 4 2
Engineer 3 6 12 8
Install 4 12 24 6
Test 2 6 6 4 2
TotalMonthly
Cumul.
a) Calculate the monthly budget and the monthly cumulative budgets for the
project.
b) Draw a project S-curve identifying the relationship between the project’s
budget baseline and its schedule.
Copyright © 2010 Pearson Education, Inc. Publishing as Prentice Hall
31
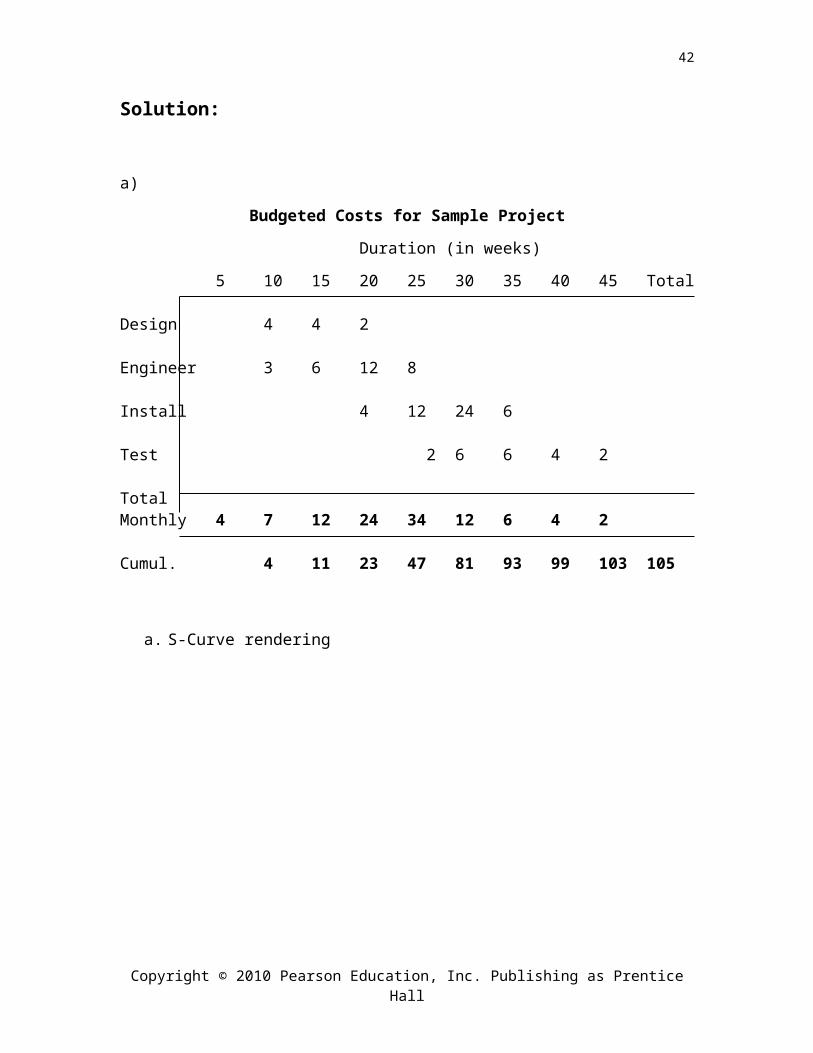
Solution:
a)
Budgeted Costs for Sample Project
Duration (in weeks)
5 10 15 20 25 30 35 40 45 Total
Design 4 4 2
Engineer 3 6 12 8
Install 4 12 24 6
Test 2 6 6 4 2
TotalMonthly 4 7 12 24 34 12 6 4 2
Cumul. 4 11 23 47 81 93 99 103 105
a. S-Curve rendering
Copyright © 2010 Pearson Education, Inc. Publishing as Prentice Hall
32
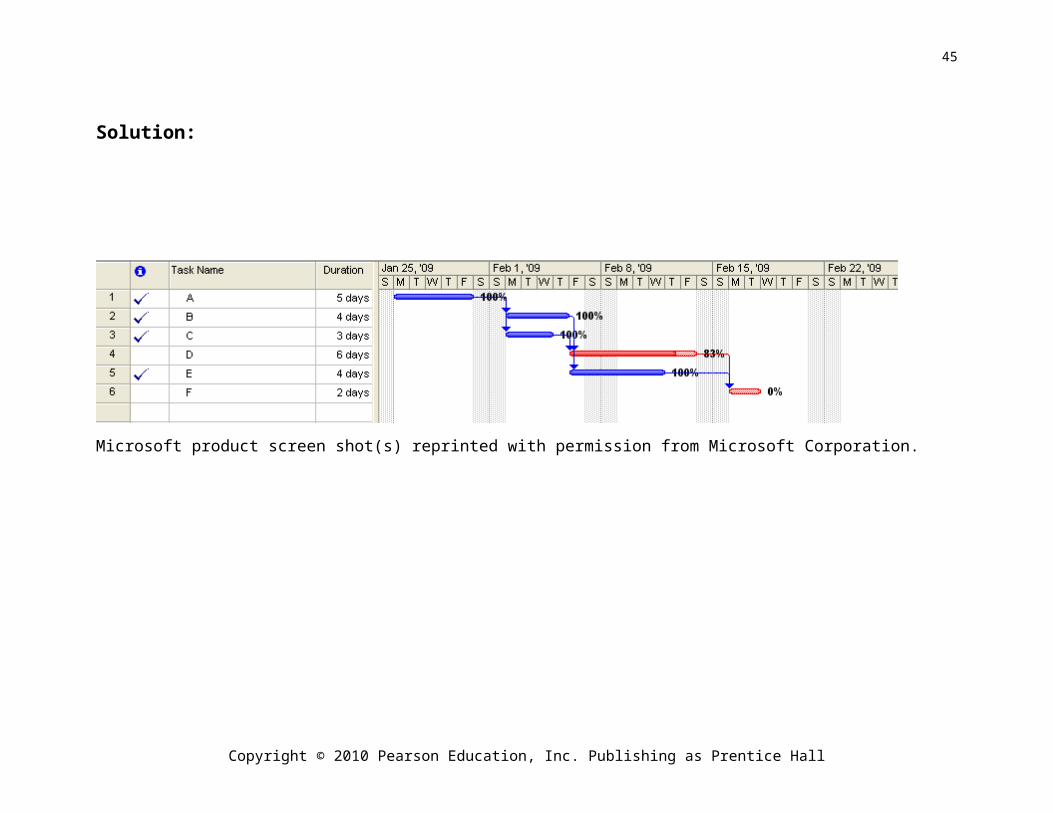
4) Use the following information to construct a “Tracking Gantt” chart using MS
Project.
Activities Duration Preceding Activities
A 5 days none
B 4 days A
C 3 days A
D 6 days B, C
E 4 days B
F 2 days D, E
Highlight project status on day 14 using the tracking option and assuming that all tasks to
date have been completed on time. Print the output file.
Copyright © 2010 Pearson Education, Inc. Publishing as Prentice Hall
33

Solution:
Microsoft product screen shot(s) reprinted with permission from Microsoft Corporation.
Copyright © 2010 Pearson Education, Inc. Publishing as Prentice Hall
34
Copyright © 2010 Pearson Education, Inc. Publishing as Prentice Hall
35

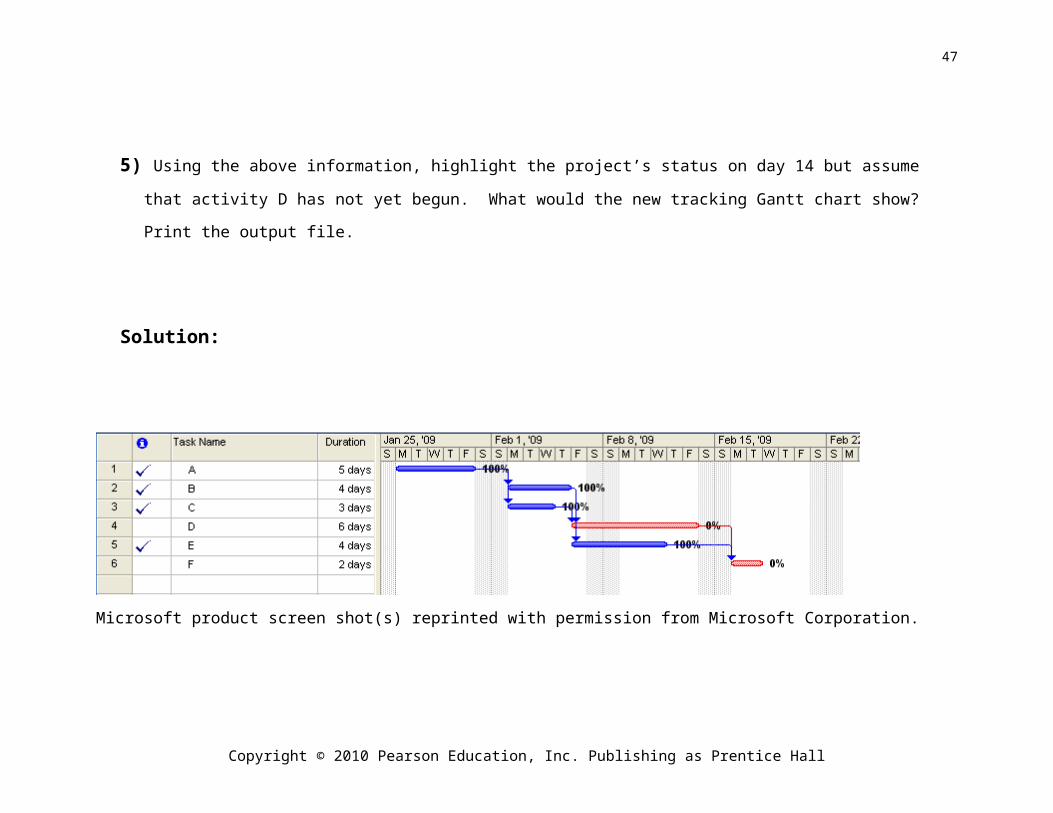
5) Using the above information, highlight the project’s status on day 14 but assume that activity D has not yet begun. What
would the new tracking Gantt chart show? Print the output file.
Solution:
Microsoft product screen shot(s) reprinted with permission from Microsoft Corporation.
Copyright © 2010 Pearson Education, Inc. Publishing as Prentice Hall
36
6) Use the following table to calculate project schedule variance based on the units
listed below.
Schedule Variance Work Units
A B C D E F Total
Planned
Value
20 15 10 25 20 20 110
Earned
Value
10 10 10 20 25 25
Schedule
variance
Solution:
Schedule Variance Work Units
A B C D E F Total
Planned
Value
20 15 10 25 20 20 110
Earned
Value
10 10 10 20 25 25 100
Schedule
variance
-10 -5 0 -5 5 5 -10
Copyright © 2010 Pearson Education, Inc. Publishing as Prentice Hall
37
7) Using the following data, calculate the planned and actual monthly budgets through the end of June. Assume the project is planned for a 12-month duration and $250,000 budget.
Activity Jan Feb Mar Apr May Jun Plan % C Value
Staffing 8 7 15 100
Blueprinting 4 6 10 100
Prototype Development 2 8 10 70
Full Design 3 8 10 21 67
Construction 2 30 32 25
Transfer 10 10 0
Monthly Plan
Cumulative
Monthly Actual 10 15 6 14 9 40
Cumul. Actual
Copyright © 2010 Pearson Education, Inc. Publishing as Prentice Hall
38
Solution:
Activity Jan Feb Mar Apr May Jun Plan % C Value
Staffing 8 7 15 100 15
Blueprinting 4 6 10 100 10
Prototype Development 2 8 10 70 7
Full Design 3 8 10 21 67 14
Construction 2 30 32 25 8
Transfer 10 10 0 0
Σ = 54
Monthly Plan 8 11 8 11 10 50
Cumulative 8 19 27 38 48 98
Monthly Actual 10 15 6 14 9 40
Cumul. Actual 10 25 31 45 54 94
Copyright © 2010 Pearson Education, Inc. Publishing as Prentice Hall
39
8) Using the data from #7 above, calculate the following values:
Schedule Variances
Planned Value of Work Scheduled (PV)
Earned Value (EV)
Schedule Performance Index (SPI)
Estimated Time to Completion
Cost Variances
Actual Cost of Work Performed (AC)
Earned Value (EV)
Cost Performance Index (CPI)
Estimated Cost to Completion
Solution:
Schedule Variances
Planned Value (PV) 98
Earned Value (EV) 54
Schedule Performance Index (SPI) EV/PV = 54/98 = .55
Estimated Time to Completion (1/.55) x 12 mos. = 21.75
mos.
Cost Variances
Actual Cost of Work Performed (AC) 94
Earned Value (EV) 54
Cost Performance Index (CPI) EV/AC = 54/94 = .58
Copyright © 2010 Pearson Education, Inc. Publishing as Prentice Hall
40

Estimated Cost to Completion (1/.58) x $250,000 = $434,622
9) You are calculating the estimated time to completion for a project of 1-year
duration and a budgeted cost of $500,000. Assuming the following information,
please calculate the schedule performance index and estimated time to
completion.
Schedule Variances
Planned Value of Work Scheduled (PV) 65
Earned Value (EV) 58
Schedule Performance Index
Estimated Time to Completion
Solution:
Schedule Performance Index (SPI) = 58/65 = .89
Estimated Time to Completion = (1/.89) x 12 months = 13.45 months, or almost 2
months behind schedule.
Copyright © 2010 Pearson Education, Inc. Publishing as Prentice Hall
41
10) Suppose, for the problem above, that your PV was 75 and your EV was 80.
Recalculate the SPI and estimated time to completion for the project with this new
data.
Solution:
Schedule Performance Index (SPI) = 80/75 = 1.07
Estimated Time to Completion = (1/1.07) x 12 months = 11.25 months, or
approximately 3 weeks ahead of schedule.
Copyright © 2010 Pearson Education, Inc. Publishing as Prentice Hall
42
11) Assume you have collected the following data for your project. Its budget is
$75,000 and it is expected to last 4 months. After two months, you have
calculated the following information about the project:
PV = $45,000
EV = $38,500
AC = $37,000
Calculate the SPI and CPI. Based on these values, estimate the time and budget
necessary to complete the project? How would you evaluate these findings (i.e., are they
good news or bad news?)
Solution:
SPI = EV/PV = $38,500/45,000 = .86
CPI = EV/AC = $38,500/37,000 = 1.04
Estimated Time to Completion = (1/.86) x 4 months = 4.68 months
Estimated Cost to Completion = (1/1.04) x $75,000 = $72,078
The findings are a bit of good news and a bit of bad. The good news is that your
estimated cost to completion is lower than the original budget; however, the bad news is
that the project is behind schedule and is likely to take 4.65 months to complete, rather
than the originally planned 4 months.
Copyright © 2010 Pearson Education, Inc. Publishing as Prentice Hall
43

MSProject EXERCISES
Problem 13.1
Using the following data, enter the various tasks and create a Gantt chart using
MSProject. Assign the individuals responsible for each activity and once you have
completed the network, update it with the percentage complete tool. What does the
MSProject output file look like?
Activity Duration Predecessors Resource % complete
A. Research product 6 - Tom Allen 100
B. Interview customers 4 A Liz Watts 75
C. Design Survey 5 A Rich Watkins 50
D. Collect Data 4 B, C Gary Sims 0
Solution:
Microsoft product screen shot(s) reprinted with permission from Microsoft Corporation.
Copyright © 2010 Pearson Education, Inc. Publishing as Prentice Hall
44
Problem 13.2
Now, suppose we assign costs to each of the resources in the following amounts:
Resource Cost
Tom Allen $50/hour
Liz Watts $55/hour
Rich Watkins $18/hour
Gary Sims $12.50/hour
a. Create the resource usage statement for the project as of the most recent update. What
are project expenses per task to date?
Solution:
Microsoft product screen shot(s) reprinted with permission from Microsoft Corporation.
Copyright © 2010 Pearson Education, Inc. Publishing as Prentice Hall
45

Problem 13.3
Use MSProject to create a Project Summary Report of the most recent project status.
Solution:
Microsoft product screen shot(s) reprinted with permission from Microsoft Corporation.
Copyright © 2010 Pearson Education, Inc. Publishing as Prentice Hall
46
Problem 13.4
Using the data shown in the network precedence table below, enter the various tasks onto
MSProject. Then select a date approximately halfway through the overall project
duration and update all tasks in the network to show current status. You may assume that
all tasks in the first half of the project are now 100% completed. What does the Tracking
Gantt look like?
Project - Remodeling an Appliance
Activity Duration Predecessors
A. Conduct competitive analysis 3 -
B. Review field sales reports 2 -
C. Conduct tech capabilities assessment 5 -
D. Develop focus group data 2 A, B, C
E. Conduct telephone surveys 3 D
F. Identify relevant specification improvements 3 E
G. Interface with Marketing staff 1 F
H. Develop engineering specifications 5 G
I. Check and debug designs 4 H
J. Develop testing protocol 3 G
K. Identify critical performance levels 2 J
L. Assess and modify product components 6 I, K
M. Conduct capabilities assessment 12 L
N. Identify selection criteria 3 M
O. Develop RFQ 4 M
P. Develop production master schedule 5 N, O
Q. Liaison with Sales staff 1 P
R. Prepare product launch 3 Q
Copyright © 2010 Pearson Education, Inc. Publishing as Prentice Hall
47

Solution:
Microsoft product screen shot(s) reprinted with permission from Microsoft Corporation.
Copyright © 2010 Pearson Education, Inc. Publishing as Prentice Hall
48