Pinellas County, Florida FY 2016-2017 Analysis of ... · PDF fileFY 2016-2017 Analysis of...
109
Pinellas County, Florida FY 2016-2017 Analysis of Impediments to Fair Housing Choice
Transcript of Pinellas County, Florida FY 2016-2017 Analysis of ... · PDF fileFY 2016-2017 Analysis of...
Pinellas County, Florida
FY 2016-2017 Analysis of Impediments
to Fair Housing Choice

FY 2016-2017 Analysis of Impediments to Fair Housing Choice
Pinellas County, Florida
Table of Contents
Introduction and Acknowledgements Executive Summary
I. Community Profile
Population, Age, Race, Ethnicity, Nativity and Language
Household and Family Characteristics
Disability and Veteran Status
Income, Education, Employment, and Transportation
II. Housing Profile
Characteristics and Affordability
Housing Size and Needs
Cost Burden
Public Housing Authorities
Tax Exemptions
Zoning Laws and Policies
III. Evaluation of Fair Housing Legal Status
Enforcement and Litigation
Resolution of Complaints
Foreclosure Data
Fair Housing Complaint Data
IV. Community Outreach and Engagement
Resident Survey and Interviews
Public Meetings and Feedback
V. Impediments to Fair Housing
Actions to Address Previous Found Impediments
Community Reinvestment and Home Mortgage Disclosure Acts
Fair Housing Index
Fair Housing Impediments and Recommendations
1 | P a g e
INTRODUCTION AND ACKNOWLEDGMENTS
Introduction
The U. S. Department of Housing and Urban Development (HUD) requires that entitlement
communities receiving direct federal funding from Community Development Block Grant, HOME
Investment Partnership and Emergency Shelter Grant programs will affirmatively further fair
housing. In accordance with 24 CFR 91.225(a)(1), 91.325(a)(1), and 91.425(a)(1)(I) entitlement
communities must conduct an analysis to identify impediments to fair housing choice within the
community, take appropriate actions to overcome the effects of any impediments identified
through that analysis, and maintain records reflecting the analysis and actions in this regard.
A broader interpretation by HUD of these objectives means to: analyze and eliminate housing
discrimination in the community, promote fair housing choice for all persons, provide
opportunities for inclusive patterns of housing occupancy regardless of race, color, religion, sex,
familial status, disability and national origin, promote housing that is structurally accessible to,
and usable by, all persons, particularly persons with disabilities and foster compliance with the
nondiscrimination provisions of the Fair Housing Act.
Additionally, the Consolidated Plans (Con Plan) for Housing and Community Development for
Pinellas County, Florida, the City of Clearwater, Florida, the City of Largo, Florida and the City of
St. Petersburg, Florida, contain a certification to affirmatively further fair housing requiring the
jurisdictions to conduct an analysis of impediments to fair housing choice within the jurisdiction,
take appropriate actions to overcome the effects of any impediments identified through that
analysis, and maintain records reflecting that analysis and actions in this regard. The Analysis of
Impediments (AI) presented herein is in conjunction with the Pinellas County, Florida fiscal years
2015-2019 Consolidated Plan (ending September 30, 2020), including the City of Largo, The City
of Clearwater, Florida 2016-2020 Consolidated Plan (ending September 30, 2020), and The City
of St. Petersburg, Florida 2016-2021 Consolidated Plan. The research and preparation of the
Analysis of Impediments to Fair Housing Choice was funded with federal and local government
funds.
The purpose of the AI is to examine how state and local laws, private, public and non-profit sector
regulations, administrative policies, procedures, and practices are impacting the location,
availability, and accessibility of housing in a community. The AI is not a Fair Housing Plan rather
it is an analysis of the current state of fair housing choice throughout Pinellas County and
identifies specific barriers that need to be addressed if future fair housing initiatives are to be
successful.
2 | P a g e
Lead and Participating Agencies – Acknowledgements
The Pinellas County Office of Human Rights ( P C O H R ) was responsible for oversight and
coordination of the Analysis of Impediments (AI) process. The document was finalized and edited
by Diana Sweeney of the Community Development Division of the Pinellas County Planning
Department. As previously indicated, participating partners in the preparation of the AI include
Pinellas County, the City of Clearwater, the City of Largo, and the City of St. Petersburg.
Data collected in preparing the AI relied in part on input from the public. The process included
information gathered from two publicly noticed and advertised focus group meetings with
residents, key persons interviews, a publicly available on-line survey, and data provided by
the Pinellas County Office of Human Rights, the Community Development Division of the
Pinellas County Planning Department, and partner cities of St. Petersburg, Largo, and
Clearwater, Florida. We especia l ly thank residents who attended focus group meetings
and on-line survey participants for their valuable contributions.
We also must acknowledge our liaisons to each of the partner cities, Joe Riddle and former city
employee, Michael Holmes, (City of Clearwater), Matt Anderson (City of Largo), and Joshua
Johnson, Lynn Gilbert, and others (City of St. Petersburg), as well as Pinellas County employees
Renea Vincent, Cheryl Coller Reed, and Diana Sweeney among many others. We would also be
remiss not to acknowledge the assistance provided by the Pinellas County Board of County
Commissioners, County Administrator Mark Woodard, OMB Director William Berger, and
Workforce Development Manager, Jack Loring for their assistance and organizational support.
We also acknowledge the participation of s taff members of the Pinellas Housing Authority,
Clearwater Housing Authority, St. Petersburg Housing Authority, Tarpon Springs Housing
Authority, and Dunedin Housing Authority and various members from the housing development,
non-profit, social services, business and real estate industries.
Finally, completion of this AI would not have been possible without the work of staff from the
Pinellas County Office of Human Rights (particularly Mercedes Pearson and Mark Esparza), and
the incredible assistance provided by Vira Suarez and James McDevitt - interns from graduate
programs at the University of South Florida. Ms. Suarez and Mr. McDevitt provided input and
analysis of the highest value to this process, and we could not have completed the AI without
their efforts. We, and the residents of Pinellas County, owe them our thanks for their work on
this most important of topics.
Paul Valenti
Director, Office of Human Rights
3 | P a g e
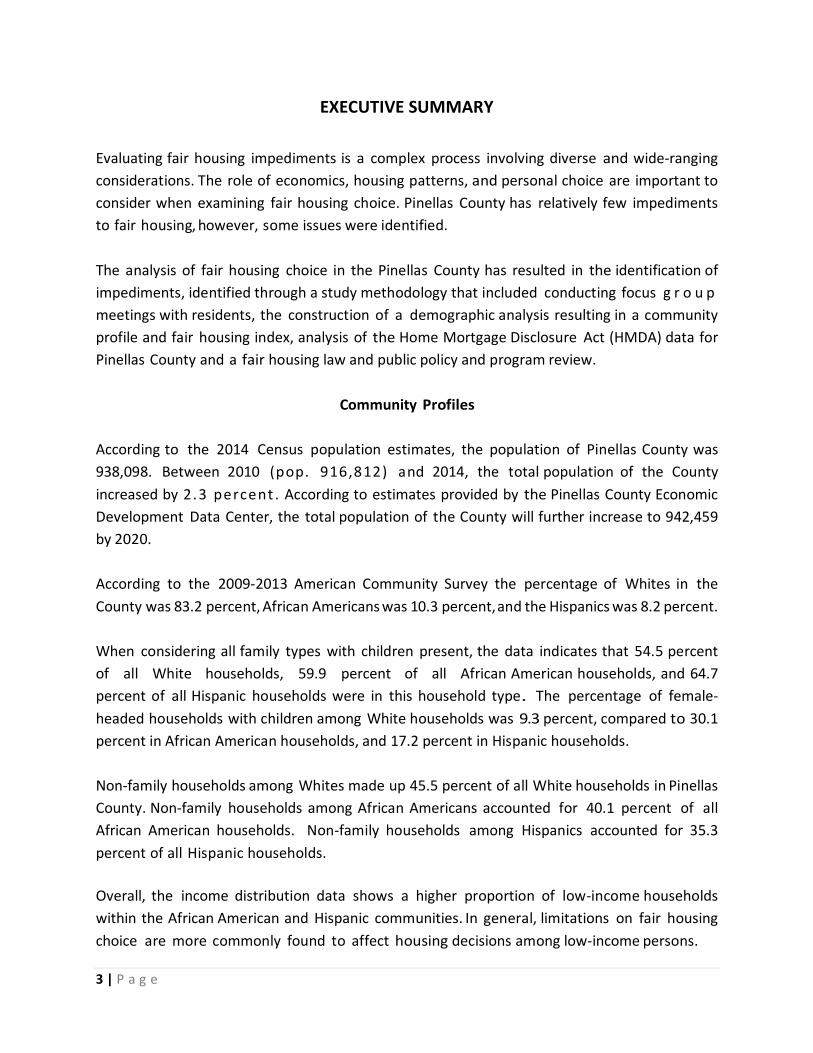
EXECUTIVE SUMMARY
Evaluating fair housing impediments is a complex process involving diverse and wide-ranging
considerations. The role of economics, housing patterns, and personal choice are important to
consider when examining fair housing choice. Pinellas County has relatively few impediments
to fair housing, however, some issues were identified.
The analysis of fair housing choice in the Pinellas County has resulted in the identification of
impediments, identified through a study methodology that included conducting focus g r o u p
meetings with residents, the construction of a demographic analysis resulting in a community
profile and fair housing index, analysis of the Home Mortgage Disclosure Act (HMDA) data for
Pinellas County and a fair housing law and public policy and program review.
Community Profiles
According to the 2014 Census population estimates, the population of Pinellas County was
938,098. Between 2010 (pop. 916,812) and 2014, the total population of the County
increased by 2.3 percent . According to estimates provided by the Pinellas County Economic
Development Data Center, the total population of the County will further increase to 942,459
by 2020.
According to the 2009-2013 American Community Survey the percentage of Whites in the
County was 83.2 percent, African Americans was 10.3 percent, and the Hispanics was 8.2 percent.
When considering all family types with children present, the data indicates that 54.5 percent
of all White households, 59.9 percent of all African American households, and 64.7
percent of all Hispanic households were in this household type. The percentage of female-
headed households with children among White households was 9.3 percent, compared to 30.1
percent in African American households, and 17.2 percent in Hispanic households.
Non-family households among Whites made up 45.5 percent of all White households in Pinellas
County. Non-family households among African Americans accounted for 40.1 percent of all
African American households. Non-family households among Hispanics accounted for 35.3
percent of all Hispanic households.
Overall, the income distribution data shows a higher proportion of low-income households
within the African American and Hispanic communities. In general, limitations on fair housing
choice are more commonly found to affect housing decisions among low-income persons.

4 | P a g e
According to the 2009-2013 American Community Survey, the median household income
was reported to be $47,442 for White households, $30,629 for African American households
and $38,538 for Hispanic households, compared to $45,535 for the overall County.
Table 1.1 illustrates the incidence of poverty among African Americans was 31.5 percent of the
total population, Hispanics was 21.4 percent of the population, and White persons were reported
at 11.6 of the populations. In comparison, the poverty rate for all of Pinellas County was 14.1
percent.
Table 1.1: Poverty Status by Race Pinellas County, 2009-2013
White African American Hispanic
Age Group: Number Percent Number Percent Number Percent
Under 5 years 4,716 0.6% 3,954 4.3% 2,227 3.0%
5 years 978 0.1% 1,014 1.1% 283 0.4%
6 to 11 years 5,563 0.7% 3,964 4.3% 1,982 2.7%
12 to 17 years 5,447 0.7% 3,238 3.5% 1,426 1.9%
18 to 64 years 55,785 7.4% 15,052 16.2% 8,977 12.0%
65 to 74 years 6,740 0.9% 1,056 1.1% 553 0.7%
75 years and over 8,040 1.1% 932 1.0% 535 0.7%
Total 87,269 11.6% 29,210 31.5% 15,983 21.4%
Source 2009-2013 American Community Survey
Employment opportunities in the area and educational levels of the employees make a significant
impact on housing affordability and the housing choice of residents. Occupation data indicates
that there has been some shift in· the distribution of occupations between 2000 and 2014.
Agriculture, forestry, fishing and hunting, and mining had the largest increase at 108.3 percent
(833 jobs to 1,735 jobs) with Educational Services, and Health Care and Social Assistance, and
Professional, Scientific, and Management, and Administrative and Waste Management Services
having the second and third largest increases at 18.4 percent and 11.6 percent respectively. All
other categories decreased with the largest reductions in Manufacturing at 31.0 percent,
Wholesale Trade at 29.7 percent, and Information at 39.8 percent.
According to the 2015 ESRI data provided by the Pinellas County Economic Development Data
Center, the Educational industry had highest percent of employees at 18.9 percent, the Retail
sector employed 16.3 percent of the total Employees, Arts and Entertainment employed 11.8
percent, Finance had 9.8 percent, Professional employed 8.3 percent, with Construction,
Manufacturing, Wholesale Trade, Public Administration and Other employing between 5.0
percent and 7.0 percent per category.
5 | P a g e
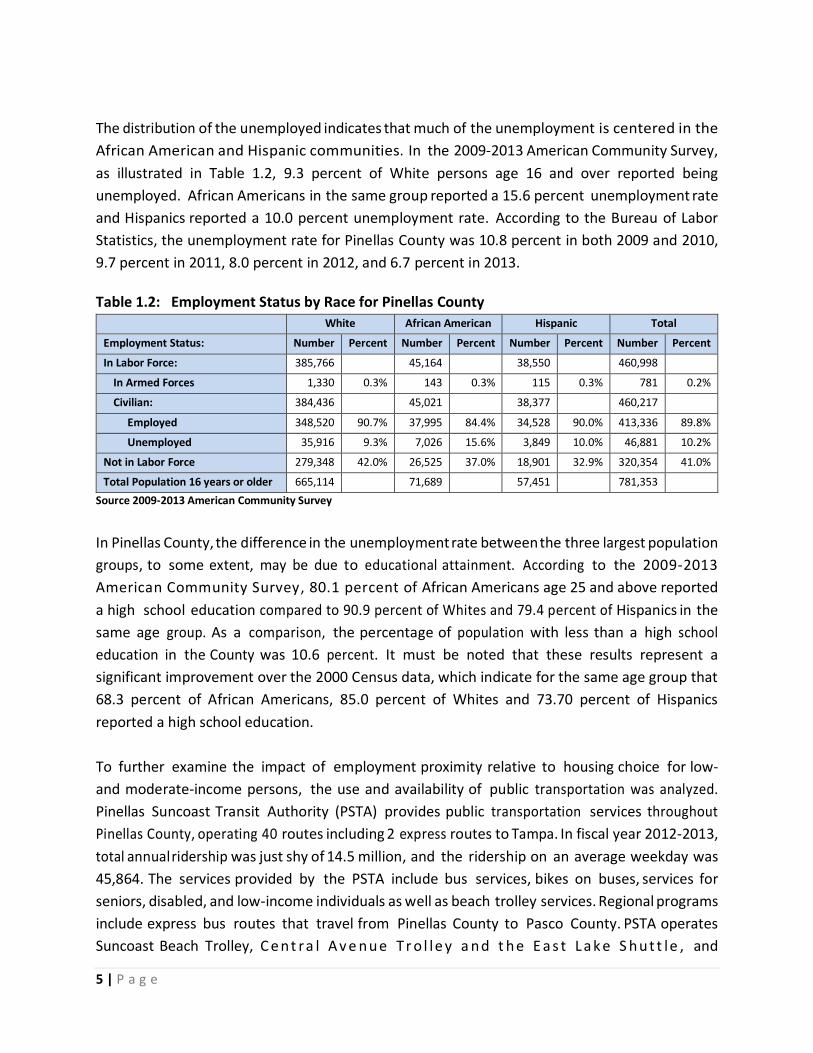
The distribution of the unemployed indicates that much of the unemployment is centered in the
African American and Hispanic communities. In the 2009-2013 American Community Survey,
as illustrated in Table 1.2, 9.3 percent of White persons age 16 and over reported being
unemployed. African Americans in the same group reported a 15.6 percent unemployment rate
and Hispanics reported a 10.0 percent unemployment rate. According to the Bureau of Labor
Statistics, the unemployment rate for Pinellas County was 10.8 percent in both 2009 and 2010,
9.7 percent in 2011, 8.0 percent in 2012, and 6.7 percent in 2013.
Table 1.2: Employment Status by Race for Pinellas County
White African American Hispanic Total
Employment Status: Number Percent Number Percent Number Percent Number Percent
In Labor Force: 385,766 45,164 38,550 460,998
In Armed Forces 1,330 0.3% 143 0.3% 115 0.3% 781 0.2%
Civilian: 384,436 45,021 38,377 460,217
Employed 348,520 90.7% 37,995 84.4% 34,528 90.0% 413,336 89.8%
Unemployed 35,916 9.3% 7,026 15.6% 3,849 10.0% 46,881 10.2%
Not in Labor Force 279,348 42.0% 26,525 37.0% 18,901 32.9% 320,354 41.0%
Total Population 16 years or older 665,114 71,689 57,451 781,353
Source 2009-2013 American Community Survey
In Pinellas County, the difference in the unemployment rate between the three largest population
groups, to some extent, may be due to educational attainment. According to the 2009-2013
American Community Survey, 80.1 percent of African Americans age 25 and above reported
a high school education compared to 90.9 percent of Whites and 79.4 percent of Hispanics in the
same age group. As a comparison, the percentage of population with less than a high school
education in the County was 10.6 percent. It must be noted that these results represent a
significant improvement over the 2000 Census data, which indicate for the same age group that
68.3 percent of African Americans, 85.0 percent of Whites and 73.70 percent of Hispanics
reported a high school education.
To further examine the impact of employment proximity relative to housing choice for low-
and moderate-income persons, the use and availability of public transportation was analyzed.
Pinellas Suncoast Transit Authority (PSTA) provides public transportation services throughout
Pinellas County, operating 40 routes including 2 express routes to Tampa. In fiscal year 2012-2013,
total annual ridership was just shy of 14.5 million, and the ridership on an average weekday was
45,864. The services provided by the PSTA include bus services, bikes on buses, services for
seniors, disabled, and low-income individuals as well as beach trolley services. Regional programs
include express bus routes that travel from Pinellas County to Pasco County. PSTA operates
Suncoast Beach Trolley, C e n t ra l A v e n u e Tr o l le y a n d t h e E a s t L a k e S h u t t le , and

6 | P a g e
trolley services are also provided by various other agencies, such as the Pinellas County Jolley
Trolley, Gulfport Trolley and the St. Pete Looper Trolley. The PSTA provides demand response
transportation services (DART) for people who, because of their disability, are unable to
independently use the regular, accessible PSTA buses; demand response services are provided
wherever regular PSTA bus service is available. PSTA also provides 50 percent reduced fares for
adult students, persons 18 years or younger and senior citizens.
Housing Profile
Fair housing choice can be influenced by the housing market. There were 481,587 housing
units in Pinellas County in 2000 and 503,634 units in 2010, which represents a 4.6 percent
increase during the ten year period.
In 2010, the median housing value in the County was $146,500, while the median contract
rent was $754. According to 20 1 4 data provided by the Pinellas County Realtor Organization,
the median sale price in the County h a s increased to $180,000, and according to 2014
Florida Housing Data Clearinghouse data the average rent was $947.
Single-family homes are predominate housing structures in the County (1-unit detached or
attached) with only 16% in units of 20 or more units. Mobile homes comprise the third largest
(9.5%) component of housing within the County. Approximately 70% of the County’s housing
stock is owner occupied which is high for a densely populated urban County. The average
household size is fairly similar with the average size of ownership housing of 2.24 and average
size of renter occupied housing of 2.14. 63% of the housing stock is comprised of 2 bedrooms or
less units. Approximately 10% of the housing units have 4 or more bedrooms.
Comparisons of 2000 and 2010 U.S Census data indicates Pinellas County experienced a net loss
of approximately 6,000 residents during the decade and a housing inventory increase of 22,061
units, of which occupied housing gained only 908 units. The decline in population despite a
growth in occupied housing units was caused by a slight decrease in persons-per-household. The
County’s vacant owner owned housing increased by 5,417 units during the decade.
The County’s housing stock is fairly old with only 6% of owner housing and 7% of renter housing
being built since 2000, while 57% of owner housing and 58% of renter housing is over 35 years
old. Three percent (3%) of owner and 4% of renter the housing dates back to 1949 or earlier.
According to the latest data from the U. S. Department of Housing and Urban Development (HUD)
American Housing Survey (AHS) the median age of an owner-occupied home in the United States
was 35 years old as of the 2011 survey. The housing stock, as a result of age, is becoming
7 | P a g e
functionally obsolete in terms of layout, size, insulation, energy efficiency and electrical
connectivity with limited room outlets that may require updating or replacement. Overall, the
decision remains if it is economically viable to renovate these units or whether many of these
owner-occupied homes will revert to lower priced rental housing, with high maintenance and
utility costs that may eventually decline to create more slum and blight within the county.
Evaluation of Jurisdiction's Current Fair Housing Legal Status
The State of Florida and Pinellas County have enacted fair housing laws that are substantially
equivalent to the federal Fair Housing Act, Title VIII of the Civil Rights Act of 1968, as amended.
Both the State (Florida Civil Rights Act (ss. 760.01-760.11) and the Fair Housing Act (ss. 760-20-
760.37)), and Pinellas County (Chapter 70, Section 103, of the Pinellas County Code) disallow the
same activities prohibited under the federal Act. Pinellas County Code has been amended to
include protection to additional classes based on sexual orientation in 2008, and gender identity
in 2013, and applies to all territory within the legal boundaries of Pinellas County, Florida,
including all unincorporated and incorporated areas.
The Fair Housing Act Title VIII of the Civil Rights Act of 1968, as amended, is a legislative
enactment enforcing a policy of equal access to all types of housing for classes of persons within
its protection. To this end, the Act prohibits intentional and unintentional acts of discrimination
that impact the groups protected by the act. The Fair Housing Act prohibits discrimination on the
basis of race, color, religion, sex, disability, familial status and national origin.
Pinellas County has actively engaged in providing fair housing education, training, outreach, and
awareness initiatives. Staff provides monthly training sessions to PRO, the Pinellas Realtor
Organization within Pinellas County, thereby exponentially increasing its reach into the
community. Realtors, property managers and public assistance housing providers are the first
line of defense in preventing or perpetuating discrimination. Pinellas County Human Rights
(PCOHR) staff also provides updated training on an annual basis, or as requested, to municipal
entities, common-interest communities, (Homeowner and Condominium Associations) and local
private businesses.
The PCOHR employs two Equal Opportunity staff members who are responsible for providing fair
housing education/outreach, training and awareness initiatives. The PCOHR is responsible for the
intake, investigation and resolution of fair housing complaints to fulfill the HUD requirements for
the operation of a "Substantially Equivalent Fair Housing Program". In addition to Pinellas
County, this program designation has been earned by only five other counties among Florida’s
total 67 counties.
8 | P a g e
Enforcement and Litigation
Between 10/1/2011 and 06/15/2015, Pinellas County received two hundred nineteen (219) fair
housing complaints and processed two hundred thirteen (213) cases to closure.
The statistics show an overwhelming number (150) or 68.0 percent of complaints filed based on
disability discrimination. Thirty nine complaints (39) or 17.0 percent were filed based on Race,
Seventeen (17) or 7.0 percent were filed based on National Origin, Fourteen (14) or 6.0 percent
were based on Familial Status, twenty three (23) or 10.5 percent were based on Gender and
seven (7) or 3.0 percent were filed on the basis of Religion. Complaints can have multiple bases,
making the total herein higher than the number of total cases.
Regarding the local protection of sexual orientation and gender identity, there were a total of
ten (10) complaints filed based on Sexual Orientation, and none on Gender Identity.
There is a need for increased exposure by the respondent housing providers to the Fair Housing
Laws protecting persons with disabilities. This is particularly true for rental units controlled by
Homeowner Associations and Condominium Boards as well as other communal housing
providers relating to acceptance of assistance animals.
Regarding the alleged harms comprising these filings, the denial of a reasonable accommodation
was the most commonly cited harm, with one hundred sixteen (116) complaints filed on this
basis. The second largest harm was the alleged imposition of different terms and conditions, with
one hundred thirteen (113) instances of such allegation. The remainder of the harms, in
diminishing order, were as follows: sixty four (64) allegations of harassment, twenty six (26)
allegations of a refusal to rent, twenty three (23) allegations of discriminatory advertising, sixteen
(16) allegations of a false denial of availability, nine (9) allegations of making housing otherwise
unavailable, eight (8) allegations of a refusal to sell, three (3) allegations for steering, three (3)
for a denial of a reasonable modification, two (2) allegations of discriminatory financing and one
(1) regarding discriminatory zoning.
Regarding harms alleged under the local basis of Sexual Orientation, there were seven (7)
allegations of harassment and intimidation, and five (5) allegations regarding the imposition of
different terms and conditions.

9 | P a g e
Resolution of Complaints
In this same time frame (10/1/2011 to 6/15/2015), there were a total of two hundred thirteen
(213) cases processed to a conclusion. In this same time frame (10/1/2011 to 6/15/2015),
Reasonable Cause was proposed in twenty (20) or 9.0 percent of the cases.
No Reasonable Cause was concluded in one hundred fifteen cases (115) or 53.0 percent, twenty
(20) cases were successfully conciliated, fifty eight (58) cases were withdrawn after successful
resolutions between the parties, three (3) cases were withdrawn without a settlement, and two
(2) were closed as a failure to cooperate.
The overwhelming number of disability complaints taken during this time period indicates a need
for exposure to, and training and development of, private sector leaders and front line staff in
the proper handling of requests for accommodation; the majority of cases investigated involve
service animal requests.
Funding
Pinellas County receives Community Development Block Grant (CDBG), HOME Investment
Partnership (HOME), and Emergency Shelter Grant (ESG) entitlement allocations. For Fiscal
Years 2010-2014, a total of $14,282,140 ($13,228,018 in entitlement dollars and $1,054,122 in
program income) was received in CDBG, $945,885 in ESG, and $10,392,685 in HOME
($6,559,934 in entitlement and $3,832,751 in program income and recapture). Pinellas County,
for the same period also received Neighborhood Stabilization Program 1-3 allocations totaling
$5,622,541, Housing Trust Fund program income of $559,464, and State of Florida State
Housing Initiative Partnership (SHIP) of $6,944,250 ($3,730,220 in allocations and $3,214,030 in
program income). Pinellas County has leveraged these funds into an additional $135,208,491 in
private funding; and the household income of the housing units produced was extremely low to
low income (0-80% of area median income); 11.0 percent of the housing units produced
benefitted households with moderate income (80-120 area median income) and 1.0 percent
benefitted households in the middle income (120+ area median income) category.
Community Outreach and Engagement
Two focus group meetings with residents held on October 27, 2015 at the Enoch Davis Center,
1111 18th Ave. South, St. Petersburg, Florida and November 19, 2015 at Pinellas County Offices,
440 Court St., Clearwater, Florida. Participants in the focus g r o u p meetings included City
and County Staff and Public Housing Authorities' personnel for the various jurisdictions, and
other government representatives; representatives from local colleges, universities, and school

10 | P a g e
districts; non-profit organizations, home builders, housing and social service agencies
representatives; real estate and financial industry representatives; and the general public
and other community representatives. Comment forms were available to the attendees in both
English and Spanish versions.
Discussion in the fair housing focus group meetings spanned numerous issues, but the
following issues were voiced repeatedly; lack of public awareness of fair housing rights, socio-
economic conditions, lack of homebuyer education, predatory lending, credit issues, financial
assistance, special needs housing, financial literacy and public transportation.
Community Reinvestment Act and Home Mortgage Disclosure Act
The Community Reinvestment Act (CRA), enacted by Congress in 1977 (12 U.S.C. 2901) and
implemented by Regulations 12 CFR parts 25, 228, 345, and 563e, is intended to encourage
depository institutions to help meet the credit needs of the communities in which they operate,
including low- and moderate-income neighborhoods, consistent with safe and sound banking
operations. CRA examinations are conducted by the federal agencies that are responsible for
supervising depository institutions: the Board of Governors of the Federal Reserve System (FRB),
the Federal Deposit Insurance Corporation (FDIC), and the Office of the Comptroller of the
Currency (OCC).
For the period covering this Analysis of Impediment 2007-2013, all financial institutions in
Pinellas County governed by the FDIC, FRB and OCC were rated either Outstanding or
Satisfactory, with no Needs Improvement or Substantial Non-Complaint. (Source:
http://www2.fdic.gov/crapes/)
Based on a review of the Home Mortgage Disc losure Act (HMDA) data, overall, origination
rates among Whites were higher than minorities in home purchase, home improvement and
refinance loans. Refinance loans were the most frequent loan type in the County and the three
incorporated cities analyzed in this study. The loan applications and originations were
significantly lower compared to their percentage in population for African Americans, Asians,
and Hispanics in the County and the cities. This suggests two issues, the lack of applications from
minorities and the rate of loan denials. The reasons for lower loan originations among minorities
were inconclusive based on the overall data. However, during the period between 2007 and
2013, of the 57,531 loans that were denied, the majority of loan denial reasons for all applicants
were related to the applicants' poor credit history, lack of collateral, or high debt-to-income
ratio.
11 | P a g e
Additionally, while the analysis offered does not provide conclusive evidence of redlining, the
data tend to suggest some characteristics of redlining may exist. Ideally, origination rates
should be similar among same income groups regardless of the income for the census tract
where the subject property is located. However, the origination rates for all the income groups
increased as the tract income increased and decreased as the tract income decreased. This
indicates that families with similar income are more likely to originate a loan for property in a
higher income census tract in Pinellas County and the incorporated cities. While it is expected
that very low-income applicants tend to have lower origination rates, within the very low-
income census tracts, even high-income applicants showed a poor success rate. However,
due to very low number of applications in the lower income census tracts, any conclusive
determination of redlining is impossible for the County.
12 | P a g e
Fair Housing Index
The Fair Housing Index highlights geographic areas indicating a concentration of attributes
prevalent in fair housing issues. These attributes include high concentrations of minorities,
older a n d f u n c t i o n a l l y o b s o l e s c e n t housing stock, reliance on public transportation,
low income, low housing values and high contract rents, a high percentage of female headed
households with children, a high ratio of loans denied to loans originated, and higher
unemployment rates in the African American and Hispanic communities. The collective
concentration of these issues can lead to neighborhood deterioration and declining market
conditions that tend to impede fair housing choice.
There were strong correlations between percentage minority and the percentage
unemployment, the percentage of female headed households with children, and percentage
using public transportation. This means that minority communities had higher unemployment,
higher number of female-headed households with children and greater reliance on public
transportation to get to work than communities with lower concentrations of minorities. The
percent minority had a moderate negative correlations with median household income,
median rent, and median house value. The percentage of female headed households with
children had a strong negative correlation with median household income and median housing
value, with a moderate negative relationship with median contract rent. This indicates that
minorities and single mothers tend to earn lower incomes and live in lower valued housing.
The loan origination variable, the ratio of denials to originations for all loan types, has a strong
negative correlation to household income, which means that in areas with lower household
incomes, there is a higher rate of denial compared with origination.
As indicated on Map 11 in the Fair Housing Index Section, there are a greater number of higher
risk census tracts concentrated in the southeastern census tracts of the Pinellas County, within
St. Petersburg. There are some higher risk areas in Tarpon Springs, Clearwater, Lealman, and
High Point. These areas of concern are characterized by older housing units, lower housing
values and rents, and are primarily occupied by minority households that have higher
percentages of households headed by females with children than other areas of the County.
There is also a higher than average unemployment rate and lower than average level of
educational attainment.
13 | P a g e
Impediments to Fair Housing and Recommendations
Impediment: Areas of Discrimination
Discrimination as an impediment is evidenced through a few of our data sources and is
experienced by a variety of protected class members.
A. Discrimination with regard to home mortgage loans.
B. Discrimination of nationally and locally protected classes.
C. Competency in Fair Housing Policy
Impediment: Areas of Limited Opportunity
One of the other impediments to fair housing identifiable via the analysis is the County’s areas of
limited opportunity. In essence certain portions of the County have a variety of factors which
preclude their residents from being able to fully and freely choose their housing.
A. Transportation-Burdened Areas
B. Income Barriers
Impediment: Condition of Housing Stock
The housing stock in Pinellas County is fairly old with almost 60% of both owner housing and
renter housing over 35 years old; as a result of age, this housing becomes functionally obsolete
in terms of layout, size, insulation, energy efficiency and electrical connectivity. If renovations or
maintenance to older homes is not performed, especially in low income areas due to cost, it is
likely that owned homes will turn to rental units and eventually decline to create more slum and
blighted communities. Home Improvement loans have the lowest application and origination
rate of the three loan purposes examined in this report, yet the condition of the housing stock is
considered older than the national median average, and the majority of owner occupied housing
is only two bedrooms.
A. Age of Housing
B. Access to Home Improvement Loans
14 | P a g e
Section I: Community Profile
The background data for Pinellas County serves as a tool to provide context for the analysis of
impediments to fair housing. As outlined further in this Report, the background data is often a
factor in the impediments that have been identified. The housing profile section also reflects the
issues associated with fair housing choice in Pinellas County.
All attempts were made to utilize consistent data sources and date timelines. Data from such
sources as the Home Mortgage Disclosure Act, Comprehensive Housing Affordability Strategy
data, the 2010 Census, and the 2013 American Community Survey were utilized as available, but
factors like the 2012 census block realignment have made some data incomparable. The most
recent data available was utilized; however, as the dates vary, some sections may reflect different
time periods. Although, this affects the comparability between sections of this Report or
visualizations, the data still serves as a valuable indicator of impediments to fair housing choice.
Demographic and Socioeconomic Characteristics
The data and analysis of Pinellas County’s demographic, economic, and geographic
characteristics set the stage for identifying and analyzing the housing impediments identified
later in this Report. The consideration of these factors allowed the analysis to focus further on
issues facing the County’s diverse and rapidly changing population of residents.
Population
Pinellas County had a total population of 916,812 and 920,015 according to the 2010 Census and
the 2013 American Community Survey (ACS), respectively; both data sources indicate 52 percent
females and 48 percent males. The median age was 46.6 years (2013 ACS). Minors, or those under
18 years of age, represent 17.2 percent of the population while 22.6 percent was 65 years and
older. These figures are below and above the national averages, respectively, which reflects the
popularity of Pinellas County and Florida as retirement destinations.
Pinellas County is the second smallest County in the State by area; however, it is the most densely
populated, with over 3,300 people per square mile. Although the population of Pinellas County
has increased since 2010, it is at a much lower rate than that of Florida and the country as a
whole (Table 1).

15 | P a g e
Table 1: Population Change 2010-2013
Pinellas County Florida U.S.
Population 2010 916,812 18,804,623 308,758,105
Population 2013 929,048 19,552,860 316,128,839
% change +1.4 +4.0 +2.4
Source: United States Census Bureau QuickFacts
Age
Pinellas County’s age distribution is shown in Chart 1, below. Although those under 20 years of
age make up the single largest group, the group also encompasses the largest age distribution.
Most notably, almost half (44.8 percent) of the population is 50 years of age or older. This age
distribution implies that as baby boomers age into retirement, the already heavily weighted older
population will be in need of additional housing options that appeal to retirees.
Chart 1: Pinellas County Age Distribution
Source: US Census Bureau, 2009-2013 5-Year American Community Survey
Racial and Ethnic Composition
The majority (97.9 percent) of Pinellas County residents identify as one race, which indicates a
small increase from the 2000 Census of those identifying with two or more races (1.6 percent up
to 2.1 percent). Those individuals who identify as White make up the majority of Pinellas County’s
population, at 83.2 percent; those identifying as African American make up the second largest
racial group at 10.3 percent. The third largest racial group in the County is made up of individuals
identifying as “Asian alone” at 3.1 percent.

16 | P a g e
A significant portion of the Pinellas County (8.2 percent) population identify as Hispanic or Latino
origin. Table 2 outlines the overall racial demographics in the County while Table 3 outlines this
data with consideration for ethnic differences.
Table 2: Pinellas County Race Composition
Estimate
% of Total
Population
Total: 920,015 100%
Population of One Race: 900,376 97.9%
White 765,324 83.2%
African American 94,925 10.3%
American Indian and Alaska Native 2,246 0.2%
Asian 28,251 3.1%
Native Hawaiian and Other Pacific Islander 757 0.1%
Other Race 8,873 1.0%
Population of Two or More Races: 19,639 2.1%
Two Races Including Some Other Race 2,618 0.3%
Two Races Excluding Some Other Race & Three or More Races 17,021 1.9%
Population of Two Races: 18,680 2.0%
White; African American 7,181 0.8%
White; American Indian and Alaska Native 3,151 0.3%
White; Asian 4,200 0.5%
African American; American Indian and Alaska Native 267 0.0%
All Other Two Race Combinations 3,881 0.4%
Population of Three Races 884 0.1%
Population of Four or More Races 75 0.0%
Source: US Census Bureau, 2009-2013 5-Year American Community Survey
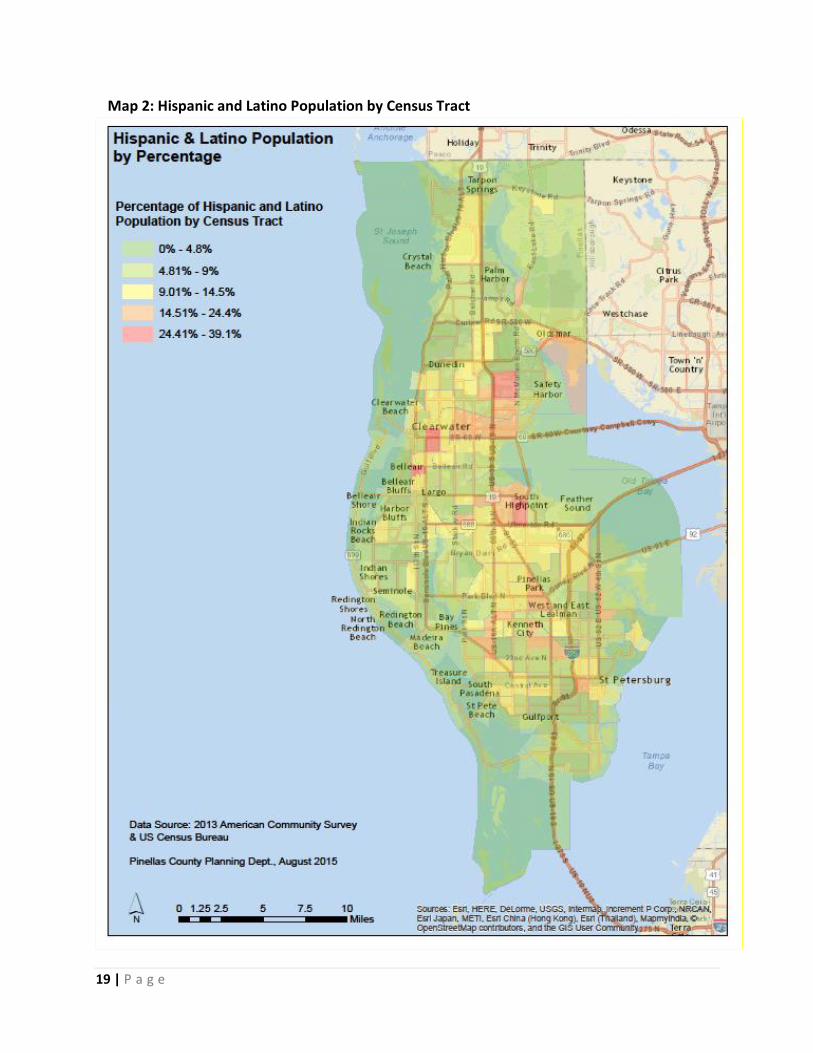
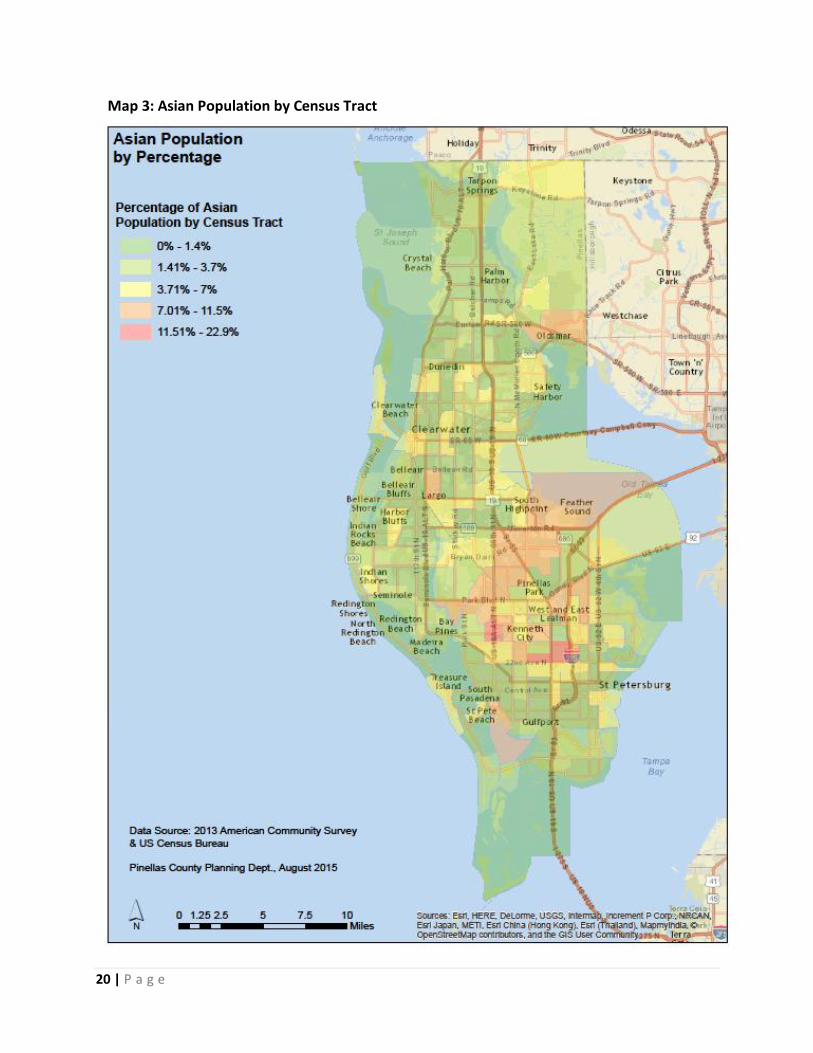
Included in Maps 1, 2 and 3 are the population percentages by census tract of the three largest
racial minority groups in the County. As can be seen there are several areas of the County which
are clusters of racial or ethnic minorities, including: Southeast St. Petersburg, the Greater
Ridgecrest Area in unincorporated Largo, and areas of Clearwater and Tarpon Springs. Although
some areas of the County offer a more integrated community composition, a significant portion
of the County is composed of predominantly White neighborhoods.

17 | P a g e
Table 3: Pinellas County Race and Ethnicity
Hispanic or Latino and Race Estimate % of Total Pop.
Total: 920,015 100%
Hispanic or Latino (of any Race) 75,821 8.2%
Mexican 20,792 2.3%
Puerto Rican 23,009 2.5%
Cuban 9,764 1.1%
Other Hispanic or Latino 22,256 2.4%
Not Hispanic or Latino 844,194 91.8%
White Alone 703,115 76.4%
African American Alone 93,099 10.1%
American Indian and Alaska Native Alone 2,042 0.2%
Asian Alone 28,111 3.1%
Native Hawaiian and Other Pacific Island Alone 707 0.1%
Some Other Race Alone 1,219 0.1%
Two or More Races 15,901 1.7%
Two Races Including Some Other Race 674 0.1%
Two Races Excluding Some Other Race & Three or More Races 15,227 1.7%
Source: US Census Bureau, 2009-2013 5-Year American Community Survey

18 | P a g e
Map 1: African American Population by Census Tract
19 | P a g e
Map 2: Hispanic and Latino Population by Census Tract
20 | P a g e
Map 3: Asian Population by Census Tract

21 | P a g e
Nativity and Language
Over thirty percent (31.4 percent) of Pinellas County residents are native Floridians (2013 ASC);
slightly more than eleven percent (11.4 percent) of Pinellas County residents are foreign born
(2009-2013 ACS) and of those 55.4 percent are naturalized citizens. Interestingly, when
compared to the national and state data, Pinellas County has a smaller foreign born population
(US - 12.9 percent, FL - 19.4 percent), but a higher percentage of residents who are naturalized
(US - 45.1 percent, FL - 50.6 percent)*. This indicates that although fewer of Pinellas County’s
residents are foreign born, a larger portion of those that are have become citizens. Another item
of consideration for the County is the fact that 24.3 percent of foreign born residents are of
Hispanic or Latino origin (of any race), a significantly smaller ratio than the national (46.5 percent)
or state (56.8 percent) levels.
Most (86.8 percent) of Pinellas County’s residents over five years of age speak only English, while
5.3 percent speak English “less than ‘very well’” (2009-2013 ACS). This population is important to
consider in policy making decisions, service delivery, and housing discrimination issues. Almost
half (45.7 percent) of those who speak another language at home, speak Spanish or Spanish
Creole (2009-2013 ACS). Those Spanish speakers who are foreign born are significantly less likely
to be naturalized, with only 18.6 percent becoming citizens*. The 2013 American Community
Survey estimates that 3.0 percent of Pinellas County households do not include English speakers
(defined as those who only speak English or speak English “very well”, age 14 and older). Over a
quarter (26.3 percent) of these households is Spanish speaking, 23.3 percent speak a language of
Asian or Pacific Island origin, 17.5 percent speak Indo-European languages, and 11.8 percent are
defined as “other”.
Per research released by the Bureau of Economic and Business Research, University of Florida, of
the 3.0 percent Asian population in Pinellas County, the largest group within in the Asian
population is Vietnamese at 30.0 percent. Asians were the fastest growing racial group in Florida
and the United States from 2000 to 2010; the Asian-alone population increased by 70.8% in
Florida but only by 43.3% in the United States. If trends continue, Asians will soon exceed the
500,000 mark in Florida.
*Note: The data only enumerates those individuals who have become citizens, with no indication
to the immigration status of other foreign born residents.
22 | P a g e
Households and Families
In the 2009‐2013 reporting period for the American Community Survey, there were 401,708
households (occupied housing units) in Pinellas County; the average household size was 2.24
people, while the average family size is 2.97 people.
Families made up 55.6 percent of the households in Pinellas County; of this figure, married‐
couple families account for 72.9 percent, male householders with no wife present account for 7
percent, and female householders with no husband present account for 20.1 percent of family
households. Nonfamily households made up 44.4 percent of all households in Pinellas County.
Most (83.4 percent) of the nonfamily households were people living alone, with a small minority
of households comprised of people living in households in which no one was related to the
householder. Of note, 30.4 percent (approximately 54,290 people) of the nonfamily households
are at least 65 years old and living alone.
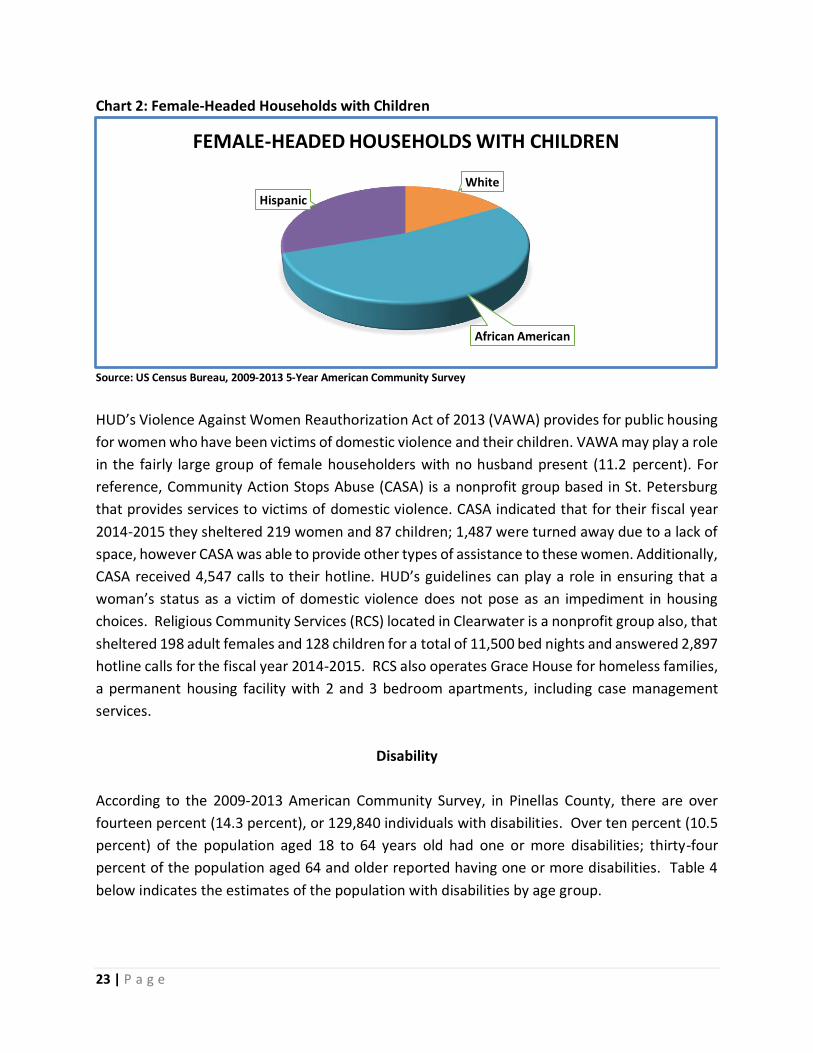
When considering all family types with children present, the data indicates that 54.5 percent
of all White households, 59.9 percent of all African American households, and 64.7
percent of all Hispanic households were in this household type. However, minority households
face the most significant challenges to fair housing choice, largely due to their household
characteristics compared in Chart 2; the percentage of female-headed households with children
among White households was 9.3 percent, compared to 30.1 percent in African American
households, and 17.2 percent in Hispanic households.
Non-family households among Whites made up 45.5 percent of all White households in Pinellas
County. Non-family households among African Americans accounted for 40.1 percent of all
African American households. Non-family households among Hispanics accounted for 35.3
percent of all Hispanic households.
23 | P a g e
Chart 2: Female-Headed Households with Children
Source: US Census Bureau, 2009-2013 5-Year American Community Survey
HUD’s Violence Against Women Reauthorization Act of 2013 (VAWA) provides for public housing
for women who have been victims of domestic violence and their children. VAWA may play a role
in the fairly large group of female householders with no husband present (11.2 percent). For
reference, Community Action Stops Abuse (CASA) is a nonprofit group based in St. Petersburg
that provides services to victims of domestic violence. CASA indicated that for their fiscal year
2014-2015 they sheltered 219 women and 87 children; 1,487 were turned away due to a lack of
space, however CASA was able to provide other types of assistance to these women. Additionally,
CASA received 4,547 calls to their hotline. HUD’s guidelines can play a role in ensuring that a
woman’s status as a victim of domestic violence does not pose as an impediment in housing
choices. Religious Community Services (RCS) located in Clearwater is a nonprofit group also, that
sheltered 198 adult females and 128 children for a total of 11,500 bed nights and answered 2,897
hotline calls for the fiscal year 2014-2015. RCS also operates Grace House for homeless families,
a permanent housing facility with 2 and 3 bedroom apartments, including case management
services.
Disability
According to the 2009-2013 American Community Survey, in Pinellas County, there are over
fourteen percent (14.3 percent), or 129,840 individuals with disabilities. Over ten percent (10.5
percent) of the population aged 18 to 64 years old had one or more disabilities; thirty-four
percent of the population aged 64 and older reported having one or more disabilities. Table 4
below indicates the estimates of the population with disabilities by age group.
White
African American
Hispanic
FEMALE-HEADED HOUSEHOLDS WITH CHILDREN

24 | P a g e
Table 4: Population with Disabilities by Age Group for 2013
Subject Number with
a Disability
Percent with
a Disability
Total civilian non-institutionalized population 129,840 14.3%
Population under 5 years 189 0.4%
With a hearing difficulty 148 0.3%
With a vision difficulty 54 0.1%
Population 5 to 17 years 5,879 4.9%
With a hearing difficulty 543 0.5%
With a vision difficulty 866 0.7%
With a cognitive difficulty 4,441 3.7%
With an ambulatory difficulty 857 0.7%
With a self-care difficulty 886 0.7%
Population 18 to 64 years 57,884 10.5%
With a hearing difficulty 9,530 1.7%
With a vision difficulty 9,449 1.7%
With a cognitive difficulty 24,813 4.5%
With an ambulatory difficulty 31,191 5.6%
With a self-care difficulty 10,905 2.0%
With an independent living difficulty 22,528 4.1%
Population 65 years and over 65,888 34.0%
With a hearing difficulty 28,202 14.6%
With a vision difficulty 11,654 6.0%
With a cognitive difficulty 15,722 8.1%
With an ambulatory difficulty 42,938 22.2%
With a self-care difficulty 14,523 7.5%
With an independent living difficulty 28,360 14.6%
Source: US Census Bureau, 2009-2013 5-Year American Community Survey
Veterans
Pinellas County’s veteran population (94,997) over the age of 18 (2009-2013 ACS) is 12.5 percent
of the total population. This figure is higher than the 9 percent national average, but is likely
attributable to several factors including the presence of a VA Medical Center, proximity to Mac
Dill Air Force Base and general appeal to retirees; in fact, 73.9 percent of Pinellas County veterans
are 55 or older, as compared to the 66.8 percent national average.
25 | P a g e
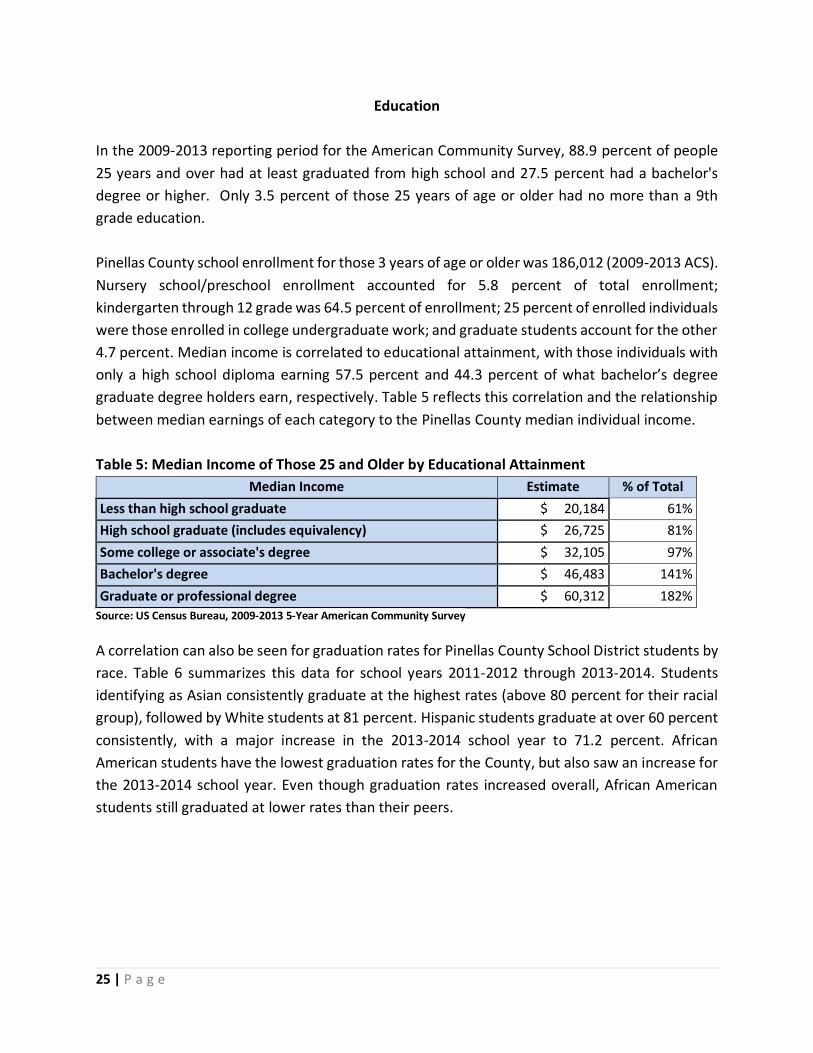
Education
In the 2009‐2013 reporting period for the American Community Survey, 88.9 percent of people
25 years and over had at least graduated from high school and 27.5 percent had a bachelor's
degree or higher. Only 3.5 percent of those 25 years of age or older had no more than a 9th
grade education.
Pinellas County school enrollment for those 3 years of age or older was 186,012 (2009-2013 ACS).
Nursery school/preschool enrollment accounted for 5.8 percent of total enrollment;
kindergarten through 12 grade was 64.5 percent of enrollment; 25 percent of enrolled individuals
were those enrolled in college undergraduate work; and graduate students account for the other
4.7 percent. Median income is correlated to educational attainment, with those individuals with
only a high school diploma earning 57.5 percent and 44.3 percent of what bachelor’s degree
graduate degree holders earn, respectively. Table 5 reflects this correlation and the relationship
between median earnings of each category to the Pinellas County median individual income.
Table 5: Median Income of Those 25 and Older by Educational Attainment
Median Income Estimate % of Total
Less than high school graduate $ 20,184 61%
High school graduate (includes equivalency) $ 26,725 81%
Some college or associate's degree $ 32,105 97%
Bachelor's degree $ 46,483 141%
Graduate or professional degree $ 60,312 182%
Source: US Census Bureau, 2009-2013 5-Year American Community Survey
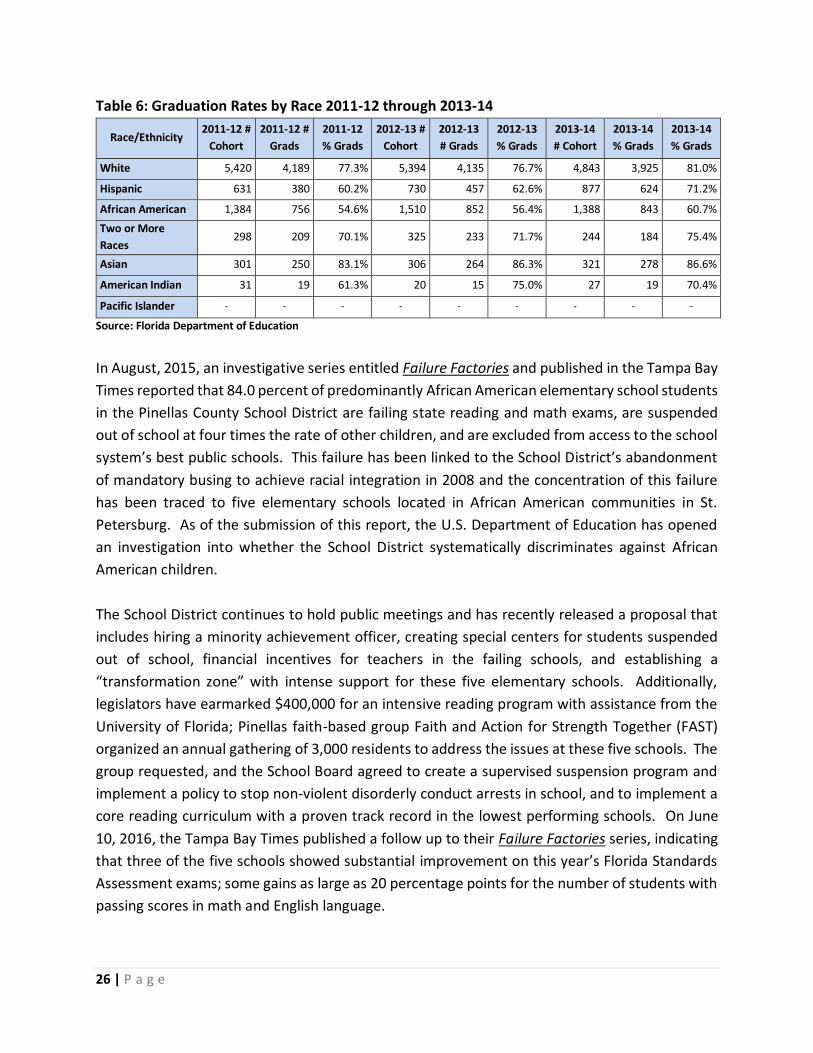
A correlation can also be seen for graduation rates for Pinellas County School District students by
race. Table 6 summarizes this data for school years 2011-2012 through 2013-2014. Students
identifying as Asian consistently graduate at the highest rates (above 80 percent for their racial
group), followed by White students at 81 percent. Hispanic students graduate at over 60 percent
consistently, with a major increase in the 2013-2014 school year to 71.2 percent. African
American students have the lowest graduation rates for the County, but also saw an increase for
the 2013-2014 school year. Even though graduation rates increased overall, African American
students still graduated at lower rates than their peers.
26 | P a g e
Table 6: Graduation Rates by Race 2011-12 through 2013-14
Race/Ethnicity 2011-12 #
Cohort
2011-12 #
Grads
2011-12
% Grads
2012-13 #
Cohort
2012-13
# Grads
2012-13
% Grads
2013-14
# Cohort
2013-14
% Grads
2013-14
% Grads
White 5,420 4,189 77.3% 5,394 4,135 76.7% 4,843 3,925 81.0%
Hispanic 631 380 60.2% 730 457 62.6% 877 624 71.2%
African American 1,384 756 54.6% 1,510 852 56.4% 1,388 843 60.7%
Two or More
Races 298 209 70.1% 325 233 71.7% 244 184 75.4%
Asian 301 250 83.1% 306 264 86.3% 321 278 86.6%
American Indian 31 19 61.3% 20 15 75.0% 27 19 70.4%
Pacific Islander - - - - - - - - -
Source: Florida Department of Education
In August, 2015, an investigative series entitled Failure Factories and published in the Tampa Bay
Times reported that 84.0 percent of predominantly African American elementary school students
in the Pinellas County School District are failing state reading and math exams, are suspended
out of school at four times the rate of other children, and are excluded from access to the school
system’s best public schools. This failure has been linked to the School District’s abandonment
of mandatory busing to achieve racial integration in 2008 and the concentration of this failure
has been traced to five elementary schools located in African American communities in St.
Petersburg. As of the submission of this report, the U.S. Department of Education has opened
an investigation into whether the School District systematically discriminates against African
American children.
The School District continues to hold public meetings and has recently released a proposal that
includes hiring a minority achievement officer, creating special centers for students suspended
out of school, financial incentives for teachers in the failing schools, and establishing a
“transformation zone” with intense support for these five elementary schools. Additionally,
legislators have earmarked $400,000 for an intensive reading program with assistance from the
University of Florida; Pinellas faith-based group Faith and Action for Strength Together (FAST)
organized an annual gathering of 3,000 residents to address the issues at these five schools. The
group requested, and the School Board agreed to create a supervised suspension program and
implement a policy to stop non-violent disorderly conduct arrests in school, and to implement a
core reading curriculum with a proven track record in the lowest performing schools. On June
10, 2016, the Tampa Bay Times published a follow up to their Failure Factories series, indicating
that three of the five schools showed substantial improvement on this year’s Florida Standards
Assessment exams; some gains as large as 20 percentage points for the number of students with
passing scores in math and English language.
27 | P a g e
Most recently, on May, 19, 2017, the Tampa Bay Times published an article entitled New Pinellas
schools plan touted as “turning point” that would tackle achievement gap in 10 years, reporting
that after more than a year of negotiations, the Pinellas County School District has reached a new
agreement addressing graduation, student achievement, advanced coursework, student
discipline, identification for special education and gifted programs and minority hiring. The
president of Concerned Organization for the Quality Education of Black Students (COQEBS),
Ricardo Davis, is supportive of the agreement, “We see this as a very significant turning point in
this district”. Specific and measurable initiatives include testing all second graders for gifted
programs, and identification of the top 20 percent of seventh graders to attend “Talent
Identification Program”, and recruitment of teachers of color that meets or exceeds the
percentage enrollment of black students.
Income
Based on the 2009-2013 American Community Survey, the per capita annual income for Pinellas
County was $29,262. The median annual income for households was $45,535, which affords
approximately $1,138 a month for housing costs; the median annual family income was $59,491,
affording $1,487 per month for housing costs; and the median non-family annual income of
$30,698 affording $767. Slightly more than 69 percent of households (277,188) received earnings
(wages), with a median wage for workers of $30,378 annually, and nearly 37.8 percent of
households (151,667) received Social Security, with the median income from Social Security at
$17,250 annually.

28 | P a g e
Chart 3: Selected Income Subjects for Pinellas County - 2013
Source: US Census Bureau, 2009-2013 5-Year American Community Survey
Chart 4: Income for Total Households and Families - 2013
Source: US Census Bureau, 2009-2013 5-Year American Community Survey

29 | P a g e
Map 4: Median Income by Census Tract for Pinellas County - 2013
30 | P a g e
Poverty
According to the 2009‐2013 American Community Survey, 14.1 percent of people in Pinellas
County were in poverty. Over a fifth (20.6 percent) of related children under 18, 13.9 percent of
adults (18-64 years old), and 8.9 percent of people at least 65 years old were below the poverty
level. For all family types, 9.5 percent were below the poverty level and 5.0 percent of married
families were below the poverty level. However, 23.8 percent of families consisting of female
householders with no husband present families were below the poverty level.
Racial and ethnic groups are also disproportionately affected by poverty. Only 7.4 percent of
White Pinellas County residents live in poverty; however, 26.9 percent of African Americans fall
below the poverty level, followed by 26.2 percent of those who identify as “some other race”,
and 12.8 percent of those who identify with two or more races. Individuals who identify as of
Hispanic or Latino origin (of any race) also see higher rates of poverty rates (17.5 percent).
There are higher concentrations of individuals living below the poverty level in some areas of the
County. Specifically these areas include South St. Petersburg, the Greater Ridgecrest Area in
unincorporated Largo, Lealman, Highpoint, and North Greenwood, Lake Bellevue, and East
Gateway in Clearwater and areas in northern Tarpon Springs.
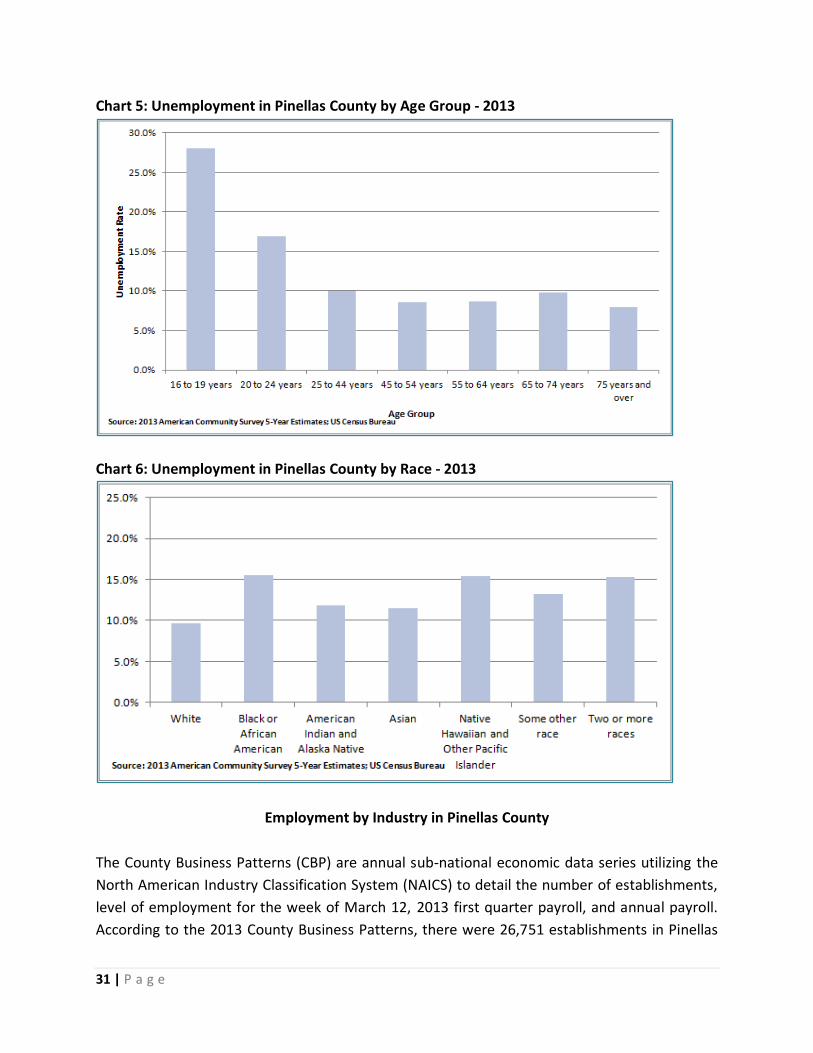
Employment and Unemployment in Pinellas County
According to the 2009-2013 American Community Survey, fifty-nine percent (59.3 percent) of the
population in Pinellas County aged 16 years and over were in the labor force. Females aged 16
years and over accounted for 227,242 in the civilian labor force. The size of the civilian labor
force was 460,339, with an unemployment rate below eleven percent (10.5 percent).
31 | P a g e
Chart 5: Unemployment in Pinellas County by Age Group - 2013
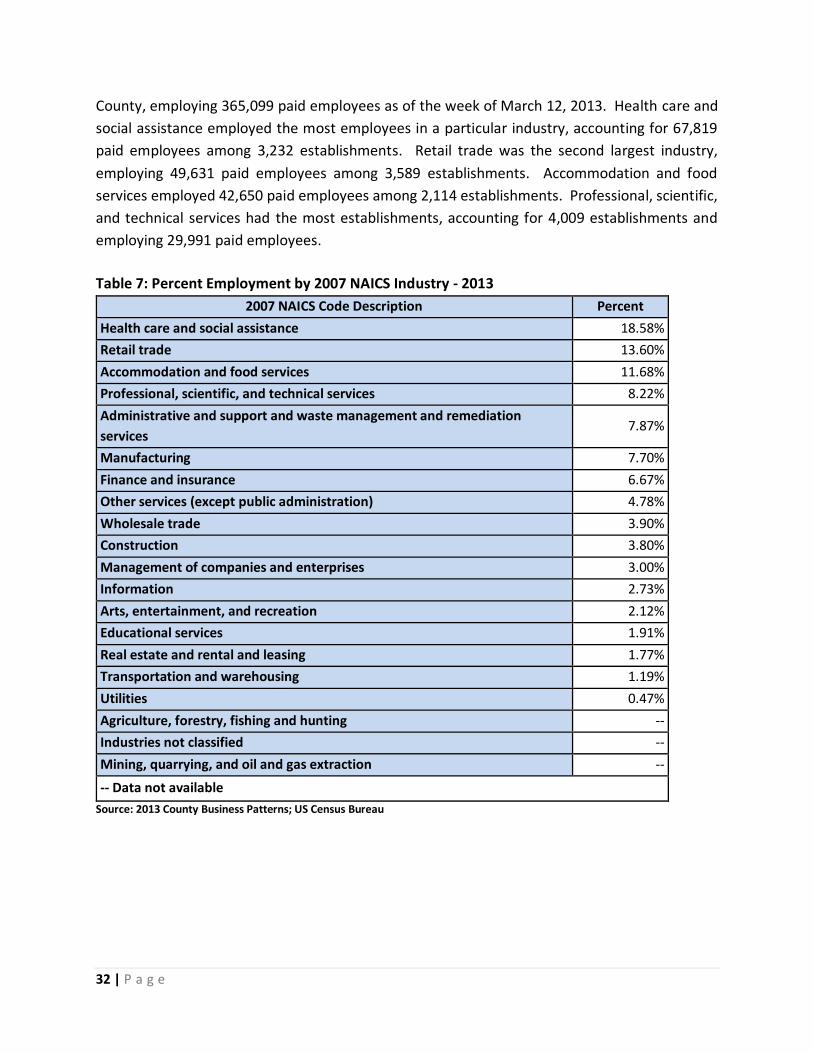
Chart 6: Unemployment in Pinellas County by Race - 2013
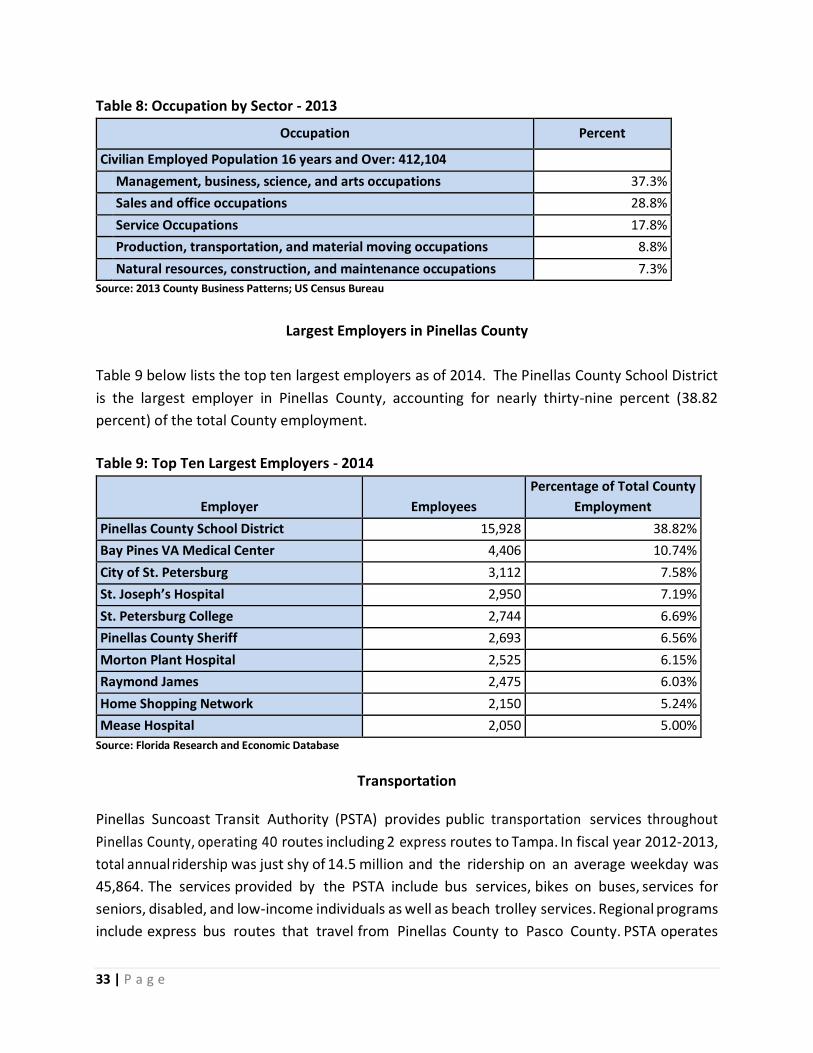
Employment by Industry in Pinellas County
The County Business Patterns (CBP) are annual sub-national economic data series utilizing the
North American Industry Classification System (NAICS) to detail the number of establishments,
level of employment for the week of March 12, 2013 first quarter payroll, and annual payroll.
According to the 2013 County Business Patterns, there were 26,751 establishments in Pinellas
32 | P a g e
County, employing 365,099 paid employees as of the week of March 12, 2013. Health care and
social assistance employed the most employees in a particular industry, accounting for 67,819
paid employees among 3,232 establishments. Retail trade was the second largest industry,
employing 49,631 paid employees among 3,589 establishments. Accommodation and food
services employed 42,650 paid employees among 2,114 establishments. Professional, scientific,
and technical services had the most establishments, accounting for 4,009 establishments and
employing 29,991 paid employees.
Table 7: Percent Employment by 2007 NAICS Industry - 2013
2007 NAICS Code Description Percent
Health care and social assistance 18.58%
Retail trade 13.60%
Accommodation and food services 11.68%
Professional, scientific, and technical services 8.22%
Administrative and support and waste management and remediation
services 7.87%
Manufacturing 7.70%
Finance and insurance 6.67%
Other services (except public administration) 4.78%
Wholesale trade 3.90%
Construction 3.80%
Management of companies and enterprises 3.00%
Information 2.73%
Arts, entertainment, and recreation 2.12%
Educational services 1.91%
Real estate and rental and leasing 1.77%
Transportation and warehousing 1.19%
Utilities 0.47%
Agriculture, forestry, fishing and hunting --
Industries not classified --
Mining, quarrying, and oil and gas extraction --
-- Data not available
Source: 2013 County Business Patterns; US Census Bureau
33 | P a g e
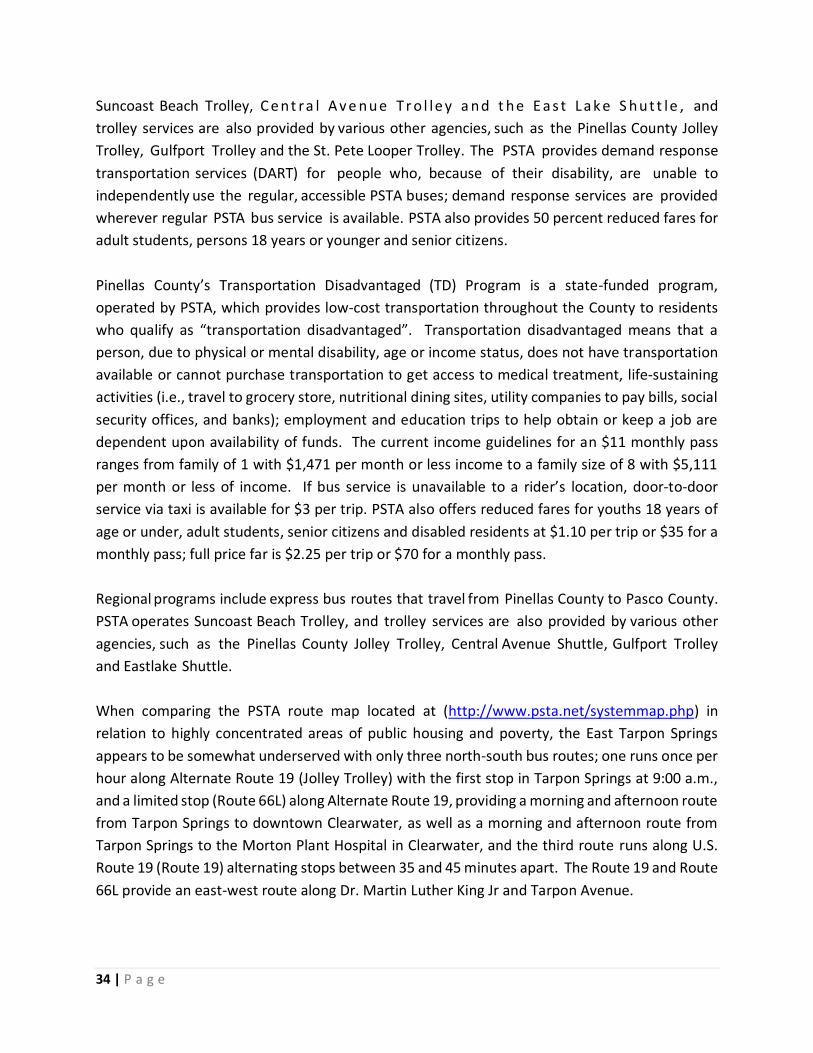
Table 8: Occupation by Sector - 2013
Occupation Percent
Civilian Employed Population 16 years and Over: 412,104
Management, business, science, and arts occupations 37.3%
Sales and office occupations 28.8%
Service Occupations 17.8%
Production, transportation, and material moving occupations 8.8%
Natural resources, construction, and maintenance occupations 7.3%
Source: 2013 County Business Patterns; US Census Bureau
Largest Employers in Pinellas County
Table 9 below lists the top ten largest employers as of 2014. The Pinellas County School District
is the largest employer in Pinellas County, accounting for nearly thirty-nine percent (38.82
percent) of the total County employment.
Table 9: Top Ten Largest Employers - 2014
Employer
Employees
Percentage of Total County
Employment
Pinellas County School District 15,928 38.82%
Bay Pines VA Medical Center 4,406 10.74%
City of St. Petersburg 3,112 7.58%
St. Joseph’s Hospital 2,950 7.19%
St. Petersburg College 2,744 6.69%
Pinellas County Sheriff 2,693 6.56%
Morton Plant Hospital 2,525 6.15%
Raymond James 2,475 6.03%
Home Shopping Network 2,150 5.24%
Mease Hospital 2,050 5.00%
Source: Florida Research and Economic Database
Transportation
Pinellas Suncoast Transit Authority (PSTA) provides public transportation services throughout
Pinellas County, operating 40 routes including 2 express routes to Tampa. In fiscal year 2012-2013,
total annual ridership was just shy of 14.5 million and the ridership on an average weekday was
45,864. The services provided by the PSTA include bus services, bikes on buses, services for
seniors, disabled, and low-income individuals as well as beach trolley services. Regional programs
include express bus routes that travel from Pinellas County to Pasco County. PSTA operates
34 | P a g e
Suncoast Beach Trolley, C e n t ra l A v e n u e Tr o l le y a n d t h e E a s t L a k e S h u t t le , and
trolley services are also provided by various other agencies, such as the Pinellas County Jolley
Trolley, Gulfport Trolley and the St. Pete Looper Trolley. The PSTA provides demand response
transportation services (DART) for people who, because of their disability, are unable to
independently use the regular, accessible PSTA buses; demand response services are provided
wherever regular PSTA bus service is available. PSTA also provides 50 percent reduced fares for
adult students, persons 18 years or younger and senior citizens.
Pinellas County’s Transportation Disadvantaged (TD) Program is a state-funded program,
operated by PSTA, which provides low-cost transportation throughout the County to residents
who qualify as “transportation disadvantaged”. Transportation disadvantaged means that a
person, due to physical or mental disability, age or income status, does not have transportation
available or cannot purchase transportation to get access to medical treatment, life-sustaining
activities (i.e., travel to grocery store, nutritional dining sites, utility companies to pay bills, social
security offices, and banks); employment and education trips to help obtain or keep a job are
dependent upon availability of funds. The current income guidelines for an $11 monthly pass
ranges from family of 1 with $1,471 per month or less income to a family size of 8 with $5,111
per month or less of income. If bus service is unavailable to a rider’s location, door-to-door
service via taxi is available for $3 per trip. PSTA also offers reduced fares for youths 18 years of
age or under, adult students, senior citizens and disabled residents at $1.10 per trip or $35 for a
monthly pass; full price far is $2.25 per trip or $70 for a monthly pass.
Regional programs include express bus routes that travel from Pinellas County to Pasco County.
PSTA operates Suncoast Beach Trolley, and trolley services are also provided by various other
agencies, such as the Pinellas County Jolley Trolley, Central Avenue Shuttle, Gulfport Trolley
and Eastlake Shuttle.
When comparing the PSTA route map located at (http://www.psta.net/systemmap.php) in
relation to highly concentrated areas of public housing and poverty, the East Tarpon Springs
appears to be somewhat underserved with only three north-south bus routes; one runs once per
hour along Alternate Route 19 (Jolley Trolley) with the first stop in Tarpon Springs at 9:00 a.m.,
and a limited stop (Route 66L) along Alternate Route 19, providing a morning and afternoon route
from Tarpon Springs to downtown Clearwater, as well as a morning and afternoon route from
Tarpon Springs to the Morton Plant Hospital in Clearwater, and the third route runs along U.S.
Route 19 (Route 19) alternating stops between 35 and 45 minutes apart. The Route 19 and Route
66L provide an east-west route along Dr. Martin Luther King Jr and Tarpon Avenue.
35 | P a g e
Section II: Housing Profile
Housing Characteristics
The 2009-2013 American Community Survey indicated that Pinellas County had a total of 502,308
housing units, of which twenty percent (20 percent) were vacant. Single-unit structures
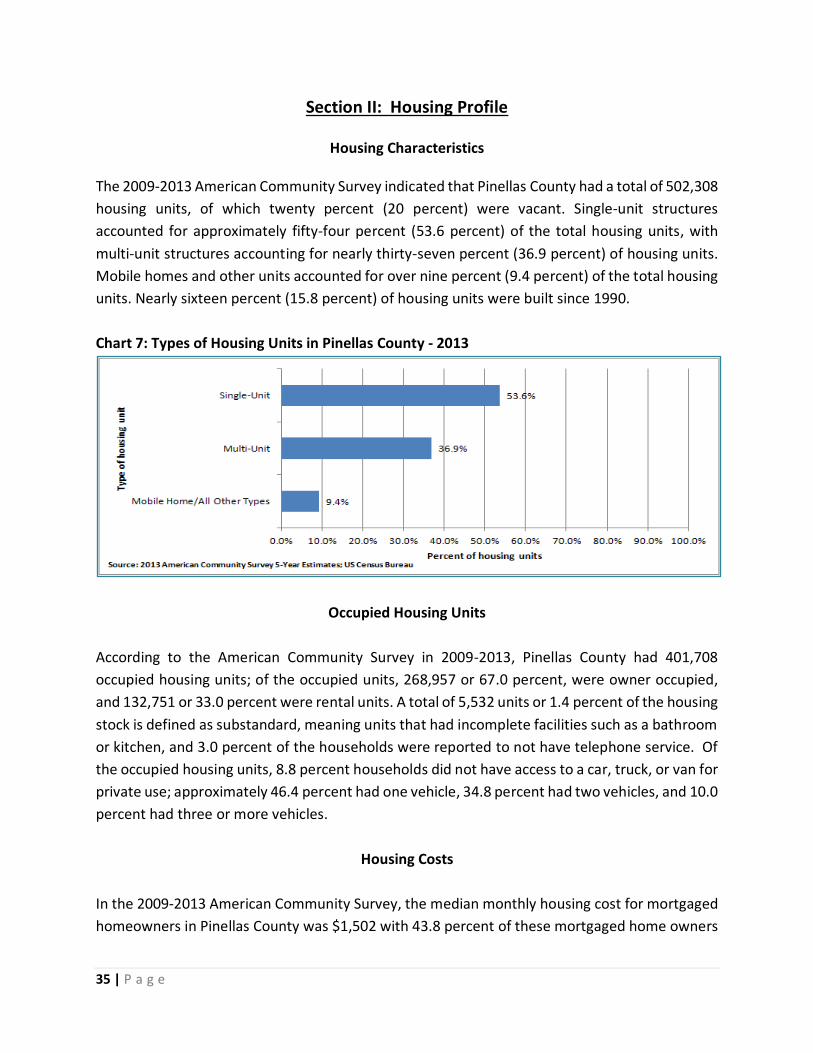
accounted for approximately fifty-four percent (53.6 percent) of the total housing units, with
multi-unit structures accounting for nearly thirty-seven percent (36.9 percent) of housing units.
Mobile homes and other units accounted for over nine percent (9.4 percent) of the total housing
units. Nearly sixteen percent (15.8 percent) of housing units were built since 1990.
Chart 7: Types of Housing Units in Pinellas County - 2013
Occupied Housing Units
According to the American Community Survey in 2009-2013, Pinellas County had 401,708
occupied housing units; of the occupied units, 268,957 or 67.0 percent, were owner occupied,
and 132,751 or 33.0 percent were rental units. A total of 5,532 units or 1.4 percent of the housing
stock is defined as substandard, meaning units that had incomplete facilities such as a bathroom
or kitchen, and 3.0 percent of the households were reported to not have telephone service. Of
the occupied housing units, 8.8 percent households did not have access to a car, truck, or van for
private use; approximately 46.4 percent had one vehicle, 34.8 percent had two vehicles, and 10.0
percent had three or more vehicles.
Housing Costs
In the 2009-2013 American Community Survey, the median monthly housing cost for mortgaged
homeowners in Pinellas County was $1,502 with 43.8 percent of these mortgaged home owners
36 | P a g e
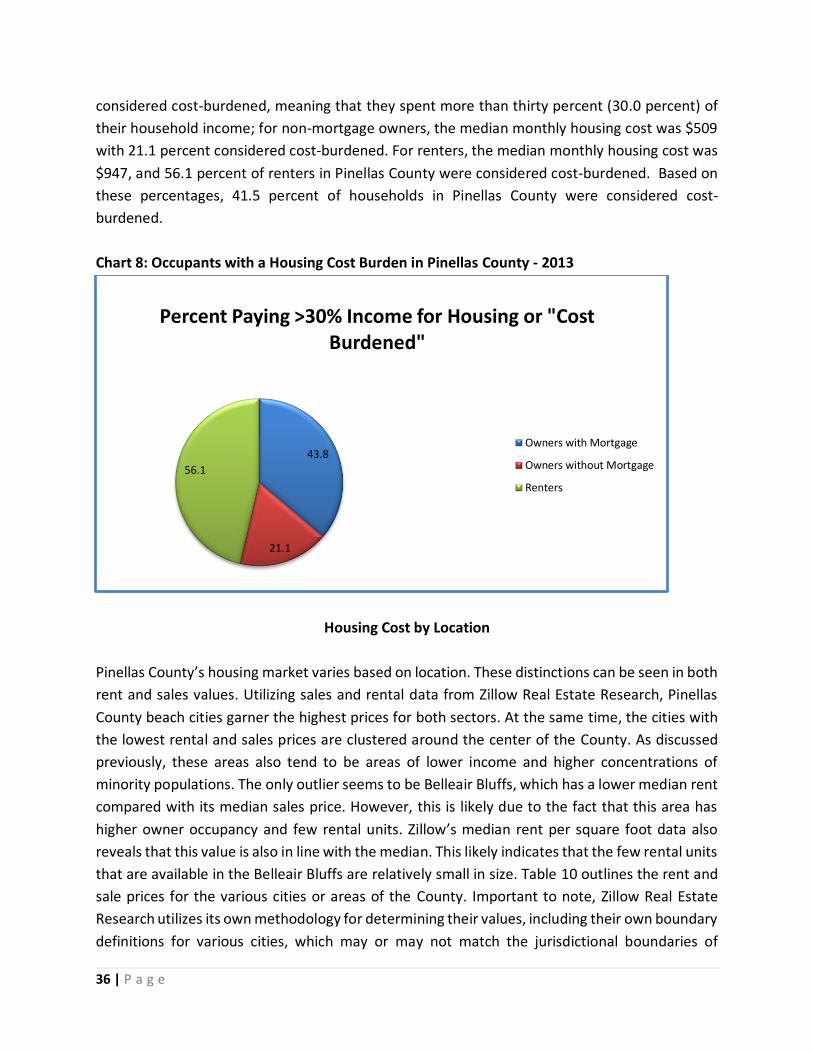
considered cost-burdened, meaning that they spent more than thirty percent (30.0 percent) of
their household income; for non-mortgage owners, the median monthly housing cost was $509
with 21.1 percent considered cost-burdened. For renters, the median monthly housing cost was
$947, and 56.1 percent of renters in Pinellas County were considered cost-burdened. Based on
these percentages, 41.5 percent of households in Pinellas County were considered cost-
burdened.
Chart 8: Occupants with a Housing Cost Burden in Pinellas County - 2013
Housing Cost by Location
Pinellas County’s housing market varies based on location. These distinctions can be seen in both
rent and sales values. Utilizing sales and rental data from Zillow Real Estate Research, Pinellas
County beach cities garner the highest prices for both sectors. At the same time, the cities with
the lowest rental and sales prices are clustered around the center of the County. As discussed
previously, these areas also tend to be areas of lower income and higher concentrations of
minority populations. The only outlier seems to be Belleair Bluffs, which has a lower median rent
compared with its median sales price. However, this is likely due to the fact that this area has
higher owner occupancy and few rental units. Zillow’s median rent per square foot data also
reveals that this value is also in line with the median. This likely indicates that the few rental units
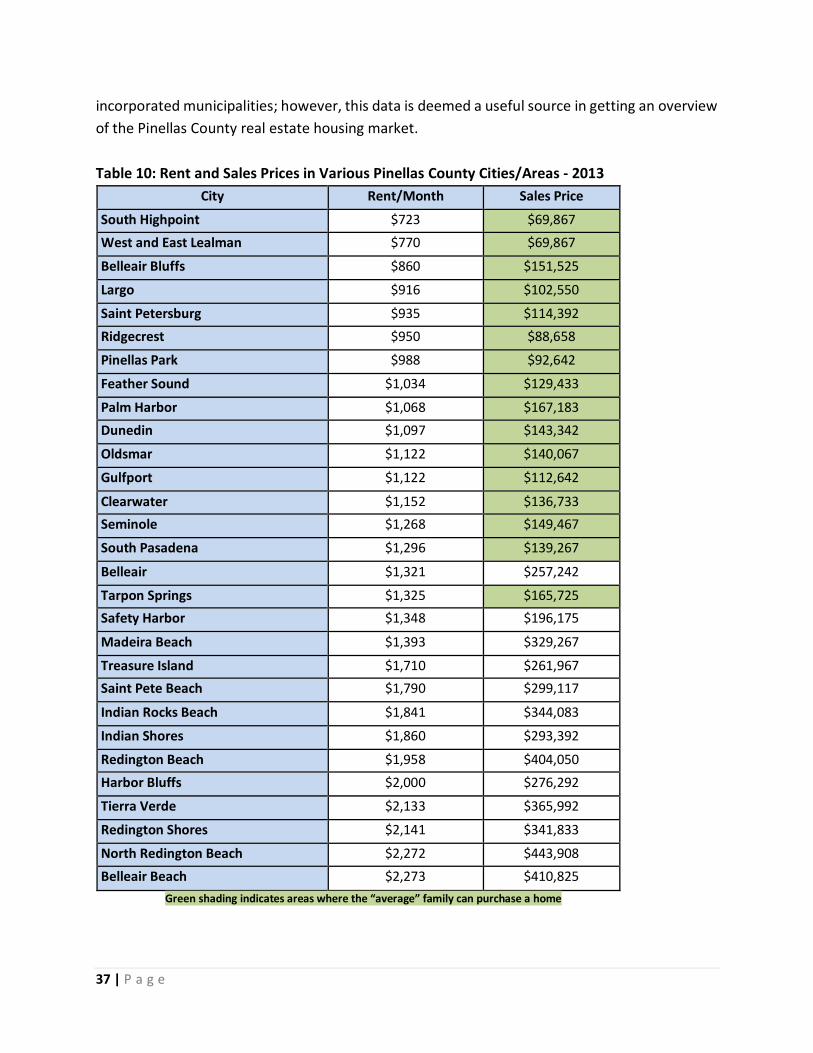
that are available in the Belleair Bluffs are relatively small in size. Table 10 outlines the rent and
sale prices for the various cities or areas of the County. Important to note, Zillow Real Estate
Research utilizes its own methodology for determining their values, including their own boundary
definitions for various cities, which may or may not match the jurisdictional boundaries of
43.8
21.1
56.1
Percent Paying >30% Income for Housing or "Cost Burdened"
Owners with Mortgage
Owners without Mortgage
Renters
37 | P a g e
incorporated municipalities; however, this data is deemed a useful source in getting an overview
of the Pinellas County real estate housing market.
Table 10: Rent and Sales Prices in Various Pinellas County Cities/Areas - 2013
City Rent/Month Sales Price
South Highpoint $723 $69,867
West and East Lealman $770 $69,867
Belleair Bluffs $860 $151,525
Largo $916 $102,550
Saint Petersburg $935 $114,392
Ridgecrest $950 $88,658
Pinellas Park $988 $92,642
Feather Sound $1,034 $129,433
Palm Harbor $1,068 $167,183
Dunedin $1,097 $143,342
Oldsmar $1,122 $140,067
Gulfport $1,122 $112,642
Clearwater $1,152 $136,733
Seminole $1,268 $149,467
South Pasadena $1,296 $139,267
Belleair $1,321 $257,242
Tarpon Springs $1,325 $165,725
Safety Harbor $1,348 $196,175
Madeira Beach $1,393 $329,267
Treasure Island $1,710 $261,967
Saint Pete Beach $1,790 $299,117
Indian Rocks Beach $1,841 $344,083
Indian Shores $1,860 $293,392
Redington Beach $1,958 $404,050
Harbor Bluffs $2,000 $276,292
Tierra Verde $2,133 $365,992
Redington Shores $2,141 $341,833
North Redington Beach $2,272 $443,908
Belleair Beach $2,273 $410,825
Green shading indicates areas where the “average” family can purchase a home

38 | P a g e
For an “average” Pinellas County family of 3 (rounded up from 2.97) with a median income of
$59,491, housing affordability as defined by HUD as 30.0 percent or less of income, indicates that
no more than $17,847 annually or $1,487 monthly including utilities could be spent on housing.
The purchasing power of $1,487/month translates to a home purchase price of $165,000 to
$195,000 (depending on amount of down payment and interest rate), indicating that the
“average” family could afford to buy or rent in many parts of the County (shaded in green on
Table 10).
Housing Affordability for Renters
Per the 2009-2013 American Community Survey, of the 502,308 housing units in Pinellas County,
33.0 percent are renter occupied; of this amount, over half (55.1 percent) of renters are cost
burdened, spending 30.0 percent or more of their income on housing costs. Median rent was
$947, however 5,404 households reported paying no rent.
Housing Affordability for Homeowners
According to the 2009-2013 American Community Survey, Pinellas County homeowners
accounted for 67.0 percent of occupied housing units with 155,864 or 58.0 percent of them
having mortgages. Of the housing units occupied by homeowners, 41.7 percent were cost
burdened, spending 30.0 percent or more of their income on housing costs. Among those who
carried a mortgage, 44.8 percent were cost burdened as compared to 23.2 percent of those with
no mortgage, yet still cost burdened.
The median monthly housing cost for those with mortgages was $1,502; those without
mortgages spent $509. Households with mortgages had significantly higher median incomes
versus their mortgage free counterparts ($67,793 versus $38,378), and higher median home
values ($164,800 versus $118,100). Several factors may play into these differences, most notably
those without mortgages may be older residents who have paid off their mortgages and are more
likely to occupy older homes, smaller homes, therefore potentially explaining lower values. Other
explanations could account for these differences, however considering Pinellas County’s high
population of those over 50 years of age, this reasoning is plausible.
Family Sized Housing Needs
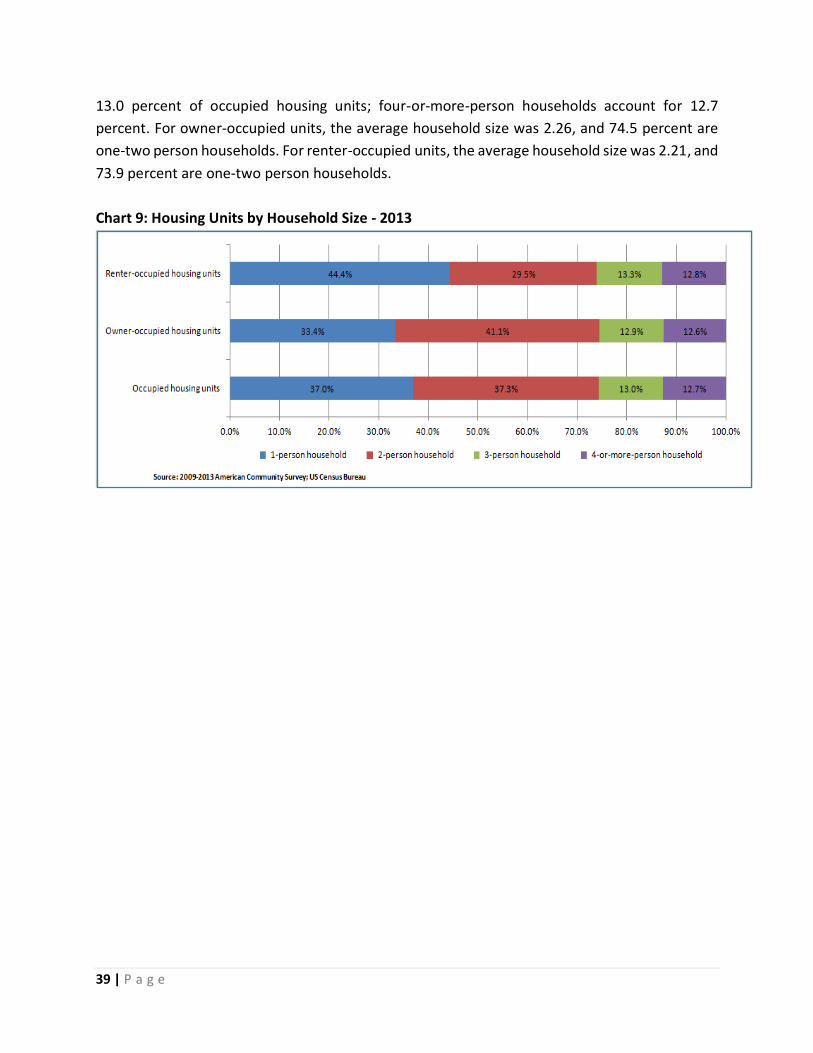
According to the 2009-2013 American Community Survey, the average household size in Pinellas
County was 2.24. One-person households account for 37.0 percent of occupied units; two-person
households account for 37.3 percent of occupied units; three-person households account for
39 | P a g e
13.0 percent of occupied housing units; four-or-more-person households account for 12.7
percent. For owner-occupied units, the average household size was 2.26, and 74.5 percent are
one-two person households. For renter-occupied units, the average household size was 2.21, and
73.9 percent are one-two person households.
Chart 9: Housing Units by Household Size - 2013
40 | P a g e
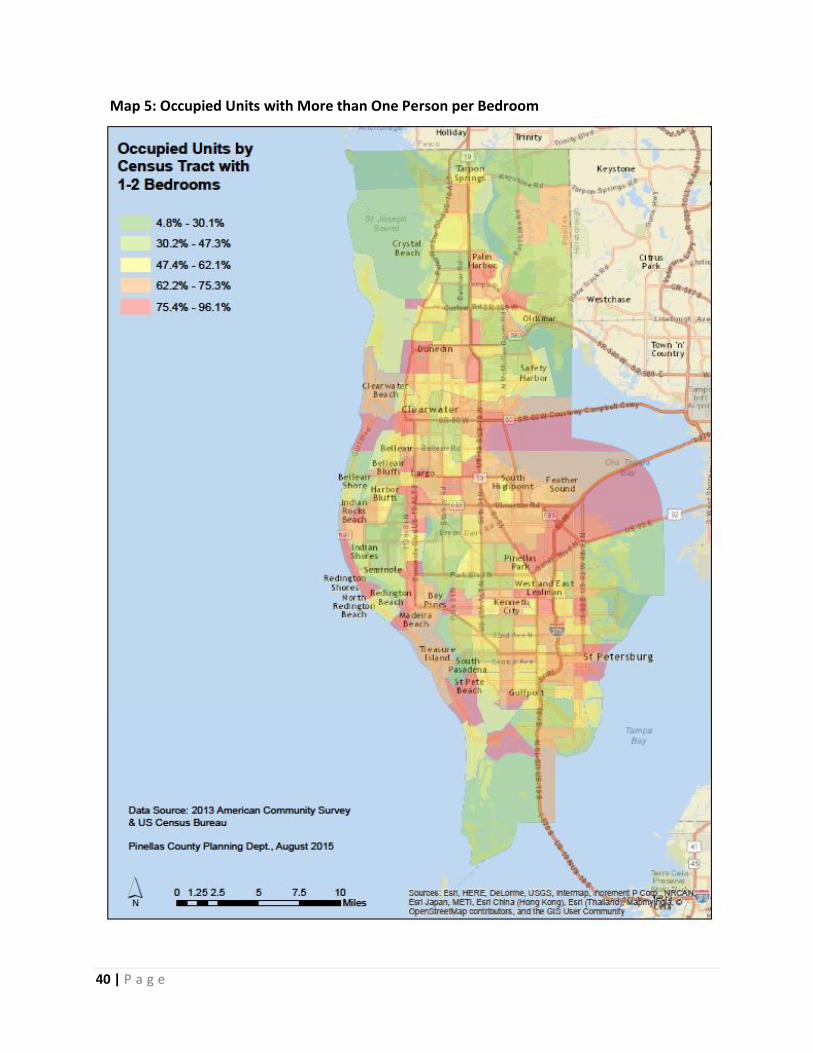
Map 5: Occupied Units with More than One Person per Bedroom

41 | P a g e
The needs of households vary based on the size of the household. According to the 2009-2013
American Community Survey, single bedroom units accounted for nearly fifteen percent (14.9
percent) of housing units. Two bedroom units accounted for over forty-five percent (45.6
percent) of housing units. About thirty-seven percent (37.2 percent), or 187,049 units, have
three or more bedrooms. Across Pinellas County, there is an even distribution of housing units
with more than three bedrooms.
Chart 10: Housing by Number of Bedrooms

42 | P a g e
Map 6: Occupied Units with Three or More Bedrooms
43 | P a g e
Housing and Transportation Cost Burden
For Pinellas County, according to the 2009-2013 American Community Survey, over eighty
percent (80.7 percent) of workers drove to work alone, while just over eight percent (8.3 percent)
carpooled. About two percent (1.7 percent) took public transportation; just over four percent
(4.2 percent) used alternative means. The remaining population of just over five percent (5.1
percent) worked at home. The average commute time for those who commuted to work was a
little over twenty-three (23.4) minutes. Approximately thirty-eight percent (37.8 percent) of
commuters experienced commutes longer than twenty-four (24) minutes.
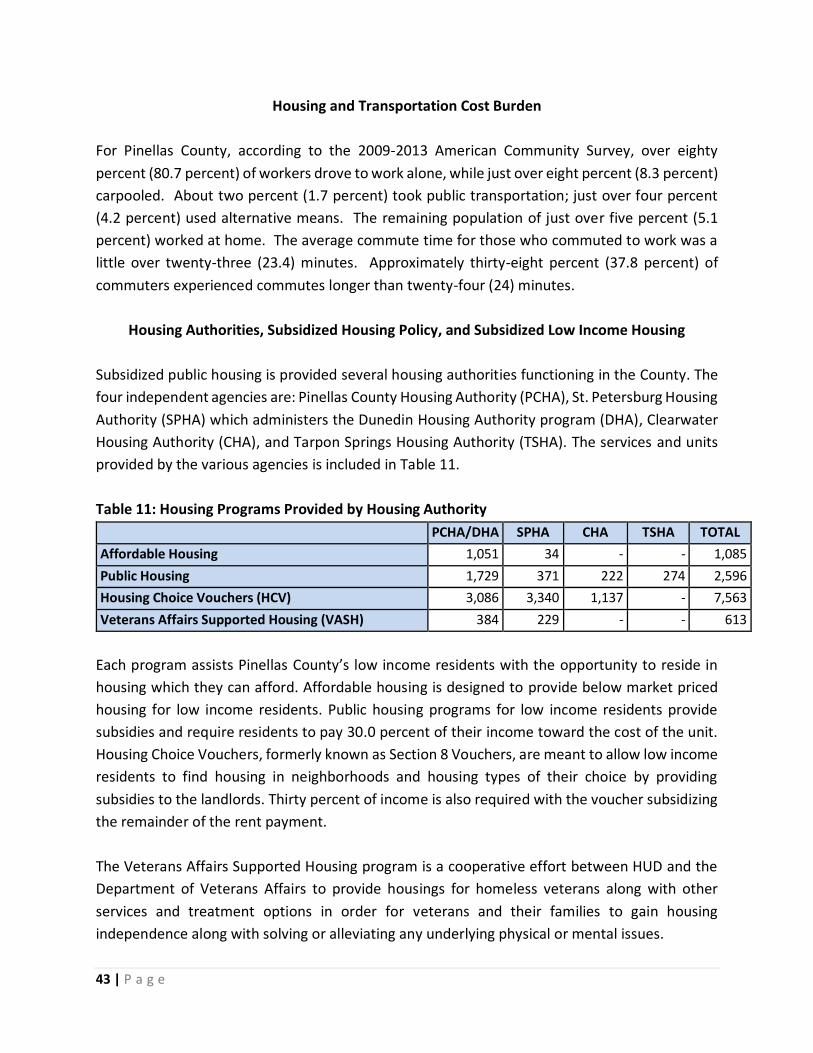
Housing Authorities, Subsidized Housing Policy, and Subsidized Low Income Housing
Subsidized public housing is provided several housing authorities functioning in the County. The
four independent agencies are: Pinellas County Housing Authority (PCHA), St. Petersburg Housing
Authority (SPHA) which administers the Dunedin Housing Authority program (DHA), Clearwater
Housing Authority (CHA), and Tarpon Springs Housing Authority (TSHA). The services and units
provided by the various agencies is included in Table 11.
Table 11: Housing Programs Provided by Housing Authority
PCHA/DHA SPHA CHA TSHA TOTAL
Affordable Housing 1,051 34 - - 1,085
Public Housing 1,729 371 222 274 2,596
Housing Choice Vouchers (HCV) 3,086 3,340 1,137 - 7,563
Veterans Affairs Supported Housing (VASH) 384 229 - - 613
Each program assists Pinellas County’s low income residents with the opportunity to reside in
housing which they can afford. Affordable housing is designed to provide below market priced
housing for low income residents. Public housing programs for low income residents provide
subsidies and require residents to pay 30.0 percent of their income toward the cost of the unit.
Housing Choice Vouchers, formerly known as Section 8 Vouchers, are meant to allow low income
residents to find housing in neighborhoods and housing types of their choice by providing
subsidies to the landlords. Thirty percent of income is also required with the voucher subsidizing
the remainder of the rent payment.
The Veterans Affairs Supported Housing program is a cooperative effort between HUD and the
Department of Veterans Affairs to provide housings for homeless veterans along with other
services and treatment options in order for veterans and their families to gain housing
independence along with solving or alleviating any underlying physical or mental issues.

44 | P a g e
The locations of the various public housing developments (as seen on Map 7) are fairly dispersed
throughout the County. However, Tarpon Springs Housing Authority properties, representing
only 11% of the total public housing units in Pinellas County, are tightly concentrated in the areas
between U.S. Highway 19 and Alternate U.S. Highway 19.
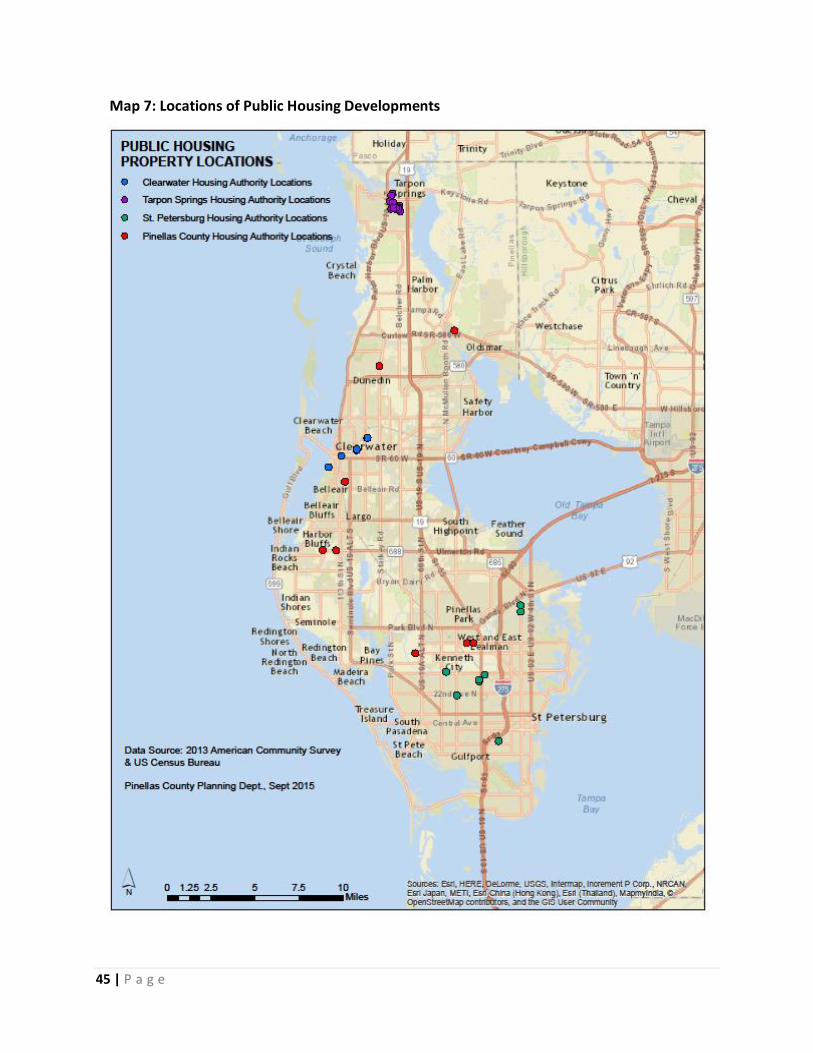
45 | P a g e
Map 7: Locations of Public Housing Developments

46 | P a g e
Tax Exemption Analysis
As of July 15, 2015, Pinellas County Property Appraiser had 39 total or partial exemption
categories from property tax.
Of the 39 exemptions, 13 were not currently being utilized. Examples of some of the unused
exemption categories are: labor union, education property, agreements with local governments
for use of public property, historic property open to the public, space laboratories and carriers,
not for profit water and waste water systems corporations. Table 12 indicates the most and least
commonly used tax exemptions.
Table 12: Pinellas County Tax Exemptions - July, 2015
Five Most Common Tax Exemptions Number of Exemptions Claimed
Homestead Exemption - $25,000 234,417
Additional $25,000 Homestead Exemption 194,822
Widow’s Exemption 24,617
Additional Homestead Exemption 65+ 13,799
Disabled Ex-Service Member Exemption 7,181
Five Least Common Tax Exemptions Number of Exemptions Claimed
Disabled Veterans Confined to a Wheelchair 28
Charter Schools 20
Deployed Serviceman’s Homestead Exemption 16
Community Centers 9
Proprietary Continuing Care Facilities 3
Regarding the exemptions related to the protected categories under The Fair Housing Act, Title
VIII of the Civil Rights Act of 1968, as amended, and/or relevant to affordable housing, there were
only two protected categories impacted by the exemptions, primarily the disabled, and in much
lesser fashion, families with children.
Regarding the disabled, the exemptions helped the disabled either through their status as a
disabled veteran of the armed forces, or simply as a disabled person. The exemptions under
Florida law that helped the disabled were the following:
§196.081: Exemption for certain permanently and totally disabled veterans and for surviving
spouses of veterans; exemption for surviving spouses of first responders who die in the line
of duty: Total exemption from property taxes; 2,672 persons qualified for the exemption. No
income requirement.
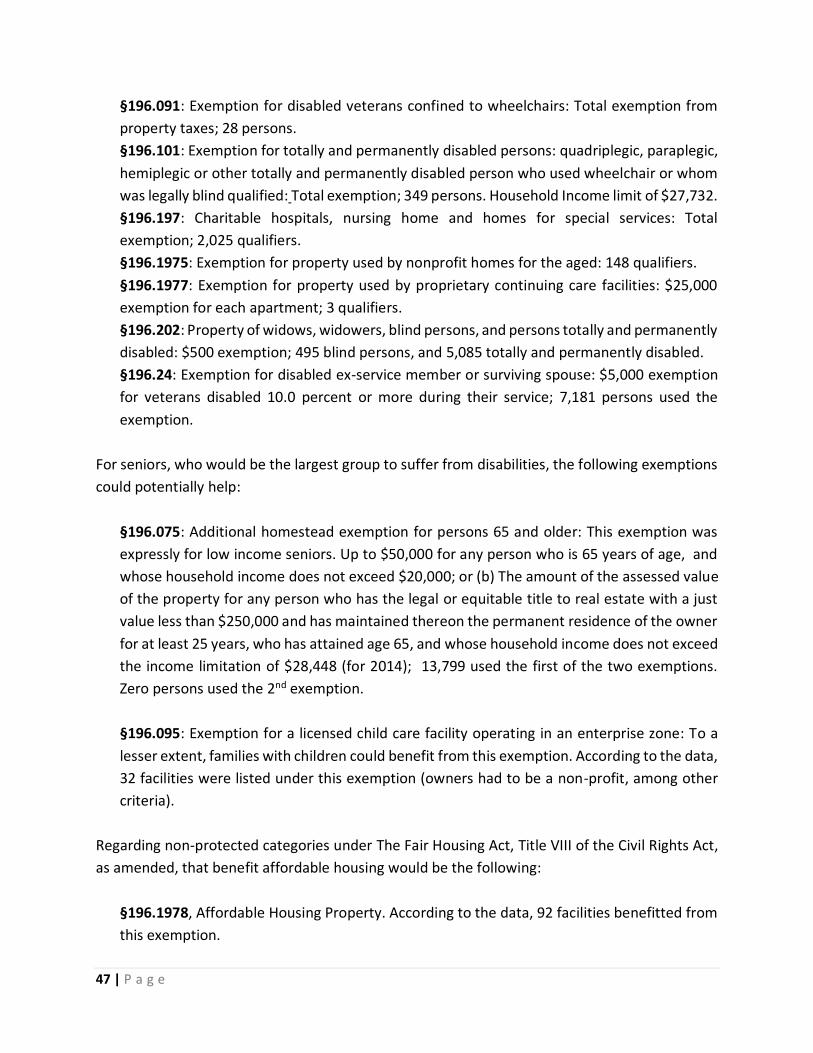
47 | P a g e
§196.091: Exemption for disabled veterans confined to wheelchairs: Total exemption from
property taxes; 28 persons.
§196.101: Exemption for totally and permanently disabled persons: quadriplegic, paraplegic,
hemiplegic or other totally and permanently disabled person who used wheelchair or whom
was legally blind qualified: Total exemption; 349 persons. Household Income limit of $27,732.
§196.197: Charitable hospitals, nursing home and homes for special services: Total
exemption; 2,025 qualifiers.
§196.1975: Exemption for property used by nonprofit homes for the aged: 148 qualifiers.
§196.1977: Exemption for property used by proprietary continuing care facilities: $25,000
exemption for each apartment; 3 qualifiers.
§196.202: Property of widows, widowers, blind persons, and persons totally and permanently
disabled: $500 exemption; 495 blind persons, and 5,085 totally and permanently disabled.
§196.24: Exemption for disabled ex-service member or surviving spouse: $5,000 exemption
for veterans disabled 10.0 percent or more during their service; 7,181 persons used the
exemption.
For seniors, who would be the largest group to suffer from disabilities, the following exemptions
could potentially help:
§196.075: Additional homestead exemption for persons 65 and older: This exemption was
expressly for low income seniors. Up to $50,000 for any person who is 65 years of age, and
whose household income does not exceed $20,000; or (b) The amount of the assessed value
of the property for any person who has the legal or equitable title to real estate with a just
value less than $250,000 and has maintained thereon the permanent residence of the owner
for at least 25 years, who has attained age 65, and whose household income does not exceed
the income limitation of $28,448 (for 2014); 13,799 used the first of the two exemptions.
Zero persons used the 2nd exemption.
§196.095: Exemption for a licensed child care facility operating in an enterprise zone: To a
lesser extent, families with children could benefit from this exemption. According to the data,
32 facilities were listed under this exemption (owners had to be a non-profit, among other
criteria).
Regarding non-protected categories under The Fair Housing Act, Title VIII of the Civil Rights Act,
as amended, that benefit affordable housing would be the following:
§196.1978, Affordable Housing Property. According to the data, 92 facilities benefitted from
this exemption.

48 | P a g e
§196.1995: Economic development ad valorem tax exemption: Called “Parcels granted
economic development exemption” on the Pinellas County Assessment Rolls, showed zero
persons availing themselves of this exemption.
The largest benefit from the exemptions would come in the form of the above relief provided to
the disabled, especially if totally and permanently disabled, or service connected disabilities. This
would generate a total exemption from taxes.
Based on the Pinellas County homestead exemptions alone, the estimated savings in real estate
taxes can be as much as $800 annually, which savings represents an increase in purchasing power
of up to $15,000. Overall, it is not believed the exemptions alone would incentivize individuals
to purchase a house, however it does reduce the household’s overall housing expense and
therefore provides an opportunity to expand their home search based on purchase price.
Additionally, the reduction in housing expense provided through tax exemptions offer the
disabled and seniors the opportunity to remain in their homes.
Zoning Laws and Policies
Affordable housing barriers can result from well-meaning activities that are not intended to affect
the cost of housing, but do. This includes actions such as setback requirements for public safety
purposes, landscaping requirements to beautify areas, and density limitations for transportation
effects. Several factors exist in Pinellas County that impede the development of affordable
housing. Government review processes prolong development timelines resulting in increased
per unit housing development costs. Impact fees, charged to defray the cost of constructing and
maintaining water, sewer and transportation systems, can increase the costs of single and
multifamily developments approximately 4 to 5%. Zoning and Land Use Codes can restrict unit
density, impacting the supply of affordable housing. These policies, although enacted to protect
general public welfare, hinder the development of affordable housing.
Pinellas County has developed systems for review of local ordinances that may impact affordable
housing. The County completes an impact analysis for every land use or code change if the
proposed change has any relationship to affordable housing. Often times, the County receives a
zoning and/or land use request for an affordable housing project which necessitates an extensive
analysis, using the Pinellas County Comprehensive Plan as the basis for the review. Land use and
zoning are always controversial items. The governing agency is limiting the action that can be
taken by an individual on his property. Finding the line between the best use of the land for the
individual and for the community is a very difficult issue. Building codes can affect the cost of
housing; but they are, for the most part, out of the local government's hands. The State
49 | P a g e
government sets the rules for codes; local governments must implement them. The State has
increased the cost of housing significantly with various measures over the last few years. New
codes for windows, aimed at hurricane wind protection, have increased the cost for those items.
New anchoring systems for manufactured housing have caused an increased price in their
installation. There is little doubt for the necessity of these actions; however, there is an increase
to the cost of housing.
In order to offset these barriers, Pinellas County established an Affordable Housing Incentive
Program to provide private sector builders and developers with regulatory and financial
incentives to produce affordable housing. Both the Consortium and the City of Largo have
affordable housing incentive programs that provide expedited review to affordable housing
projects; and offer incentives, such as density bonuses, transfer of development rights, zero-lot
line subdivisions, and some reductions in regulations.
50 | P a g e
Section III: Evaluation of Fair Housing Legal Status
The Fair Housing Act, Title VIII of the Civil Rights Act of 1968, as amended, is a legislative
enactment enforcing a policy of equal access to all types of housing for classes of persons within
its protection. To this end, the Act prohibits intentional and unintentional acts of discrimination
that impact the groups protected by the Act. The Fair Housing Act prohibits discrimination on the
basis of race, color, religion, sex, disability, familial status and national origin.
The State of Florida and Pinellas County have enacted fair housing laws that are substantially
equivalent to the federal Fair Housing Act, Title VIII of the Civil Rights Act of 1968, as amended.
Both the State (Florida Civil Rights Act (ss. 760.01-760.11) and the Fair Housing Act (ss. 760-20-
760.37)), and Pinellas County (Chapter 70, Section 103, of the Pinellas County Code) disallow the
same activities prohibited under the federal Act. Pinellas County Code has been amended to
include protection to additional classes based on sexual orientation in 2008, and gender identity
in 2013.
Since 1992, when the Pinellas County Office of Human Rights (PCOHR) began handling Pinellas
County's housing discrimination complaints for the U.S. Department of Housing and Urban
Development (HUD), there have been no actions in the County initiated by the U.S. Department
of Justice or HUD against a city, company, or corporation within the jurisdiction of which Pinellas
County is aware.
PCOHR has actively engaged in providing fair housing education, training, outreach, and
awareness initiatives. Staff provides monthly training sessions to PRO, the Pinellas Realtor
Organization within Pinellas County, thereby exponentially increasing its reach into the
community. Realtors, property managers and housing providers are the first line of defense in
preventing or perpetuating discrimination. PCOHR staff also provides updated training on an
annual basis, or as requested, to municipal entities, Common Interest Communities, (HOA, Condo
Associations) and local private businesses.
The PCOHR employs two Equal Opportunity staff members who are responsible for providing fair
housing education/outreach, training and awareness initiatives. The PCOHR is responsible for the
intake, investigation and resolution of fair housing complaints to fulfill the HUD requirements for
the operation of a "Substantially Equivalent Fair Housing Program". In addition to Pinellas
County, this program designation has been earned by only five other counties among Florida’s
total 67 counties.
51 | P a g e
It should, be noted that Pinellas County is one of only six "Substantially Equivalent Fair Housing
Programs" (Lee County - Broward County - Palm Beach County-Pinellas County- City of Tampa-
Orange County-Jacksonville-Florida Commission on Human Relations) among Florida's 67
counties.
Enforcement and Litigation
Between 10/1/2011 and 06/15/2015, Pinellas County processed two hundred nineteen (219)
intakes. Between 10/1/2011 and 06/15/2015, Pinellas County processed two hundred thirteen
(213) cases to closure. Map 8 shows the location of the type of complaint received, and by year.
The statistics show an overwhelming number, one hundred-fifty (150) 68.0 percent of complaints
filed based on disability discrimination, of which service animal requests were the majority of
complaints. Thirty nine complaints (39) or 17.0 percent were filed based on Race, seventeen (17)
or 7.0 percent were filed based on National Origin, fourteen (14) or 6.0 percent were based on
Familial Status, twenty three (23) or 10.5 percent were based on Gender and seven (7) or 3.0
percent were filed on the basis of Religion. Complaints can have multiple bases, making the total
herein higher than the number of total cases. Regarding the local protection of sexual orientation
and gender identity, there were a total of ten (10) complaints filed based on Sexual Orientation,
and none on Gender Identity.
Regarding the alleged harms comprising these filings, the denial of a reasonable accommodation
was the most commonly cited harm, with one hundred sixteen (116) complaints filed on this
basis. The second largest harm was the alleged imposition of different terms and conditions, with
one hundred thirteen (113) instances of such allegation. The remainder of the harms, in
diminishing order, were as follows: sixty four (64) allegations of harassment, twenty six (26)
allegations of a refusal to rent, twenty three (23) allegations of discriminatory advertising, sixteen
(16) allegations of a false denial of availability, nine (9) allegations of making housing otherwise
unavailable, eight (8) allegations of a refusal to sell, three (3) allegations for steering, three (3)
for a denial of a reasonable modification, two (2) allegations of discriminatory financing and one
(1) regarding discriminatory zoning.
Regarding harms alleged under the local basis of Sexual Orientation, there were seven (7)
allegations of harassment and intimidation, and five (5) allegations regarding the imposition of
different terms and conditions.
Please note that complaints can have multiple bases, making the total herein higher than the
number of total cases.
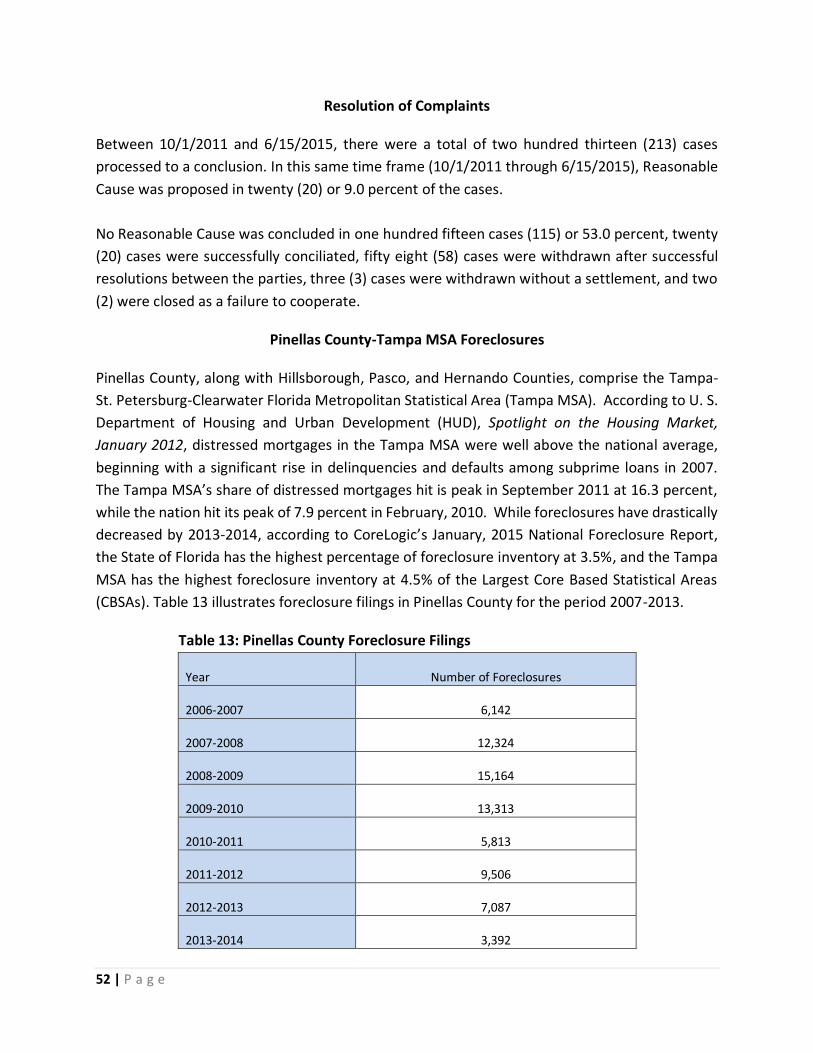
52 | P a g e
Resolution of Complaints
Between 10/1/2011 and 6/15/2015, there were a total of two hundred thirteen (213) cases
processed to a conclusion. In this same time frame (10/1/2011 through 6/15/2015), Reasonable
Cause was proposed in twenty (20) or 9.0 percent of the cases.
No Reasonable Cause was concluded in one hundred fifteen cases (115) or 53.0 percent, twenty
(20) cases were successfully conciliated, fifty eight (58) cases were withdrawn after successful
resolutions between the parties, three (3) cases were withdrawn without a settlement, and two
(2) were closed as a failure to cooperate.
Pinellas County-Tampa MSA Foreclosures
Pinellas County, along with Hillsborough, Pasco, and Hernando Counties, comprise the Tampa-
St. Petersburg-Clearwater Florida Metropolitan Statistical Area (Tampa MSA). According to U. S.
Department of Housing and Urban Development (HUD), Spotlight on the Housing Market,
January 2012, distressed mortgages in the Tampa MSA were well above the national average,
beginning with a significant rise in delinquencies and defaults among subprime loans in 2007.
The Tampa MSA’s share of distressed mortgages hit is peak in September 2011 at 16.3 percent,
while the nation hit its peak of 7.9 percent in February, 2010. While foreclosures have drastically
decreased by 2013-2014, according to CoreLogic’s January, 2015 National Foreclosure Report,
the State of Florida has the highest percentage of foreclosure inventory at 3.5%, and the Tampa
MSA has the highest foreclosure inventory at 4.5% of the Largest Core Based Statistical Areas
(CBSAs). Table 13 illustrates foreclosure filings in Pinellas County for the period 2007-2013.
Table 13: Pinellas County Foreclosure Filings
Year Number of Foreclosures
2006-2007 6,142
2007-2008 12,324
2008-2009 15,164
2009-2010 13,313
2010-2011 5,813
2011-2012 9,506
2012-2013 7,087
2013-2014 3,392
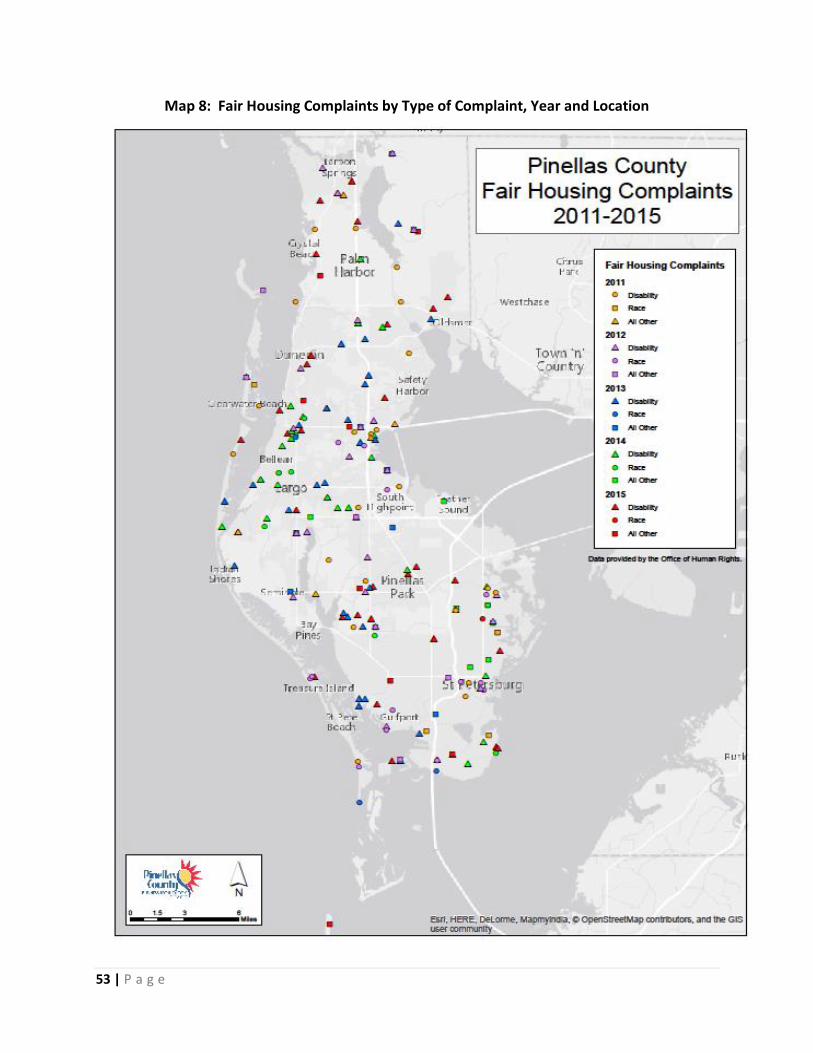
53 | P a g e
Map 8: Fair Housing Complaints by Type of Complaint, Year and Location
54 | P a g e
Section IV: Community Outreach and Engagement
As part of the analysis of impediments to fair housing, an effort was made to include the residents
of Pinellas County. This was done through public meetings and an online survey. Although the
information gathered through both means is limited, it did provide some insights into what
residents feel are issues surrounding fair housing.
Three focus group meetings with residents were held on October 27, 2015 at the Enoch Davis
Center, 111 18th Avenue, South, St. Petersburg, Florida, on November 19, 2015 at Pinellas County
Offices, 440 Court Street, Clearwater, Florida, and on July 12, 2016 at the Pinellas Mid-County
Health Department, 8751 Ulmerton Road, Largo, Florida. Participants in the focus group
meetings included City and County staff, including the County Office of Human Rights staff, and
Public Housing Authorities’ personnel for the various jurisdictions, and other government
representatives; representatives from local colleges, universities, and the School District; non-
profit organizations, home builders, housing and social service agencies representatives; real
estate and financial industry representatives; and the general public and other community
representatives. Comment forms were available to the attendees in English, Spanish and
Vietnamese versions.
Discussion in the fair housing focus group meetings spanned numerous issues, but the following
issues were voiced repeatedly; limited quantities resulting in long wait lists for affordable
housing, age of housing stock related to difficulty and expense in retrofitting for senior and
disabled population, lack of public awareness of fair housing rights, socio-economic conditions,
lack of homebuyer education, predatory lending, credit issues, special needs housing, financial
literacy and public transportation.
The second opportunity for public input was through an online survey. This survey was designed
to assess: the public’s knowledge of fair housing laws, the prevalence of housing discrimination,
and the perception of housing discrimination by community stakeholders. The survey was
designed by County staff and hosted for online participation. Instructions included contact
information for those residents who required assistance or further information with participating
in the survey.
Despite efforts to promulgate its value to the project and increase desired public input, the
participation rate was very low, with only 62 participants. Due to the low participation rate and
the sample not being adequately random, a statistical analysis of the survey results would not be
representative of the entire population of Pinellas County. However, the responses received
were overviewed as case examples as to the status of fair housing law familiarity and housing
discrimination issues.
55 | P a g e
Section V: Impediments to Fair Housing
Actions to Address Previous Found Impediments
Impediments: Banking, Finance, Insurance and Other Industry Related Impediments. Impacts of
the sub-prime mortgage lending crisis and increased foreclosures. Low number of loan
applications from minorities and low origination rates for minority applications. Predatory
lending and other industry practices.
Remedial Actions: 1) Continue to work with the State, National Non-Profit Housing
Intermediaries, Federal Home Loan Bank, other lenders and HUD to evaluate programs and
identify funding that can help reduce the mortgage default rate and foreclosure rates among low
and moderate income home buyers and existing home owners; 2) Continue homebuyer outreach
and education efforts; and expand homeownership and credit counseling classes as part of the
high school curriculum in order to help prevent credit problems; and 3) Encourage financial
institutions to continue to assist low to moderate income persons with establishing or
reestablishing checking, savings and credit accounts for residents that commonly utilize check
cashing services through bank initiated “fresh start programs” for those with poor credit and
previous non-compliant bank account practices.
Pinellas County, Cities of Clearwater, Largo and St. Petersburg provide homebuyer
counseling and down payment assistance loans programs, which programs do not permit
sub-prime lenders to write mortgages for clients served.
Cities of Clearwater, Largo and St. Petersburg fund Gulfcoast Legal Services, which
organization provides foreclosure defense and counseling, and offers elder law services,
family law services providing assistance where there has been domestic violence or child
abuse, legal aid for paternity actions, child support and custody matters, specialized legal
services for education and advocacy on behalf of immigrant children, as well as providing
legal services for low income taxpayers who are involved in tax controversies with the
Internal Revenue Service.
Pinellas County funds Gulfcoast Legal Services, a non-profit organization, to provide fair
housing counseling.
From 2010-2014, the City of Largo had 222 participants in homebuyer education classes,
130 participants in housing counseling sessions, and 191 participants in fair housing
counseling.
Pinellas County and the Cities of Clearwater, Largo and St. Petersburg participate in the
annual HOPE (Homeownership for People Everywhere) Expo, providing workshops
(bilingual) and guest speakers addressing renting vs. buying, steps in the home buying
process, key players, home affordability, and the prequalification process.

56 | P a g e
Pinellas County also funds homeownership counseling (8-hour Homebuyer Education),
pre-purchase counseling through Bright Community Trust, Tampa Bay Community
Development Corporation, Gulfcoast Legal, and St. Petersburg Neighborhood Housing
Services d/b/a Neighborhood Home Solutions. Bright Community Trust also provides
preventative maintenance and housekeeping training; training opportunities are
provided in English and Spanish (Mira TV).
Tampa Bay Community Development Corporation provides both English and Spanish
Home Buyer Education classes.
United Way, Suncoast of Pinellas County offers Financial Coaching and Counseling,
including the “Points of Life” program which trained 100 peer counselors for counseling
services in low-income areas.
Representatives from Pinellas County and the Cities of Clearwater, Largo and St.
Petersburg regularly attend fair housing training to stay current. The Pinellas County
Office of Human Rights hosts training and conference events throughout the year.
Pinellas County Connection Television’s Radio Show “No Place Like Home”, sponsored by
the Housing Finance Authority of Pinellas County, regularly features an episode with guest
presenters from the Pinellas County Office of Human Rights, dedicated to the Fair Housing
Act, investigation of violations and information on assistance if issues arise (also available
on YouTube).
Community Service Foundation, a Pinellas County non-profit, owns and manages
affordable rental units and provides seminars for First Time Homebuyer and Financial
Fitness Workshops.
From 2011-2013, Pinellas County has provided 135 Homebuyer Education Classes to
2,576 participants; 31 Budgeting Seminars to 273 participants; 313 individual Housing
Counseling sessions; 269 Foreclosure Prevention Counseling Sessions through Tampa Bay
Community Development Corporation and Neighborhood Home Solutions, St.
Petersburg, Florida.
In 2014, City of St. Petersburg provided mortgage classes to 204 persons; family budgeting
classes to 4 households; pre-purchase counseling to 38 households; and foreclosure
counseling to 246 households. City of Largo provided fair housing counseling service to
263 from 2010 to 2015.
Pinellas County 211 hotline is a centralized Social Service Referral Network, which
provides residents with access to non-profits and government agencies who provide
assistance with utility shut-offs, temporary housing payments due to sudden job loss.
Housing Finance Authority of Pinellas County offers affordable rental units, a First Time
Home Buyer Program, a Target Home Buyer Program for low income families, as well as
Homebuyer Classes.
57 | P a g e
Impediment: Socio-Economic Impediments. Poverty and low income among minority
population.
Remedial Actions: 1) Continue to work on expanding job opportunities through the recruitment
of corporations, the provision of incentives for local corporations seeking expansion
opportunities, assistance with the preparation of small business loan applications, and other
activities. 2) Continue to support agencies that provide workforce development programs and
continuing education courses to increase the educational level and job skills of residents.
Pinellas County School District offers programs to high school students through the
Stavros Institute, St. Petersburg, Florida: Enterprise Village and Finance Park. Enterprise
Village is a self-contained economic education program that provides a hands-on learning
experience for students, spending six weeks in their classroom studying economic
education objectives that teach them about writing checks, using a debit card, keeping a
checkbook register, applying for a job and working in a group and spending one day onsite
in Enterprise Village (similar to a shopping mall) working in one of the 20 businesses,
taking breaks, receiving paychecks and having the opportunity to be consumers and
making purchases. Finance Park is a reality based, hands-on simulation that enable
students to build foundations for making intelligent lifelong personal finance decisions
after graduation by simulating an environment where decisions about transportation,
investment, home improvement, banking, housing, entertainment, healthcare, utilities,
food, home furnishings, clothing and education are being made through budgeting and
practice.
Pinellas County School District High Schools offer classes on financial aid for continuing
education, Florida Bright Futures Scholarship Program, Types of Financial Aid, Completion
of the Free Application for Federal Student Aid (FAFSA), Understanding the Student Aid
Report (SAR), Pinellas Education Foundation Scholarship Catalog, Scholarship Essays, and
Scholarship Searches and Scams.
University of Florida/IFAS Extension has a website tab (Family & Consumers), which
provides a budgeting worksheet and calendar and information regarding
homeownership, renting, repairs and keeping the home environment clean, including
links to Florida Housing Coalition and the National Low Income Housing Coalition.
Pinellas Opportunity Council provides assistance with small business loan applications as
well as Individual Development Accounts, providing a 2 to 1 matching savings account to
be used for starting a new small business.
Notice for public comment of Pinellas County Consolidated Plan and yearly Action Plan
posted in English, Spanish and Vietnamese.

58 | P a g e
Catholic Charities, Diocese of St. Petersburg, Inc. in partnership with the Knights of
Columbus has completed construction on Pinellas Hope providing temporary housing for
homeless men and women with the goal of enhancing qualify of life and hasten the
clients’ return to stable, permanent housing.
Florida Department of Health, Pinellas County regularly hosts a Healthy Pinellas
Consortium Meeting aimed to convene, connect and communicate through partnerships
that leverage resources to establish healthy communities and programs. The purpose of
the Consortium is to encourage children and adults in Pinellas County to choose active
living and nutritious selections for a better future.
The United Way, Suncoast of Pinellas County, under their Individual Development
Account (IDA) program, in conjunction with Federal grants and private donations,
provides a monetary incentive for saving money; for each $1 that a client saves, the
program adds an additional $2 to the savings account. The average length of time for a
client to save $2,000 is two years, at which point the savings account becomes $6,000;
which must be used to purchase a house, post-secondary school tuition or to start a small
business.
The United Way, Suncoast of Pinellas County, under their “Summer Care” program,
provides scholarships for day camps, tutoring and summer bridge books (all programs
intended to combat summer learning loss; the parents also agree to attend financial
education classes designed to help with practical guidance (how to make it from paycheck
to paycheck without running out of money or bouncing checks).
Kinship Services Network, Programs of the Children’s Home, Inc., a non-profit agency
offers support to relative caregivers by helping families access needed services, expanding
family support systems, and ultimately reducing stress to promote family stability.
Support services referrals include public benefits application assistance,
counseling/therapy, legal services, access to medical care, mentoring, respite assistance,
academic tutoring/support, social/recreational activities, neighborhood support,
transportation, vocational support and substance abuse treatment.
Pinellas County’s Bayside Health Clinic located in Clearwater, Florida, funded by grants
from the U.S. Department of Health and Human Services and the Health and Resources
Administration Pinellas County, provides medical, dental and behavioral health services
to the County’s homeless population. Many patients come from the Safe Harbor shelter
run by the Pinellas County Sheriff’s Office, allowing the County’s mobile medical unit,
which makes frequent stops at Safe Harbor, to spend more time elsewhere in the County.
Pinellas County’s Board of County Commissioners unanimously passed Ordinance No. 15-
44, Wage Theft and Recovery Ordinance, effective January 1, 2016, allowing workers to
file a claim for unpaid earned wages with the County’s Office of Human Rights, which
59 | P a g e
office will serve, at no cost to the client, a complaint to the employer and attempt to
resolve in mediation.
In 2016, Pinellas County’s Metropolitan Planning Organization joined with Pinellas
Planning Council to form Forward Pinellas; as a transportation planning organization and
land use planning organization, Forward Pinellas will focus on helping residents and
businesses get to and from the places they need to go, and redevelop to support a
resilient economy.
Family Resources is a Pinellas County non-profit providing safe transition for homeless
young moms and education through federally funded programs, the Safe2B-You & Me
program, and Healthy Marriages & Responsible Fatherhood grants.
Impediment: Neighborhood Conditions Related Impediments. Limited Resources to assist
lower income, elderly and indigent homeowners maintain their homes and stability in
neighborhoods.
Remedial Actions: 1) Continue to support and expand programs of self-help initiatives based
on volunteers providing housing assistance to designated elderly and indigent property
owners and assist them in complying with municipal housing codes; and 2) Continue
involvement of volunteers, community and religious organizations/institutions and
businesses as a means of supplementing financial resources for housing repair and
neighborhood cleanups.
Pinellas Opportunity Council provides many programs geared towards self-
sufficiency: Chore Services program provides handyman and yardwork services to
individuals 60 years of age and above through CDBG funding, Youth Development
program designed to equip low-income, academically talented youth between 14 and
17 years of ago with workforce readiness, leadership, entrepreneurial and financial
literacy skills; Retired and Senior Volunteer Program providing meaningful
opportunities for persons 55 years of age and above to participate more fully in the
life of the community through volunteer service matching knowledge and skills with
needs; and the Family Development Program which provides case management
services, referrals and resource mobilization, education/training, small business start-
up, and Youth/Extra Curricular Activity.
Pinellas County Housing Authority (PCHA) partnered with Boley Centers,
ServiceSource, and Blue Sky Communities to provide project-based housing vouchers
for the new Duval Park veteran’s community in St. Petersburg; Duval Park consists of
88 private apartments for veterans with special needs; 44 of these units will be
subsidized through PCHA’s Housing Choice Voucher Program.
60 | P a g e
Housing Finance Authority of Pinellas County (HFA) received a “Multifamily Excellence
Award” for the Pinellas Heights Senior Housing project; the HFA provided $12,500,000
in bond financing and Pinellas County financed an additional $1,245,000 from the
County’s Housing Trust Fund. Pinellas Heights Senior Housing project provides 153
rental units to low and very-low income seniors.
Pinellas County’s Juvenile Welfare Board (JWB), in part funded by Pinellas County,
have eight Neighborhood Family Centers throughout Pinellas County, and provide
families with the resources, support and skills necessary to raise their children in a
healthy and safe community that promotes development of their maximum potential.
The JWB invests in partnerships, innovation and advocacy to strengthen Pinellas
County children and families offering key strategy focus areas: school readiness,
school success and prevention of child abuse and neglect.
Pinellas County funded a project at Girls, Inc. in Pinellas Park that included STEM lab
space for girls with corporate support from TechData in order to educate and expand
economic opportunities for youth and their families.
Pinellas County’s Dansville and Greater Ridgecrest Area Housing Development Plan
consists of transforming 67 parcels into a mixed-income community providing home
ownership opportunities for low-moderate income households. Of the 67 parcels,
Habitat of Humanity of Pinellas County has developed 9 single-family homes, and the
County is actively seeking bids from the development community for the remaining
sites.
City of Largo has 1) funded Pinellas Opportunity Council’s Chore Services for two
years; 2) operates an owner-occupied housing rehabilitation program to assist low-
income households with funding and contractor management to make necessary
improvements to their homes, as well as funding for lead-based paint removal and
accessibility improvements (ramps, grab bars); and 3) facilitated two neighborhood
clean-up days in two of the City’s low income neighborhoods, providing free
dumpsters for disposal of large items, free trees and planting services, and the Red
Cross installed free smoke-detectors in homes.
City of Largo and partnering agencies purchase properties through voluntary
acquisition that are vacant and in blighted neighborhoods and are either rehabilitated
or replaced, and sold to low and moderate income families.
The City of Clearwater has 1) funded Pinellas Opportunity Council’s Chore Service
program for more than 3 years; 2) through its Housing Rehabilitation Program
financially assisted income eligible owner-occupied households in order to correct
minimum housing deficiencies, code deficiencies, and accessibility needs of special
needs family member(s); and 3) with code enforcement and solid waste departments,
facilitated neighborhood cleanups in two neighborhoods.
61 | P a g e
Revitalization Areas in Pinellas County
Pinellas County (Dansville and Greater Ridgecrest), City of Clearwater (North Greenwood and
Lake Bellevue), and City of St. Petersburg (City of St. Petersburg) have designated Neighborhood
Revitalization Strategy Areas. Each jurisdiction is provided greater flexibility in undertaking
economic development, housing and public service activities under their respective CDBG
programs.
In 1969, the Florida Legislature enacted the “Community Redevelopment Act of 1969” (Chapter
69-305). The Act is the enabling legislation that allows for the creation of community
redevelopment agencies and Community Redevelopment Areas within the State of Florida. The
Act provides the option of establishing a redevelopment trust fund that may receive funds
through the allocation of tax increment revenues.
In addition to the aforementioned accomplishments, there have been twenty two (22)
Community Redevelopment Areas (CRAs) created in Pinellas County since 1977. Of the 22 CRAs
created, three have expired (Jamestown, Central Plaza, Tarpon Springs North Community) and
two have not adopted a Community Redevelopment Plan (Belleair Belleview Biltmore Hotel and
St. Pete Beach Gulf Boulevard/Downtown).
Out of the 17 current CRAs that have adopted a Community Redevelopment Plan, five have not
established a redevelopment trust fund (Clearwater-Largo Road, 16th Street South, Dome
Industrial Park Pilot Project, Dome Industrial Park and Tangerine Avenue).
Since Pinellas is a County with a home rule charter, the powers conferred by the Act are the
responsibility of the Board of County Commissioners (BCC). The BCC, however, has the discretion
to delegate some or all of these redevelopment powers to the governing body of a municipality.
CRAs have been established in eleven municipalities, with three cities (St. Petersburg, Gulfport
and Largo) having two or more redevelopment areas. Most of the CRAs include the municipality’s
historic downtown area, which helps account for their distribution throughout the County from
Tarpon Springs in the north to Gulfport in the south.
Not all of the CRAs within Pinellas County receive tax increment revenue; out of the 12 CRAs that
have adopted a Community Redevelopment Plan and have established a redevelopment trust
fund, 11 have been authorized to receive County TIF contributions.
Gulfport’s 49th Street Corridor is the only CRA that has adopted a Plan and established a trust
fund but does not receive County TIF contributions.
62 | P a g e
Starting in 2002, the new CRA Plan included a requirement that the County conduct a review of
the CRA’s use of County TIF contributions halfway through the duration of the redevelopment
trust fund. Based upon this comprehensive review, the BCC determines whether the County’s TIF
contribution should be adjusted for the remaining years of the trust fund.
The use of tax increment financing (TIF) involves three fundamental components: the current
total taxable assessed value within a CRA, the total taxable assessed value at the time the
redevelopment trust fund was established (the base year), and the applicable County millage
rate.
As the taxable assessed property value within the CRA increases above the value of the base year
(i.e. the “increment”), the property taxes generated by the increment are allocated to the
applicable redevelopment trust fund and must be spent on projects within the CRA that
implement the adopted community redevelopment plan. Since 1996/97, TIF contributions from
Pinellas County steadily increased until 2009/10, when the dampening effect of the recession
reduced TIF revenues from the previous year’s highpoint of $8.7 million contributed in 2008/09.
Overall, since the early 1980s, Pinellas County has invested over $83.8 million dollars in the 11
CRAs that receive TIF revenues.
In the case of the St. Petersburg Intown CRA, Pinellas County has invested $46.7 million since
1986. The municipality within which each of these 11 CRAs is located also contributes TIF dollars
to the applicable CRA redevelopment trust fund. Six of the 11 CRAs that receive County TIF
contributions are at least halfway through the duration of their redevelopment trust funds.
Individual CRA Summaries:
1. BELLEAIR BELLEVIEW BILTMORE HOTEL: The Town of Belleair was delegated
redevelopment authority by the BCC in June 2012 for the Belleview Biltmore Hotel
property. The Community Redevelopment Area encompasses the Belleview Biltmore
Hotel property, including a spa and fitness building, three cottages, and the immediate
grounds, parking and tennis court areas. The purpose of the delegation was to assist the
Town in restoring the Belleview Biltmore Hotel by using the redevelopment tools from
the Florida Community Redevelopment Act (Chapter 163, Part III, Florida Statutes) to help
address deteriorated physical conditions and economic distress of the Belleview Biltmore
Hotel site. In July 2012, the Town Manager informed the County that the developer of the
Belleview Biltmore Hotel was no longer interested in pursuing a Community Development
Plan.
2. CLEARWATER DOWNTOWN: The City of Clearwater’s Downtown CRA is the second
largest, as well as one of the oldest, CRAs to be created in Pinellas County, totaling 488
63 | P a g e
acres in size. In 1981, following the BCC’s delegation of redevelopment authority, the
original Community Redevelopment Plan for the Downtown area was approved.
Subsequently, in October of 1982, a Redevelopment Trust Fund was established by the
BCC, allowing for the contribution of tax increment revenues from the County’s ad
valorem taxes. In 2003, the City reassessed the original downtown CRA boundaries and
established the need for revitalization outside the original downtown core. As a result,
the BCC approved expansion of the boundaries of the CRA eastward to pick up the
Gateway Area, thereby adding almost 202 acres.
In 2004, the BCC authorized the contribution of tax increment revenues from the County’s
ad valorem taxes for the Gateway Expansion Area, and authorized an extension to the
County’s TIF contribution to the original Downtown area for another 15 years with the
option to extend the TIF contribution for an additional 15 years until 2034.
The main objectives included in the Plan are to improve the City’s downtown economy by
leveraging public-private partnerships and creating residential and commercial stability,
and to provide for the stabilization of commercial buildings and residential
neighborhoods to support the local economy. Since approval of the 2003 Plan, the BCC
has approved three amendments, in 2005, 2009 and 2010.
In 2005, the amendments clarified that the transfer of development rights must be
consistent with Countywide Rules, added adult uses to the list of prohibited uses within
the Downtown Core character district, reduced the maximum density standard for hotel
uses in the East Gateway character district from 70 units per acre to 4 units per acre and
incorporated Downtown Design Guidelines. The 2009 amendments minimally affected
the goals, objectives, and policies of the Downtown Strategies, and also revised the
County and City tax increment revenue projections in the Plan. The 2010 amendments
created a new policy regarding the potential outdoor display of bicycles for retail bicycle
establishments along the Pinellas Trail within the Downtown and expanded the variety of
permissible uses for parcels in the vicinity of the Clearwater Gas property. In 2010/2011,
the City approved an agreement with Ruth Eckerd Hall to expand the theatre’s schedule
of programming until the planned facility renovations begin. On Sept. 7, 2010, the CRA
approved the purchase of real property comprising the bulk of the East Gateway block
bounded by Cleveland Street, North Betty Lane, Grove Street and North Lincoln Avenue.
The parcels include the Economy Inn Motel; former Royal Palm Motel; Viva Mexico
restaurant; two duplexes; and one single family residence for a total of 2.2 acres. Also,
the City provided a $700,000 loan, for the purchase of the Country Club Townhomes to
construct a 31-unit townhouse project located at Drew Street and North Betty Lane. This

64 | P a g e
multi-family housing project is now complete and has increased the supply of owner-
occupied, workforce-housing units in the East Gateway District property. In 2016, the CRA
used County restricted funds to acquire a single family home located on Grove St Street
thereby expanding the property assemblage first acquired in 2010. The CRA also acquired
property at the intersection of Gulf to Bay Boulevard and Cleveland Street. The parcel,
often referred to as the Triangle Property, is intended to be used as a festival area.
Additional parcels may be acquired for use as a “Mercado” or Latino marketplace which
would offer a variety of market items including fresh foods and locally sourced and crafted
items.
3. DUNEDIN DOWNTOWN: The City of Dunedin’s Downtown CRA is 154 acres in size and
was established by the BCC in 1988. The CRA has one Redevelopment Trust Fund, which
receives both City and County TIF contributions.
Since the establishment of the CRA, the City’s downtown has seen numerous changes
over the years, and today is a vibrant pedestrian area, readily accessible to the Pinellas
Trail, offering boutique retail shops, quaint art galleries, specialty antique stores, and a
variety of casual to fine dining restaurants.
The Downtown Redevelopment Plan was approved by the BCC in 1988 and provides
direction to the revitalization of the area. Approximately 90.0 percent of the
improvements identified in this Plan have been completed, including streetscaping, traffic
calming, entryway monuments, underground utility lines, public parking, decorative
lighting and many other elements designed to lend the area a sense of place.
In 2012, the City updated its Redevelopment Plan in order to meet future challenges. The
updated Redevelopment Plan outlined 10 primary goals and major strategies and capital
investments in streets, recreation, utilities, parking, planning and design, signage, and
marketing. The goals of the updated Plan are: 1) Maintain and expand financing
mechanisms such a matching grants, tax increment financing and the Penny for Pinellas;
2) Maintain “coastal small town” character through revising codes to be commensurate
with scale; 3) Leverage waterfront as an asset with better connectivity with downtown
core; 4) Capitalize on strategic vacant parcels to foster economic development with a
strategy for appropriate land acquisition; 5) Enhance walkability and public spaces with
emphasis on pedestrian safety, increased shade, and way finding; 6) Improve
transportation and parking to support future development; 7) Continue to offer
downtown redevelopment assistance, such as signage and a “parking bank”; 8) Expand
marketing efforts through a branding strategy, marketing materials and business focus

65 | P a g e
groups; 9) Continue to make downtown as a destination with community events, the arts,
and historical heritage; and 10) Contribute to the City’s Green Initiative through
promotion of green building and green business practices.
Recently, the City improved the former Keller Sales & Engineering buildings into an 84-
space public parking lot; Completed a streetscape enhancement project at the
intersection with pedestrian crossings, landscaping, brick sidewalks, underground
utilities, realigned curb/street lines, and a decorative fountain; and Pedestrian and
recreational enhancements were completed to an area near the intersection of the
Pinellas Trail and Main Street.
4. GULFPORT WATERFRONT DISTRICT: The City of Gulfport’s Waterfront CRA is the smallest
CRA currently receiving County TIF contributions, totaling 84 acres. The CRA boundaries,
which have not changed since its establishment, were originally based on the following
main factors: creating a redevelopment area of a manageable size, concentrating
commercial activity along Beach and Shore Boulevards, and the inclusion of historic
residential and nonresidential areas. A Redevelopment Trust Fund was approved in 1993
by the BCC and currently receives both City and County TIF contributions.
The Waterfront District Redevelopment Plan was adopted in 1993 by the BCC and was
created for the purpose of conservation, rehabilitation, and revitalization of the
Waterfront area. The Plan establishes general project objectives for the rehabilitation and
revitalization of the historic commercial and residential corridors. Since adoption of the
Plan, the BCC approved two amendments (in 2000 and in 2009). The 2000 amendment
modified the City’s Future Land Use Map within the Plan to facilitate the construction of
Veteran’s Park. In 2009, amendments were made to provide incentives that support
small-scale mixed-use development and assist with the creation of a live-work concept.
Recently, the City was able to add several new pieces of artwork to the Waterfront
Redevelopment Area, including an entryway sign on Gulfport Boulevard and
rehabilitation work on the pavilions located along Shore Boulevard.
5. GULFPORT 49TH STREET CORRIDOR: On November 23, 1999, the City was delegated
redevelopment authority by County Resolution 99-246. This Resolution prohibited
Gulfport from seeking the use of tax increment financing, and prevented the City from
establishing a Redevelopment Trust Fund. On October 31, 2000, the BCC clarified the
intent of Resolution 99-246 by adopting Ordinance 00-86, which approved the creation
of a Redevelopment Trust Fund for the CRA. County Ordinance 00-86 does not allow the

66 | P a g e
use of tax increments to provide revenues for the Trust Fund, but does allow the City to
allocate other 25 revenue sources to the Trust Fund.
The CRA boundaries have not changed since its establishment and were originally
influenced by conditions such as deteriorated structures, poor maintenance of
commercial and residential properties, inadequate sidewalks and roadway curbing, and
high crime rates.
The purpose of this Plan is to stabilize, revitalize and enhance property values within the
49th Street CRA boundary by adopting a definitive action plan containing specific projects
and programs, many of which have already been completed. The principal objectives of
the Plan are to: Promote mixed uses as part of a “Live-Work” and “Mixed-Use”
arrangement; Provide added flexibility for property owners with regard to the types of
uses permitted; Eliminate unsightly activities and uses; Better control outdoor sales and
display; Attract working professionals and home-based businesses; and Preserve and
enhance residential neighborhoods and the overall residential character of the area. Since
approval of the Plan, there was one amendment in 2009, which created overlays that
added flexibility and incentives to support small-scale mixed-use development and to
assist with the creation of a live-work concept.
Recently, the City completed the Tangerine Parkway project, which was constructed with
transportation improvement grant funds provided by the Florida Department of
Transportation.
6. LARGO WEST BAY DRIVE: The City of Largo’s West Bay Drive CRA is approximately 445
acres in size and received delegation of redevelopment authority from the BCC in 1991.
In 2002, the City received BCC approval to expand the CRA boundary to the east.
A Redevelopment Trust Fund was approved in 2000 by the BCC and currently receives
both City and County TIF contributions. The Redevelopment Plan was originally approved
in 1997 by the BCC. A new Plan was approved in 2010, but did not include the expansion
area to the east due to property owner opposition. The goals and objectives of the
recently approved Plan specifically relate to mobility and pedestrian
improvements/enhancements to facilitate transformation of the area from an
automobile-dependent commercial corridor to a vibrant, mixed-use, walkable area.
Recently, the City of Largo undertook the following: The reconstruction of 4th Street SW
from West Bay Drive to 8th Avenue SW was completed. The reconstruction included re-
67 | P a g e
bricking of the street, new curb, and an urban sidewalk installed on both sides of the
street. New retail and office establishments opened in the District such as Keller Williams
Realty, Deuces Restaurant, and Dr. Mahajan's Medical office complex. The City started a
new capital improvement project that will enhance an area adjacent to the Pinellas Trail
within the West Bay Drive District, which will connect many downtown businesses to the
trail.
7. LARGO/CLEARWATER-LARGO ROAD: The 306 acre Clearwater-Largo Road CRA was
established in 1995 and includes commercial properties along the Clearwater-Largo Road
corridor and the adjacent residential neighborhoods. The original boundaries of this area
have been expanded twice, once in 2002 and again in 2008. The latter expansion includes
recently annexed properties. A Redevelopment Trust Fund has not been established for
this CRA.
The initial Clearwater-Largo Road CRA Redevelopment Plan was approved by the BCC in
1996. In 2006, the BCC approved a new Plan for the CRA that included the expanded area
and addressed affordable housing initiatives and a mobile home park transition program
for displaced residents. In 2008, the Plan was amended to incorporate annexed
properties. The main intent of the Redevelopment Plan is to transform the Clearwater-
Largo Road Corridor into a vibrant mixed-use area.
The Plan focuses on four main implementation programs: streetscaping and pedestrian
orientated development, business development, strengthening neighborhoods, and
providing flexible regulations to permit mixed-use development.
Recently, a new capital improvement project has been dedicated to resolve storm water
run-off related issues within the District. The Bayside Court Apartment complex has been
constructed, which has added 244 workforce housing units to the District.
8. OLDSMAR TOWN CENTER: The City of Oldsmar’s CRA was established in 1993 and
originally encompassed an area generally south of the intersection of State Road 580 and
Tampa Road. This area was expanded in 1995 to include land wedged between
SR584/Tampa Road and SR 580, as well as portions of land east of St. Petersburg Drive.
Currently, the CRA is approximately 106 acres in size.
The CRA has one Redevelopment Trust Fund account, which receives both City and
County TIF contributions. In 1996, the Oldsmar Town Center Plan was approved by the
BCC. The Plan includes an overall vision for the CRA in 2015, and identifies goals that

68 | P a g e
emphasize the importance of maintaining Oldsmar's small town character and unique
appeal. In addition, the Plan focuses on infrastructure improvements, traffic calming, on-
street parking, streetscaping, and street signage.
Recently, the City completed renovations to the Oldsmar Bank building, which now
houses the City Council Chambers, the Upper Tampa Bay Chamber of Commerce, the
Historical Society, and an office for the Pinellas County Sheriff. Completion of
streetscaping along St. Petersburg Drive, which includes 40 new on street diagonal
parking spaces, sidewalks and crosswalks, LED Victorian style street lights and two
designated electric car charging stations. There are currently six electric car charging
stations in the CRA.
9. PINELLAS PARK DOWNTOWN: The City of Pinellas Park’s Downtown CRA, at 1,339 acres,
is the largest CRA in Pinellas County. The boundaries generally extend along the Park
Boulevard corridor, bounded by 34th Street to the east and 67th Street to the west,
between 78th Avenue to the north and 70th Avenue to the south, and north and south
along the 49th Street corridor. The CRA’s Redevelopment Trust Fund was created in 1990,
and receives both City and County TIF contributions.
The Downtown Redevelopment Plan was approved in 1990 by the BCC. Overall, the Plan
establishes goals and objectives to eliminate blighted conditions, maximize location
advantages, promote new investment and re-investment in properties and create a
strong, vibrant downtown area. In 1994, the Plan was amended to address density bonus
incentives to encourage larger scale development, as well as to revise relocation
procedures for displaced residents to correspond with the County’s minimum relocation
guidelines adopted in 1993. The Plan was subsequently amended in 1997 to update
references to the City’s Land Development Code and to enable the transfer of
development rights within the CRA boundaries.
Recently, the City stated that 135 new businesses were established within the CRA. The
City completed construction of a new “green” parking lot at the Performing Arts Center;
The City completed construction of a storm water pond at 46th St. & Park Blvd; A
cooperative revitalization project is underway between the CRA and United Cottages
Corporation (a subdivision of cottages located on 75th Terrace). The area began as a
trailer-converted tourist development in the 1940’s, and was rezoned in 2011 as a mixed-
use district with the hope that businesses might invest in a downtown, “live-work”
location. So far the CRA has invested over $1,000,000 in the neighborhood and has
initiated projects that include the replacement of existing utility poles with underground

69 | P a g e
electric utility infrastructure; drainage improvements; street upgrades (brick pavers,
curbs, and gutters); new driveways; uniform street address signage for each lot; a mail
kiosk; and decorative street lighting.
10. SAFETY HARBOR DOWNTOWN: The City of Safety Harbor was given redevelopment
authority by the BCC in 1992 to address deteriorating conditions in the downtown area.
The original CRA boundary generally extended from Old Tampa Bay to 11th Avenue (east
to west) and from 3rd Street North to 3rd Street South (north to south). In November of
2004, the BCC approved an expansion of the original area to include redevelopment
activities within three adjacent areas.
A Redevelopment Trust Fund was approved in 1992 by the BCC and currently receives
both City and County TIF contributions. However, the County TIF contribution is only
applicable for properties located in the original CRA. As of yet, the City has not elected to
pursue the establishment of a separate Redevelopment Trust Fund for the expanded
area.
In March 2009, the BCC approved a new CRA Downtown Master Plan, which included
both the original CRA and the expansion area. The 2009 Downtown Master Plan follows
the direction and practices contained in the Pinellas County Metropolitan Planning
Organization's Livable Communities Model Code. The Plan stresses the importance of
creating a sense of place and strives to preserve the nearby historic neo-traditional
residential neighborhoods. The new Plan was subsequently amended in 2012 to update
references to the City’s Comprehensive Plan and Land Development Code. Also there
were amendments made to the Tax Increment Financing section, reflecting new revenue
projections that account for the downturn in property values.
Recently, the City completed the construction of 42 new parking spaces along 2nd Street
South and also reconfigured and improved 14 on-street parking spaces along North
Bayshore Boulevard; Completed the Jefferson Street sidewalk improvements; Installed six
new bicycle racks and purchased seasonal welcome banners that will be hung from the
light poles throughout the downtown; Completed dock and boat slip improvements to
the City-Owned Marina Park; and funded and preformed a variety of environmental
restoration activities inside the recently acquired greenway and trail easement along
Mullet Creek.
11. ST. PETE BEACH GULF BOULEVARD & DOWNTOWN: The City of St. Pete Beach was
delegated redevelopment authority by the BCC in October 2006 for the 135 acre St. Pete
70 | P a g e
Beach CRA. A Redevelopment Trust Fund has not been established for this CRA. In March
2010, a Redevelopment Plan was approved by a citizen referendum.
12. ST. PETERSBURG 16TH STREET SOUTH: The 16th Street South CRA is a narrow (roughly
one-block wide) 22 acre corridor straddling 16th Street South, between 14th Avenue
South and north of 19th Avenue South. A Redevelopment Trust Fund has not been
established for this CRA.
The foremost goal of the Redevelopment Plan is to improve the economic viability of
businesses along the corridor by creating a retail commercial business district. Business
development goals concentrate on expanding the market potential of existing small
businesses and creating a broader mix of commercial activity, especially those involving
both specialty and convenience retail. Some design related goals involve upgrading the
physical environment through façade enhancement and landscaping, drainage and traffic
circulation improvements. The Plan also calls for creating a “healthy” pedestrian
experience to serve its residents and visitors.
In 2011, the City did not expend or program funds for capital improvements for this
redevelopment area. The City issued twelve building permits, totaling $278,000 in
construction value.
13. ST. PETERSBURG BAYBORO HARBOR: The 193 acre Bayboro Harbor CRA was established
by the BCC in 1985. The CRA has one Redevelopment Trust Fund, approved by the BCC in
1988, which receives both City and County TIF contributions. The majority of the Bayboro
Harbor CRA is characterized by institutional/non-profit organizations such as the National
Oceanic and Atmospheric Administration (NOAA), Florida Marine Research Institute
(FMRI), Florida Wildlife Commission (FWC), the United States Geological Survey Institute,
St. Joseph’s Hospital, formerly known as All Children's Hospital, Bayfront Health, and the
University of South Florida-St. Petersburg. All of these large organizations are exempt
from paying property taxes and occupy much of the CRA land on its northern and western
boundaries, which explains why TIF revenues have not increased significantly in recent
years, in comparison with other CRAs within the City. Continued expansion of these tax-
exempt institutional uses has constrained the generation of TIF revenues within the CRA.
The City acquired a parcel of land that was conveyed to USF-St. Petersburg to expand its
student housing. Additionally, St. Joseph’s Hospital and the Bayfront Health have
expanded their facilities between 4th Street South and the CRA's western boundaries,
removing additional properties from the tax rolls. Even though these tax-exempt
71 | P a g e
organizations do not contribute to the TIF revenues in the CRA, they provide a large
amount of employment opportunities, which is beneficial to the City of St. Petersburg and
Pinellas County.
The Bayboro Harbor Redevelopment Plan was approved in 1985 by the BCC and focuses
on the expansion of educational and health care facilities, residential development,
expansion of the Waterfront Park System and reinforcing Salt Creek as a marine industry
service center. Since its original approval, the Plan has been amended twice, in 2008 and
in 2009. Both amendments were minor, modifying several public improvement projects
to add public access to the waterfront and transportation improvements/amenities to the
Plan.
Recently, in 2011, the City issued 21 building permits totaling $350,000 in construction
value. However, most of the permits were for roofing or mechanical work.
14. ST. PETERSBURG INTOWN: The City of St. Petersburg’s Intown CRA is the third largest,
as well as one of the oldest (tying with the City of Clearwater) CRAs to be created in
Pinellas County. The City was delegated redevelopment authority for the CRA from the
BCC in 1981.
In 1982 the BCC established a Redevelopment Trust Fund for the area and authorized the
allocation of County TIF revenues. In 1986, the BCC approved an ordinance to revise the
County’s TIF contribution date to January 1st of each taxable year, instead of October 1st
of the fiscal year. In 2005, the BCC approved an extension of the County TIF contribution
for another 30 years primarily to help fund major improvements such as the new
Mahaffey Theater and Pier renovations. Compared to any other CRA within the County,
the Intown CRA annually receives the largest amount of County TIF revenues, largely
attributed to the recent development activity in the area.
The Intown Redevelopment Plan was approved by the BCC in 1981. Overall, the Plan
emphasizes development of a retail core, supporting residential areas as well as the
stadium district. Since its original approval, the Plan has been amended three times. In
2005, a revised list of public improvement projects was added, and in 2006, an
amendment increased the maximum amount of TIF funds available for downtown
improvement projects from $95.4 million to $97.4 million and allowed the Florida
Orchestra to utilize a $2 million private donation to construct their headquarters. In 2008,
minor amendments were made to the Plan consisting of updating text, maps, related
graphics, and correcting outdated zoning and future land use references (to ensure

72 | P a g e
consistency with recent amendments to the City’s Future Land Use Element of their
Comprehensive Plan). In November 2010, the BCC amended the Interlocal Agreement for
the Intown Redevelopment Area to reallocate $2.5 million from Pedestrian
System/Streetscape Improvements to help fund public site improvements for the Dali
Museum. This amendment to the Interlocal Agreement subsequently required a
corresponding amendment to the Intown Redevelopment Plan that was completed in July
2011.
In 2011, the City issued 264 building permits in the Intown CRA, totaling more than $7.9
million in construction value. All of the projects involved renovations to condominiums or
commercial and government establishments.
The Development Review Commission and Community Redevelopment Agency approved
one project in Intown, a 10,000-SF rooftop addition to the Birchwood Inn (formerly known
as Gray’s Hotel). Also, the City has initiated plans to relocate its downtown PSTA transit
hub at Williams Park to a new transportation facility, and is considering several locations
that would support the future trolley and BRT transit plans. In addition, the City has
started on a multi-tiered program focused on transit service improvements along the
Central Avenue corridor and to nearby areas located west of the downtown. Lastly, in
November, 2011, St. Petersburg voters approved an amendment to the City Charter
requiring City Council to develop and approve an inclusive Downtown Waterfront Master
Plan by July 1, 2015. The Master Plan will guide the development not only of the City’s
waterfront park system but also other major facilities including the Municipal Port, Albert
Whitted Airport, Al Lang Field, the Mahaffey Theatre, and the Municipal Marina.
15. ST. PETERSBURG INTOWN WEST: The Intown West CRA is approximately 123 acres in size
and lies north and west of Tropicana Field, bounded by I-275 to the west and I-175 to the
south, and Martin Luther King Boulevard to the east.
The CRA was created to capitalize on the development of Tropicana Field and the eventual
awarding of a Major League Baseball franchise. In 1991, the BCC established a
Redevelopment Trust Fund for the area and authorized the allocation of County TIF
revenues.
The Intown West Redevelopment Plan was approved by the BCC in 1990. Overall, the Plan
attempts to address building deterioration, poor visual identity and the lack of a unified
architectural theme surrounding Tropicana Field. Since its original adoption, two
amendments have occurred. In 2008, the amendments consisted of updating text, maps
73 | P a g e
and related graphics. In 2009, the amendments modified the list of public improvement
projects and corrected outdated zoning and future land use 58 references to ensure
consistency with recent amendments to the City’s Future Land Use Element of their
Comprehensive Plan.
During 2011, the City issued 40 building permits totaling more than $550,000 in the
Intown West district. Also, two new residential projects, that were permitted in earlier
years, opened – Bob Pitts Villas (1007 Arlington Ave N) and Fusion 1560 (1560 Central
Ave). Also, City staff approved a site plan for a 12-story, 64-dwelling unit development at
1325 Arlington Avenue North and the Development Review Commission approved an 11-
story, 70-unit apartment complex at 1050 1st Avenue North.
16. ST. PETERSBURG DOME INDUSTRIAL PARK PILOT PROJECT: The Dome Industrial Park
Pilot Project Redevelopment Area is located in the area known as Midtown. It is bounded
by I-275 on its east and southeast, 22nd Street South on its west, and 5th Avenue South
to its north.
This CRA was established in 2000 to energize investment in the neighboring Dome
Industrial Park CRA (the City’s first brownfield site). A Redevelopment Trust Fund has not
been established for this CRA.
The Redevelopment Plan for this CRA was approved by the BCC in 2000 and was designed
to encourage redevelopment activity that generates additional investment and jobs in the
Pilot Project area. Major components of the Plan include land assembly, relocation of
displaced residents, demolition of structures, and infrastructure upgrades necessary to
eliminate blighted conditions. Since the adoption in the Plan in 2000, two amendments
have been approved by the BCC. In 2005, amendments were made to support the
proposed location of the Job Corps facility.
17. ST. PETERSBURG DOME INDUSTRIAL PARK: The BCC delegated redevelopment authority
to the Dome Industrial Park CRA in 2005. The CRA totals 158 acres and borders both I-275
and 34th Street South. In 2006, the BCC approved an amendment to reduce the original
size of the CRA based upon the City’s revised Slum and Blight Study. A Redevelopment
Trust Fund has not been established for this CRA.
The three main objectives of the Plan are business retention, expansion and recruitment.
The overall implementation of the Plan centers on land assembly, infrastructure
improvements, transportation improvements, and business assistance programs. In 2008,

74 | P a g e
the Plan was amended, although amendments were minor in nature and consisted of
updating text, maps, related graphics, and correcting outdated zoning and future land use
references to ensure consistency with recent amendments to the City’s Future Land Use
Element of their Comprehensive Plan.
In 2011, the City acquired six properties for approximately $500,000 funded by a U.S.
Housing and Urban Development Economic Development Initiative grant, which
implements the City’s objective to consolidate land for future redevelopment in the
southeastern quadrant of the CRA. Also during 2011, the City issued 33 building permits
in the DIP for a total value of $471,254, approximately $220,000 for renovations to the
building of a paving business located at 800 31st Street South. The remaining permits
were associated with demolition, roofing, mechanical or electrical work or interior
renovations to existing buildings.
18. ST. PETERSBURG TANGERINE AVENUE: The Tangerine Avenue CRA is a part of a larger
Midtown Strategic Planning Initiative to guide future neighborhood and economic
development improvements to the area. The Tangerine Avenue CRA is located at the
intersection of Tangerine Avenue (18th Avenue South) and 22nd Street South,
encompassing the northeast, southeast and southwest corners of the intersection.
The City of St. Petersburg was delegated redevelopment authority by the BCC in May 2003
for the 21 acre area. A Redevelopment Trust Fund has not been established for this CRA.
The primary goal of the Redevelopment Plan was to promote commercial development
on the north and south sides of 18th Avenue South, and to strengthen the surrounding
single-family residential area. Since the original approval of the Plan by the BCC in 2003,
there has been one amendment. In 2008, the amendments consisted of updating text,
maps, related graphics, and correcting outdated zoning and future land use references to
coincide with recent amendments to the City’s Future Land Use Element.
In 2011, the City issued seven building permits for work totaling $571,000. Nearly all of
the permit activity involved construction of the Dollar General at the southwest corner of
the intersection of 18th Avenue South and 22nd Street South.
In 2013, the SweetBay Supermarket at the Tangerine Plaza went out of business and
closed its doors as part of a 30-store closing. In 2014, Walmart’s Neighborhood Market
opened to replace SweetBay, however, despite the City of St. Petersburg’s commitment
to invest over $2,000,000 in the Tangerine Plaza, Walmart closed its doors in early 2017.
75 | P a g e
19. ST. PETERSBURG, SOUTHSIDE CRA: A Plan was developed and approved in the fall of
2015 which incorporates the majority of the south side of St. Petersburg. The plan
focuses on substantial redevelopment, including housing improvements and economic
development.
20. TARPON SPRINGS DOWNTOWN: The City of Tarpon Springs was given redevelopment
authority by the BCC in 2001 to address deteriorating conditions in the downtown area.
This area is approximately 226 acres in size and is comprised of commercial properties
within the Alternate US Highway 19 corridor and the adjacent residential neighborhoods,
which are south of the Anclote River and north of Meres Boulevard. In June of 2003, the
BCC approved the City’s request to expand the original area by 1.4 acres to include the
former Pappas Restaurant property. A Redevelopment Trust Fund was established by the
BCC in 2001, and receives both City and County TIF contributions.
The overall focus of the Tarpon Springs’ Downtown Redevelopment Plan is to bring
economic growth to the district through tourism enhancements. The Plan attempts to
improve the visitor experience through improved visual gateways, unified themes, and
transportation and pedestrian improvements. Since approval of the Redevelopment Plan
by the BCC in 2001, there has been one amendment. In 2006, the amendment consisted
of updating text, maps, and related graphics, and zoning and future land use references
that relate to the 2003 CRA expansion to include the former Pappas Restaurant property.
Recently, the City has completed the improvements and received a federal earmark in the
amount of $385,000 for infrastructure improvements on Lemon Street. The CRA
additionally funded $500,000 for streetscape/landscaping improvements for the Lemon
Street Corridor. In August 2011, the City acquired Tarpon Avenue from FDOT. This transfer
would allow for more creative use of the rights-of-way and allow the City to enhance
cyclists and pedestrian activity. The Board of Commissioners recently approved a re-
planting plan for the existing medians, bulb-outs and tree wells. The City has approved
concept plans for two recreation areas along Live Oak Street. The North Parcel is the city-
owned parking lot / dog park area located between Live Oak Street and the Anclote River.
The City has budgeted $285,000 from Penny for Pinellas funds for this project.

76 | P a g e
Community Reinvestment Act
The Community Reinvestment Act (CRA), enacted by Congress in 1977 (12 U.S.C. 2901) and
implemented by federal regulations in 12 CFR parts 25, 228, 345, and 563e, is intended to
encourage depository institutions to help meet the credit needs of the communities in which
they operate, including low- and moderate-income neighborhoods, consistent with safe and
sound banking operations.
The CRA requires that each insured depository institution’s track record of meeting the credit
needs of its entire community be evaluated periodically and taken into account in considering an
institution's application for deposit facilities, including mergers and acquisitions. CRA
examinations are conducted by the federal agencies that are responsible for supervising
depository institutions: the Board of Governors of the Federal Reserve System (FRB), the Federal
Deposit Insurance Corporation (FDIC), and the Office of the Comptroller of the Currency (OCC).
For the period 2007-2016, all financial institutions in Pinellas County governed by the FDIC, FRB
and OCC were rated either Outstanding or Satisfactory, with no Needs Improvement or
Substantial Non-Complaint. (Source: http://www2.fdic.gov/crapes/)
Home Mortgage Disclosure Act (HMDA) Analysis
Introduction
The Home Mortgage Disclosure Act (HMDA) was enacted by Congress in 1975 and was
implemented by the Federal Reserve Board's Regulation C. On July 21, 2011, the rule-writing
authority of Regulation C was transferred to the Consumer Financial Protection Bureau (CFPB).
This regulation provides the public with loan data that can be used to assist in determining
whether financial institutions are serving the housing needs of their communities, public officials
in distributing public-sector investments so as to attract private investment to areas where it is
needed, and in identifying possible discriminatory lending patterns. This regulation applies to
certain financial institutions, including banks, savings associations, credit unions, and other
mortgage lending institutions.
The Federal Financial Institution Examination Council (FFIEC) gathers data on home mortgage
activity from the federal agencies that regulate the home mortgage industry. Data for years 2007
through 2013 was downloaded from the Consumer Financial Protection Bureau
(http://www.consumerfinance.gov/hmda/) for analysis. This analysis (the data deemed most
pertinent to this report) is limited to loan denial and origination rates by census tract within
Pinellas County and within areas of racial, ethnic and income distinction for loans for 1-4 family
dwellings and manufactured homes, but excluding data on loan applications for investment

77 | P a g e
purposes (non-owner occupied). Three types of loan products were included: conventional, FHA
and VA loans; and three loan purposes were included: home purchase, refinance, and home
improvement loans.
Analysis
Results displayed in Table 13, and illustrated in Charts 11-15, shows a summary of loan activity
from the HMDA data for 2007 through 2013. There were at total of 228,831 applications with
118,419 loan originations, translating to an origination rate (percentage of applications resulting
in loans) of 51.7 percent.
Using the sum of originations and denials to compute an origination rate results in an origination
rate of 67.3 percent; this method excludes the following instances: applications that were
withdrawn, files that were closed due to incompleteness and pre-approval requests that were
either approved or denied. Table 13 breaks out the home loan activity by loan type, race,
ethnicity, income, and loan purpose. The majority of applications, 186,673, were for conventional
loans, corresponding to an origination rate of 50.5 percent. This was followed by 33,063
applications for Federal Housing Administration (FHA)-insured loans and 9,095 applications for
Veterans Administration (VA)-guaranteed, with origination rates of 55.8 percent, 63.1 percent
respectively.
White applicants represented the largest number of loan applicants at 178,910 or 78.2 percent,
with an origination rate of 55.0 percent. African Americans submitted 11,977 applications and
had an origination rate that was substantially lower at 37.5 percent. Applicants of other races
submitted 6,827 applications, corresponding to an origination rate of 48.0 percent. When
examining ethnicity, Hispanics accounted for 10,792 applications and had an origination rate of
47.2 percent, also significantly higher than African Americans.
High-income applicants showed a significantly higher number of applications at 101,753, with an
origination rate of 54.8 percent. The number of applications for all other income groups drops
significantly; the origination rates, however, decrease incrementally from 51.5 percent for the
middle-income applicants to 39.7 percent for the very low income.
Refinancing loans showed the highest number of applications at 142,892 for loan purpose, with
an origination rate of 47.7 percent, followed by home purchase applications (68,587), with an
origination rate of 64.1 percent. There were considerably less home improvement applications
at 17,352, with an origination rate of 35.8 percent.
Table 14 examines the loans originated for a given loan activity (i.e. type, race, ethnicity, income,
purpose) against the total loans originated in that same activity. For example, for the category
Loan Type, the first percentage in the "% of Loans Originated" column indicates that 79.6 percent

78 | P a g e
(94,230/118,419) of loan originations were for conventional loans. This was followed by FHA
loans and VA-Other loans, which accounted for 15.6 percent and 4.8 percent of the total loan
originations, respectively. Refinancing accounted for 57.6 percent of total loan originations,
followed by home purchase at 39.6 percent and home improvement at 5.3 percent.
To facilitate comparisons of originations by racial and ethnic categories, their respective
percentages in the population are provided, as tabulated by the US Census Bureau: State and
County QuickFacts. Whites showed highest percentage at 83.2 percent of the total loan
originations in the County, compared to 83.4 percent of the population. For African Americans,
3.8 percent of total origination was considerably lower the 10.8 percent of the total population
that they represent. The same pattern was true of Hispanics, who represented 4.3 percent of the
total loan originations versus 8.2 percent of Hispanics in the population. 11.0 percent of the
records were missing data on race.
The two highest income groups accounted for the majority of the total loan originations, with the
high (>=120 of median) and (100-119 percent of median) groups showing 47.1 percent and 9.5
percent of the loan originations respectively. In contrast, the percentage of total loan originations
accounted for by the (<50 percent of median) group was 5.1 percent. The (50-79 percent of
median) and (80-99 percent of median) income groups accounting for 17.6 percent and 11.0
percent of the total loan originations, respectively.
Table 15, illustrated by Charts 16-21, uses the HMDA data to look at the possibility of redlining
within the County. The term redlining herein refers to a discriminatory lending practice where
lenders avoid doing business or charge higher than normal rates to individuals in certain poor (or
allegedly undesirable) neighborhoods. Assuming that these poor or undesirable neighborhoods
can be characterized by very-low income (<50 percent median income), a comparison of
origination rates by income within these tracts to high income (>=120 median income) tracts
could reveal potential redlining.
Origination rates for Pinellas County indicate that loan origination rates were distributed
relatively evenly across the income categories, decreasing from 54.8 percent for the high income
(>=120 of median) category to 39.7 percent for the very low (<50 percent of median) category.
A comparison of origination rates by applicant income within high income (>=120 of median)
census tracts to origination rates by applicant income within very low (<50 percent of median)
income tracts showed large differences between origination and denial rates. The difference in
origination rates ranged from 7.7 percent to 22.9 percent lower by applicant income in the very
low income (<50 percent of median) census tracts when compared to the high income (>=120 of
median) census tracts. Data show a similar pattern with denial rates running from 5.3 percent to
79 | P a g e
17.7 percent higher across applicant income categories in very low (<50 percent of median)
census tracts when compared to high income (>=120 of median) census tracts.
When comparing the origination rates of the total of “originated and denied loans” (which
exclude circumstances such as loan withdrawn, file closed for incompleteness, approved but not
accepted, and preapproval requests denied or approved), the differences in origination rates
ranged from 8.4 percent to 25.6 percent lower by applicant income in the very low income (<50
percent of median) census tracts when compared to the high income (>=120 of median) census
tracts.
Finally, when comparing both the high income tracts and low income tracts to all of Pinellas
County, using the origination rates of the total of “originated and denied loans”, the origination
rates in the high income census tracts were greater than Pinellas County, as well the originations
rates of the total of “originated and denied loans”, the origination rates in the very low income
census tracts were less than Pinellas County (differences highlighted in Table 14). Ideally,
origination rates should be similar among same income groups regardless of the income for the
census tract where the subject property is located. The origination rates of all the income groups
increase as the tract income increases. This indicates that families with similar incomes are more
likely to successfully originate a loan for property if they live in a higher income census tract.
Therefore, some characteristics of redlining may be present in lower income tracts in the
community. The relatively small number of applications in the lower income tracts, however,
makes any conclusive determination of redlining difficult.
Table 16, illustrated by Charts 22-29, compares origination rates between minorities and White
applicants for the various loan purposes and income groups. White loan origination rates were
consistently much higher than minorities, regardless of loan purpose. Conversely, the denial rates
were much higher for minorities, with minorities showing denial rates of 15.8 percent, 11.8
percent, and 8.6 percent higher than Whites in Home Improvement Loans, Refinances, and Home
Purchase loans, respectively. The same pattern manifests when racial differences within income
groups were examined. Whites showed consistently higher originations across the income
groups, a full 20 percentage points or higher than Minorities overall.
Map 9 illustrates the distribution of all loan applications by census tract (census tracts of 2010
Census) indexed to the population of each particular census tract. All of Pinellas County has an
index of 25 (25% of the population submitted loan applications). The red census tracts indicate
that 3 to 22 percent of the population for those census tracts submitted loan applications, yellow
indicates 23 to 27 percent of the population for those census tracts submitted loan applications,
light green indicates 28 to 35 percent of the population for those census tracts submitted loan
80 | P a g e
applications. The yellow census tracts most closely represent the average of all Pinellas County
at 25 percent.
Map 10 illustrates the number of loan denials for each 100 applications by census tracts (census
tracts of 2010 Census). The average denial per 100 loan applications for all of Pinellas County is
25 denials. The census tracts, depicted in the dark green color, indicate for every 100 loan
applications made, 14 to 22 were denied. The census tracts, depicted in the light green color,
indicate for every 100 loan applications made, 23 to 27 were denied. The census tracts, depicted
in the yellow color, indicate for every 100 loan applications made, 28 to 35 were denied, and
finally the census tracts, depicted in the red color, indicate for every 100 loan applications made,
36 to 53 were denied. The census tracts, depicted in the light green color, most closely represent
the average of all Pinellas County at 25 loan denials per 100 applications.
Map 11 indicates the locations of credit unions and banks/other financial institutions as it relates
to census tracts according to income level. Throughout Pinellas County, financial institutions are
located along high-traffic corridors along with other retail, however in low-income areas where
many residents do not have access to automobiles, access to those retail corridors are more
challenging. According to Inside Site Selection: Retailers’ search for strategic business locations,
March 2008, published by International Council of Shopping Centers in partnership with Social
Compact and Underserved Markets Task Force, “access to traditional financial services and fresh
food are essential components of comprehensive community development. Limited access to
traditional banking and financial services has long been a barrier to wealth creation in
marginalized communities.” Communities without traditional financial services face paying
check-cashing institutions, pay-day lending centers and other predatory financial service
providers. While the demographics of an urban site may work for traditional financial institutions,
other equally important factors that may be missing from urban communities is the day-time
foot traffic generated by other commercial/retail business. “Consequently, cities need to
promote redevelopment of retail cores in underserved neighborhoods to make it easier for
traditional financial serve retailers to penetrate inner cities.”
Based on a review of the Home Mortgage Disc losure Act (HMDA) data, overall, origination
rates among Whites were higher than minorities in home purchase, home improvement and
refinance loans. Refinance loans were the most frequent loan type in the County and the three
incorporated cities analyzed in this study. The loan applications and originations were
significantly lower compared to their percentage in population for African Americans, Asians,
and Hispanics in the County and the cities. This suggests two issues, the lack of applications from
minorities and the rate of loan denials. The reasons for lower loan originations among minorities
were inconclusive based on the overall data. However, during the period between 2007 and
81 | P a g e
2013, of the 57,531 loans that were denied, the majority of loan denial reasons for all applicants
were related to the applicants' poor credit history, lack of collateral, or high debt-to-income
ratio.
Additionally, while the analysis offered does not provide conclusive evidence of redlining, the
data tend to suggest some characteristics of redlining may exist. Ideally, origination rates
should be similar among same income groups regardless of the income for the census tract
where the subject property is located. However, the origination rates for all the income groups
increases as the tract income increases and decreased as the tract income decreased. This
indicates that families with similar income are more likely to originate a loan for property in a
higher income census tract in Pinellas County and the incorporated cities. While it is expected
that very low-income applicants tend to have lower origination rates, within the very low-
income census tracts, even high-income applicants showed a poor success rate. However,
due to very low number of applications in the lower income census tracts, any conclusive
determination of redlining is difficult.
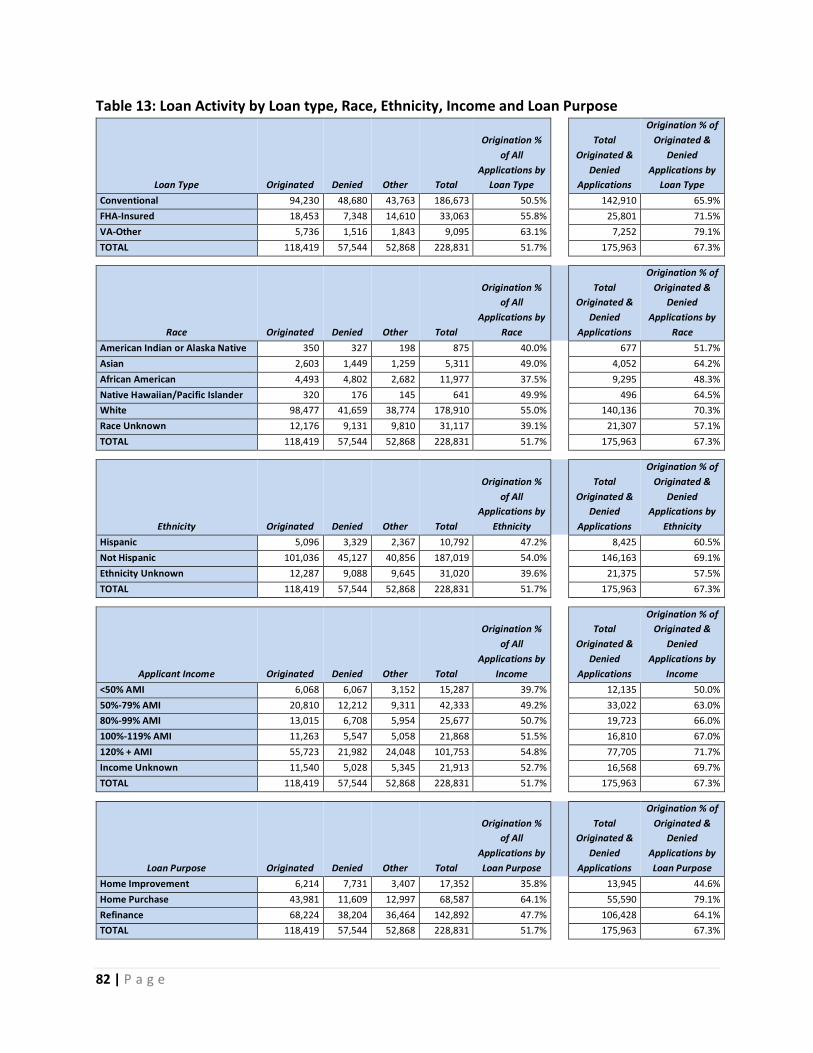
82 | P a g e
Table 13: Loan Activity by Loan type, Race, Ethnicity, Income and Loan Purpose
Loan Type Originated Denied Other Total
Origination %
of All
Applications by
Loan Type
Total
Originated &
Denied
Applications
Origination % of
Originated &
Denied
Applications by
Loan Type
Conventional 94,230 48,680 43,763 186,673 50.5% 142,910 65.9%
FHA-Insured 18,453 7,348 14,610 33,063 55.8% 25,801 71.5%
VA-Other 5,736 1,516 1,843 9,095 63.1% 7,252 79.1%
TOTAL 118,419 57,544 52,868 228,831 51.7% 175,963 67.3%
Race Originated Denied Other Total
Origination %
of All
Applications by
Race
Total
Originated &
Denied
Applications
Origination % of
Originated &
Denied
Applications by
Race
American Indian or Alaska Native 350 327 198 875 40.0% 677 51.7%
Asian 2,603 1,449 1,259 5,311 49.0% 4,052 64.2%
African American 4,493 4,802 2,682 11,977 37.5% 9,295 48.3%
Native Hawaiian/Pacific Islander 320 176 145 641 49.9% 496 64.5%
White 98,477 41,659 38,774 178,910 55.0% 140,136 70.3%
Race Unknown 12,176 9,131 9,810 31,117 39.1% 21,307 57.1%
TOTAL 118,419 57,544 52,868 228,831 51.7% 175,963 67.3%
Ethnicity Originated Denied Other Total
Origination %
of All
Applications by
Ethnicity
Total
Originated &
Denied
Applications
Origination % of
Originated &
Denied
Applications by
Ethnicity
Hispanic 5,096 3,329 2,367 10,792 47.2% 8,425 60.5%
Not Hispanic 101,036 45,127 40,856 187,019 54.0% 146,163 69.1%
Ethnicity Unknown 12,287 9,088 9,645 31,020 39.6% 21,375 57.5%
TOTAL 118,419 57,544 52,868 228,831 51.7% 175,963 67.3%
Applicant Income Originated Denied Other Total
Origination %
of All
Applications by
Income
Total
Originated &
Denied
Applications
Origination % of
Originated &
Denied
Applications by
Income
<50% AMI 6,068 6,067 3,152 15,287 39.7% 12,135 50.0%
50%-79% AMI 20,810 12,212 9,311 42,333 49.2% 33,022 63.0%
80%-99% AMI 13,015 6,708 5,954 25,677 50.7% 19,723 66.0%
100%-119% AMI 11,263 5,547 5,058 21,868 51.5% 16,810 67.0%
120% + AMI 55,723 21,982 24,048 101,753 54.8% 77,705 71.7%
Income Unknown 11,540 5,028 5,345 21,913 52.7% 16,568 69.7%
TOTAL 118,419 57,544 52,868 228,831 51.7% 175,963 67.3%
Loan Purpose Originated Denied Other Total
Origination %
of All
Applications by
Loan Purpose
Total
Originated &
Denied
Applications
Origination % of
Originated &
Denied
Applications by
Loan Purpose
Home Improvement 6,214 7,731 3,407 17,352 35.8% 13,945 44.6%
Home Purchase 43,981 11,609 12,997 68,587 64.1% 55,590 79.1%
Refinance 68,224 38,204 36,464 142,892 47.7% 106,428 64.1%
TOTAL 118,419 57,544 52,868 228,831 51.7% 175,963 67.3%

83 | P a g e
Table 14: Originated Loans by Loan Type, Race, Ethnicity, Income and Loan Purpose
Loan Type Originated Denied Other Total
% of All
Originated
Applications
Total
Originated &
Denied
Applications
Origination % of
All Originated &
Denied
Applications
Conventional 94,230 48,680 43,763 186,673 79.6% 142,910 81.2%
FHA-Insured 18,453 7,348 7,262 33,063 15.6% 25,801 14.7%
VA-Other 5,736 1,516 1,843 9,095 4.8% 7,252 4.1%
TOTAL 118,419 57,544 52,868 228,831 100.0% 175,963 100.0%
Race Originated Denied Other Total
% of All
Originated
Applications
Total
Originated &
Denied
Applications
Origination % of
All Originated &
Denied
Applications
American Indian or Alaska Native 350 327 198 875 0.3% 677 0.4%
Asian 2,603 1,449 1,259 5,311 2.2% 4,052 2.3%
African American 4,493 4,802 2,682 11,977 3.8% 9,295 5.3%
Native Hawaiian or Pacific Islander 320 176 145 641 0.3% 496 0.3%
White 98,477 41,659 38,774 178,910 83.2% 140,136 79.6%
Not Available/Applicable 12,176 9,131 9,810 31,117 10.3% 21,307 12.1%
TOTAL 118,419 57,544 52,868 228,831 100.0% 175,963 100.0%
Ethnicity Originated Denied Other Total
% of All
Originated
Applications
Total
Originated &
Denied
Applications
Origination % of
All Originated &
Denied
Applications
Hispanic 5,096 3,329 2,367 10,792 4.3% 8,425 4.8%
Not Hispanic 101,036 45,127 40,856 187,019 85.3% 146,163 83.1%
Not Available/Applicable 12,287 9,088 9,645 31,020 10.4% 21,375 12.1%
TOTAL 118,419 57,544 52,868 228,831 100.0% 175,963 100.0%
Applicant Income Originated Denied Other Total
% of All
Originated
Applications
Total
Originated &
Denied
Applications
Origination % of
All Originated &
Denied
Applications
<50% AMI 6,068 6,067 3,152 15,287 5.1% 12,135 6.9%
50%-79% AMI 20,810 12,212 9,311 42,333 17.6% 33,022 18.8%
80%-99% AMI 13,015 6,708 5,954 25,677 11.0% 19,723 11.2%
100%-119% AMI 11,263 5,547 5,058 21,868 9.5% 16,810 9.6%
120% + AMI 55,723 21,982 24,048 101,753 47.1% 77,705 44.2%
Income Unknown 11,540 5,028 5,345 21,913 9.7% 16,568 9.4%
TOTAL 118,419 57,544 52,868 228,831 100.0% 175,963 100.0%
Loan Purpose Originated Denied Other Total
% of All
Originated
Applications
Total
Originated &
Denied
Applications
Origination % of
All Originated &
Denied
Applications
Home Improvement 6,214 7,731 3,407 17,352 5.2% 13,945 7.9%
Home Purchase 43,981 11,609 12,997 68,587 37.1% 55,590 31.6%
Refinance 68,224 38,204 36,464 142,892 57.6% 106,428 60.5%
TOTAL 118,419 57,544 52,868 228,831 100.0% 175,963 100.0%
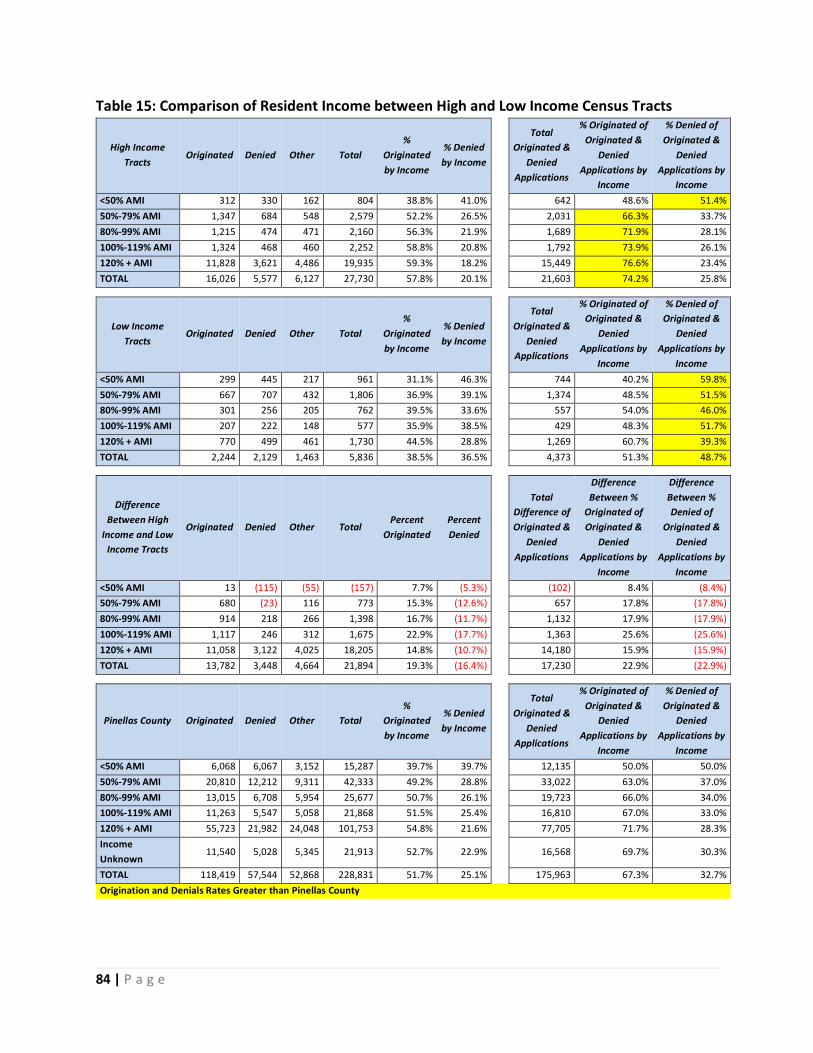
84 | P a g e
Table 15: Comparison of Resident Income between High and Low Income Census Tracts
High Income
Tracts Originated Denied Other Total
%
Originated
by Income
% Denied
by Income
Total
Originated &
Denied
Applications
% Originated of
Originated &
Denied
Applications by
Income
% Denied of
Originated &
Denied
Applications by
Income
<50% AMI 312 330 162 804 38.8% 41.0% 642 48.6% 51.4%
50%-79% AMI 1,347 684 548 2,579 52.2% 26.5% 2,031 66.3% 33.7%
80%-99% AMI 1,215 474 471 2,160 56.3% 21.9% 1,689 71.9% 28.1%
100%-119% AMI 1,324 468 460 2,252 58.8% 20.8% 1,792 73.9% 26.1%
120% + AMI 11,828 3,621 4,486 19,935 59.3% 18.2% 15,449 76.6% 23.4%
TOTAL 16,026 5,577 6,127 27,730 57.8% 20.1% 21,603 74.2% 25.8%
Low Income
Tracts Originated Denied Other Total
%
Originated
by Income
% Denied
by Income
Total
Originated &
Denied
Applications
% Originated of
Originated &
Denied
Applications by
Income
% Denied of
Originated &
Denied
Applications by
Income
<50% AMI 299 445 217 961 31.1% 46.3% 744 40.2% 59.8%
50%-79% AMI 667 707 432 1,806 36.9% 39.1% 1,374 48.5% 51.5%
80%-99% AMI 301 256 205 762 39.5% 33.6% 557 54.0% 46.0%
100%-119% AMI 207 222 148 577 35.9% 38.5% 429 48.3% 51.7%
120% + AMI 770 499 461 1,730 44.5% 28.8% 1,269 60.7% 39.3%
TOTAL 2,244 2,129 1,463 5,836 38.5% 36.5% 4,373 51.3% 48.7%
Difference
Between High
Income and Low
Income Tracts
Originated Denied Other Total Percent
Originated
Percent
Denied
Total
Difference of
Originated &
Denied
Applications
Difference
Between %
Originated of
Originated &
Denied
Applications by
Income
Difference
Between %
Denied of
Originated &
Denied
Applications by
Income
<50% AMI 13 (115) (55) (157) 7.7% (5.3%) (102) 8.4% (8.4%)
50%-79% AMI 680 (23) 116 773 15.3% (12.6%) 657 17.8% (17.8%)
80%-99% AMI 914 218 266 1,398 16.7% (11.7%) 1,132 17.9% (17.9%)
100%-119% AMI 1,117 246 312 1,675 22.9% (17.7%) 1,363 25.6% (25.6%)
120% + AMI 11,058 3,122 4,025 18,205 14.8% (10.7%) 14,180 15.9% (15.9%)
TOTAL 13,782 3,448 4,664 21,894 19.3% (16.4%) 17,230 22.9% (22.9%)
Pinellas County Originated Denied Other Total
%
Originated
by Income
% Denied
by Income
Total
Originated &
Denied
Applications
% Originated of
Originated &
Denied
Applications by
Income
% Denied of
Originated &
Denied
Applications by
Income
<50% AMI 6,068 6,067 3,152 15,287 39.7% 39.7% 12,135 50.0% 50.0%
50%-79% AMI 20,810 12,212 9,311 42,333 49.2% 28.8% 33,022 63.0% 37.0%
80%-99% AMI 13,015 6,708 5,954 25,677 50.7% 26.1% 19,723 66.0% 34.0%
100%-119% AMI 11,263 5,547 5,058 21,868 51.5% 25.4% 16,810 67.0% 33.0%
120% + AMI 55,723 21,982 24,048 101,753 54.8% 21.6% 77,705 71.7% 28.3%
Income
Unknown 11,540 5,028 5,345 21,913 52.7% 22.9% 16,568 69.7% 30.3%
TOTAL 118,419 57,544 52,868 228,831 51.7% 25.1% 175,963 67.3% 32.7%
Origination and Denials Rates Greater than Pinellas County

85 | P a g e
Table 16: Comparison of Loan Originations and Denials by Race
Loan Type Race Originated Denied Other Total
% of
Applications
%
Originated
by Race
% Denied by
Race
Home Improvement White 4,882 5,135 2,459 12,476 71.9% 39.1% 41.2%
Minority 643 1,370 391 2,404 13.9% 26.7% 57.0%
Race Unknown 689 1,226 557 2,472 14.2% 27.9% 49.6%
Total 6,214 7,731 3,407 17,352 100.0%
Home Purchase White 37,154 8,934 10,062 56,150 81.9% 66.2% 15.9%
Minority 2,904 1,279 1,048 5,231 7.6% 55.5% 24.5%
Race Unknown 3,923 1,396 1887 7,206 10.5% 54.4% 19.4%
Total 43,981 11,609 12,997 68,587 100.0%
Refinance White 56,441 27,590 26,253 110,284 77.2% 51.2% 25.0%
Minority 4,219 4,105 2,845 11,169 7.8% 37.8% 36.8%
Race Unknown 7,564 6,509 7,366 21,439 15.0% 35.3% 30.4%
Total 68,224 38,204 36,464 142,892 100.0%
TOTAL White 98,477 41,659 38,774 178,910 78.2% 55.0% 23.3%
Minority 7,766 6,754 4,284 18,804 8.2% 41.3% 35.9%
Race Unknown 12,176 9,131 9,810 31,117 13.6% 39.1% 29.3%
Total 118,419 57,544 52,868 228,831 100.0%
Applicant Income Race Originated Denied Other Total
% of
Applications
%
Originated
by Income
% Denied by
Income
<50% AMI White 4,895 4,120 2,166 11,181 73.1% 43.8% 36.8%
Minority 609 997 388 1,994 13.0% 30.5% 50.0%
Race Unknown 564 950 598 2,112 13.8% 26.7% 45.0%
Total 6,068 6,067 3,152 15,287 100.0%
50%-79% AMI White 17,029 8,499 6,619 32,147 75.9% 53.0% 26.4%
Minority 1,881 1,932 1,079 4,892 11.6% 38.5% 39.5%
Race Unknown 1,900 1,781 1,613 5,294 12.5% 35.9% 33.6%
Total 20,810 12,212 9,311 42,333 100.0%
80%-99% AMI White 10,815 4,836 4,381 20,032 78.0% 54.0% 24.1%
Minority 986 828 526 2,340 9.1% 42.1% 35.4%
Race Unknown 1,214 1,044 1,047 3,305 12.9% 36.7% 31.6%
Total 13,015 6,708 5,954 25,677 100.0%
100%-119% AMI White 9,340 3,993 3,742 17,075 78.1% 54.7% 23.4%
Minority 770 649 453 1,872 8.6% 41.1% 34.7%
Race Unknown 1,153 905 863 2,921 13.4% 39.5% 31.0%
Total 11,263 5,547 5,058 21,868 100.0%
120% + AMI White 46,992 16,854 18,407 82,253 80.8% 57.1% 20.5%
Minority 2,621 1,771 1,374 5,766 5.7% 45.5% 30.7%
Race Unknown 6,110 3,357 4,267 13,734 13.5% 44.5% 24.4%
Total 55,723 21,982 24,048 101,753 100.0%
Income Unknown White 5,923 1,779 2,147 9,849 44.9% 60.1% 18.1%
Minority 4,802 264 282 5,348 24.4% 89.8% 4.9%
Race Unknown 815 2,985 2,916 6,716 30.6% 12.1% 44.4%
Total 11,540 5,028 5,345 21,913 100.0%
TOTAL White 94,994 40,081 37,462 172,537 75.4% 55.1% 23.2%
Minority 11,669 6,441 4,102 22,212 9.7% 52.5% 29.0%
Race Unknown 11,756 11,022 11,304 34,082 14.9% 34.5% 32.3%
Total 118,419 57,544 52,868 228,831 100.0%

86 | P a g e
Chart 11: Originations Rate by Loan Type
Chart 12 Origination Rates by Race
0
20,000
40,000
60,000
80,000
100,000
120,000
140,000
160,000
180,000
200,000
Conventional FHA-Insured VA-Other TOTAL
Nu
mb
er o
f Lo
ans
Loan Type
Originated
Denied
Total Originated &Denied Applications
0
20,000
40,000
60,000
80,000
100,000
120,000
140,000
160,000
180,000
200,000
Nu
mb
er o
f Lo
ans
By Race
Originated
Denied
Total Originated & DeniedApplications

87 | P a g e
Chart 13: Origination Rates by Ethnicity
Chart 14: Origination Rates by Applicant Income
0
20,000
40,000
60,000
80,000
100,000
120,000
140,000
160,000
180,000
200,000
Hispanic Not Hispanic EthnicityUnknown
TOTAL
Nu
mb
er o
f Lo
ans
By Ethnicity
Originated
Denied
Total Originated & Denied Applications
0
20,000
40,000
60,000
80,000
100,000
120,000
140,000
160,000
180,000
200,000
Nu
mb
er o
f Lo
ans
By Applicant Income
Originated
Denied
Total Originated & Denied Applications
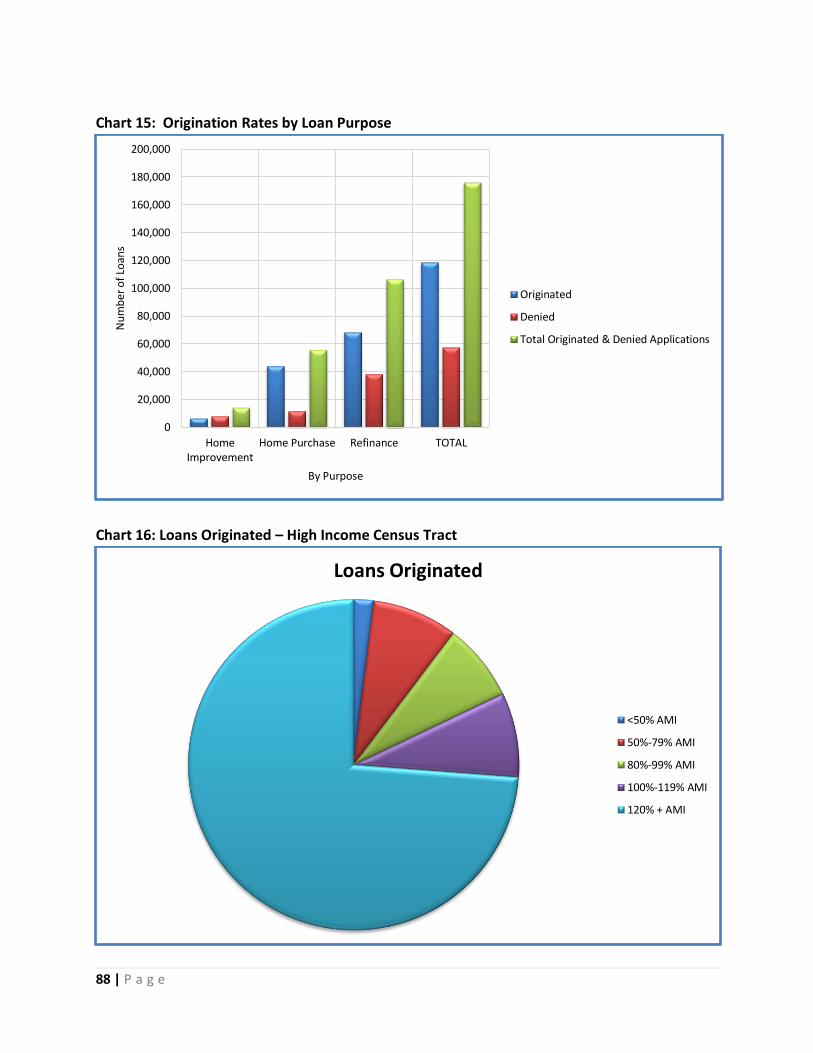
88 | P a g e
Chart 15: Origination Rates by Loan Purpose
Chart 16: Loans Originated – High Income Census Tract
0
20,000
40,000
60,000
80,000
100,000
120,000
140,000
160,000
180,000
200,000
HomeImprovement
Home Purchase Refinance TOTAL
Nu
mb
er o
f Lo
ans
By Purpose
Originated
Denied
Total Originated & Denied Applications
Loans Originated
<50% AMI
50%-79% AMI
80%-99% AMI
100%-119% AMI
120% + AMI

89 | P a g e
Chart 17: Loans Originated – Low Income Census Tracts
Chart 18 Loans Originated – All Pinellas County Census Tracts
Loans Originated
<50% AMI
50%-79% AMI
80%-99% AMI
100%-119% AMI
120% + AMI
Loans Originated
<50% AMI
50%-79% AMI
80%-99% AMI
100%-119% AMI
120% + AMI
Income Unknown

90 | P a g e
Chart 19: Total Originated & Denied Loans – High Income Tract
Chart 20: Total Originated & Denied Loans - Low Income Tract
0
2,000
4,000
6,000
8,000
10,000
12,000
14,000
16,000
18,000
<50% AMI 50%-79%AMI
80%-99%AMI
100%-119%AMI
120% + AMI
Nu
mb
er o
f Lo
ans
Borrower Income
Originated
Denied
Total Originated & Denied Applications
0
200
400
600
800
1,000
1,200
1,400
1,600
<50% AMI 50%-79%AMI
80%-99%AMI
100%-119%AMI
120% + AMI
Nu
mb
er o
f Lo
ans
Borrower Income
Originated
Denied
Total Originated & Denied Applications

91 | P a g e
Chart 21: Total Originated & Denied Loans – All Pinellas County Census Tracts
Chart 22: Home Improvement Loans Originated by Race
0
10,000
20,000
30,000
40,000
50,000
60,000
70,000
80,000
90,000
<50% AMI 50%-79%AMI
80%-99%AMI
100%-119%AMI
120% + AMI
Nu
mb
er o
f Lo
ans
Borrower Income
Originated
Denied
Total Originated & Denied Applications
39.1%
26.7% 27.9%
0.0%
5.0%
10.0%
15.0%
20.0%
25.0%
30.0%
35.0%
40.0%
45.0%
White Minority Race Unknown
% Home Improvement Loans Originated by Race
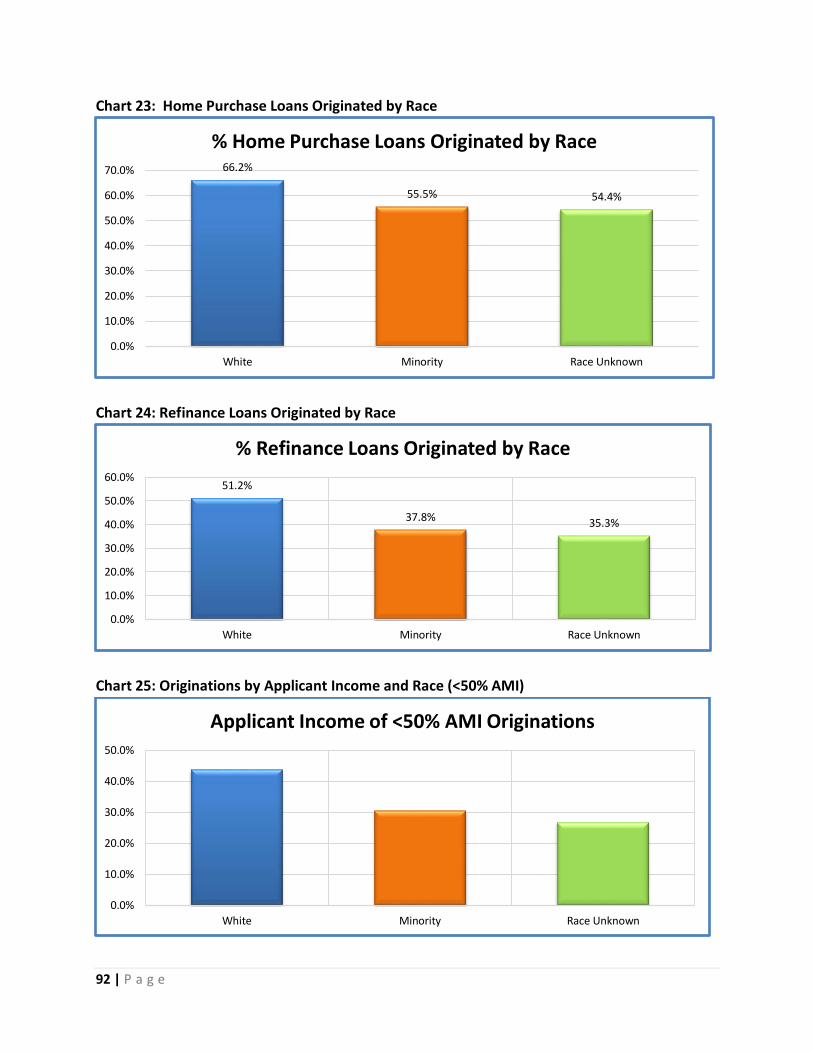
92 | P a g e
Chart 23: Home Purchase Loans Originated by Race
Chart 24: Refinance Loans Originated by Race
Chart 25: Originations by Applicant Income and Race (<50% AMI)
66.2%
55.5% 54.4%
0.0%
10.0%
20.0%
30.0%
40.0%
50.0%
60.0%
70.0%
White Minority Race Unknown
% Home Purchase Loans Originated by Race
51.2%
37.8% 35.3%
0.0%
10.0%
20.0%
30.0%
40.0%
50.0%
60.0%
White Minority Race Unknown
% Refinance Loans Originated by Race
0.0%
10.0%
20.0%
30.0%
40.0%
50.0%
White Minority Race Unknown
Applicant Income of <50% AMI Originations

93 | P a g e
Chart 26: Originations by Applicant Income and Race (50-79% AMI)
Chart 27: Originations by Applicant Income and Race (80-99% AMI)
Chart 28: Originations by Applicant Income and Race (100-119% AMI)
53.0%
38.5%35.9%
0.0%
10.0%
20.0%
30.0%
40.0%
50.0%
60.0%
White Minority Race Unknown
Applicant Income of 50-79% AMI Originations
54.0%
42.1%36.7%
0.0%
10.0%
20.0%
30.0%
40.0%
50.0%
60.0%
White Minority Race Unknown
Applicant Income of 80-99% AMI Originations
54.7%
41.1% 39.5%
0.0%
10.0%
20.0%
30.0%
40.0%
50.0%
60.0%
White Minority Race Unknown
Applicant Income of 100-119% AMI Originations
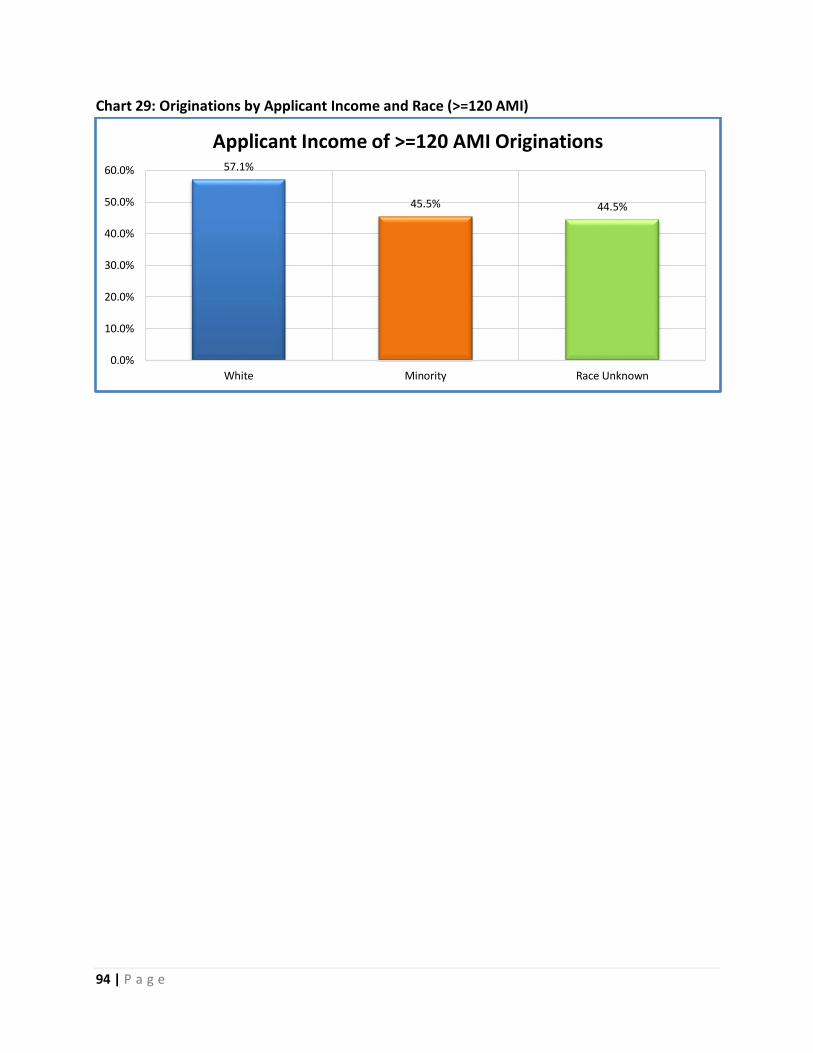
94 | P a g e
Chart 29: Originations by Applicant Income and Race (>=120 AMI)
57.1%
45.5% 44.5%
0.0%
10.0%
20.0%
30.0%
40.0%
50.0%
60.0%
White Minority Race Unknown
Applicant Income of >=120 AMI Originations

95 | P a g e
Map 9: All Applications by Census Tract Indexed to Population of Census Tract

96 | P a g e
Map 10: Loan Denials per 100 Applications by Census Tract
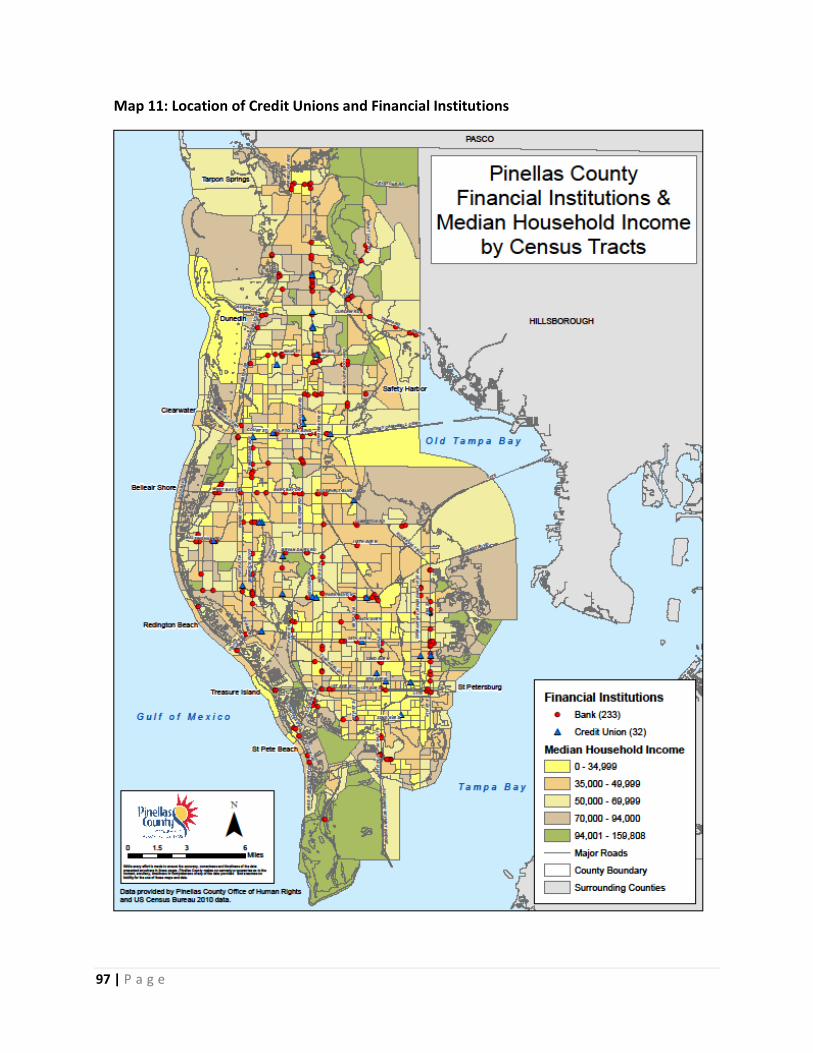
97 | P a g e
Map 11: Location of Credit Unions and Financial Institutions

98 | P a g e
Fair Housing Index
Introduction
The Fair Housing Index combines the effects of nine census tract variables from the 2013
American Community Survey (ACS) 5-Year estimates with the ratio of loan denials to
originations from the Home Mortgage Disclosure Act (HMDA) database. The variables were
standardized, summed, and the mean was used to classify census tracts by relative risk of
impediments to fair housing choice. A map of the spatial distribution of risk provides an
indication of where residents may experience various levels of housing discrimination or have
problems finding affordable, appropriate housing.
Methodology
Data for nine variables were downloaded by 2010 census tract via the US Census Bureau’s
American FactFinder. The variables included were: percent minority (XMinority), percent
female-headed households with children (FHHchild), median housing value (MedHous),
median contract rent (MedRent), percent of the housing stock constructed prior to 1960
(P1960), median household income (MedHHI), percent of the population with less than a high
school degree (LessHS), percent of the workforce unemployed (Unemploy), percent of the
workforce dependent upon public transportation to go to and from work (PTrans). The ratio
of loan denials to loan originations (DenOrg) for 2012 and 2013 from the HMDA data was also
included. Pearson product-moment correlation coefficients were calculated to examine the
association between the variables (see Table 16).
After examining the association between the variables, each variable was standardized by
calculating a z-score for each variable. This converts all variables to the same unit of
measure (i.e., standard deviations from the mean) to allow for mathematical manipulations
of the variables. Each variable was then weighted, either positively or negatively, so the
sum of variables at each census tract yielded a z-score reflecting the cumulative effect of
negative factors. For example, in a fair housing environment, high minority concentrations
raise suspicions that there may be problems relative to housing conditions and housing
choices in the area based on correlations (r=0.64, p<.01) between percent of minorities and
the ratio of loan denials to originations. Therefore, the percent minority variable would be
given a positive value. Conversely, in areas of high median housing values, residents are less
likely to have problems with fair housing choice (r=-0.28, p<.01). Median housing value,
therefore, would be assigned a positive value. The mean of the standardized variables
provided a means of identifying individual census tracts where fair housing choice is at higher
risk due to factors most often associated with housing discrimination. With the data presented
99 | P a g e
in standardized form, the results can be compared to the standard normal distribution,
represented by a bell curve with a mean of 0 and a standard deviation of 1. The results are
summarized in the following section.
It should be emphasized that the data used to perform this analysis do not directly reflect
fair housing violations. The data does provide, however, a measure of potential problems
based on concentrations of s o c io - e c o n o m i c groups who most often experience
restrictions to fair housing choice. Areas identified as having extreme problems are those
where there is a high concentration of minorities, female-headed households,
unemployment, high school dropouts, low property values, and, most likely, are areas where
a large proportion of loans (conventional home mortgages, FHA or VA home mortgages,
refinance, or home improvement) have been denied.
Findings
In Table 17, several correlations are worth noting. The following classification was used to
characterize the correlations: r = 0.70 or higher = very strong relationship; 0.40 to 0.69 = strong
relationship; 0.30 to 0.39 = moderate relationship; 0.20 to 0.29 = weak relationship and 0.01
to 0.19 = negligible relationship. Classification of correlations in this manner is useful; however,
it is somewhat subjective.
There were strong correlations between percentage minority and the percentage
unemployment, the percentage of female headed households with children, and percentage
using public transportation, with correlations of 0.44, 0.56 and 0.46 (p<01) respectively. This
means that minority communities had higher unemployment, higher number of female-
headed households with children and greater reliance on public transportation to get to work
than communities with lower concentrations of minorities. The percent minority had a
moderate negative correlations with median household income (r=-0.38, p<01), median rent
(r=-0.32, p<.01) and median house value (r=-0.30, p<>.01). The percentage of female headed
households with children had a strong negative correlation with median household income (-
0.46, p<01) and median housing value (r=-0.40. p<.01), with a moderate negative relationships
with median contract rent (r=-0.30. p<.01). This indicates that minorities and single mothers
tend to earn lower incomes and live in lower valued housing. The loan origination variable, the
ratio of denials to originations for all loan types, has a strong negative correlation to household
income (-0.40; p<.01). This means that in areas with lower household incomes, there is a
higher rate of denial compared with origination.
As indicated on Map 12, there are a greater number of higher risk census tracts concentrated
in the southeastern census tracts of the Pinellas County, within the City of St. Petersburg. There

100 | P a g e
are some higher risk areas in Clearwater, Lealman, High Point and the central part of the
County. These areas of concern are characterized by older, lower housing values and rents,
and are primarily occupied by minority households that have higher percentages of households
headed by females with children than other areas of the County. There is also a higher than
average unemployment rate and lower than average level of educational attainment.
Table 17: Correlation Matrix for Variables Included in Fair Housing Index
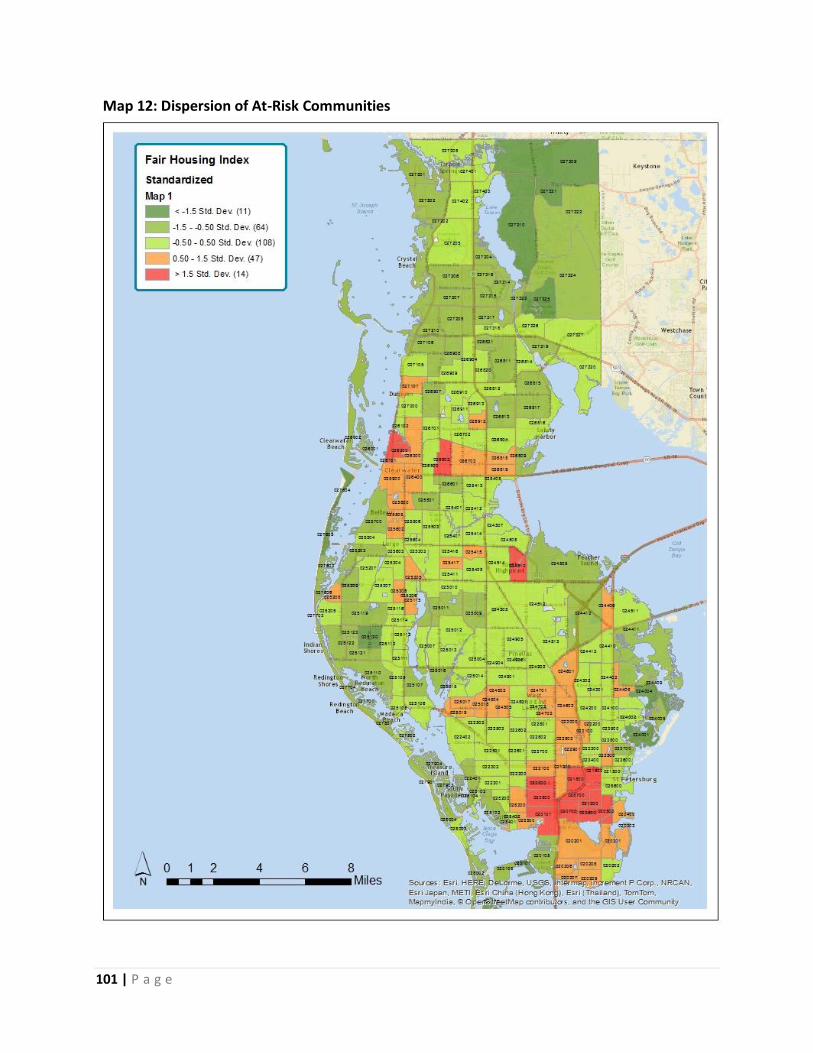
101 | P a g e
Map 12: Dispersion of At-Risk Communities
102 | P a g e
Impediments to Fair Housing and Recommendations
This section utilizes the previously analyzed and discussed data to identify and discuss the
impediments to fair housing choice. By synthesizing the information gathered, several
impediments to fair housing choice in Pinellas County are evident. These impediments, along
with the reasoning process, are described along with policy recommendations proposed by
County and City staff are meant to address these issues directly.
Impediment: Areas of Discrimination
Discrimination as an impediment is evidenced through a few of the data sources and is
experienced by a variety of protected class members.
A. Discrimination with regard to home mortgage loans.
Based on the Home Mortgage Disclosure Act (HMDA) data, the loan origination rate for
applicants who are White is significantly higher than the loan origination rate for applicants who
are non-White. No matter the type of loan, White origination rates are consistently higher than
minorities. There is also evidence in the HMDA data to suggest that certain characteristics of
redlining may be occurring in Pinellas County. Evidence shows that origination rates are
influenced by location and value assigned to the property more so than the credit worthiness of
the buyer. As the tract income increases, the origination rates of all the income groups increase.
Due to the low number of applications in lower income tracts, a conclusive determination of
redlining is not possible.
Recommendations
● Allocate County and City resources to examine and understand the reasoning for lower
loan origination rates for minority groups as well as high income in a lower income tract.
● Allocate County and City resources to sustain and expand awareness of homebuyer
opportunities to those in protected classes.
● Develop outreach program to educate financial institutions about housing opportunities
and credit counseling assistance to low- and moderate-income households.
● Allocate County and City resources to perform Fair Housing Rental and Mortgage Lending
Testing.
B. Discrimination of nationally and locally protected classes.
Based on the fair housing complaint data from October 2011 to June 2015, housing discrimination
practices are an ongoing problem in Pinellas County. Complaints related to all nationally
103 | P a g e
protected classes have been filed at the Pinellas County Office of Human Rights. Of the two
locally protected classes - sexual orientation and gender identity - the Pinellas County Office of
Human Rights has had complaints filed based on sexual orientation. Discrimination in Pinellas
County includes: denial of reasonable accommodation, imposition of different terms and
conditions, harassment, refusal to rent, discriminatory advertising, denial of availability, making
housing otherwise unavailable, refusal to sell, steering, denial of a reasonable modification,
discriminatory financing, and discriminatory zoning.
Both Pinellas County and the City of St. Petersburg have each created committees related to
issues faced by persons with disabilities. The City of St. Petersburg’s Committee to Advocate for
Persons with Impairments (CAPI) is a group of residents appointed by the Mayor to advise City
Council on issues and to advocate on behalf of persons with disabilities. In early 2017, the Board
of County Commissioners adopted Ordinance No. 17-10, creating an advisory board, comprised
of board appointees and representatives of non-profit advocacy organizations, to the County
Commissioners for persons with disabilities. The purpose of this advisory board is to help identify
issues of accessibility to facilities, programs, and services, as well as potential instances of
discrimination impacting persons with disabilities.
Recommendations
● Allocate County and City resources, including websites and print material, to sustain and
expand awareness, education, and training opportunities to landlords, property
managers, and Realtors; concerning national and local housing discrimination laws and
policies, with a particular focus in the area of discrimination related to service animals
and special needs.
● Provide information to housing providers regarding their obligations and responsibilities
in the areas of reasonable accommodations for those with disabilities; including home
owners associations and condominium owners associations, and other communal
housing providers.
● Through continued monitoring, continue to ensure that all program participants and
subrecipients and vendors do not discriminate against persons on the grounds of race,
color, national origin, or sex in administering federally administered housing and
community development programs.
C. Competency in Fair Housing Policy
There is evidence to support that discrimination may be a fair housing issue at least in part due
to lack of knowledge of fair housing laws. The survey conducted in conjunction with this analysis
in part assessed the participants’ familiarity with the various provisions of the law. The results
indicated that familiarity in relation to protected classes and, more so, actions covered by the
104 | P a g e
law could use improvement. The data related to complaints filed with the Pinellas County Office
of Human Rights reveals that accommodation for disabilities is the single most cited issue in
housing. This may indicate that this particular aspect of fair housing law is not as universally
known as, for example, protections for the various classes. Another aspect related to this issue is
regarding the population with Limited English Proficiency. As discussed, over 5 percent of Pinellas
County’s population speaks English “less than very well” and 16.4 percent households in which a
language other than English is spoken are below the poverty level (ACS 2013). This points to the
fact that the County and Cities may be failing to reach a portion of residents, even when
jurisdictions do make efforts to expand knowledge of fair housing laws. Due to the language
barrier, some residents for whom housing affordability is an issue may be unaware of their rights
and therefore more likely to become victims of discrimination and less likely to avail themselves
of avenues of recourse.
Recommendations
Continue County and City efforts to proactively offer to persons who are Limited English
Proficient (LEP) the availability of oral interpretation at public meetings and notices in
languages other than English. Pursuant to Title VI of the Civil Rights Act of 1964 and
Executive Order 13166 - Improving Access to Services for Persons with Limited English
Proficiency, recipients of Federal financial assistance must ensure that their programs and
activities normally provided in English are accessible to LEP persons and thus do not
discriminate on the basis of national origin in violation of Title VI's prohibition against
national origin discrimination.
Continue to offer Homebuyer Classes and Counseling in Spanish.
Continue to ensure that all Fair Housing Marketing Plans and publications contain
information advising persons of their rights under the Fair Housing Act; including the right
to relocate to residences in the areas of non-minority concentration at their option; and
referrals for minority persons to comparable and suitable decent, safe and sanitary
replacement dwellings not located in areas of minority concentration.
Impediment: Areas of Limited Opportunity
One of the other impediments to fair housing identifiable via the analysis is the County’s and City
of St. Petersburg’s and City of Clearwater’s areas of limited opportunity. In essence, certain
portions of the County and the Cities have a variety of factors which preclude residents from
being able to fully and freely choose housing options.
A. Transportation-Burdened Areas
105 | P a g e
In relation to highly concentrated areas of public housing and poverty, the East Tarpon Springs
appears to be somewhat underserved with three north-south bus routes; one runs once per
hour starting its first stop in Tarpon Springs at 9:00 a.m. along Alternate Route 19 (Jolley Trolley),
one route is a limited stop route along Alternate Route 19 with an east-west segment along Dr.
Martin Luther King Jr. Drive (Route 66 Limited Stop), providing a morning and afternoon trip
from Tarpon Springs to downtown Clearwater and a morning and afternoon trip from Tarpon
Springs to Morton Plant Hospital in Clearwater, and the third bus route runs between 35 and 45
minutes along U.S. Route 19 (Route 19) with an east-west segment along Tarpon Avenue.
Hotels located in Clearwater Beach and St. Pete Beach complement the existing bus schedules
with private shuttles and adjusted work schedules for housekeeping and other service
personnel. Clearwater Ferry now operates daily service beginning at 6:00 a.m. to 10:00 p.m.
(with expanded hours during peak seasons or events) between downtown Clearwater and the
Clearwater Beach Marina.
Recommendations:
Encourage efforts with Pinellas Suncoast Transportation Authority for alternative
transportation modes, additional routes, and longer service times for existing routes in
underserved areas.
B. Income Barriers
Employment opportunities and income have a significant impact on housing affordability and
housing choice of residents. During the period 2009-2013, following the recession, the
unemployment rate for Pinellas County was 10.2 percent or 46,881 of the civilian workforce;
Africans Americans experienced an unemployment rate of 15.6 percent. Also as outlined in the
Fair Housing Index, African American, female-head-of-householders who rely on public
transportation tend to earn lower incomes and live in lower valued housing, and as a socio-
economic group are likely to experience restrictions to fair housing. Additionally, of the
mortgage loans originated, the low income category (50-80% area median income) had a lower
success rate than of the moderate income category (80-120% area median income).
Develop outreach program, in conjunction with childcare and transportation service
providers, to identify specific areas of opportunity to improve access to these services.
Continue to work with non-profits, educators and hiring professionals to ensure job
readiness and training providers sponsor instructional classes and job fairs in African
American communities.
Continue to advocate and partner with developers to entice businesses to the area that
provide new employment opportunities that match educational levels of the community.

106 | P a g e
Continue to ensure that all vendors and contractors and employees paid with State and
Federal funds are contractually obligated to affirmatively assure that minority business
and women’s business enterprises have an equal opportunity to compete for contracts,
subcontracts, sources of supplies, equipment, construction and services.
Continue to ensure that all project sponsors, vendors and contractors assure equal
employment opportunity to all persons regardless of race, color, national origin, sex or
disability for its CDBG-fund subrecipients.
Allocate resources to research the reasons for lower loan origination rates in the
moderate income category to adjust programmatic income requirements to provide
access to funds for this group.
Impediment: Condition of Housing Stock
The housing stock in Pinellas County is fairly old with almost 60% of both owner housing and
renter housing is over 35 years old; as a result of age, this housing becomes functionally obsolete
in terms of layout, size, insulation, energy efficiency and electrical connectivity.
A. Age of Housing Stock
If renovations or maintenance to older homes is not performed, especially in low income areas
due to cost, it is likely that owned homes will turn to rental units and eventually decline to create
more slum and blighted communities.
Continue providing affordable housing units for rent or home ownership through the use
of Federal CDBG, HOME, ESG and NSP funds, State SHIP funds and local Housing Trust
Funds. Current priorities include acquisition, construction and/or rehabilitation of new
and/or existing owner, rental, homeless and special needs housing.
Continue outreach efforts to affordable housing partners including developers, banking
institutions, employers and others to identify available incentives for building new
affordable units.
Continue work in target areas to build new, affordable single family homes.
B. Access to Home Improvement Loans
Home Improvement loans have the lowest application and origination rate of the three loan
purposes examined in this report, yet the condition of the housing stock is older than the national
median average, and the majority of owner occupied housing is only two bedrooms.
Research and develop programs that improve access and approval rates with private
sector loans used for home improvement.

107 | P a g e
Increase homeowner awareness of single-family rehabilitation programs, including
grants, and zero- and low-interest loans for low-moderate income households.