Pilot Testing of a Membrane System for Post … Library/Research/Coal...2 Outline • Project...
72
Pilot Testing of a Membrane System for Post-Combustion CO 2 Capture DE-FE0005795 Brice Freeman, Jay Kniep, Tim Merkel - MTR Hamid Farzan – B&W Final project review meeting August 24, 2016
Transcript of Pilot Testing of a Membrane System for Post … Library/Research/Coal...2 Outline • Project...

Pilot Testing of a Membrane System for Post-Combustion CO2 Capture
DE-FE0005795
Brice Freeman, Jay Kniep, Tim Merkel - MTR
Hamid Farzan – B&W
Final project review meeting August 24, 2016

2
Outline
• Project overview and background • Membrane and module development / cost reduction • 1 TPD field testing at NCCC • 20 TPD design, installation and operation • B&W CO2-enriched air boiler study and testing • Techno-economic analysis • Conclusions and recommendations • B&W integrated test update (project DE-FE26414) • Industrial CO2 capture update

Project Overview
3
Award name: Pilot testing of a membrane system for post-combustion CO2 capture Project period: 10/1/10 to 9/30/15 Funding: $15 million DOE; $3.75 million MTR DOE program manager: Jose Figueroa Participants: MTR, Babcock & Wilcox, SCS/NCCC, EPRI, Vectren, ISTC
Project scope: Demonstrate a membrane process to capture 20 tons of CO2/day (TPD) from a flue gas slipstream of a coal-fired power plant.
Project plan: The key project work organized by budget period was as follows:
• BP1 – Membrane optimization though continued slipstream testing on the 1 TPD system and computational evaluation of sweep recycle with B&W
• BP2 – Design and construction of the 20 ton/day system, boiler testing at B&W with CO2-laden air; membrane/module optimization and durability testing through continued testing on 1 TPD system
• BP3 – Field test of the 20 ton/day system; comparative economic analysis; industrial 1 TPD field test; case study at 20 MW-scale

Background: MTR Development Timeline
Feasibility study (DE-NT43085) • Sweep concept proposed • Polaris membrane conceived
APS Red Hawk NGCC Demo • First Polaris flue gas test • 250 lb/d CO2 used for algae farm
APS Cholla Demo (DE-FE5312) • First Polaris coal flue gas test • 1 TPD CO2 captured (50 kWe)
NCCC 1 MWe Demo (DE-FE5795) • 11,000 hours of 1 TPD system operation • 1 MWe (20 TPD) system operation
2006 2008 2010 2012 2014 2016 2018 2020
TRL6 TRL7 TRL8 TRL5 TRL4
Hybrid Capture (DE-FE13118) • Membrane-solvent hybrids with UT, Austin
Low Pressure Mega Module (DE-FE7553) • Design and build a 500 m2 optimized module
10 MWe Large Pilot
TRL3
B&W Integrated Test

Background: MTR CO2 Capture Process
5
Benefits of selective recycle: • Increases CO2 concentration going to the capture step, and • Reduces the fractional CO2 removal required by the capture step
20% 10%
2%
8%
65%
U.S. Patents 7,964,020 and 8,025,715

• Generating affordable pressure ratio is the key challenge for membranes • Flue gas flow is large, so high CO2 permeance membranes are preferred • Single-stage membrane process will not give high purity and recovery • Impurities in flue gas (SO2, NOx, ash) may damage membranes
Challenges of Post-Combustion Capture with Membranes
Boiler Coal
CO2
Air ESP FGD
Ash
Steam to turbines
Sulfur
• 600 MWe → 500 Nm3/s = 1,540 MMscfd flue gas • 10 – 15% CO2 in N2 = 10,000 ton CO2/day at low pressure
6

7
Advantages of a Membrane Capture Process
• Simple, passive operation with no hazardous chemical handling, emissions, or disposal issues
• Not affected by oxygen, SOx or NOx; co-capture possible
• Water use lower than other technologies (recovers H2O from flue gas)
• No steam use → no modifications to existing boiler/turbines
• Near instantaneous response; high turndown possible
• Very efficient at partial capture (40-60%)

8
Summary of Prior Results
• Process design studies indicate that generating an affordable pressure ratio is the key constraint for membrane post-combustion CO2 capture
• A novel membrane/condensation process design that includes selective recycle to the boiler shows potential to be competitive, but the impact of recycled CO2 on boiler performance is unknown
• A new high-permeance membrane (Polaris) demonstrates stable module performance in short-term field tests (Cholla); however, the new membrane is costly to produce and its lifetime treating flue gas is unknown

9
Membrane/Module Performance Optimization and Cost Reductions
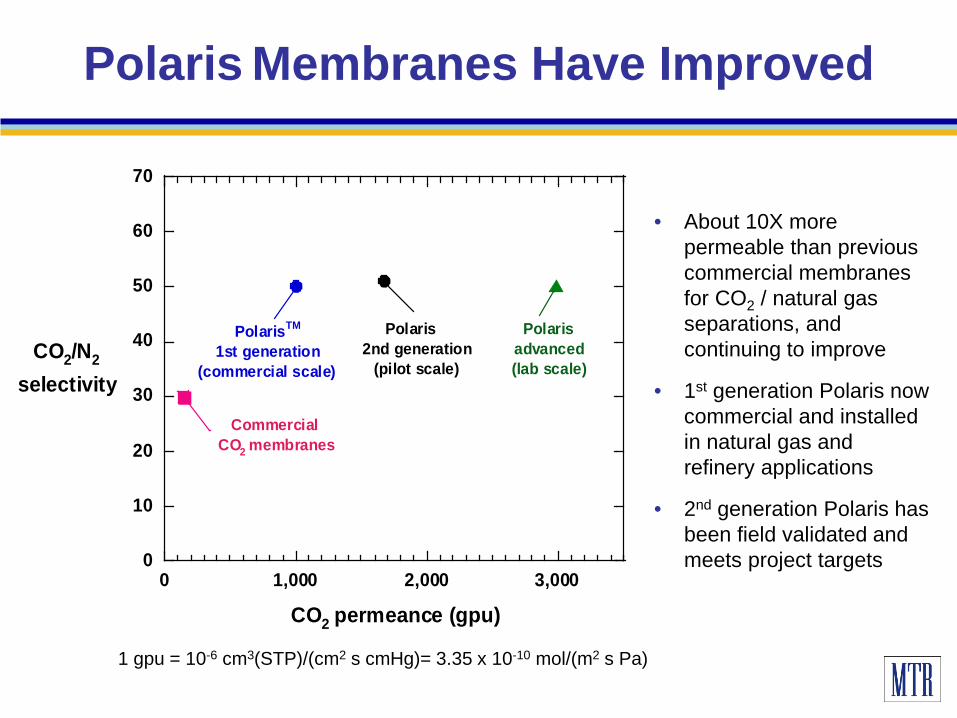
Polaris Membranes Have Improved
0
10
20
30
40
50
60
70
0 1,000 2,000 3,000
CO2/N2
selectivity
CO2 permeance (gpu)
PolarisTM
1st generation(commercial scale)
Commercial CO2 membranes
Polaris2nd generation
(pilot scale)
Polarisadvanced(lab scale)
• About 10X more permeable than previous commercial membranes for CO2 / natural gas separations, and continuing to improve
• 1st generation Polaris now commercial and installed in natural gas and refinery applications
• 2nd generation Polaris has been field validated and meets project targets
1 gpu = 10-6 cm3(STP)/(cm2 s cmHg)= 3.35 x 10⁻¹⁰ mol/(m2 s Pa)

Why is Higher Membrane Permeance Important?
• Higher permeance means less membrane area is required, so system cost is reduced
• For low feed compression cases, membrane costs are a significant fraction of overall system cost
• Membrane permeance also has a direct effect on system footprint – a parameter not explicitly captured by LCOE; Double the permeance → halve the footprint
− High permeance, relatively expensive membrane (say 2,000 gpu and $100/m2) is better than low permeance, cheap membrane (1,000 gpu and $50/m2); Membrane cost will be similar for this example, but high permeance membrane will have a smaller footprint
11

Systems Analysis: Importance of Membrane Improvements
• All calculations were done in BP1 for 90% CO2 capture using Bituminous Baseline report methodology
• Higher permeance (lower cost) membranes are key to approaching DOE goals
• Results are consistent with DOE report “Current and Future Technologies for Power Generation with Post-Combustion Carbon Capture” (DOE/NETL-2012/1557)
12 12
20
40
60
80
100
120
100 1,000 10,000
Changein COE
(%)
Membrane CO 2 permeance (gpu)
1st Generation Polaris
2nd Generation Polaris
MEA (Case 10)
DOE Target
AdvancedPolaris
Assumed membrane cost = $50/m2

Membrane Permeance Limits
• In theory, 1,000 Barrer polymers exist and MTR can coat 0.1 micron selective layers, so 10,000 gpu should be possible
• However, at this high permeance, the support resistance (usually negligible) starts to limit achievable performance;
• For example, if the support is also 10,000 gpu, then this hypothetical 0.1 micron composite membrane would give 5,000 gpu with about half the intrinsic polymer selectivity due to support resistance 13
(0.1-5 µm)
(50-100 µm)
Permeance (gpu) = Permeability (Barrer) / thickness (micron) (i.e., 10,000 gpu = 1,000 Barrer / 0.1 micron)

Casting Machine for Optimized Substrates
14
• Custom research and large-scale casting machines were designed and built to produce better substrates

Polaris Membranes for CO2 Capture
0
10
20
30
40
50
60
70
0 1,000 2,000 3,000
CO2/N2
selectivity
CO2 permeance (gpu)
PolarisTM
1st generation(commercial scale)
Commercial CO2 membranes
Polaris2nd generation
(pilot scale)
Polarisadvanced(lab scale)
• Advanced substrates have allowed Gen2 performance that meets project target, and offers the potential for a 3,000 gpu membrane
• Based on diminishing economic returns and technical complexity of achieving higher permeances (w/o selectivity loss), 3,000 gpu is a good long-term membrane target
1 gpu = 10-6 cm3(STP)/(cm2 s cmHg)= 3.35 x 10⁻¹⁰ mol/(m2 s Pa)

0.1
1
0 20 40 60 80 100 120
CO2 flux
(slpm/m2)
Sweep/feed flow rate (%)
No sweep
Theoretical
Lab data
Field data
Sweep Operation Works in the Lab and the Field
16
• MTR selective recycle process depends on efficient sweep module operation
• Data from lab and field confirms air sweep works
• However, pressure drop on sweep side was too high in early tests (~1 bar/module)

Module Performance Improvements
17
• Various techniques (improved trimming, different envelope configurations, etc) were used to reduce sweep pressure drop in spirals
• However, the long, tortuous flow path on the sweep side of a spiral limits ∆p reduction
• Straight flow path in prototype plate-and-frame modules show pressure drop advantages
• These results led to project DE-FE7553 (results discussed later)
0
5
10
15
20
25
30
2008 2009 2010 2011 2012 2013 2014 2015
Swee
p-si
de p
ress
ure
drop
(psi
)
Year
Spiral-wound modules
Plate-and-frame modules
DE-FE0005795DE-FE0005312

Membrane/Module Cost Reductions
18
• Small coating machine used to optimize membrane formulation / production method
• Improvements in roll-to-roll production reduced materials and labor costs by about 15%
(a) (b) • Use of plastic module components reduces costs by another 20%
• Validation tested at NCCC

Membrane/Module Cost Reductions
19
• Initial production automation, such as module trimming machine, reduce costs 5%
• Also, reduced module pressure drop
• Multi-tube bundled modules reduce installed cost by ~20%
• Tested on 20 TPD unit at NCCC

Pathway to $50/m2
20
• In total, improvements made in this project converted Polaris from a high-cost, prototype membrane ($500/m2) to a commercial roll-to-roll product with module costs of ~$200/m2
• Potential future optimizations give a pathway to $50/m2:
Cost Savings Category
Modification Potential Savings ($/m2)
Membrane and module manufacturing
• Increase membrane roll size from 300 to 900 meters. • Automated module envelope assembly and glue
application. • Dedicated module production line.
$15
$35 $20
Skid design • Impact of 12” (30.5 cm)-diameter modules on skid. • FRP manifolds, housings, and components.
$30 $50
Total Potential Savings ~$150

21
1 TPD Field Tests at NCCC

22
1 TPD Field Testing at NCCC
• 1 TPD system at the National Carbon Capture Center (NCCC) is a valuable field laboratory
• Allows membrane lifetime evaluation and validation testing of new membranes with real coal flue gas
• System tested vacuum and air sweep membrane steps
• Sized to capture 1 ton CO2/day using commercial sized module
• System started operation in spring 2012, and accumulated over 11,000 hours of operation before fall 2015 shutdown

1 TPD Skid Layout
1
5
4 3 2 1.Pretreatment
and flue gas compressor
2. Chiller (not used)
3. Two-step Membrane Modules
4. Vacuum Pump 5. Sweep-air Compressor

Sample 1 TPD Results from NCCC
24
New membrane validation Capture rate vs time
System allows more rapid materials optimization through real world testing 24
0
10
20
30
40
50
0 5 10 15 20 25 30 35 40
Mod
ule
CO
2 rem
oval
rate
(lb/
h)
Cumulative run time (h)
2nd generation Polaris
1st generation Polaris
0
20
40
60
80
100
0 100 200 300 400 500 600
Cap
ture
rate
(%)
Cumulative run time (h)

Correlation of CO2 Purity and Capture Rate With Temperature
25
0
20
40
60
80
100
30 40 50 60 70 80
CO
2 per
mea
te c
once
ntra
tion
(%)
Operating temperature (oF)
Higher temperatures yield higher gas permeances, leading to greater CO2 capture, but at lower purity; useful information for future system design.
CO2 concentration Capture rate
0
20
40
60
80
100
30 40 50 60 70 80
CO
2 cap
ture
rate
(%)
Operating temperature (oF)

Example of Lessons Learned on the 1 TPD System
2
• In July 2012, teflon-coated dry screw feed compressor failed due to extensive deposition of water soluble sulfur salts (ammonium sulfate/bisulfate, iron sulfate)
• These salts were occasionally created in SCR/FGD operation upstream of the membrane, and were present as aerosols in the flue gas fed to the system
• To minimize potential downtime, a more solids-tolerant liquid ring compressor was used for the remainder of testing
Material dissolved in water 26 Motor element showing deposition

1 TPD System: Lessons Learned
2
27
• After compressor failure, system continued operating with vacuum only until Sept 2012
• Membranes showed stable performance during this time
• After shutdown at end of Sept, it was found that condensed water with dissolved sulfate salts collect on surface of membrane, and resulted in low CO2 flux
• To prevent future occurrence, system shutdown procedure changes were made; no subsequent issues
Membrane
Feed spacer
Flue gas flow direction

1 TPD System Summary
2
28
• A field laboratory dedicated to flue gas membrane and module optimization is highly valuable to evaluate new materials under real world conditions
• At NCCC, over 11,000 total hours of operation for 1 TPD system (about 10,000 on coal flue gas)
• The 1 TPD system has been decommissioned and is now in storage at NCCC
• We are evaluating possible future test sites for this system

29
20 TPD Small Pilot Design, Installation and Operation

30
Small Pilot System Design
Like the 1 TPD unit, the small pilot system was designed for slipstream operation (no CO2 recycle) at NCCC

Small Pilot Uses Modules Designed for Low-Pressure Operation
1 TPD
20 TPD
20 TPD
Module type demonstrated on:
Gen 1: for high pressure applications
Gen 2: for use on vacuum capture step
Gen 2b: for use on sweep recycle step
31

Small Pilot GA Drawing
• 20 TPD skid (1 MWe) was designed by MTR, assembled by a fabricator in Houston, and installed at NCCC in 2014
• Main test objective was validation of advanced modules (multi-tube and plate-and-frame) designed for low pressure drop and small footprint
Membrane vessels
Vacuum pump
Air sweep blower

33
Small Pilot System at Fabricator
2nd floor under construction
Photo courtesy of Tony Wu
1st floor of system at shop
Membranes are a modular technology; skids can be pre-assembled offsite to minimize installation costs

34
Installation of 20 TPD Small Pilot at NCCC
Crane lowering 2nd floor of system into place
Photo courtesy of Tony Wu
1st floor of system arriving by truck
Photos courtesy of Tony Wu

35
• MTR pilot system completed successful 6 months of operation at NCCC in June 2015
• Currently, system is being installed at B&W for an integrated boiler test
• Membranes are simple and compact compared to competing technologies, such as amines (see columns in photo)
20 TPD System at NCCC

20 TPD PO-3 System Performance
• Stable capture rate averaging 87%
• Flue gas run time during PO-3 ≈ 1,000 hours
• First field operation of plate and frame sweep modules
• Cold start to steady state operation ≈ 15 minutes
36
PO-3 run time (hours)
CO2 capture
rate (%)
Cooling water / flue gas outage
Increasing flowrate
Figure data from NCCC campaign PO3 (May to July 2015)

System Tests Scaled-Up Membrane Modules
37
Advanced modules demonstrate lower cost and pressure drop
Bundled spiral sweep modules
Bundled Polaris spirals
Polaris plate-and-frame (designed in DE-NT7553)

Module Skids Size Comparison
38
20 TPD Skid Plate-and-Frame Sweep Module
Large plate-and-frame module can achieve higher packing density while minimizing pressure drop

New Modules Demonstrate Improved Pressure Drop Performance
39
0
0.5
1
1.5
2
2.5
3
3.5
4
900 1,000 1,100 1,200 1,300 1,400 1,500 1,600
Sweep-sidepressure dop
(psi)
Sweep flowrate (lb/h)
Spiral with flue gas
Plate-and-framewith flue gas
Plate-and-framelab data
• Field data is consistent with lab results, and confirms much lower air sweep pressure drop in new modules
• At full scale, the difference in pressure drop amounts to savings of about 10 MWe

20 TPD System Summary
40
• Small pilot system was successfully designed, built and installed at NCCC
• System operated for two campaigns during 2015 • After some initial issues due to cold weather (freezing water
supply lines and valve damage), the system ran smoothly averaging ~87% capture
• Parametric studies show the benefits of the new plate-and-frame module with regard to low pressure drop
• System has been decommissioned at NCCC and moved to B&W for integrated boiler testing under project DE-FE26414

41
Boiler Operation with CO2-Laden Air

Impact of CO2 Recycle on Boiler Performance
Phase I (BP1) – CFD modeling • B&W modeled 2 boiler configurations (radiant boiler firing bituminous coal
and SWUP firing PRB coal) and 2 sweep recycle cases (constant secondary air flow and constant stoichiometry)
• Main conclusion of modeling study: secondary air laden with CO2 appears feasible as a retrofit in either of the boiler configurations examined if oxygen mass flow to boiler is fixed
Phase II (BP2) – Pilot testing • B&W’s SBS-II 1.8 MWth pilot boiler operated with CO2-laden combustion air
• Two coals evaluated: a western sub-bituminous coal and a high volatile bituminous coal
• O2 content of windbox air varied from 21% to 16% through CO2 dilution
• Monitored flame stability, length, and shape; unburned combustibles in fly ash, and furnace exit gas temperature
• Radiant furnace and convective pass heat absorptions were measured
• Boiler efficiencies for air and sweep firing being determined 42 42

© 2016 The Babcock & Wilcox Company. All rights reserved. Proprietary and Confidential .43
Technology background
PC
Boiler
Steam
Primary Oxidant
Secondary Oxidant
Burners
Air (21% O2)
Air
FGD
Syst
em
> PM Control
Heat
er
>
> Generator
Coal
Turbine
Flue Gas
Stac
k
CO2 to Storage
Vent
Compression/Fractionation
CO2
Primary CO2 capture step
CO2
>
Selective CO2 recycle step
CO2 Depleted Flue Gas
18% O2, 8% CO2
3% O2, 20% CO2
Benefits • Particularly well suited for partial capture (40-60%) • No hazardous chemical handling, emissions, or disposal
issues • Water use lower than other technologies (recovers H2O
from flue gas) Challenges • Module pressure drop and flow distribution issues

© 2016 The Babcock & Wilcox Company. All rights reserved. Proprietary and Confidential .44
Experimental Study
Liquid CO2tank – 6 toncapacity with only 3 ton useful limit
Furnace
Conv
ectio
n Pa
ss
Trim Heater
WFG
D
Stac
k
CHX
Air H
eate
r
Flue
Gas
Coo
ler
Air Heater
AshWater
Primary Air
Secondary Air
Coal Feeder
Flue Gas
ID Fan
Booster Fan
CoolingAir
Vent Air
Cooling Fan
Overfireair
PrimaryFan
Flue
Gas
H2O
CO, CO2, TNOX, O2,Fly ash (LOI)
Bagh
ouse
90 kW Evaporator100-2000 lb/hrNewly installed
Actuator
T,P
T,P
T
T,P
Burner
m.
SecondaryFan
FGET
m.
m.
m.
m.
CO2%
O2%
CO2
PA
SA+CO2
Coal flow
m.
Flame T
Flame Length
O2%
O2%
O2%
SO2,O2
H2O= Valve = Flowmeter = in situ sensors = ex situ analyzers m. = Quantitative flow measurementO2 CO2
PA = Primary Air SA = Secondary Air
m. H2O m. H2O
m.
OrificemeterFlow
control
B&W’s SBS-II 1.8 MWth pilot boiler operated with CO2-laden combustion air
Two coals evaluated: a western
sub-bituminous coal and a high volatile eastern bituminous coal
O2 content of windbox air varied
from 21% to 16% through CO2 dilution
Monitored flame stability,
length, and shape; unburned combustibles in fly ash, and furnace exit gas temperature
Radiant furnace and convective
pass heat absorptions were measured
Boiler efficiencies for air and
sweep firing were determined

© 2016 The Babcock & Wilcox Company. All rights reserved. Proprietary and Confidential .45
Results
Flame image from combustion of PRB coal with air (21% O2)
Flame image from combustion of PRB coal with CO2-enriched air (18% O2)
Flame Characteristics • CO2-enriched flames were more
stable and flared but less luminous than flames witnessed under air-fired tests
• CO2 addition did improve flame stability but flame appeared cooler than air-fired flame
0
5
10
15
20
25
21 20 19 18 17 16
CO
, ppm
Windbox O2, %
BSR 0.8 BSR 0.9
0.12
0.13
0.14
0.15
0.16
0.17
21 20 19 18 17 16
NO
x, lb
/MB
tu
Windbox O2, %
BSR 0.8 BSR 0.9
0.16
0.18
0.2
0.22
0.24
12.0
14.0
16.0
18.0
20.0
22.0
24.0
15 16 17 18 19 20 21
NO
x, lb
/MB
tu
CO
, ppm
Windbox % O2
CO NOx
CO and NOx emissions data for air fired and CO2-enriched air fired tests for PRB coal
CO and NOx emissions data for air fired and CO2-enriched air fired tests for bituminous coal
PRB Tests • Data collected under different burner hardware settings depending on CO2 flow
rate to the system - could not make substantial conclusions • Technology has a moderate effect on both NOx emissions and CO emissions. Bituminous Tests • Same burner settings were used • CO levels pass increased while NOx emissions decreased

© 2016 The Babcock & Wilcox Company. All rights reserved. Proprietary and Confidential .46
Results - Continued
1950
2050
2150
2250
2350
15 16 17 18 19 20 21
FEGT
(°F)
Windbox O2 %
PRB 0.9 BSR PRB 0.8 BSR Bituminous 0.8 BSR
0
10
20
30
40
50
Furnace Convection pass Airheater Flue gas
% o
f hea
t inp
ut
Air-fired CO2 enriched air
FEGT variation with windbox O2 level
Comparison of heat absorption between air-fired and CO2-enriched combustion of PRB coal
Furnace Exit Gas Temperature (FEGT) • High value – Concerns of slagging Low value – Concerns about reaching super-heated steam
conditions • Higher FEGT values for PRB coal tests than bituminous coal tests -
Possible from a hotter flame for bituminous coal resulting in higher heat transfer in the radiant furnace
Boiler Heat Absorption and Heat Flux Comparison • Heat absorption in the furnace was highest under both firing
conditions • Slightly higher heat absorption at the convection pass for the CO2-
enriched air tests - increase mainly from a higher mass flow of flue gas
• Air heater absorption and flue gas heat loss were also higher for CO2-enriched tests
Boiler Thermal Efficiency • Compare efficiency for air-fired and CO2-enriched air (18%) tests • Based on heat absorption data, the net difference in efficiency (as a
result of CO2 addition) was 1.9%.
• Based on flue gas temperatures at the air heater outlet, the net difference in efficiency a little over 2%
• Above numbers translate to a net efficiency drop of 0.75 % (For a supercritical boiler with a nominal net plant efficiency of 39.4%)
0
1
2
3
4
17 18 19 20 21
% ɳ
loss
Windbox O2 %
Based on flue gas enthalpy calculations Based on boiler absorption & water heat flow rates
Boiler thermal efficiency loss as a result of CO2 addition to combustion air at various windbox O2%

© 2016 The Babcock & Wilcox Company. All rights reserved. Proprietary and Confidential .47
Conclusions Stable and attached flames were observed for the combustion of both
bituminous and sub-bituminous coals at windbox oxygen levels varying from 21 to 16%, by volume. For the same burner configuration and vane settings, NOx decreased
with decreasing windbox oxygen from 21 to 16%. CO, on the other hand, showed a contrasting trend, increasing slightly from 16 to 22 ppm. Burner windbox oxygen of 18% was judged to be optimum for the
following reasons: - Good flame stability - Windbox pressure drop < 6 in. w.g. (1.5 kPa) - Helps minimize NOx and CO emissions - Minimal increase in unburned carbon for the bituminous coal - Minimizes the impact of tube erosion, abrasion and slagging - Provides an optimal CO2 flow for efficient membrane operation - Results in thermal efficiency loss of less than 2%

© 2016 The Babcock & Wilcox Company. All rights reserved. Proprietary and Confidential .48
Path Forward Integrated operation of MTRs
membrane capture system with B&Ws SBS facility
- Conduct parametric studies to validate performance of boiler with varying sweep flowrates - Test parameters include sweep air flow rate, sweep air O2 concentrations, CO2 concentrations and capture rate
Understanding how the various membrane parameters impact performance of a dynamic, integrated system is key to reduce future risk
Integrated tests will help clarify the best design for partial (~40%) capture where a simple system without recycle may be preferable

49
Techno-economic Analysis

• MTR process has been subjected to several previous TEAs (DE-FE5312 project and DOE/NETL-2012/1557, for example). General consensus is MTR process is competitive and may offer cost advantages at nth plant
• In this program, MTR worked with WP to estimate costs for a conceptual full-scale membrane capture system; EPRI used these costs to calculate cost of electricity and capture costs
• Impact of CO2 recycle on boiler performance calculated by B&W was incorporated into the analysis
• MTR extended EPRI/WP analysis to examine the effect of capture rate on costs
TEA Background

EPRI/WP Study: Energy and Emissions
51
Performance BBS Case 11 (No CO2 Capture)
BBS Case 12 (MEA)
MTR Membrane
Gross power output, MWe 580.0 662.8 780.8 Auxiliary power requirements, MWe (balance of plant) 30.4 65.5 186.5
Auxiliary power requirements, MWe (capture system) 0 47.3 40.8
Auxiliary power requirements, MWe (total) 30.4 112.8 227.3
Net power output, MWe 559.0 550.0 553.5 Net plant HHV efficiency (%) 39.3 28.4 28.6 CO2 generated (tonne/h) 440.3 608.1 608.4 Capture efficiency (%) 0 90.2 89.9 CO2 emitted (tonne/h) 440.3 59.7 61.2 CO2 captured (tonne/h) 0 548.4 547.2 CO2 emissions (kg/MWh net) 801 109 111 Energy used per tonne CO2 captured (kWh/tonne CO2)
0 382 358

EPRI/WP Study: Cost of Capture
52
Cost BBS Case 11 (No CO2 Capture)
BBS Case 12 (MEA)
MTR Membrane
Cost of electricity components ($/MWhnet)
- - -
Fuel 25.5 35.3 35.1 Variable O&M 7.7 13.2 11.3 Fixed O&M 9.5 15.7 15.3 Capital 38.2 73.1 70.7
Total COE ($/MWhnet) 80.9 137.3 132.3 Increase in COE compared to Case 11 (%) - 70 64
Cost of CO2 captured ($/tonne) - 56.5 52.0
• At 90% capture, the MTR process shows modest improvements compared to the base case amine process

Systems Analysis: Membranes are Particularly Effective at Partial Capture
53
• Membranes show a minimum in capture cost
• To meet proposed U.S. EPA emission limits for coal (~30% capture), a simple system without recycle may be preferable
30
40
50
60
70
0 20 40 60 80 100CO2 capture rate (%)
Cost ofCO2 captured
($/tonne)
Single-step process, no recycle
Two-step process with CO2 recycle
DOE target

MTR Membrane Process Uses Less Water
54
In addition, the membrane harvests 40,000 kg water/h from flue gas; stack gas contains 85% less water than when an amine process is used

55
Conclusions and Recommendations

• A Gen-1 Polaris membrane accumulated over 11,000 hours of operation at NCCC, providing valuable membrane lifetime information.
• A Gen-2 Polaris membrane (1,700 gpu) with performance exceeding project targets was scaled up and validation tested at NCCC. An advanced Polaris membrane (3,000 gpu) was developed at lab scale.
• Membrane module production costs were cut by 60% to $200/m2, meeting project targets and showing a pathway to eventual commercialization cost goals ($50/m2).
• A 20 TPD small pilot system was designed, built, and successfully tested for >1000 hours at NCCC
• A new plate-and-frame sweep module was tested on the 20 TPD system and showed >4 times lower sweep-side pressure drop compared to spiral modules. This improvement will save ~10 MWe of blower energy at full scale.
Summary of Accomplishments

• CFD modeling and pilot boiler testing at B&W confirmed the viability of selective CO2 recycle sweep operation. The impact of recycled CO2 on boiler efficiency was quantified (~0.75% efficiency loss)
• The project TEA shows that the capture cost at 90% capture for the MTR process ($52/tonne) is competitive with the baseline solvent approach ($56.5/tonne). A sensitivity study indicates membranes show a minimum capture cost around $35/tonne at partial capture (40-60%).
• A water consumption analysis indicates that the MTR membrane process uses about 18% less water than the base case MEA process. In addition, the vent gas from a membrane system contains 85% less water than the flue gas vent from the MEA case, and this additional recovered water may find beneficial reuse within the plant.
• A 1 TPD industrial CO2 capture unit was designed, built, and installed at a waste-to-methanol plant in Alberta. Operation has been delayed until 2017
Summary of Accomplishments

• Conduct integrated boiler/membrane testing (underway) • Continue pathway to $50/m2 membrane/module cost reductions • Importance of 3,000 gpu: continue development to bring
advanced lab membranes to commercial roll-to-roll production • Opportunities for low cost compression/vacuum – recent
Trimetric study revealed a range of compression options/costs, while WP TEA uses relatively high values. it is worthwhile to further investigate cost reduction possibilities
• Focus future TEAs on comparative costs at EPA targets • Evaluate beneficial uses for recovered flue gas water • Selective exhaust gas recycle for natural gas CO2 capture has
received positive feedback from literature, but no organized study
Recommendations

Next Steps: Integrated Testing at B&W Research Facility
59
May June

MTR Small Pilot at B&W in June 2016
60 System installed at a 1 MW boiler in Ohio; will test
integrated operation in fall 2016

• Electrical and piping infrastructure installation – June/July
• Membrane skids installation and shakedown – June/July
• Boiler/Membrane skids integrated commissioning – August
• Integrated Boiler/Membrane skids testing – September to October
Integrated Membrane/Boiler Test Schedule
61

62
Industrial CO2 Capture

• MTR identified an industrial capture opportunity at an Enerkem waste-to-chemicals facility in Alberta
• Plan is to test high selectivity Polaris modules and H2-selective Proteus modules to capture CO2 and improve chemical production efficiency; skid is approximately 1 TPD scale
• Skid design and construction completed in early 2015; original plan was to complete testing by Oct 2015
• However, while installation is finished, startup has been delayed by numerous site delays related to syngas supply; now projected to start testing in fall 2016
• Post Paris COP21, numerous inquires on industrial capture
Industrial Capture Background

MTR CONFIDENTIAL
GA Drawings of Industrial Capture Skid
64 MTR CONFIDENTIAL
Top View
Side View Front View
Proteus Vessel
Polaris Vessel
Proteus Feed
Polaris Residue/Permeate
to MPC
Proteus Residue/Permeate
to TOx
Proteus Heater
Polaris Feed from MPC

65
Industrial CO2 Capture at Advanced Energy Research Facility in Alberta
Module installation Skid installed in July, 2015
• Jointly funded by DOE and Alberta Innovates, system will test Proteus and Polaris modules within a syngas to chemicals process
• Installation is complete and testing expected to start in fall 2016

Test Plan – Determining Module Performance Windows
• Polaris – One module configuration for Phase 1 tests – Maintain feed pressure (~25 bar) for duration of 1000 h – Obtain steady state performance at 2-3 feed temperatures below 30°C (if
possible): 5°C, 15°C, 25°C (flux vs selectivity tradeoff) – Operate at low and high feed flow conditions at one temperature (purity
vs recovery tradeoff) • Proteus
– Two module configurations for Phase 1 tests (Proteus A and Proteus B) – Maintain feed pressure (~63 bar) for duration of 1000 h – Obtain steady state performance at 2-3 feed temperatures: 100°C,
120°C, 135°C (flux vs selectivity tradeoff) – Operate at a low and high feed flow conditions at one temperature
(purity vs recovery tradeoff) 66

U.S. Department of Energy, National Energy Technology Laboratory
– Jose Figueroa
Southern Company Services (NCCC)
Acknowledgements
67 67

68
Extras

Boiler Efficiency Versus Windbox O2
69 69
• Increased CO2 recycle reduces windbox O2 content through dilution, which reduces plant efficiency almost linearly
• However, increased CO2 recycle reduces capture energy; net benefit
• 18% O2 appears to be optimum for retrofit; beyond this point tube erosion, abrasion, and slagging become important
• Because flame is stable to 16% O2, this level of recycle should be further evaluated for new plants
0
0.2
0.4
0.6
0.8
1
1.2
16 17 18 19 20 21 22
Plant efficiency loss (%)
Windbox O2 content (%)

Challenges of CO2 Capture From Natural Gas Power Plants
• Natural gas combined cycle (NGCC) plants use a large excess of air (>150%)
• As a result, NGCC flue gas contains only 3-5% CO2 compared to 10-13% for coal, resulting in higher CO2 capture costs ($/tonne) for gas
• Typically, membranes are not the optimal separation technology for dilute, low-pressure streams; however, creative process designs may allow membranes to play a role in these separations
70

A. T. Evulet et al., Energy Procedia 1, 3809-3816 (2009).
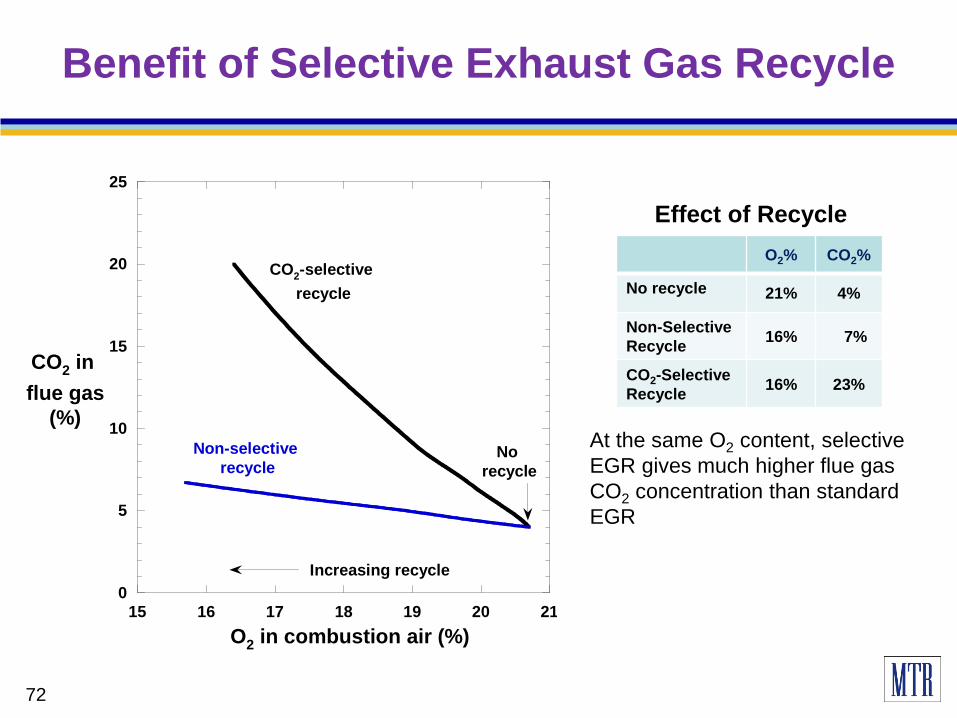
• CO2 concentration increases in the flue gas
• O2 concentration decreases in the combustion air
• Selectively recycle CO2 by using sweep modules
• Avoid dilution of O2 in combustion air with N2 in the flue gas
Selective exhaust gas recycle with a membrane
Selective Exhaust Gas Recycle
Exhaust gas recycle (EGR)
71 Merkel et al., Ind. Eng. Chem. Res., 52, 1150-1159 (2013).
0
5
10
15
20
25
15 16 17 18 19 20 21
CO2 in flue gas
(%)
O2 in combustion air (%)
CO2-selective recycle
Non-selective recycle
No recycle
Increasing recycle
At the same O2 content, selective EGR gives much higher flue gas CO2 concentration than standard EGR
O2% CO2%
No recycle 21% 4%
Non-Selective Recycle 16% 7%
CO2-Selective Recycle 16% 23%
Benefit of Selective Exhaust Gas Recycle
Effect of Recycle
72