Pilot study 3 eport · Mediterraneo della Regione Puglia), associated partner of the OrientGate...
50
eport Adaptation in water and coastal areas in Puglia, Italy Pilot study 3
Transcript of Pilot study 3 eport · Mediterraneo della Regione Puglia), associated partner of the OrientGate...

eport
Adaptation inwater and coastalareas in Puglia, Italy
Pilot study 3

2 2
Contents 1 Introduction 12 Rationale and objectives 33. Pilot area description 43.1 Characteristics, hazards and vulnerabilities 43.2 Status of climate adaptation initiatives in Puglia 64. Methodology description 84.1 Module 1 - Climate projections 114.2 Module 2 - Sea Level projections 114.3 Module 3 - Drought scenarios 114.4 Modules 4 and 5 - Risk assessment for agriculture and coastal areas 115 Results 146 Stakeholder participation 197 Interactions among Thematic Center Pilots 218 Translating results into actions 22
Annex A.1 23Annex A.2 26Annex A.3 31Annex A.4 35Annex A.5 39Annex A.6 43References 44
Owner and EditorCentro Euro-Mediterraneo sui Cambiamenti Climatici www.cmcc.it
AuthorsThis report was prepared by a CMCC team led by Monia Santini, Silvia Torresan and Antonio Trabucco, and including as collaborators (in alphabetical order): Donata Balzarolo, Antonio Bonaduce, GiovanniCoppini, Andrea Critto, Valentina dell'Aquila, Maria De Salvo, Elisa Furlan, Giulia Galluccio, Federica Gobattoni,Antonio Marcomini, Sergio Marconi, Paola Mercogliano, Valentina Mereu, Myriam Montesarchio, JaroslavMysiak, Alessandra Nuzzo, Jonathan Rizzi, Paolo Ronco, Silvia Santato, Donatella Spano, Anna Sperotto,Federica Zennaro, Alessandra Lucia Zollo.
AknowledgementsThe study team wishes to thank the Regional Government of Puglia and its Mediterranean Service (ServizioMediterraneo della Regione Puglia), associated partner of the OrientGate project, for their extensivecooperation during the implementation of the study.
The study team also wishes to thank the following for their support, access to data, and feedbacks: RegionalGovernment of Puglia - Civil Protection Service (Protezione Civile della Regione Puglia) andAgrometeorological Service (Servizio Agrometeorologico Regione Puglia); the Environmental RegionalProtection Agency of Puglia (ARPA Puglia); the River Basin Authority of Puglia (Autorità di Bacino della Puglia);and the Land Reclamation and Irrigation Consortia of Capitanata, Terre d’Apulia, and Stornara e Tara.

1
It is widely recognized that theglobal warming caused by theincreasing presence of GHGs in the atmosphere is also leading tochanges in rainfall patterns, sea levelsand the frequency of extremehydro-meteorological events (e.g. heat waves, droughts, heavyrains, storms). These changes areknown to influence ecosystems,human activities and communities inareas ranging from inland to coastalterritories, with effects that overlapwith those due to populationincrease, habitat modification,overexploitation of naturalresources, alteration of biodiversityand decline of water flows andquality.
Several studies have agreed that theMediterranean Basin is a climatechange hotspot (Diffenbaugh andGiorgi 2012; Giorgi 2006), withwarming expected to be higher thanthe global average and mostlyconcentrated in summer (Giorgi andLionello 2008). IPCC (2013) mentionsvery likely1 increase in temperaturethroughout the 21st century, and alsovery likely increase of the number ofwarm days and nights, and decreaseof the number of cold days andnights. Even though there is high levelof uncertainty in predictingprecipitation, there are signals for a future decrease of the annualprecipitation amount, coupled with an increase in the intensity andfrequency of rainfall extreme events(Garcia-Herrera et al. 2014; Giorgi2006; IPCC 2013). Although the sealevel in the Mediterranean did notchange or even decreased in therecent past (Ramieri et al. 2011), a rise in the global mean sea level will allow the regional sea level in the Mediterranean to harmonizewith the global trend, as projected in CIRCE project simulations (Gualdi et al. 2013).
The Pilot Study “Climate changeadaptation in new water regimein Puglia region” of the ThematicCentre on Drought, Water andCoasts, was formulated toprovide tools and guidelines for local and regional authoritiesto assess vulnerabilities and risksposed by climate change andrelated extreme events (with a focus on droughts). The aimwas to support the improvementof planning for the integratedmanagement of water resourcesand coastal zones, by providingscientific information which is both sound and updated in regard to expected climateterrestrial and marine hazards,and consequent impacts ondomestic water supply,agriculture and coasts.
The region of Puglia was chosen inorder to build on CMCC’s previousexperiences and collaborations withlocal authorities, and since Puglia’sterritory well reflects typicalconditions of the Mediterraneanregion. In fact Puglia is exposed tohydro-climatic hazards associatedespecially to increasingtemperatures, heat waves anddroughts, which affect widely socio-economic sectors competing forwater resources. Vulnerabilityconcerns a region largely engaged in agricultural production, and alsohighly dependent on the surroundingregions for water resources(SOGESID 2009) that are crucial in order to sustain irrigation as well as domestic water supply, ecologicalfunction and lastly industrial andenergy purposes.
Vulnerability to climate hazards alsoaffects coastal zones where one can find many sectors such astourism and fishery that are strategicfor the socio-economicdevelopment of the region.
Risks, derived from the combinationof hazards, exposure andvulnerability (IPCC 2014) are evenhigher over such a vulnerableterritory when exposed to thenegative consequences of additionalclimate-related hazards, like sea levelrise, soil erosion, floods, fires,groundwater depletion and saltwater intrusion into aquifers.Therefore, it becomes increasinglyimportant to develop approachesand methodologies that areintegrated, holistic, cross-sectoraland adaptive in order to efficientlysupport decision makers in thedesign and formulation of adaptationstrategy plans which include climatechange impact assessments.In the following paragraphs, detailson the Pilot Study’s implementationare provided, about objectives andmethodologies formulated whichhave been tailored and applied tothe territory of Puglia, and aboutresults achieved. Finally, the methodby which results can becommunicated and included inplanning for climate changeadaptation is summarized into keymessages and recommendations forstakeholders and decision makers.
1The IPCC Fifth Assessment Report (IPCC 2013;2014) defines likelihood as the probability of anevent or outcome occurring. Very likely is used foran event or outcome having more than 90%probability to occur.
Introduction
Photo: G. Galluccio
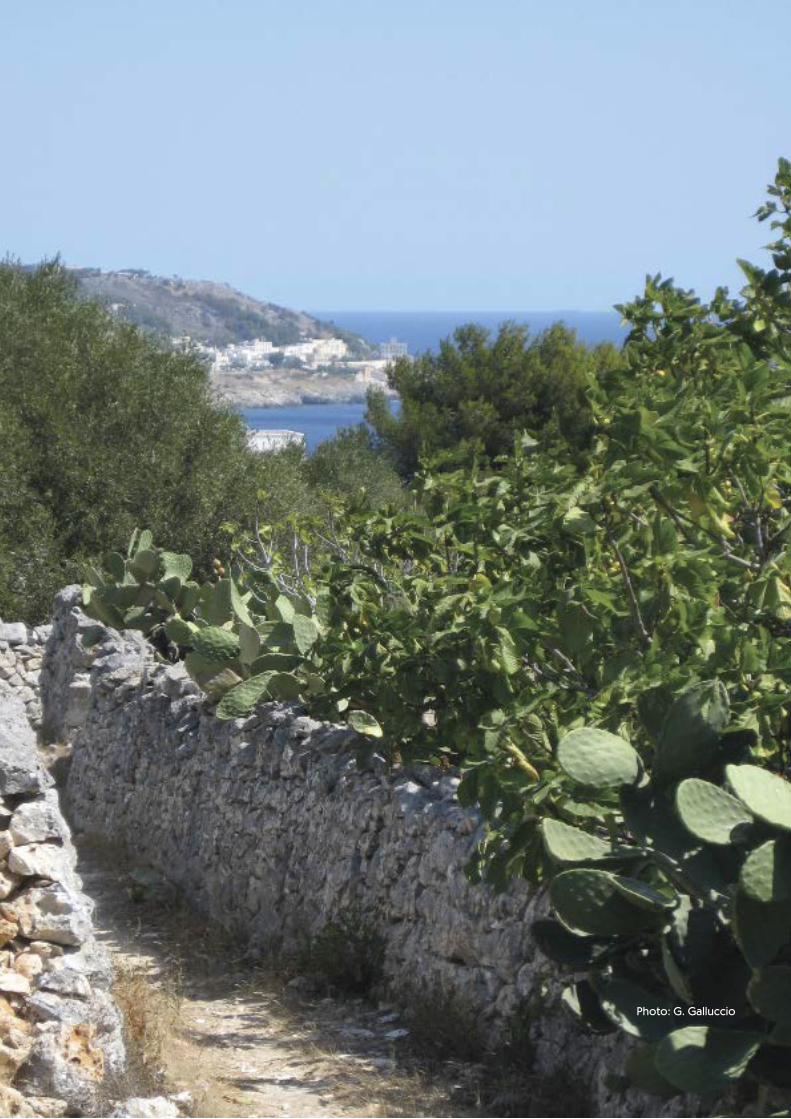
Photo: G. Galluccio

3
Given the increasing concern inPuglia for climate change, itsextremes and consequences, there isan urgent need to integrateadaptation to climate change as partof the traditional water and coast(and other territorial) managementand protection plans. The integrationprocess should follow for examplethe Integrated Coastal ZoneManagement policy cycle which isoften used by coastal practitionersand includes five specific steps: 1)vulnerability assessment; 2) planningand selection of a course of action;3) formal adoption of adaptationactions; 4) implementation; and 5)evaluation (USAID 2009). One of thekey points of this approach is thatthe process of planning is graduallyrather than radically changed by theintroduction of the climate changecomponent. In addition the RiskGovernance Framework (IRGC 2005)and the Climate Risk Managementframework (Martinez et al. 2012),both emphasizing the key role of“communication”, could also behelpful if enlarged to cover not onlydisaster risk management but alsoadaptation, since adaptation shouldbe understood as a precautionaryrisk avoidance or minimizationstrategy.
The Pilot Study in Puglia wasconceived in order to address theneed of including climate adaptationinto planning, by concentrating onthe step of vulnerability and riskassessment, in order to then fosterthe execution of successive stepsconcerning communication ofclimate trends, impacts,vulnerabilities and risks, and theirconsideration by decision makers.Proper vulnerability and riskassessment was thus intended as amixture of a bottom-up approach(based on dialogue withstakeholders) and a top-downapproach (based on indicators),and has been implemented byfollowing some specific objectives:
1) Involving stakeholders at an earlierstage of the analysis to map theirexisting degree of awareness ofclimate change and its impacts, theircurrent capacity in governance toaddress these issues, theirrequirements to understand and beupdated on expected trends, andthe degree of climate changeconsideration existing in the decisionmaking processes.
2) Identifying priority areas foradaptation in terms of sectors,systems and resources exposed toclimate change and variability:priorities should be selected throughan on-going, iterative and inclusiveprocess of consultation withstakeholders’ groups and decisionmakers.
3) Reviewing historical records toreconstruct climate variability,hazardous events and theirconsequences, and to validate thearea of interest’s climate projectionsrepresentative of a range of mediumto long-term outlooks.
4) Converting each climateprojection into the quantification ofbiophysical and socio-economicimpacts and risks, by exploitingstate-of-the-art and wellconsolidated procedures.
5) Providing a comprehensive viewof the cascading phenomena thatcould be triggered by climate change,ranging from their physical impactsand processes to the evaluation ofvulnerability of interacting systems,sectors and resources, in order toquantify the risk.
6) Synthetizing results intoquantitative indicators, formulatedalso thanks to stakeholderconsultation, for a concise andrealistic description andcommunication of the climatechange challenges that affect the addressed systems, sectors and resources.
Once vulnerabilities and risks underclimate change are identified andcommunicated, needs and goals canbe identified to support a “mainstreaming”2 process forfunding, implementing and testing of the adaptation measures.
2 In the context of climate policies, mainstreamingmeans integrating climate concerns and adaptationresponses into relevant policies, plans, programsand projects at national, sub-national, and localscales, better if cross-cutting multiple sectors,without allowing adaptation to get lost amongmany other competing priorities.
Rationaleand objectives

The territory of Puglia (Figure 3.1) has an area of about 19,345 km2 andconsists of a long and narrow region,bordered by two seas, the Ionianand Adriatic, with the longestcoastline among Italian regions (865 km); Puglia is also the leastmountainous region in Italy beingmostly occupied by plains and hills.
Information extracted from theRegional Water Protection MasterPlan (WPMP; SOGESID 2009)suggests that mean annual airtemperature ranges from 10°C to
17°C, while mean annualprecipitation varies from 400 mm to 1300 mm with 600 mm being theapproximate average. The region’sclimate can be defined from aridsub-humid to arid according totemperature and precipitationregime.
Concerning the hydrogeologicalsettings, the calcareous origin ofPuglia’s bedrocks have given rise to karstic phenomena which havelimited the development of asuperficial river network, except forthe northern area; endorheic basinsare numerous and the undergroundwater circulation, one of the mainwater sources for the region, is well-developed.
In terms of land use/cover, morethan 82% of Puglia’s surfacecomprises agro-ecosystems, withabout 7% of natural vegetation and7% of mixed territories, while urbanareas cover the remaining 4%(Zaccarelli et al. 2008). From a socio-economic point ofview, since the early 2000s the
population of Puglia is above 4million (ISTAT 2011) with anincreasing, even if decelerating,trend maintained during the whole of the last century. The economy of Puglia is characterized by anemphasis on agriculture, favored bythe gentle topography, generating ashare of gross domestic product(GDP) above the national average(5.24% in Puglia vs. 2.65% in Italy),and driven principally by wine, oliveoil and wheat production. Puglia alsoheavily relies on the touristic sector,which is a growing economicresource (OECD 2011). An alwaysless role is played by industry,except for the food industry thatemphasizes the importance ofagriculture complemented by fishing.
Time series of observations frommeteorological stations in Pugliashow trends towards warmer andmarginally drier conditions during the second half of the 20th Century.Combined trends of increasingevapotranspiration and decreasingprecipitation implied a progressivelylarger water deficit (Hemming et al.
Pilot area description3.1 CHARACTERISTICS, HAZARDS AND VULNERABILITIES
4
Figure 3.1 - Map showing location and topography of Puglia.

2013). While climate modelprojections suggest warmer anddrier conditions also over the nextfew decades (Goodess et al. 2013),a further increase in the water deficitwould not be sustainable and wouldhave a large negative impact onhuman and agricultural sectors, andon the environment.
One of the major vulnerabilities ofPuglia relating to climate changeregards the use of water resources,whose share is about 54% foragriculture, 36% for domestic useand 10% for industry. Puglia isalready forced to import water fromnearby regions (up to 50% of theresource is traded in, with domesticuse reaching 75%; SOGESID 2009)and to extract water from aquifersfor irrigating crops because of theseasonal nature of many rivers.
Overexploitation of groundwaterfrom private wells is already an issueat regional scale, since a regulationplan for groundwater exploitation is missing, leading to depletion ofunderground water bodies inquantity but even in qualityespecially favoring sea waterintrusion (Polemio et al. 2007;Piccinni et al. 2008).
Concerning agriculture, results fromthe EU FP6 funded CIRCE project(http://www.circeproject.eu/)
suggest that wine and oil productioncould be impacted in a negative wayby the drier and hotter conditionsexpected to characterize Puglia inthe first half of 21st Century (Reale etal. 2011). Other results (Mereu et al.2008; Ponti et al. 2014) suggest thatoil production could be favored bynew climate regimes, as hightemperatures are optimal for growthand development of olives, giving a higher yield and therefore greaterprofit. However, a new climateregime could also change thesuitability of lands (Ferrise et al. 2013;Moriondo et al. 2013) and the cropexposure to new invasive pests(Ponti et al. 2014).
Regarding extreme events, recentlyPuglia region was alternativelyaffected by out-of-normal climaticyears, e.g. droughts in 2011-2012,floods in 2013-2014 and fastfluctuations of droughts/floods in2008-2009, that caused pollution inthe Occhito reservoir (WHO 2011).This climate variability underopposite extremes endangers: i) the availability of (sub)surfacewater and soil moisture to offset theevapotranspiration demand fromcrops not fully satisfied by rain; ii)the temporal reliability of water yieldfrom existing infrastructures forwater accumulation/diversion(single and multipurpose dams); iii)the quality of water to be provided
for agricultural production anddomestic uses; iv) the standardsrequired (e.g. minimumenvironmental flow) to maintain theecological function of water in riversand/or lakes. Population growth(recently mainly caused byimmigration) and tourism(EUROIDEES 2013) worsen thissituation increasing the region’soverall vulnerability because ofdecreasing water availability andincreasing water demand particularlyduring summer.
In this context, the increasing humanpresence and activity in Puglia’scoastal areas makes them vulnerableto the occurrence of events of greatimpact and low frequency (e.g.extreme storm surge and tsunamitidal waves) (Mastronuzzi andSansò 2012). Moreover, the state of the coast is seriously affected bymodifications due to erosion (Fioreet al. 2010): 65% of coasts areundergoing erosion processes(Antonioli and Silenzi 2007).
Finally, long parts of the coasts andespecially the Salento peninsula arealso vulnerable to relative sea levelrise (Sansò and Mastronuzzi 2013;Antonioli and Leoni 2007), increasingthe coastal vulnerability to salt waterintrusion being already awidespread problem in Puglia(Polemio et al. 2010).
5
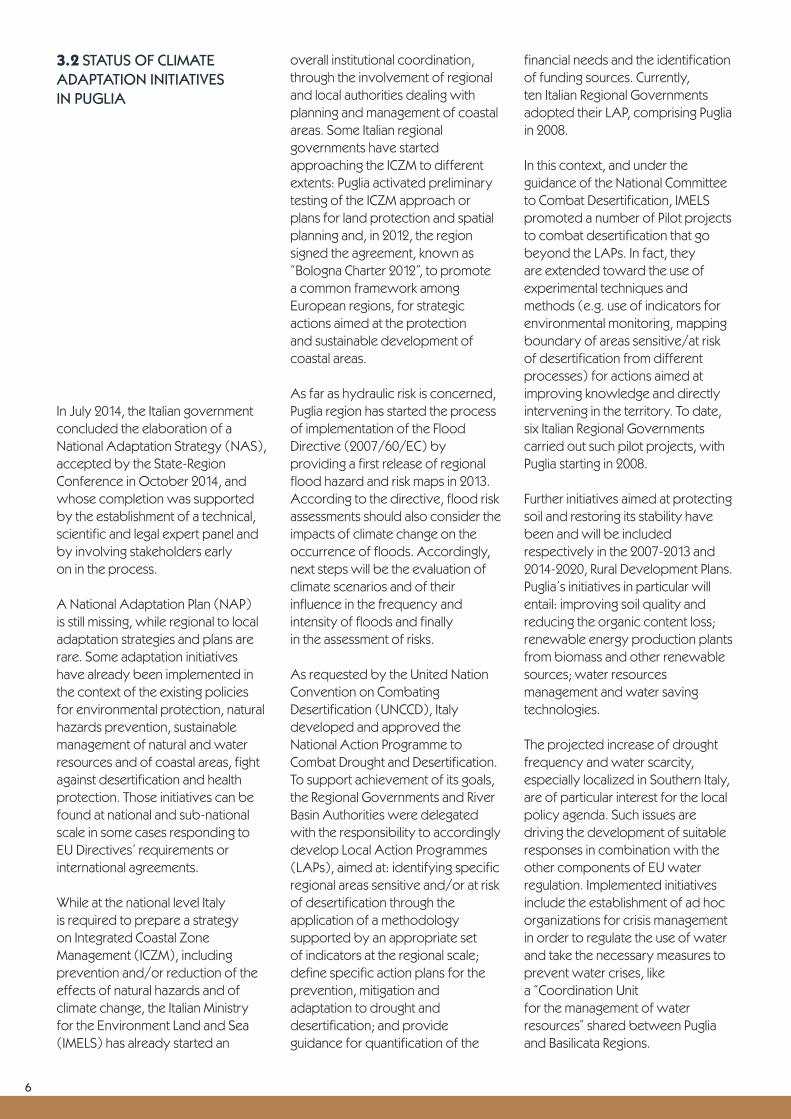
In July 2014, the Italian governmentconcluded the elaboration of aNational Adaptation Strategy (NAS),accepted by the State-RegionConference in October 2014, andwhose completion was supportedby the establishment of a technical,scientific and legal expert panel andby involving stakeholders early on in the process.
A National Adaptation Plan (NAP) is still missing, while regional to localadaptation strategies and plans arerare. Some adaptation initiativeshave already been implemented inthe context of the existing policiesfor environmental protection, naturalhazards prevention, sustainablemanagement of natural and waterresources and of coastal areas, fightagainst desertification and healthprotection. Those initiatives can befound at national and sub-nationalscale in some cases responding toEU Directives’ requirements orinternational agreements.
While at the national level Italy is required to prepare a strategy on Integrated Coastal ZoneManagement (ICZM), includingprevention and/or reduction of theeffects of natural hazards and ofclimate change, the Italian Ministryfor the Environment Land and Sea(IMELS) has already started an
overall institutional coordination,through the involvement of regionaland local authorities dealing withplanning and management of coastalareas. Some Italian regionalgovernments have startedapproaching the ICZM to differentextents: Puglia activated preliminarytesting of the ICZM approach orplans for land protection and spatialplanning and, in 2012, the regionsigned the agreement, known as“Bologna Charter 2012”, to promote a common framework amongEuropean regions, for strategicactions aimed at the protection and sustainable development ofcoastal areas.
As far as hydraulic risk is concerned,Puglia region has started the processof implementation of the FloodDirective (2007/60/EC) byproviding a first release of regionalflood hazard and risk maps in 2013.According to the directive, flood riskassessments should also consider theimpacts of climate change on theoccurrence of floods. Accordingly,next steps will be the evaluation ofclimate scenarios and of theirinfluence in the frequency andintensity of floods and finally in the assessment of risks.
As requested by the United NationConvention on CombatingDesertification (UNCCD), Italydeveloped and approved theNational Action Programme toCombat Drought and Desertification.To support achievement of its goals,the Regional Governments and RiverBasin Authorities were delegatedwith the responsibility to accordinglydevelop Local Action Programmes(LAPs), aimed at: identifying specificregional areas sensitive and/or at riskof desertification through theapplication of a methodologysupported by an appropriate set of indicators at the regional scale;define specific action plans for theprevention, mitigation andadaptation to drought anddesertification; and provideguidance for quantification of the
financial needs and the identificationof funding sources. Currently, ten Italian Regional Governmentsadopted their LAP, comprising Pugliain 2008.
In this context, and under theguidance of the National Committeeto Combat Desertification, IMELSpromoted a number of Pilot projectsto combat desertification that gobeyond the LAPs. In fact, they are extended toward the use ofexperimental techniques andmethods (e.g. use of indicators forenvironmental monitoring, mappingboundary of areas sensitive/at riskof desertification from differentprocesses) for actions aimed atimproving knowledge and directlyintervening in the territory. To date,six Italian Regional Governmentscarried out such pilot projects, withPuglia starting in 2008.
Further initiatives aimed at protectingsoil and restoring its stability havebeen and will be includedrespectively in the 2007-2013 and2014-2020, Rural Development Plans.Puglia’s initiatives in particular willentail: improving soil quality andreducing the organic content loss;renewable energy production plantsfrom biomass and other renewablesources; water resourcesmanagement and water savingtechnologies.
The projected increase of droughtfrequency and water scarcity,especially localized in Southern Italy,are of particular interest for the localpolicy agenda. Such issues aredriving the development of suitableresponses in combination with theother components of EU waterregulation. Implemented initiativesinclude the establishment of ad hocorganizations for crisis managementin order to regulate the use of waterand take the necessary measures toprevent water crises, like a “Coordination Unit for the management of waterresources” shared between Pugliaand Basilicata Regions.
3.2 STATUS OF CLIMATE ADAPTATION INITIATIVES IN PUGLIA
6


8
The overall methodology for PilotStudy 3 was designed andconducted through acomprehensive integrated approachconnecting data, models,downscaling procedures, spatialanalysis techniques, decisionsupport tools and indicators, into a chain of activities ranging fromhazard quantification (at processlevel: climate and hydrology) tovulnerability and risk assessment (at resource/sector level: water,agriculture and coasts). Links amongthese components are stronglybased on the use of indicators,aimed at synthetizing complexscientific information into quantitieseasy understandable andcommunicable to stakeholders andpolicy makers (Martinez et al. 2012).To effectively promote theintegration of knowledge intodecision making, indicators havebeen grouped into hazard,exposure, vulnerability and riskcategories3, in order to classify theinformation to be used and guide inidentifying priorities for regulationsand investments.
The overall integrated approach canbe articulated into five main modulesschematized in Figure 4.1. Startingfrom the main componentrepresented by climate modeling,providing simulations about currentand future atmosphere and oceanregime for the Puglia Region(Modules 1 and 2), the riskassessment is performed consideringdrought hazards, scenarios (both forthe agro-meteorological andhydrological component) (Module3) and the consequent impacts onrainfed/irrigated agriculture (Module4), as well as quantifying thepotential consequences of rising sealevels on low-lying coastal areas(Module 5).
The spatial domain of the Pilot Studywas outlined to cover from theinland to the coastal territory ofPuglia and its contiguous areas thatcontribute to water provision to theregion. At temporal level, a baselinereference period (from 1976 to2005) and two future periods in themedium term (from 2021 to 2050)and long term (from 2041 to 2070)were considered. In each futureperiod the exemplification of apossible range of future conditionswas allowed thanks to updated andhigh resolution climate and impactprojections under RCP4.5 and RCP8.5emission scenarios. The RCP4.5 is astabilization scenario where totalradiative forcing is stabilized shortlyafter 2100 to 4.5 W m2
(approximately 650 ppm CO2
equivalent) by employingtechnologies and strategies toreduce greenhouse gas emissions.The RCP8.5 is a business as usualscenario and characterized byincreasing greenhouse gas emissionsand high greenhouse gasconcentration levels, andrepresenting a rising radiating forcingpathway leading to 8.5 W m2 in 2100(approximately 1370 ppm CO2
equivalent).
Concerning water resources,attention was paid to theinvestigation of the complexinteractions between water anddrought in its main dimensions: a)meteorological, defined by thedegree of dryness (in terms of lackof rain) compared to the average,and by the duration and thefrequency of the dry periods; b)agricultural, where meteorologicaldrought reflects into drop of soilmoisture leading to negative impactsespecially for rainfed agriculture; andc) hydrological, when precipitationshortfalls affect surface orsubsurface water bodies, impactingdomestic, industrial and ecologicalwater uses and also agriculture in itsirrigated component. Such droughtdimensions can both be triggered incascade and exist simultaneously,and since their impacts are acomplex mixture of water availability
and water demand, this leads to a fourth dimension known as socio-economic drought, which occurswhen water supply is not sufficientto meet human needs and causes a decrease in the provision of goodsand services.
As far as coastal areas areconcerned, Mediterraneansimulations of sea level rise alongPuglia’s coasts were combined withtopographic and land use layers toinvestigate the risks that could arisefrom the permanent submersion ofproductive or significant areas (fortourism, agriculture, transports,industry) with consequent losses ofland and related economic revenues.
Here we present a brief descriptionof the main modules of theintegrated approach, to provide a quick overview of themethodologies and tools applied inthe case study. More details aboutthe methodologies applied for theassessment of climate change and itsimpacts on water resources,agriculture and coastal zones arereported in Annex A.1, A.2, A.3 andA.4, while the list of used indicatorsand indices is reported in Annex A.5.
3According to IPCC (2014): Hazard is the potentialoccurrence of a natural or human-induced physicalevent or trend or physical impact that may causeloss of life, injury, or other health impacts, as well as damage and loss to property, infrastructure,livelihoods, service provision, ecosystems, andenvironmental resources. In the IPCC FifthAssessment report, the term hazard refers toclimate-related physical events or trends or theirphysical impacts; Exposure is the presence ofpeople, livelihoods, species or ecosystems,environmental functions, services, and resources,infrastructure, or economic, social, or culturalassets in places and settings that could beadversely affected; Vulnerability is the propensityor predisposition to be adversely affected.Vulnerability encompasses a variety of conceptsand elements including sensitivity or susceptibilityto harm and lack of capacity to cope and adapt;Risk is the potential for consequences wheresomething of value is at stake and where theoutcome is uncertain, recognizing the diversity of values. Risk is often represented as probabilityof occurrence of hazardous events or trendsmultiplied by the impacts if these events or trendsoccur. Risk results from the interaction ofvulnerability, exposure, and hazard. In this report,the term risk is used primarily to refer to the risks of climate-change impacts.
Methodology description

9
1. CLIMATE PROJECTIONSBaseline: 1976-2005Medium term future: 2021-2050Long term future: 2041-2070
2.SEA LEVEL PROJECTIONSBaseline: 1976-2005Medium term future: 2021-2050Long term future: 2041-2070
Regional Climate Model(COSMO-CLM)
Italy, 8 km
Bias Correction/DownscalingItaly, 8 km / ≈30 stations
PrecipitationMaximum TemperatureMinimum Temperature
Atmospheric component of the GCM
(CMCC-CM)Global, 0.75°
EMISSION FORCINGIPCC RCP 4.5 and RCP 8.5
Hydro-Meteorological dataItaly, 0.25° / stations
1976-2005
Oceanic component of the GCM
(CMCC-CM)Global, 0.75°
Sea level rise projectionsMediterranean, 0.75°
Hydrological Model(ArcSWAT)
Puglia, watershed level
Soil water balancePuglia, 8 km
Meteorological&Agricultural
Drought IndicatorsHydrological Drought
Indicators
3.DROUGHT SCENARIOS 5. COASTAL RISK ASSESSMENT
DESYCODSS
Inundation risk for low-lying coastal areas and receptors
Risk products:HAZARD, EXPOSURE,VULNERABILITY, RISK
Indicators/mapsAgricultural and water use data
Analysis of risks forirrigated agriculture
regional scaleEconomic risk forrainfed agriculture
farm level
4. WATER RESOURCES & AGRICULTURE RISK ASSESSMENT Data Platform
Topography, landuse/cover, soil data
LEGENDA
External Project Component
Internal Project Component
Climate Modeling
Statistical downscaling-correction
Physical Impact Modeling
Hazard Indicators
Validation/correction
Decision Support Systems Project level tool
Risk and Vulnerability Assessment Risk Products
Internal Project Component: Calibration/input
Table 4.1 - Flow diagram showing the framework and its modules and components.

Photo: G. Galluccio

4.1MODULE 1 - CLIMATE PROJECTIONS
Regional Climate Model (RCM)simulations with COSMO-CLM4 werefirst conducted, at project level forthe westernmost part of the SEEdomain (Italy and surrounding), todynamically downscale (at 0.0715°,ca. 8 km horizontal resolution) theatmospheric component of GCMprojections performed with CMCC-CM5 at 0.75° horizontal resolution in the context of CMIP5 experiment(http://cmip-pcmdi.llnl.gov/cmip5/). Further,statistical downscaling wasperformed at site level for 31 and 21meteorological stations forprecipitation and temperature,respectively, to support basin scalehydrological analyses in Module 3.Over these site level data, someextreme indices were calculatedfrom downscaled simulations acrosstime frames and scenarios.
4.2MODULE 2 - SEA LEVEL PROJECTIONS
CMCC-CM outputs representingtrends on sea surface height abovethe geoid (ZOS), as simulated by theocean model component of CMCC-CM, have been clipped andresampled to the Mediterraneandomain and processed intoindicators of Seal Level Rise (SLR)scenarios for the entire coastal areas(Adriatic and Ionian) of Puglia. SLRwas assumed as the anomalybetween ZOS calculated for twodifferent time periods. Four differentapproaches were applied tocalculate the anomaly via statisticalindicators representing conditionsranging from average and fullprecautionary: 1) “maxmin”,difference between the maximum ofthe considered future period and theminimum of the baseline period (fullprecautionary circumstance); 2) “mean”, difference between themean of the considered futureperiod and the mean of the baselineperiod; 3) “median”, difference
between the median of theconsidered future period and themedian of the baseline period; 4)“pctl”, difference between the 90th
percentile of the considered futureperiod and the 10th percentile of the baseline period (highlyprecautionary circumstance).
4.3MODULE 3 - DROUGHT SCENARIOS
Relying on RCM simulationsperformed in Module 1 andconcerning atmospheric variables, a set of hazard indicators wasselected and calculated, throughsimple equations or by feeding avertical soil water balance schemeand a semi-distributed hydrologicalmodel (ArcSWAT;http://swat.tamu.edu/software/arcswat/) to quantify and analyzechanges in terms of: i) averagetrends (annual, seasonal, monthly) of agro-meteorological andhydrological conditions; and ii)occurrence of extreme events oftemperature, precipitation,streamflow (e.g. heat waves, dryspell, low flow periods).The most appropriate indicatorswere identified to representconditions of meteorological,agricultural and hydrologicaldroughts (see Annex A.5 for fullindicator list and acronyms), and a sub-set of them was chosen asrepresentative of the variability of water inputs to sustain domesticpurposes and cropevapotranspiration (in both rainfedand irrigated agriculture). Changes in these indicators across emissionscenarios and time frames wereassumed as proxies of changes in thespatial variability of soil moisturedeficit in cultivated fields, and in thestreamflow annual mean and inter-annual variability at the location of 8 dams of interest for serving thePuglia aqueduct, public irrigationinfrastructures and industrialpurposes, plus for 6 basins (and 2tributary sub-basins) of interest forprivate irrigation from surface water
sources. To move forward fromhazard to risk analysis, a crucial stepwas thus connecting the upstreamavailability of water resources(supply level) and the downstreamuse (demand level).
4.4MODULES 4 AND 5 - RISK ASSESSMENT FOR AGRICULTURE AND COASTALAREAS
The quantification of risks forirrigated agriculture and coastal areaswas performed adopting a RegionalRisk Assessment (RRA) procedure,aimed at providing a quantitativeand systematic way to estimate and compare the impacts of climate-related hazards that affect largegeographic areas (Landis 2005;Pasini et al. 2012). The RRAprocedure (see Box 1) uses MultiCriteria Decision Analysis (MCDA) to identify and rank targets at risk(e.g. beaches, infrastructures,wetlands, cultivated areas) andlocalize priority areas whereadaptations strategies could berequired.
4 http://www.clm-community.eu/index.php?menuid=198; Rockel B.,and B. Geyer (2008), The performance of theregional climate model CLM in different climateregions, based on the example of precipitation,Meteorologische Zeitschrift, 17(4), 487-498.
5 http://www.cmcc.it/it/models/cmcc-cm;Scoccimarro E., S. Gualdi, A. Bellucci, A. Sanna,P.G. Fogli, E. Manzini, M. Vichi, P. Oddo and A.Navarra, 2011: Effects of Tropical Cyclones onOcean Heat Transport in a High Resolution CoupledGeneral Circulation Model. Journal of Climate, 24,4368-4384.
11
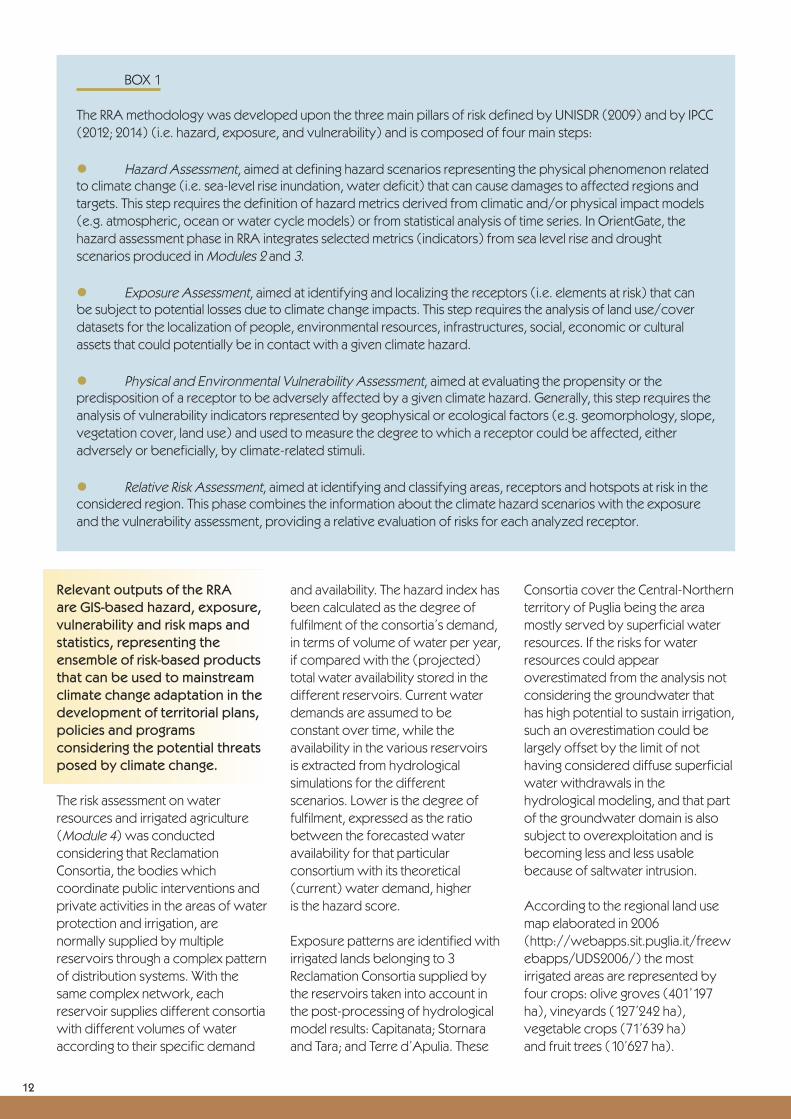
Relevant outputs of the RRA are GIS-based hazard, exposure,vulnerability and risk maps andstatistics, representing theensemble of risk-based productsthat can be used to mainstreamclimate change adaptation in thedevelopment of territorial plans,policies and programsconsidering the potential threatsposed by climate change.
The risk assessment on waterresources and irrigated agriculture(Module 4) was conductedconsidering that ReclamationConsortia, the bodies whichcoordinate public interventions andprivate activities in the areas of waterprotection and irrigation, arenormally supplied by multiplereservoirs through a complex patternof distribution systems. With thesame complex network, eachreservoir supplies different consortiawith different volumes of wateraccording to their specific demand
and availability. The hazard index hasbeen calculated as the degree offulfilment of the consortia’s demand,in terms of volume of water per year,if compared with the (projected)total water availability stored in thedifferent reservoirs. Current waterdemands are assumed to beconstant over time, while theavailability in the various reservoirs is extracted from hydrologicalsimulations for the differentscenarios. Lower is the degree offulfilment, expressed as the ratiobetween the forecasted wateravailability for that particularconsortium with its theoretical(current) water demand, higher is the hazard score.
Exposure patterns are identified withirrigated lands belonging to 3Reclamation Consortia supplied bythe reservoirs taken into account inthe post-processing of hydrologicalmodel results: Capitanata; Stornaraand Tara; and Terre d’Apulia. These
Consortia cover the Central-Northernterritory of Puglia being the areamostly served by superficial waterresources. If the risks for waterresources could appearoverestimated from the analysis notconsidering the groundwater thathas high potential to sustain irrigation,such an overestimation could belargely offset by the limit of nothaving considered diffuse superficialwater withdrawals in thehydrological modeling, and that partof the groundwater domain is alsosubject to overexploitation and isbecoming less and less usablebecause of saltwater intrusion.
According to the regional land usemap elaborated in 2006(http://webapps.sit.puglia.it/freewebapps/UDS2006/) the mostirrigated areas are represented byfour crops: olive groves (401’197ha), vineyards (127’242 ha),vegetable crops (71’639 ha) and fruit trees (10’627 ha).
12
BOX 1
The RRA methodology was developed upon the three main pillars of risk defined by UNISDR (2009) and by IPCC(2012; 2014) (i.e. hazard, exposure, and vulnerability) and is composed of four main steps:
l Hazard Assessment, aimed at defining hazard scenarios representing the physical phenomenon relatedto climate change (i.e. sea-level rise inundation, water deficit) that can cause damages to affected regions andtargets. This step requires the definition of hazard metrics derived from climatic and/or physical impact models(e.g. atmospheric, ocean or water cycle models) or from statistical analysis of time series. In OrientGate, thehazard assessment phase in RRA integrates selected metrics (indicators) from sea level rise and droughtscenarios produced in Modules 2 and 3.
l Exposure Assessment, aimed at identifying and localizing the receptors (i.e. elements at risk) that can be subject to potential losses due to climate change impacts. This step requires the analysis of land use/coverdatasets for the localization of people, environmental resources, infrastructures, social, economic or culturalassets that could potentially be in contact with a given climate hazard.
l Physical and Environmental Vulnerability Assessment, aimed at evaluating the propensity or thepredisposition of a receptor to be adversely affected by a given climate hazard. Generally, this step requires theanalysis of vulnerability indicators represented by geophysical or ecological factors (e.g. geomorphology, slope,vegetation cover, land use) and used to measure the degree to which a receptor could be affected, eitheradversely or beneficially, by climate-related stimuli.
l Relative Risk Assessment, aimed at identifying and classifying areas, receptors and hotspots at risk in theconsidered region. This phase combines the information about the climate hazard scenarios with the exposureand the vulnerability assessment, providing a relative evaluation of risks for each analyzed receptor.

The vulnerability score is calculatedas the multiplication of three factorsthat are classified, ranked and thennormalized in the range 0-1, namely:i) Hydro-demand (V1) to evaluatethe degree to which the crops areinfluenced by the water stress(decrease of availability forirrigation), this score is related to theYield-Response factor (Ky) indicatorthat captures the essence of thecomplex linkages betweenproduction and water use by a crop,where many biological, physical andchemical processes are involved(Steduto et al. 2012); irrigationalcrops considered are vegetable, fruittrees, vineyards, and olive groves;ii) Degree of efficiency (systemlosses, V2): losses decrease theefficiency of the system and increasetheir vulnerability to climate changeimpact;iii) Degree of diversification ofsources (V3): diversifying thesources tends to mitigate the risk and therefore, lower vulnerability isassociated with the degree ofdiversification of the sources reliedupon by the different ReclamationConsortia to fulfil their demand.
Concerning the assessment ofeconomic risks on mostly rainfedagriculture more at local scale, anexemplificative study on wheat was conducted, as it is one of the principal crops in the region(occupying around 22% of theutilized agricultural area in 2010) andwhose annual production representsa 20% share of the whole Italianproduction.
A statistical model was formulatedthat takes into account the wheatyield’s dependency on climatevariability and farms’ performances.To estimate the relationship betweenthe weather conditions and the cropyield, seasonal average oftemperature and precipitationamount, and their combination, wereconsidered. Climate variables wereobtained from data from Module 1and 3, after a zonal aggregationbased on “agricultural regions”, i.e.
grouping in the same spatial unit themunicipalities, where farms arelocated, sharing similarenvironmental conditions.
The analysis was also fed with datafrom the Italian Farm AccountancyData Network (FADN;http://www.inea.it/en/rica).Selected control variablesencompass farm’s structural,technological and managementvariables such as: irrigation quota,cost of seeds, fertilization costs,pests and pathogens cost of control,machines, cost of rental machines,flat lands, specialized farm on arablecrop production, breeding activities,wheat cultivated surface, wheatcultivated surface squared, familyfarm, less favored area, organic farm,low environmental impact. Someother variables have been droppedby the final models because non-significant.
The analysis focuses on the period2001-2007 to allow a more robustview, as the farm sample is stronglyunbalanced and the number ofobservations for each year rangebetween 298-445.
The analysis of coastal risks (Module5) was performed with the aim ofproducing information for localstakeholders and decision-makersabout targets and areas that are likelyto be submerged by sea-level rise inthe future: the DEcision supportSYstem for COastal climate changeimpact assessment (DESYCO)6 wasapplied with this purpose. Theassessment followed a RRAapproach considering a variety ofenvironmental targets potentiallyexposed to sea level rise in low-lyingareas (e.g. beaches, wetlands,protected areas, agricultural andurban areas, terrestrial biologicalsystems) and compared differentsea-level rise scenarios for theMediterranean region, in the mediumand long term timeframes (i.e. 2021-2050 and 2041-2070) (Module 2). ADigital Elevation Model (DEM) with aspatial resolution of 8m for the Puglia
Region was used to evaluate areasand targets that could be submergedby rising water levels.
6DESYCO is a GIS-based Decision Support System(DSS) aimed at the integrated assessment ofmultiple climate change impacts on vulnerablecoastal systems (e.g. beaches, river deltas,estuaries and lagoons, wetlands, agricultural andurban areas);http://www.cmcc.it/it/models/desyco. TorresanS., Rizzi J., Zabeo A., Critto A., Gallina V., Furlan E.,Marcomini A., 2013. Assessing environmentalimpacts of climate change at the regional scale toprovide adaptation services: the DEcision supportSYstem for COastal climate change impactassessment (DESYCO). Proceedings of the firstannual conference SISC on climate change and itsimplications on ecosystem and society, 23- 24September 2013, Lecce, Italy, pp. 468-476, ISBN978 - 88 - 97666 - 08 - 0
13

According to the chain of activitiesfrom climate hazard to risk analysis,the main results of Pilot Studycomponents are summarized in the
following section, while details aregiven in the respective Annexes.Regional climate model projections(Module 1; Annex A.1) produced inthe context of OrientGate for 1971-2070 under RCP4.5 and RCP8.5emission scenarios, and then bias-corrected, suggest a trend ofincreasing mean annual temperature(MAT) from 1.4-1.7 to 2.3-3° C, anddecreasing annual precipitation
amount (APA) from 3-11 to 14-19%,for the medium to long term future(2021-2050 and 2041-2070 timehorizons) (Table 5.1). The trendsrespectively have the potential toworsen and/or accelerate theeffects on the unpredictability ofwater availability, and affect thereliability of both the quantity andquality of the resource, and thus itssustainable use.
Results
Indicator Baseline Anomaly wrt. Baseline
1976-2005 2021-2050 2041-2070
RCP4.5 RCP8.5 RCP4.5 RCP8.5
Mean Annual Temperature 15.4°C 1.4 1.7 2.3 3
Annual Precipitation Amount 348.3 mm -11.2 -3 -14.4 -19.1
Table 5.1 - Averaged results and trends of Mean Annual Temperature (MAT) and Annual Precipitation Amount (APA) indicators as averaged over Puglia. Anomaly isin °C for MAT and % for APA.
The new climate regime is especiallyevident from some basic climateindicators, and in the monthlyclimatological mean of 2-meters airtemperature and precipitation,averaged across Puglia and nearbyterritories. Warming seemsconcentrated in summer and moreevident in the long-term time frame,when also differences between the
two emission scenarios are morenoticeable; differently, coldestmonths differ between emissionscenarios also along the mediumterm period (Figure 5.1). Intra-annualand inter-scenario variability ofprecipitation is larger, with a low tomoderate drop under both periodsfor RCP4.5 scenario (with exceptionof few months appearing wetter),
while the RCP8.5 scenario reveals alow wetting to moderate drying onthe medium term, and moderate tohigh drying (in winter) and wetting(in summer) on the long term (Figure5.2). However the drying affects themost humid season, establishing agreater impact on rainfall input to thewhole water balance.
Figure 5.1 - Monthly average of mean air temperature under RCP4.5 (left) and RCP8.5 (right) emission scenarios over Puglia and nearby territories.
Larger periods of Consecutive DryDays (and longer Warm SpellDuration Index) are predictedespecially in the long term, indicatinghigher chances of more severedroughts. Similarly, the number ofConsecutive Wet Days is expected todecrease slightly, associated as well
with a slight decrease of the numberof days characterized by consistentrain (i.e. > 5 mm/day).
Selected indices of extremes werecalculated at station level indicating: l for temperature, an increase ofminimum, maximum, 10th and 90th
percentiles of daily values, and ofsummer days and tropical nights;and a decrease of frost days andicing days. All these changes aremore evident for the RCP8.5.l for precipitation, a generaldecrease of number of rainy days,of consecutive wet days, of number
Temperature (°C)
0
5
10
15
20
25
0
5
10
15
20
25
Historical 1976-2005rcp8.5 2041-2070rcp8.5 2021-2050
2 3 41 5 7 8 96 10 11 12 2 3 41 5 7 8 96 10 11 12
Months Months
Temperature (°C)Historical 1976-2005rcp4.5 2041-2070rcp4.5 2021-2050
14

of days with precipitation over 10and 20 mm/day, and of 90th and 99th
percentiles of daily amount. On the other hand, there is a generalincrease of mean precipitationamount on wet days, of consecutivedry days and of precipitationmaximum in 1 and 5 days.Indicators describing agro-meteorological conditions (Module3; Annex A.2), include a mix of thenew regimes for temperature andprecipitations. Increasingtemperature will lead to relevantincreases of potentialevapotranspiration (PET-HAindicator), similar between thescenarios in the medium term (+ 5%), while more differentiatedbetween scenarios (+ 7-10 %) in the long term. The most significantincrease of evapotranspirativedemand is concentrated in thenorthernmost, agriculturallyproductive, area. The Aridity Indexsuggests how warming plus dryingwill facilitate a potential increase inevapotranspiration with respect towater available from precipitation,and again in the long term,associated with decreases inprecipitation, a noticeable spread ofarid conditions all over Puglia isexpected, especially under RCP8.5scenario.
The potential soil moisture deficit(PSMD), indicating the soil waterstress cumulated during the growingseason and largely correlated tocrop water requirements andconsequent irrigation applications,identified larger water stress for
crops that need to be compensatedby larger irrigation applications (+ 7-20%) and/or increased water useefficiency: most critical worseningconditions seem occurring in thenorthern agricultural plains.Increasing temperatures will raise theheat accumulation (summarized asindicator by the Growing DegreeDays; GDD), which will shorten cropgrowing seasons and acceleraterates of crop development thus notnecessarily accomplishing properfruit maturity and ripening. Changes
of GDD levels will modify the thermalclimate suitability of crops, inducingadoption of new crops and cultivarsmore adapted to new future heatregimes in Puglia. Hydrologicalmodeling of inflow series driven byabove climate projections (Module
3; Annex A.3) for six significant riverbasins in Puglia allowedcharacterizing trends in terms ofwater availability and variability.
Stat-RO indicators, representative of percent changes in the averageinflow available to reservoirscompared to the driest year, confirma large dominance of moderate tohigh severity of reduction in ca. 80%of cases, with worsening fromRCP4.5 to RCP8.5 and from medium-to long-term (Table 5.2).
Figure 5.2 - Monthly average of precipitation amount under RCP4.5 (left) and RCP8.5 (right) emission scenarios over Puglia and nearby territories.
Table 5.2 - Results of the Stat-RO indicator for the analyzed river basins. Colors represent classes of inflowchange (hazard) from null reduction (green; changes ≥0%), to low (yellow; -10 % ≤ changes < 0%), medium(orange; -25 % ≤ changes < -10%), high (red -40 % ≤ changes < -25%), extreme (dark red; changes < -40%).
Precipitation (mm)
0
5
10
15
20
25
0
5
10
15
20
25
2 3 41 5 7 8 96 10 11 12 2 3 41 5 7 8 96 10 11 12
Months Months
Precipitation (mm)Historical 1976-2005rcp4.5 2041-2070rcp4.5 2021-2050
Historical 1976-2005rcp8.5 2041-2070rcp8.5 2021-2050
Stat-Ro River Basin2021-2050 2041-2070
RCP4.5 RCP8.5 RCP4.5 RCP8.5Carapelle -15,0 -18,3 -17,3 -33,3Cervaro -10,0 -14,7 -21,1 -33,8Fortore -25,5 -31,4 -31,7 -47,6Ofanto -23,6 -31,5 -30,0 -42,6Bradano -18,3 -18,1 -23,9 -35,5Candelaro -11,7 -10,9 -10,6 -26,7
Carapelle -25,0 -21,8 -25,1 -47,0Cervaro -10,8 -10,5 -26,3 -44,7Fortore -24,0 -28,6 -28,4 -43,7Ofanto -29,3 -33,7 -31,1 -49,8Bradano -26,2 -34,5 -35,2 -53,2Candelaro 7,3 -9,6 -12,5 -27,8
% c
hang
e in
mea
n%
cha
nge
in 1
0thpc
tl
15

The same indicator calculated foreight dams confirmed a noteworthydistribution (ca. 70% of cases) ofhigh to extremely severe reduction(percent change) of wateravailability (Table 5.3).
The slightly contrasting trends ofCandelaro in terms of smoothing ofthe driest year occurrence could bedue to the fact that it is the one withthe largest surface under aridconditions among the investigatedbasins, and this makes it moresensible to initial changes in rainfallpatterns.
By examining other indicators thatquantify monthly, seasonal and inter-annual inflow trends, the generalworsening is especially confirmed inthe long term RCP8.5, with fluctuatingoutcomes if the medium term (bothRCP4.5 and RCP8.5) and long termRCP4.5 are considered. A transitiontoward more severe classes ofstreamflow drought is noticeablefrom Streamflow Drought Index(SDI). Natural Variation of PotentialWater Resources (NVPWR) andStorage Yield Curve (SYC) indicatorssuggest a progressively lowerreliability in water resources, withreduced total volume discharge and
increased duration of low flowperiods, respectively. Caution is duein considering NVPWR indicator asbased on monthly FDCs that missesthe daily variability; the sameattention is valid for the Sustainabilityof the Minimum Environmental Flowindicator, which however confirmsmore serious conditions to beexpected for the maintenance of theecological function of water on thelong term RCP8.5. Less informative,also because of the climate regime of the Pilot area (from arid sub-humid to arid, with many seasonalrivers) and its hydrogeologicalcomposition (karstic undergroundaquifers), is the indicator Base FlowIndex representing the undergroundcomponent contributing to the riverstreamflow, that was estimated ascurrently extremely low, and notreally significant under future climate,so that changes are not noticeable.
The assessment of risk due tohydrological drought (Module 4) forthe irrigation compartment in Pugliawas based on the evaluation of thechange of available volume ofsurface water distributed for theirrigation purposes from upstreamreservoirs (Table 5.2) to thedownstream Reclamation Consortia,
for the different time frame andemission scenarios. The analysis wasbased on the Regional RiskAssessment method (Landis 2005)and the risk results from theinteraction of hazard, exposure andvulnerability (IPCC 2014).
Results confirmed the generaltendency of a decrease of wateravailability for irrigation purposes:the three Consortia will not be ableto fulfill completely their pattern ofwater demand with differentmagnitude according to the specificemission scenario and time-frame.Generally, the RCP8.5 within the2041-2070 timeframe was assessedto be the most severe scenario forthe hazard and risk scoring. Inparticular, the northern part of thePuglia region will be the mostaffected from the hazard: theCapitanata Consortium will sufferfrom a severe decrease of waterwith a hazard score from 0.19(RCP4.5, 2021-2050) to 0.46 (RCP8.5,2041-2070). This means that in theworst scenario it will be able to fulfill54% of its current water demand.
The simulation results for the centralPuglia region, where two Consortiaare present, was slightly better, with
16
Table 5.3 - Results of the Stat-RO indicator for the analyzed dams. For the legend see Table 5.2.
Stat-Ro Dam River Water use2021-2050 2041-2070
RCP4.5 RCP8.5 RCP4.5 RCP8.5
Occhito Fortore Human-Industrial-Agriculture -27,9 -36,5 -35,5 -51,9
Locone Ofanto Human-Agriculture -19,9 -19,2 -24,0 -31,0
Marana Capacciotti Ofanto Agriculture -13,6 -8,8 -2,1 -23,7
Traversa Santa Venere Ofanto Agriculture-Industrial -29,3 -40,4 -37,5 -53,4
San Giusto o Capaccio Candelaro Industrial -16,8 -13,2 -24,9 -31,2
San Giuliano Bradano Agriculture -18,6 -22,3 -27,9 -40,3
Pertusillo Agri Human -16,9 -25,8 -26,8 -40,5
Monte Cotugno Sinni Human-Industrial-Agriculture -27,2 -30,4 -35,2 -46,0
Occhito Fortore Human-Industrial-Agriculture -29,7 -31,5 -30,6 -46,9
Locone Ofanto Human-Agriculture -20,9 -29,7 -28,4 -41,4
Marana Capacciotti Ofanto Agriculture -25,9 -41,8 -25,2 -50,1
Traversa Santa Venere Ofanto Agriculture-Industrial -33,9 -30,5 -38,9 -56,2
San Giusto o Capaccio Candelaro Industrial 6,4 3,0 -29,1 -23,9
San Giuliano Bradano Agriculture -21,4 -39,5 -38,1 -56,1
Pertusillo Agri Human -27,1 -31,3 -39,0 -47,0
Monte Cotugno Sinni Human-Industrial-Agriculture -24,0 -34,2 -36,2 -49,3
% c
hang
e in
mea
n%
cha
nge
in 1
0thpc
tl
a decrease of water availabilityranging from 9% (Terre d’Apulia,RCP4.5, 2021-2050) to 35% (Terred’Apulia, RCP8.5, 2041-2070).
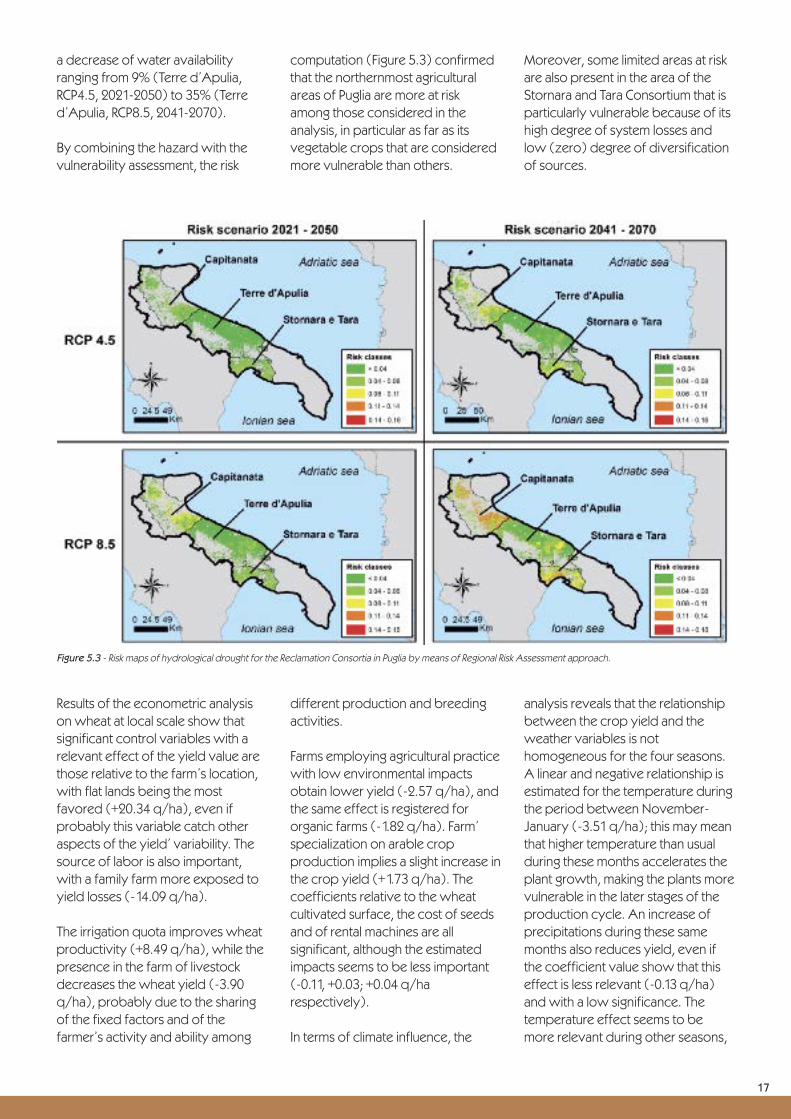
By combining the hazard with thevulnerability assessment, the risk
computation (Figure 5.3) confirmedthat the northernmost agriculturalareas of Puglia are more at riskamong those considered in theanalysis, in particular as far as itsvegetable crops that are consideredmore vulnerable than others.
Moreover, some limited areas at riskare also present in the area of theStornara and Tara Consortium that isparticularly vulnerable because of itshigh degree of system losses andlow (zero) degree of diversificationof sources.
17
Figure 5.3 - Risk maps of hydrological drought for the Reclamation Consortia in Puglia by means of Regional Risk Assessment approach.
Results of the econometric analysison wheat at local scale show thatsignificant control variables with arelevant effect of the yield value arethose relative to the farm’s location,with flat lands being the mostfavored (+20.34 q/ha), even ifprobably this variable catch otheraspects of the yield’ variability. Thesource of labor is also important,with a family farm more exposed toyield losses (-14.09 q/ha).
The irrigation quota improves wheatproductivity (+8.49 q/ha), while thepresence in the farm of livestockdecreases the wheat yield (-3.90q/ha), probably due to the sharingof the fixed factors and of thefarmer’s activity and ability among
different production and breedingactivities.
Farms employing agricultural practicewith low environmental impactsobtain lower yield (-2.57 q/ha), andthe same effect is registered fororganic farms (-1.82 q/ha). Farm’specialization on arable cropproduction implies a slight increase inthe crop yield (+1.73 q/ha). Thecoefficients relative to the wheatcultivated surface, the cost of seedsand of rental machines are allsignificant, although the estimatedimpacts seems to be less important(-0.11, +0.03; +0.04 q/harespectively).
In terms of climate influence, the
analysis reveals that the relationshipbetween the crop yield and theweather variables is nothomogeneous for the four seasons.A linear and negative relationship isestimated for the temperature duringthe period between November-January (-3.51 q/ha); this may meanthat higher temperature than usualduring these months accelerates theplant growth, making the plants morevulnerable in the later stages of theproduction cycle. An increase ofprecipitations during these samemonths also reduces yield, even ifthe coefficient value show that thiseffect is less relevant (-0.13 q/ha)and with a low significance. Thetemperature effect seems to bemore relevant during other seasons,

18
such as in the period March-May(+15.22 q/ha) and June-August(+11.99 q/ha). The role ofprecipitations is positive, but lessimportant, for the period June-August (+0.14 q/ha) andSeptember-November (+0.02q/ha). The coefficient of theinteraction between temperatureand precipitation is also relevant forall the season, especially inNovember-January and except forthe months September-November.
The risk assessment on coastal areas(Module 5; Annex A.4) was focusedon SLR projections related to theRCP8.5 scenario, selected as theworst emission scenario, with meansea level anomalies offshore thePuglia region of about 10 cm for thetimeframe 2021-2050 and 21 cm forthe timeframe 2041-2070.Resulting hazard maps showed thatonly 2% of coastal areas of the PugliaRegion is hazard prone both for themid-term and the long-termscenarios. Most of these areas arelocated near the Lesina-Varano lakes(about 9 km2) and in the Gulf ofManfredonia, where about 13 km2 ofthe territory is prone to hazard. Riskmapping in these sub-areas allowedto identify wetlands (including theSalinas of Margherita di Savoia) andprotected areas as higher risk targets,with relevant percentages of thesurface that could be submerged bysea-level rise projections.
Lesina-Varano and Manfredoniaareas represents 12% and 6% of thesurface at risk (low and very low risk
classes) for the receptor “beaches”.Considering the total length of thePuglia coastline (865 km), about 25%(212 km) resulted to be at risk (lowand very low risk classes) in the mid-term scenario, up to 29% (250 km) inthe long-term sea-level rise scenario.
Risk maps and statistics for beachesand wetlands, can be used tosupport coastal managers andadministrators to identify naturalsystems potentially submerged(and/or retreating) in relation withfuture sea-level rise and to defineappropriate adaptation or pathways(e.g. construction of artificialbarriers, nourishment, dunerestoration).
Despite the relatively low surface atrisk in both scenarios (i.e. up to 4.85km2 and 1.45 km2, respectively), riskmaps for agricultural areas andterrestrial biological systems can beuseful to localize the territory thatcould be affected by losses ofproductivity or ecosystem servicesdue to sea-level rise inundation,where adaptation measures (e.g. shift to salt tolerant agriculturalcrops, reforestation in areas not atrisk) could be required.
All results, besides being betterdescribed in the Annexes, areshared through the project DataPlatform, also linked to EuropeanClimate Adaptation platform(Climate-ADAPT; http://climate-adapt.eea.europa.eu/).

Stakeholderparticipation
19
In order to enable stakeholders,decision makers and their technicalstaff, to actively guide in theformulation of Pilot Study activitiessuch as selecting data and indicatorsand collecting their feedbacks interms of needs (data access, formatsetc.) and project results, twoworkshops were organized in themiddle and the end of the project.
The first workshop, held on October24th 2013 in Bari at the RegionalGovernment premises, wasconceived as a consultation withstakeholders selected amongtechnical agencies and researchinstitutions working onenvironmental, water resources andagricultural issues (ARPA Puglia,IAMB, CNR), plus regional authoritiesand services (River Basin and CivilProtection), already active andexperienced in using data anddeveloping methods for monitoringterritorial vulnerability and risk.
The main goal of the first workshopwas sharing information on apreliminary selection of indicators in order to collect doubts and/orsuggestions for a final set ofindicators, considered feasible asmeasurable, verifiable andrepeatable without the need forexcessively sophisticated post-processing tools or infrastructures.Moreover indicators need to berepresentative of the area under
study and valuable to synthesize thescientific information on climatechange and its impacts and risks tolocal experts, technicians and policymakers.
Besides presentations about theoverall OrientGate project,highlighting similarities anddifferences of Puglia with other SEEterritories, and about approaches,tools and data to be provided fromthe Pilot Study, a questionnaire wasdistributed to explore: i) theawareness of topics treated; ii) thedegree of access and use of data adtools; iii) the familiarity withterminology on vulnerability, risk andadaptation; iv) the knowledge of theEU Climate-Adapt platform. Theanswers to the questionnaire and theconducted debate with discussionsregarding the main issues andapproaches, revealed manyinteresting points:l All participants commented thatPuglia is (very) highly affected byclimate change and extremes; mostof them recognized that agriculturaland domestic water uses are themost impacted sectors, but alsocoasts require protection againsterosion, sea level rise, seawaterintrusion and safeguard of tourism.l Most produced and accesseddata are on climate, land use,agriculture, hydrology, whileinformation about socio-economy is less used and widespread. Severalpieces of advice were given bytechnical staff on the reliability andcompleteness of all this data.l Impact models/tools are moreknown and used than those onclimate, and GIS-based databasemanagement and interface seemnowadays common for applicationof models and tools.l Participants said that usefuloutput types for decision makingcould be first descriptive statistics,then probability-based. In terms offormat, maps are morecomprehensible and immediate thangraphs or tables, better if underqualitative classification (e.g. fromnull to extreme risk) rather than with
absolute values. It is highlighted howpursuing the best way tocommunicate results is crucial toavoid that the use of information ispostponed or abandoned. l Vulnerability and risk conceptsseem equally known even if someconfusion and misunderstandingwas discovered during the groupdiscussion.l Environmental, water resourcesand agriculture themes are wellcovered by regional agencies butparticipants highlighted that thesethemes are often neglecting climatechange with very few initiatives forits consideration in the regionaldirectives.l EU Climate-Adapt platform is not yet really known, and isconsidered as needing a lot ofimprovements in terms ofsimplification, instructions andterritorial representativeness.l Further projects and/orcollaborations among the workshopparticipants have been recognizedof interest, like the importance ofcoupling water quantity and qualitytopics, the consideration of theopposite extremes (i.e. floods) orfluctuation among droughts/floods,and the focus on specific areas ofthe region already identifiedvulnerable.
After this first workshop, someexchanges continued among projectpartners and technical offices,especially to share and havesuggestions on data to be used, their limits and contingency plans.
A second two-day event was heldin Bari on November 11th - 12th 2014and comprised a first workshop forpolicy makers, to present overallresults in terms of projected climatescenarios for the next decades,potential new trends in extremeevents of the area, and theintegrated approach developed and applied to gain a widerunderstanding of the effects ofclimate change and to supply usefulinformation for adaptation strategiesin collaboration with the local

stakeholders. A questionnaire wascirculated to monitor likely changesin conditions detected one yearbefore, and the points above werelargely confirmed, especially aboutperception of climate change andmore frequent extremes,incompleteness and scarce accuracyof multi-thematic data, and about themissing knowledge of Climate-Adaptor other platforms-initiatives.
During the second day, a trainingseminar was conducted especiallyfor experts and technicians of publicbodies and territorial agencies, aswell as for private companies, firstpresenting more technical detailsabout methodology and results, and then organizing two sessions topromote practice on droughtindicator calculation and on RRA andon the DSS DESYCO used to evaluateclimate change vulnerability and riskcoastal areas. Two questionnaireswere also circulated to collectfeedbacks on what have beenpresented during the workshop.
Concerning water resources thesurvey revealed a strong perceptionof agro-hydrological droughts andtheir physical and socio-economicconsequences, and participantsjudged that the synthesis of methodsand results through indicators anduser friendly tools seems highlycomprehensive and promising whenall the limits and advantages of the
approach are made clear.
Besides evaluating risks for domesticuse and ecological functions ofwater, more emphasis ongroundwater and water distributioninfrastructures is desired, as well asfocusing on local agriculturalproduction systems is stronglysuggested for next studies. Both thespatial and temporal resolution of theanalysis should be increased in thefuture, with the need to focus on theshorter term, also including morelocal scenarios based on socio-economic local trends.
The questionnaire concerning coastalareas was distributed during thesecond workshop with the aim toevaluate the usefulness of sea-levelrise inundation risk indicators andmaps for local stakeholders of thePuglia region. The questionnaire wasstructured in three main sectionscovering the input data used in theassessment, the step by stepapplication performed (i.e. hazard,exposure, vulnerability and riskassessment); and finally, thetypology/format of outputproduced. The questionnaire and thedebate which occurred during theworkshop confirmed thatstakeholders almost entirely agreedwith the input dataset used in the riskassessment. However, some of themsuggested to consider higherresolution data including a more
detailed Digital Terrain Model (e.g. laser scanning data) and moreprecise information on the coastalgeomorphology and morphotype at the local/administrative scale.
The receptors considered in theexposure assessment wereconsidered almost exhaustive,however some stakeholderssuggested to localize the receptorsusing a more detailed scale (i.e. localrather than regional) and to includealso tourism and related elements(i.e. accommodation facilities,equipped beaches, docks andtouristic ports) as key elements atrisk. As far as future hazard scenariosare concerned, stakeholderssuggested to consider also a shorterterm scenario and to include someassumptions about phenomenahappening at local level (i.e. stormsurges, extreme events, subsidencerate) in the assessment. Somestakeholders suggested additionalareas suitable to be included in thecoastal risk assessment, like theprotected areas of Torre Guaceto,and also some beaches located inthe Ionian side of the region. Finally,all the involved stakeholders wereinterested in integrating the analysiswith an evaluation of the potentialdamages related with sea-level riseinundation, especially for whatconcerns the wetlands and theSalinas of Margherita di Savoia andthe agricultural areas.
20

Frequent meetings allowed constantinteractions among the three Pilots ofThematic Center 2 on Drought, Waterand Coasts, facilitating partners toimplement the Pilot Studies andmaking their outcomes comparableand harmonized in order to beintegrated in the production of thefinal project results.
Initially it was jointly decided to finda common strategy for consideringa plausible range of futuredevelopments by adopting climateprojections under multiple scenariosand time frames, i.e. a medium-termmore relevant for policy and alongtermto emphasize divergence inresults among emission scenarios.All future time frames needed to becompared to a baseline referenceperiod covering as much as possiblethe recent decades, like 1976-2005or 1981-2010, being aware that, fromthe climate modeling side, the RCMsused simulated GHG emissions from2006 onwards. Thematic Center 2participants decided together the listof required climate variables andtheir formatting to be provided, alsodiscussing technical details in termsof needed software or tools to
manipulate such data.Still concerning climate projections,downscaling and bias-correctionissues were widely debated amongThematic Center 2 participants to findthe right compromise between scaleof Pilots’ areas, the resolution of RCMprojections (inhomogeneous amongPilots), and the availability ofobserved data for validation.From a conceptual point of view,it was discussed how to reach asimilar methodological structure toquantify vulnerability and/or risksfor each pilot study, via appropriateindicators. It was understood thatthere are few (at least 2, i.e. fromUNISDR and IPCC) differentapproaches that can be adopted.Since many difficulties arise frompotential misunderstandings, as thedefinitions of “vulnerability” and“risks” are often confusing andpotentially overlapping, anexplanation of the terminologies waspromoted, guiding the partners toapproach one of the twoframeworks, but recognizing that thedifferent Pilots can prefer one oranother approach (or a mixture ofboth), also depending onrequirements from stakeholders andtheir familiarity with the frameworks.
Given the strong connection amongthe three themes of TC2, drought,water and coasts, extensivediscussions were dedicated toclarifications and choices of suitableimpact indicators, like themeteorological drought indicatorsshared among Pilot Studies 3 and 4,and those based on streamflow incommon between Pilot Studies 3and 5. However, the full set ofindicators under calculation across allPilot Studies was continuouslyrevised to avoid redundancy ofindicators, misseddescription/references and inparticular to agree in theirclassifications into single/compoundindicators and into UNISDR or IPCCframeworks on vulnerability and risk.Not only similarities, but altodifferences among Pilots’ analyseswere carefully detailed, according to
their different purposes(irrigationdomesticwater use in Pilot 3,ecological water function in WP4,hydropower water use in Pilot 5)and use of data (e.g. including or nothuman water withdrawal in thewater cycle).
Interactions among Pilots alsoincluded feedbacks during theconstruction of the Data Platformstructure, providing advices on howeffectively link the platform to EUClimate-ADAPT or other existingweb visualization tools for easyaccess and consultation bystakeholders and policy makers.
21
Interactionsamong Thematic Center Pilots

22
In Puglia, water shortages,consequential imports from nearbyregions and overexploitation ofaquifers (whose composite effectsare expected to becomeunsustainable) are stronglyinterconnected.
Stakeholders relying on water shouldexploit present results and findings toencourage policy makers involved inwater resources management andprotection to consider the risk ofincreasingly frequent, intense andprolonged droughts that couldreduce the reliability of water yieldfrom dam infrastructures, and coulddeplete the water table favoringsaline intrusion in coastal aquifers,both also facilitated by theaccelerating overexploitation.This requires a tailored planningtoward improved efficiency ofwater distribution which preventswater leaks and loss, and a moreregulated use of aquifers.
The issue of water availability isstrongly interacting with agriculture,so that stakeholders and decisionmakers in that sector first of all haveto face the risk of crop yield lossesdue to insufficient water availability,up to the impossibility of maintainingcurrent crop varieties if poorlyresistant to droughts, while more
rapid heat accumulation may favorcrops better adapted to newerclimate conditions. In this context,agricultural policies should supportadaptation by promoting the studyand development of efficientirrigation schemes that optimizewater input (e.g. emergencyirrigation) and reduce losses in watersupply. In addition, to enhance wateruse efficiency, techniques toimprove soil fertility and waterholding capacity should bepromoted (e.g. minimum mechanicalsoil disturbance), as well as theresearch and demonstration onpotential new cultivars, and theircorrect management, and moreefficient farming practices. This canbe done through rural developmentprogrammes or other regional/localfunding schemes.
Shifting dates of sowing/harvestingcould be also a strategy to adaptmost vulnerable crops into temporalwindows more suited to cropdevelopment, as well as investigatingthe potential and favoring the use ofalternative water sources (e.g. wastewater), and developingmeteorological alert warningservices to timely activate irrigationapplications.
Hazard and risk maps produced forthe coastal area of Puglia can beconsidered as a screening tool tomake a first-pass assessment ofcritical vulnerabilities associated tosea level rise in the case study.The products can support decisionmaking and coastal managementin a wide range of situations(e.g. shoreline planning, land useand natural resources management)and can be used to mainstreamclimate adaptation in the definitionof plans, policies and programs atthe regional scale.
Regional policy makers must take intoconsideration these crosscuttingthemes and sectors and shouldinvest: in raising awareness onhazard occurrence and vulnerabilityof society, economic sectors,
ecosystem services and theenvironment; in the improvementand provision of technicalinformation and data; and in theestablishment of monitoringprogrammes and networks.Overall, it is recommended to: i)promote and conduct furtherinvestigations, building on thepresented approaches andmodelling chain, exploiting indicatorsand their integration into regional riskassessment procedures, andincluding complex topics requiringparticular attention as e.g.groundwater depletion, sea waterintrusion, competition for waterresources, water quality, coastalerosion; and ii) enlarge the analysisso to include alternative scenariosand time frames, have a morecomprehensive view of likely futureoutlooks, and sustain a more robustsystem for supporting decisions.
Translating results intoactions

23
A
A.1.1 INTRODUCTION
A set of climate projections produced in OrientGate with the RCM COSMO-CLM (Rockel and Geyer 2008), at 0.0715° of horizontal resolution (about 8km) for theItalian and nearby territories as shown in Figure A1.1,served as basis for impact to risk analyses in the PilotStudy in Puglia.
COSMO-CLM simulations were conducted in theconfiguration optimized at CMCC (Bucchignani et al.2013), and using as boundary conditions the outputs of the GCM CMCC-CM (Scoccimarro et al. 2011) from theCMIP5 experiment (http://cmip-pcmdi.llnl.gov/cmip5/),under 20C3M emission forcing for the period 1971-2005and under RCP4.5 and RCP8.5 emission scenarios for 2006to 2070. From COSMO-CLM simulations, daily series ofmeteorological variables have been post-processed and delivered by CMCC for the Pilot area to feed the successive analyses on impacts and risks.
According to the spatial discretization of the impactanalyses, at gridded level for meteorological andagricultural drought and at basin level for hydrologicaldrought, first simulations have been bias-corrected fortemperature (minimum, maximum) and precipitationfields, at two levels:lGridded level. The daily series of the E-OBS
dataset (v10.0;http://www.ecad.eu/download/ensembles/ensembles.php) were first converted into monthly series. Tomaintain the high spatial detail allowed by COSMO-CLM,the original resolution of E-OBS (0.25°) was resampled tothe one of the COSMO-CLM simulation grid, using abilinear interpolation technique.l Station level. Observed monthly series of minimumand maximum temperature and precipitation, and ofnumber of wet days, as provided by the Civil ProtectionService of Puglia up to 2011(http://www.protezionecivile.puglia.it/public/page.php?73) were used to downscale and correct COSMO-CLM simulations at the sites of several stations (31 forprecipitation; 21 for temperature) chosen according totwo main criteria: i) they are located in the watershedsconsidered for the hydrological modeling (see AnnexA.3); and ii) their time series are quite complete along thebaseline period considered.
In both cases the modified Linear Scaling methoddescribed in Sperna Weiland et al. (2010) was applied forbias-correction, by first computing the anomaliesbetween modeled (COSMO-CLM) and observed (stationor gridded level) monthly climatological average ofmaximum and minimum temperature and of precipitationamount along the 1972-2005 time frame. Then thesemonthly anomalies (handled as an addition andmultiplication factor for temperature and precipitation,respectively) were back applied to the daily time series oforiginal model data to obtain corrected time series. Withrespect to the original methods, an in depth analysistailored to the study area allowed to set a threshold valuefor the multiplicative factor equal to 4 instead of 10.Moreover, the approach proposed by (Teutschbein andSeibert 2012) was used to adjust the wet-day frequency,taking into account observed monthly number of wetdays in the bias-correction.
The climate change signal is generally similar among theoriginal RCM outputs and the corrected values, indicatingthe capability of this bias-correction technique topreserve the signal of the RCM. Concerning the correctionof other variables (e.g. solar radiation, wind speed,relative humidity), even if strategic for impact studies,literature does not provide well assessed approaches,thus specific choices were made for analyses alsoinvolving such variables and details are given in thespecific impact analysis description annexes.
A.1.2 CLIMATE INDICATORS
Corrected data were first used to calculate some climate(including extreme) indicators at gridded level.According to climate simulations and correction, allindicators were assessed for the baseline period (1976-
Annex A.1
Details on climatesimulations and indices
Figure A1.1 - Domain of COSMO-CLM simulations at about 8 km horizontal resolution. Black oval indicates the location of the Pilot Study 3.
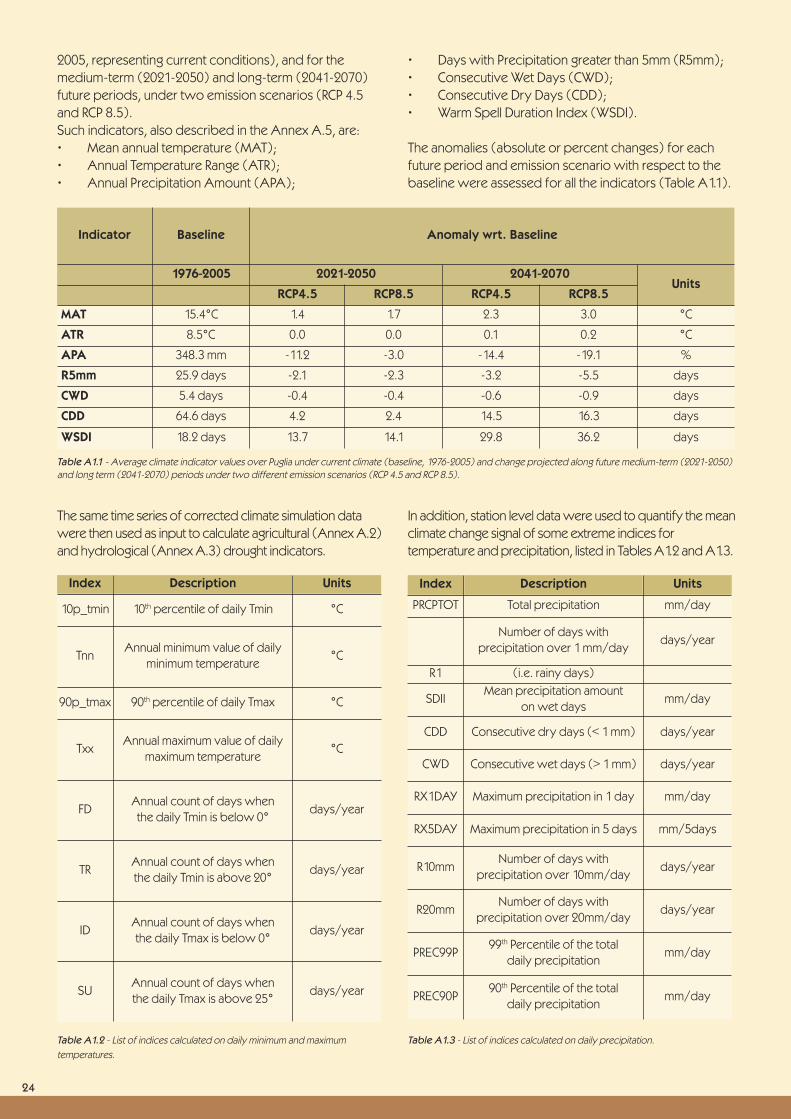
2005, representing current conditions), and for themedium-term (2021-2050) and long-term (2041-2070)future periods, under two emission scenarios (RCP 4.5and RCP 8.5). Such indicators, also described in the Annex A.5, are:• Mean annual temperature (MAT);• Annual Temperature Range (ATR); • Annual Precipitation Amount (APA);
• Days with Precipitation greater than 5mm (R5mm);• Consecutive Wet Days (CWD);• Consecutive Dry Days (CDD);• Warm Spell Duration Index (WSDI).
The anomalies (absolute or percent changes) for each future period and emission scenario with respect to thebaseline were assessed for all the indicators (Table A1.1).
Indicator Baseline Anomaly wrt. Baseline
1976-2005 2021-2050 2041-2070Units
RCP4.5 RCP8.5 RCP4.5 RCP8.5
MAT 15.4°C 1.4 1.7 2.3 3.0 °C
ATR 8.5°C 0.0 0.0 0.1 0.2 °C
APA 348.3 mm -11.2 -3.0 -14.4 -19.1 %
R5mm 25.9 days -2.1 -2.3 -3.2 -5.5 days
CWD 5.4 days -0.4 -0.4 -0.6 -0.9 days
CDD 64.6 days 4.2 2.4 14.5 16.3 days
WSDI 18.2 days 13.7 14.1 29.8 36.2 days
Table A1.1 - Average climate indicator values over Puglia under current climate (baseline, 1976-2005) and change projected along future medium-term (2021-2050) and long term (2041-2070) periods under two different emission scenarios (RCP 4.5 and RCP 8.5).
The same time series of corrected climate simulation datawere then used as input to calculate agricultural (Annex A.2)and hydrological (Annex A.3) drought indicators.
In addition, station level data were used to quantify the meanclimate change signal of some extreme indices fortemperature and precipitation, listed in Tables A1.2 and A1.3.
Index Description Units
10p_tmin 10th percentile of daily Tmin °C
TnnAnnual minimum value of daily
minimum temperature°C
90p_tmax 90th percentile of daily Tmax °C
TxxAnnual maximum value of daily
maximum temperature°C
FDAnnual count of days when
the daily Tmin is below 0°days/year
TRAnnual count of days when the daily Tmin is above 20°
days/year
IDAnnual count of days when the daily Tmax is below 0°
days/year
SUAnnual count of days when the daily Tmax is above 25°
days/year
Index Description Units
PRCPTOT Total precipitation mm/day
Number of days with precipitation over 1 mm/day
days/year
R1 (i.e. rainy days)
SDIIMean precipitation amount
on wet daysmm/day
CDD Consecutive dry days (< 1 mm) days/year
CWD Consecutive wet days (> 1 mm) days/year
RX1DAY Maximum precipitation in 1 day mm/day
RX5DAY Maximum precipitation in 5 days mm/5days
R10mmNumber of days with
precipitation over 10mm/daydays/year
R20mmNumber of days with
precipitation over 20mm/daydays/year
PREC99P99th Percentile of the total
daily precipitationmm/day
PREC90P90th Percentile of the total
daily precipitationmm/day
Table A1.2 - List of indices calculated on daily minimum and maximum temperatures.
Table A1.3 - List of indices calculated on daily precipitation.
24

25
The average climate change signal projected fortemperature (Figure A1.2) indicates a significant increaseof both minimum and maximum temperature for allconsidered indices. Moreover, there is a decrease offrost days (FD) and icing days (ID) and an increase ofsummer days (SU) and tropical nights (TR).
The comparison between the RCP4.5 and RCP8.5scenarios indicates that in all the cases the sign of theclimate change signal remains the same, but themagnitude of the change is much higher for the RCP8.5. The climate change signal projected for precipitation
(Figure A1.3) indicates a general decrease of totalprecipitation, number of rainy days, consecutive wetdays, number of days with precipitation over 10 and 20mm/day, 90th and 99th percentiles, while there is a generalincrease of mean precipitation amount on wet days (SDII),consecutive dry days (CDD) and maximum ofprecipitation in one and five days (RX1DAY and RX5DAY).
The comparison between the RCP4.5 and RCP8.5scenarios indicates that, except for one case, the sign of the climate change signal remains the same, and againmore evident under RCP8.5.
Figure A1.2 - Mean changes of indices based on minimum and maximum temperature across time frames and scenarios.
Figure A1.3 - Mean changes of indices based on precipitation across time frames and scenarios.

26
REFERENCES
Bucchignani E., Mercogliano P., Montesarchio M., Manzi M.P., Zollo A.L. (2013) Performance evaluation of COSMO-CLM over Italy and climate projections for the XXI century, in: Climate change and its implicationson ecosystem and society (Proceedings of 1st SISCConference).
Rockel B., Geyer B. (2008) The performance of theregional climate model CLM in different climate regions,based on the example of precipitation, MeteorologischeZeitschrift 17(4), 487-498.
Scoccimarro E., Gualdi S., Bellucci A., Sanna A., Fogli P.G.,
Manzini E., Vichi M., Oddo P., Navarra A. (2011) Effectsof Tropical Cyclones on Ocean Heat Transport in a HighResolution Coupled General Circulation Model. Journal of Climate 24, 4368-4384.
Sperna Weiland F.C., van Beek L.P.H., Kwadijk J.C.J.,Bierkens M.F.P. (2010) The ability of a GCM-forcedhydrological model to reproduce global dischargevariability. Hydrology and Earth System Science 14, 1595-1621.
Teutschbein C., Seibert J. (2012) Bias correction of regionalclimate model simulations for hydrological climate-changeimpact studies: Review and evaluation of differentmethods. Journal of Hydrology, 456-457, 12–29.
A.2.1 INTRODUCTION
The objective of this Annex is employing and describing aset of climate indicators relevant to the agricultural sector,especially in terms of agricultural drought conditions, andreconstructing their trends based on high resolutionprojected climate change for the Puglia region. In particular, some agro-climate indicators are describedthat were applied in the Pilot Study to indicate climatechange impacts affecting irrigation water requirementsfor the most common irrigated crops cultivated in Puglia(such as vegetables, olive trees, fruit trees, grapevines).The implementation of these indicators in the Pilot Studysupported a more comprehensive water resource riskassessment in agriculture combining climate relatedhazards with exposure and vulnerability aspectsdepending on the characteristics of crops and waterdistribution systems.
A.2.2 DATA AND METHODS
A combination of monthly time series of temperature and precipitation, as bias-corrected from COSMO-CLMoutputs (see Annex A.1), were used to calculate severalyearly to monthly based agro-climate drought indicators,including those defining general heat accumulationconditions, water demand and water stress ofvegetation. Climate model data were processed with CDO (Climate Data Operator;
https://code.zmaw.de/projects/cdo), a collection of routines to manipulate and analyze mostly climate datafiles, including the standardized NetCDF climate modeldata format. Python scripts were thus used under theArcGIS environment (ESRI©) to convert monthly andannual averages into ESRI grids format and calculatepotential evapotranspiration and soil moisture basedindicators via simple water balance algorithms.
All agro-climate indicators were calculated for thebaseline period (1976-2005, representing currentconditions), and for the medium-term (2021-2050) and long-term (2041-2070) future periods, under twoemission scenarios (RCP 4.5 and RCP 8.5; IPCC 2014). The main characteristics of these indicators are reportedin Annex A.5, and their meaning can be summarized asfollows.
l Growing Degree Days (GDD; °C) is a measure of heataccumulation used to predict crop growth anddevelopment rates, and it is defined as the cumulatedsum of temperature degrees for each day in the seasonabove a certain base temperature threshold. The basetemperature indicates the threshold above which cropgrowth takes place, and is most commonly assigned to10 °C for GDD calculation for most generic assessments,although it may vary for specific crops. GDD is used to define generic indications of suitability ofa region to crop climate requirements, to estimate lengthof growth stages and rates of crop development, predict
Annex A.2
Agriculturaldrought scenarios

27
planting dates and maturity, heat stress and best timing forfertilization and pesticide application.l Potential Evapo-Transpiration (PET; mm), it is a measureof the ability of the atmosphere to remove water throughEvapo-Transpiration (ET) processes. Among severalequations to estimate PET, the Hargreaves PotentialEvapo-Transpiration (PET-HA) model (Hargreaves 1994)was chosen as the most suitable as it requires a simplifiedparameterization based on temperatures, and performsalmost as well as other more complex methods requiringadditional climate parameters (Hargreaves et al. 2003),(like wind speed, relative humidity, solar radiation),whose accuracy is generally less reliable because alimited number of meteorological observations areavailable for validation and bias correction purposes.Hargreaves (1994) uses mean temperature (Tmean)mean temperature range (TD), available as biascorrected, and mean extra-terrestrial radiation (RA,radiation on top of atmosphere) to calculate mean PET, as shown below:PET−HA=0.0023∗RA∗Tmean+17.8∗TD0.5 (mm/day)Extra-terrestrial radiation (RA) is calculated using amethodology presented by Allen et al. (1998).Temperature range (TD) is an effective proxy to describethe effect of cloud cover on the quantity of radiationreaching the land surface and, as such, it describes morecomplex physical processes with easily available climatedata at high resolution.lAridity Index (AI; unitless), was used to quantifyprecipitation availability over atmospheric waterdemand, thus annual precipitation over annual PET(UNEP 1997). The Aridity Index shows moistureavailability for potential growth of vegetation excludingrunoff events when rainfall exceeds soil infiltration.UNEP (1997) breaks up Aridity Index, in the traditionalclimate classification scheme, as: < 0.03 “Hyper Arid”;0.03 - 0.2 “Arid”; 0.2 - 0.5 “Semi-Arid”; 0.5 - 0.65 “Drysub-humid”; > 0.65 “Humid”.
l Potential Soil Moisture Deficit (PSMD; mm) is a measureof the climatological wetness or dryness (Mkhwanazi2006; De Silva et al. 2007; Rodríguez Díaz et al. 2007) and it has been evaluated and used to quantify theimpacts of climate change on crop irrigation demand. To estimate PSMD, a monthly time-step water balancemodel was established, using spatial data on precipitationand PET. When monthly PET exceeds monthlyprecipitation, PSMD is cumulated month by month until amaximum PSMD is reached. The maximum PSMD is usedas agro-climatic indicator.
The anomalies (absolute or percent changes) for eachfuture period and emission scenario with respect to thebaseline were assessed for all the indicators.In order to delineate the explanatory capability of thePSMD in climate change impact studies for agriculture inthe pilot study, an analysis investigated the relationshipsbetween this indicator and the irrigation waterrequirements, on a provincial and regional basis, relyingon data derived from the latest Italian census onAgriculture (ISTAT 2012), which reflects conditions foragriculture and irrigation uses for the year 2010. Theanalysis concentrated on the main 4 irrigated crop typesfor the Puglia region, covering about 85% of the irrigatedland (Table A2.1): olive trees, grapevines, fruit trees andvegetable crops. Strong linear relationships betweenPSMD and irrigation needs have been verified: thegoodness of fit of the regression analysis using the R-squared method shows high levels of confidence (R2
0.62÷0.9), suggesting that the developed linearregression models at both scales (regional andprovincial) could be used for projecting how the changesof PSMD can reflect in changes of crop irrigationrequirements. The variation of PSMD has been thenrelated to variation of irrigation and scaled in classes ofimpact for the adoption and use in the Regional RiskAnalysis in agriculture, as described in the main text.
Irrigated Surface (Ha)
Crops Puglia Foggia Bari Taranto Brindisi Lecce Barletta-Andria-Trani
Vegetable crops 46,925 28,746 4,189 2,536 5,887 3,202 2,365
Olive trees 81,737 11,059 19,235 7,008 10,781 11 22,654
Grapevine 63,088 19,843 11,649 11,989 2,697 1,05 15,86
Fruit trees 12,231 1,219 6,115 547 607 161 3,582
Cereal for production of grains 14,926 8,749 821 1,773 1,499 1,293 792
Citrus 7,949 167 163 7,299 48 267 5
Sugar beet 3,644 3,603 4 36 - 1 -
Green fodder from arable land 3,517 1,517 144 900 311 628 17
Potato 1,377 427 417 46 7 443 36
Table A2.1 - Agricultural irrigated land (Ha) in Puglia, at regional and provincial level in year 2010 and by crop types (source ISTAT 2012). Only relevant irrigated crops, for which extent of irrigated area is greater than 1000 ha, were considered.

A.2.3 RESULTS
According to the climate change projections elaboratedwithin the Orientgate project, the Puglia region willundergo an average increase in mean annual temperatureof 1.4 to 1.7 °C in the medium- term (2021-2050, RCP4.5 toRCP8.5) and 2.3 to 3.0 °C in the long-term (2041-2070,RCP4.5 to RCP8.5). Seasonally, increases in temperaturewill be greater than annual averages in summer and fall,and lower in winter.
This increase in temperatures will lead to increasingevapotranspiration for both natural vegetation and crops.Increasing temperatures will also raise the heataccumulation, summarized as indicator by the GrowingDegree Days (Figure A2.1), which will shorten cropgrowing seasons. The projected precipitations, although
subject to model uncertainties, will show a moderateaverage decrease in the short term (10 to 40 mm/year)and slightly stronger decrease in the long term (50 to 66mm/year). Higher temperatures will increase potentialevapotranspiration, and consequently, together withreduced precipitations, will augment aridity conditions(Figure A2.3), soil water deficit (Figure A2.4) and thusfinal vegetation water requirements. The Potential SoilMoisture Deficit (PSMD), the soil water stress cumulatedduring the growing season, suggests increasing cropirrigation requirements, which need to be compensatedby larger (sustainable) water exploitation and/or wateruse efficient agronomic practices.
Results of calculated indicators, and anomalies as changecompared with baseline, are summarized in Table A2.2 asaverages for the whole Puglia.
Indicator Baseline Anomaly wrt. Baseline
1976-2005 2021-2050 2041-2070Units
RCP4.5 RCP8.5 RCP4.5 RCP8.5
GDD 2208 °C 18.9 22.3 31.5 41.8 °C
PET-HA 1007 mm 4.3 4.8 7.2 9.7 %
AI 0.4 -15.0 -7.5 -20.1 -26.1 %
PSMD 744 mm 8,7 6.9 13.5 19.2 %
Table A2.2 - Average agro-climate indicator values for the Puglia region under current climate (baseline, 1976-2005) and change projected along future medium-term (2021-2050) and long term (2041-2070) periods under two different emission scenarios (RCP 4.5 and RCP 8.5).
Figure A2.1 - Changes in annual GDD for future (average 2021-2050 and 2041-2070) as for two emission scenarios (RCP4.5 and RCP8.5) compared to baseline (average 1976-2005).
28
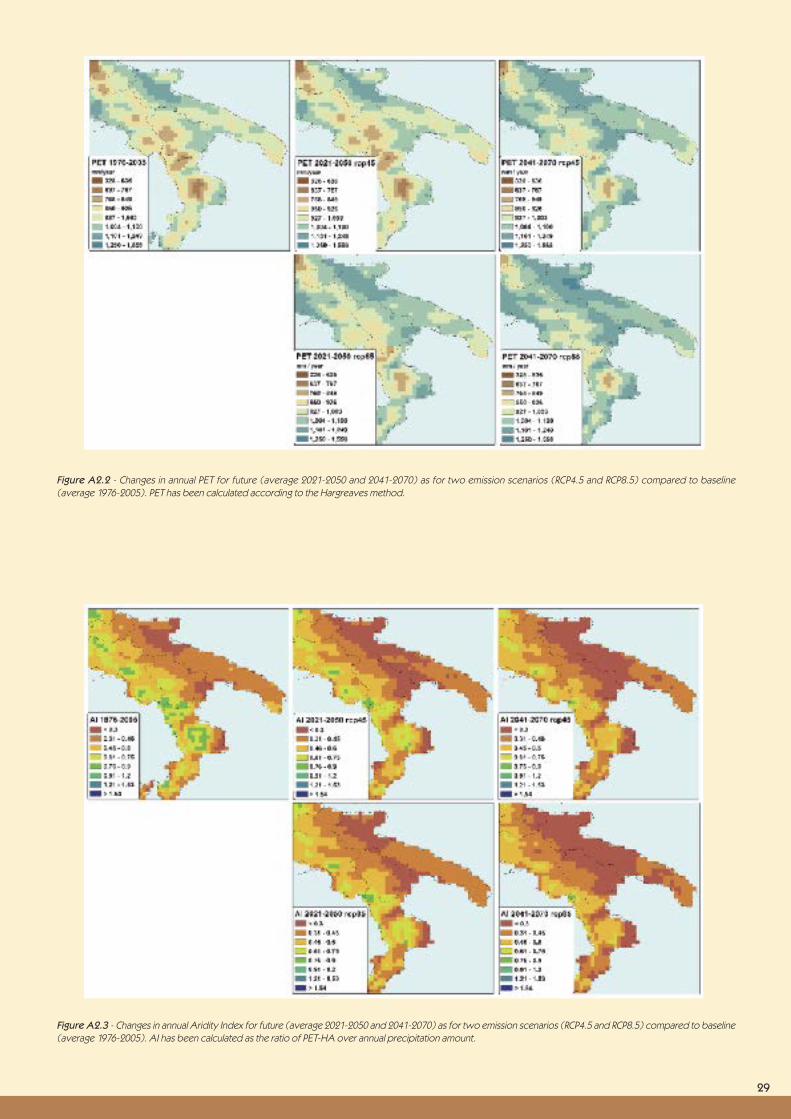
29
Figure A2.2 - Changes in annual PET for future (average 2021-2050 and 2041-2070) as for two emission scenarios (RCP4.5 and RCP8.5) compared to baseline (average 1976-2005). PET has been calculated according to the Hargreaves method.
Figure A2.3 - Changes in annual Aridity Index for future (average 2021-2050 and 2041-2070) as for two emission scenarios (RCP4.5 and RCP8.5) compared to baseline(average 1976-2005). AI has been calculated as the ratio of PET-HA over annual precipitation amount.

30
Figure A2.4 - Changes in Potential Soil Moisture Deficit for future (average 2021-2050 and 2041-2070) as for two emission scenarios (RCP4.5 and RCP8.5) compared tobaseline (average 1976-2005). PSMD is calculated as the maximum cumulated soil moisture deficit in a simplified monthly soil water budget.
REFERENCES
Allen R.G., Pereira L.S., Raes D. & Smith M. (1998) Cropevapotranspiration: Guidelines for computing croprequirements. Irrigation and Drainage Paper No. 56, FAO,Rome, Italy.
De Silva C. S., Weatherhead E. K. et al. (2007) Predictingthe impacts of climate change-A case study of paddyirrigation water requirements in Sri Lanka. AgriculturalWater Management 93(1-2): 19-29.
Hargreaves GH (1994) Defining and using referenceevapotranspiration. Journal of Irrigation and DrainageEngineering. ASCE 120(6): 1132-1139.
Hargreaves G.H., Allen R.G. (2003) History andevaluation of Hargreaves evapotranspiration equation. J. Irrig. Drain. Eng. ASCE 129 (1), 53-63.
IPCC (2014) Climate Change 2014: Impacts, Adaptation,and Vulnerability. Part A: Global and Sectoral Aspects.Contribution of Working Group II to the Fifth Assessment
Report of the Intergovernmental Panel on Climate Change[Field, C.B., V.R. Barros, D.J. Dokken, K.J. Mach, M.D.Mastrandrea, T.E. Bilir, M. Chatterjee, K.L. Ebi, Y.O.Estrada, R.C. Genova, B. Girma, E.S. Kissel, A.N. Levy, S. MacCracken, P.R. Mastrandrea, and L.L. White (eds.)].Cambridge University Press, Cambridge, United Kingdomand New York, NY, USA, 1132 pp.
ISTAT (2012) 6th Italian Agriculture Census.http://www.istat.it/it/censimento-agricoltura/agricoltura-2010 (accessed on July 2014).
Mkhwanazi M. (2006) Assessment of climate changeimpacts on irrigation requirements and productivity ofsugarcane in Swaziland. MSc Thesis, Cranfield University, UK.
Rodríguez Díaz J.A., Weatherhead E.K. et al. (2007)Climate change impacts on irrigation water requirementsin the Guadalquivir river basin in Spain. RegionalEnvironmental Change 7(3): 149-159.
UNEP (1997). World Atlas of Desertification 2ED.London, UNEP (United Nations Environment Program).

31
A.3.1 INTRODUCTION
The analysis on hydrological drought hazard assessmentand projections was conducted relying on climatesimulations produced in OrientGate and described inAnnex A.1. Daily series of these simulations allowed set up and running a semi-distributed hydrological modelproviding time series of runoff for selected basins andtheir sub-basins. Runoff data were post-processed andsynthetized into known or new formulated indicators ofhydrological droughts at watershed level for significantriver basins in Puglia, and for upstream drainage area ofseveral dams strategic for water accumulation servingdifferent purposes. In the following some details on themethodology are given and results presented anddiscussed.
A.3.2 DATA AND METHODS
A set of indicators to investigate the occurrence andattributes of hydrological drought episodes in Puglia wereselected and applied, building on their usefulnessestablished in previous studies, and thanks to exchangeswith stakeholders and other Pilots in OrientGate,especially Pilot Study 5; these interactions in fact favoredthe appropriate adoption of shared existing and newformulated indicators.
Hydrological drought indicators, whose characteristics arereported in Annex A.5, are all based on runoff (orstreamflow) series and their meaning can be summarized as:l Stat-RO (Statistics of RunOff), indicating streamflowtrends in terms of changes in average annual amount andin the 10th percentile, representing the low flow degree ofthe driest year in the considered period.l NVPWR (Natural Variation of Potential WaterResources), based on the (monthly) Flow Duration Curve(FDC), it represents changes in the area under the FDC,function of the frequency distribution of monthlydischarge values.l SMEF (Sustainability of Minimum Environmental Flow),based on the FDC, it indicates changes in the streamflowvalues actually having the frequency considered vital formaintaining the ecological function of water.
l SDI (Streamflow Drought Index), representing thefrequency of occurrence of episodes that deviates, withdifferent severity degrees, from the climatologicalaverage of runoff values, for different (3, 6, 9, 12 months)time periods.l SYCn (Storage Yield Curve, based on natural “n”streamflow); it indicates the area under the SYC,standardized over the mean annual runoff, andrepresenting the basin water yield achievable from ahypothetic given level of water storage.l BFI (Base Flow Index), indicating the portion of thestreamflow assumed being base flow, and probablyrepresenting the groundwater contribution tostreamflow.Runoff series to calculate above indicators for thebaseline and future periods/scenarios were obtained byhydrological modeling with ArcSWAT(http://swat.tamu.edu/software/arcswat/) driven bydaily series of bias-corrected simulated data withCOSMO-CLM (see Annex A.1). The model was firstparameterized in terms of topography, soil and landcover/use attributes into hydrological response units(HRUs), relying on the combination of three spatialdatasets: 1) the digital elevation model at 20 m resolution(source National Geographic Military Institute); 2) theland use layer from CORINE Land Cover product for 2006at 100 m resolution (http://www.eea.europa.eu/data-and-maps/data/corine-land-cover-2006-clc2006-100-m-version-12-2009); 3) the Harmonized World Soil datasetstoring soil attributes at 1 km resolution(http://webarchive.iiasa.ac.at/Research/LUC/External-World-soil-database/HTML/). To find a right compromiseamong the different spatial resolutions of such layers, aresampling to 100 m was conducted to then extract sub-basins polygons and their HRUs.
Given the limits in model calibration and validationbecause of lacking or incomplete series of river dischargecovering the same period of interest, the approachadopted was based on applying the monthlyclimatological anomaly calculated between modeled andobserved discharge to the full simulated time series ofrunoff, at eight important hydrological stations(considered sufficiently complete in terms of data), beingthe most downstream (i.e. closest to the outlet) of asmany significant river basins (Figure A3.1). Thesesignificant river basins, according to the Regional WaterProtection Master Plan, are: Fortore, Candelaro (and itstributaries Salsola and Celone - not shown in the Figure),Cervaro, Carapelle, Ofanto, Bradano.
Concerning the workability of indicators, for those based on annual to monthly climatological average ofstreamflow (Stat-RO, NVPWR, SMEF) basic statisticknowledge is necessary including construction ofmonthly FDC, for more complex indicators based onentire monthly (SDI, SYCn) or daily (BFI) time series,
Annex A.3
Hydrologicaldrought scenarios

32
Figure A3.1- Map showing the significant river basins (cyan boundaries) and the dams (wave icons and yellow labels) considered.
excel sheets were set up for easy application also by notexpert users, and tested in training seminars (See Sect. 6in the main text).
Stat-RO indicators were also calculated for the riversections corresponding to the location of eight dams(Figure A3.1) reported by the Feasibility study on theHydro-Potable balance (Regional Government and River
Basin Authority of Puglia 2012) as the ones providingwater for domestic, irrigation and industrial purposes.Two of these dams belong to another rivers’ systemlocated completely outside Puglia territory, the Agri-Sinni,that thus was included in the analysis on risks for waterresources, integrating quantitative information on waterdelivered and area irrigated from each wateraccumulation/diversion infrastructure.
A.3.3 RESULTS AND DISCUSSION
The simplest indicators calculated (Stat-RO) refer topercent changes in some descriptive statistics on annualinflows, among which the mean and the 10th percentile ofthe annual value of the climatological period have beenchosen to represent the overall superficial wateravailability and the one in the driest year, respectively;they are thus indicators of average trends. Concerningchanges in the annual average a worsening situation fromRCP4.5 to RCP8.5, and from medium term (2021-2050) tolong term (2041-2070) period is evident. The ‘moderatehazard’ (-25 % ≤ changes < -10%) dominates in theRCP4.5 (both periods) and in the medium term RCP8.5,with few ‘high hazard’ (-40 % ≤ changes < -25%) caseshowever affecting the most water providing rivers(Fortore and Ofanto). In the worst case scenario (longterm RCP8.5) there is a spread of ‘high hazard’ cases upto also occurrence (still for Fortore and Ofanto) of‘extremely high hazards’ (changes < -40%). In general,almost half of scenarios project ‘high’ to ‘extremely highhazards’.
In terms of driest years, results are very similar but moreworrying, if considering that ‘high hazard’ cases are more
occurring in the medium term, while in the long termperiods (under both emission scenarios) ‘high’ to‘extremely high hazards’ cover almost all the cases. The only exception is Candelaro river that, follows theworsening trend of other rivers although in a weaker way.In terms of driest year, highly worrying is the behavior,besides Fortore and Ofanto, of Bradano that supplyespecially water for domestic purposes through its dams.
These statistical indicators were also calculated for theupstream area of eight dams serving irrigation, domesticand industrial purposes. Results show that whenconcentrating on smaller and higher elevation parts of thebasins, changes (almost all reductions) appears morecritical, still with the exception of Candelaro but only inthe medium term period. The contrasting trends ofCandelaro both in terms of annual mean and driest yearoccurrence could be due to the fact that it is the one withthe largest surface under arid conditions among theinvestigated basins, so more seasonally variable in termsof inflow reliability, and this makes it more sensible tomore fluctuating changes in rainfall patterns.
Aggregated results on Stat-RO indicator, both for basinsand dams, are reported in the main text.
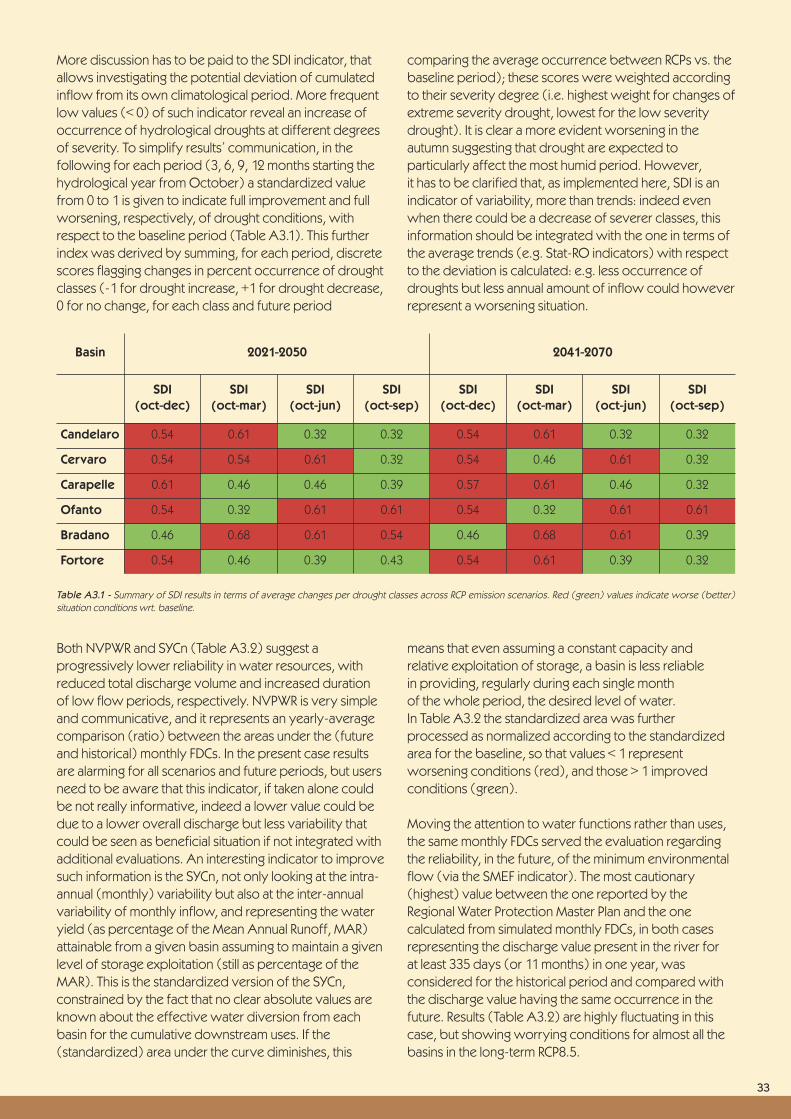
33
Both NVPWR and SYCn (Table A3.2) suggest aprogressively lower reliability in water resources, withreduced total discharge volume and increased durationof low flow periods, respectively. NVPWR is very simpleand communicative, and it represents an yearly-averagecomparison (ratio) between the areas under the (futureand historical) monthly FDCs. In the present case resultsare alarming for all scenarios and future periods, but usersneed to be aware that this indicator, if taken alone couldbe not really informative, indeed a lower value could bedue to a lower overall discharge but less variability thatcould be seen as beneficial situation if not integrated withadditional evaluations. An interesting indicator to improvesuch information is the SYCn, not only looking at the intra-annual (monthly) variability but also at the inter-annualvariability of monthly inflow, and representing the wateryield (as percentage of the Mean Annual Runoff, MAR)attainable from a given basin assuming to maintain a givenlevel of storage exploitation (still as percentage of theMAR). This is the standardized version of the SYCn,constrained by the fact that no clear absolute values areknown about the effective water diversion from eachbasin for the cumulative downstream uses. If the(standardized) area under the curve diminishes, this
means that even assuming a constant capacity andrelative exploitation of storage, a basin is less reliable in providing, regularly during each single month of the whole period, the desired level of water. In Table A3.2 the standardized area was furtherprocessed as normalized according to the standardizedarea for the baseline, so that values < 1 representworsening conditions (red), and those > 1 improvedconditions (green).
Moving the attention to water functions rather than uses,the same monthly FDCs served the evaluation regardingthe reliability, in the future, of the minimum environmentalflow (via the SMEF indicator). The most cautionary(highest) value between the one reported by theRegional Water Protection Master Plan and the onecalculated from simulated monthly FDCs, in both casesrepresenting the discharge value present in the river for at least 335 days (or 11 months) in one year, wasconsidered for the historical period and compared withthe discharge value having the same occurrence in thefuture. Results (Table A3.2) are highly fluctuating in thiscase, but showing worrying conditions for almost all thebasins in the long-term RCP8.5.
More discussion has to be paid to the SDI indicator, thatallows investigating the potential deviation of cumulatedinflow from its own climatological period. More frequentlow values (< 0) of such indicator reveal an increase ofoccurrence of hydrological droughts at different degreesof severity. To simplify results’ communication, in thefollowing for each period (3, 6, 9, 12 months starting thehydrological year from October) a standardized valuefrom 0 to 1 is given to indicate full improvement and fullworsening, respectively, of drought conditions, withrespect to the baseline period (Table A3.1). This furtherindex was derived by summing, for each period, discretescores flagging changes in percent occurrence of droughtclasses (-1 for drought increase, +1 for drought decrease,0 for no change, for each class and future period
comparing the average occurrence between RCPs vs. thebaseline period); these scores were weighted accordingto their severity degree (i.e. highest weight for changes ofextreme severity drought, lowest for the low severitydrought). It is clear a more evident worsening in theautumn suggesting that drought are expected toparticularly affect the most humid period. However, it has to be clarified that, as implemented here, SDI is anindicator of variability, more than trends: indeed evenwhen there could be a decrease of severer classes, thisinformation should be integrated with the one in terms ofthe average trends (e.g. Stat-RO indicators) with respectto the deviation is calculated: e.g. less occurrence ofdroughts but less annual amount of inflow could howeverrepresent a worsening situation.
Table A3.1 - Summary of SDI results in terms of average changes per drought classes across RCP emission scenarios. Red (green) values indicate worse (better) situation conditions wrt. baseline.
Basin 2021-2050 2041-2070
SDI (oct-dec)
SDI (oct-mar)
SDI (oct-jun)
SDI (oct-sep)
SDI (oct-dec)
SDI (oct-mar)
SDI (oct-jun)
SDI (oct-sep)
Candelaro 0.54 0.61 0.32 0.32 0.54 0.61 0.32 0.32
Cervaro 0.54 0.54 0.61 0.32 0.54 0.46 0.61 0.32
Carapelle 0.61 0.46 0.46 0.39 0.57 0.61 0.46 0.32
Ofanto 0.54 0.32 0.61 0.61 0.54 0.32 0.61 0.61
Bradano 0.46 0.68 0.61 0.54 0.46 0.68 0.61 0.39
Fortore 0.54 0.46 0.39 0.43 0.54 0.61 0.39 0.32

34
Less informative, also because of the climate regime ofthe Pilot area (from arid sub-humid to arid, with manyseasonal rivers) and its hydrogeological composition(karstic underground aquifers), is the indicator BFIrepresenting the underground component contributing tothe river streamflow, that was estimated currently verylow, and seems continuing to be not really significantunder future climate, so that changes are ratherimperceptible.
Being aware that caution is due in considering NVPWRand SMEF indicators as based on monthly FDCs, andconsidering the limitations of choosing indicators mostlybased on monthly inflow, thus missing the daily variability,all that was: i) dictated by the easier availability andusability of observed monthly series of meteorological(precipitation, temperature) and discharge data used forhydrological model calibration and validation; and ii)partially compensated by the less computationallyexpensive and more user-friendly tools developable forindicators’ calculation by not expert users. On the otherhand, the single indicator based on modeled dailystreamflow (BFI) could have suffered from the constraintof calibrating hydrological model parameters at monthlylevel rather than optimizing them for daily levelsimulations.
However, the noteworthy utility of the analysis ismaintained thanks to the consideration of informationcoming from different indicators, giving importance to
annual mean as well as to intra-annual and inter-annualvariability, thus avoid missing some key components ofthe complex system of water resources availability andvariability.
REFERENCES
Regional Government and River Basin Authority of Puglia(2012) Feasibility study on the Hydro-Potable balance and pr(it. Studio di fattibilità "Bilancio Idrico Potabile");http://www.regione.puglia.it/index.php?page=documenti&opz=getdoc&id=807.
BASIN Indicator RCP45_2021_2050 RCP45_2041_2070 RCP85_2021_2050 RCP85_2041_2070
Candelaro NVPWR 0.91 0.89 0.91 0.77
SYCn 0.39 0.52 0.89 0.34
SMVF 0.90 0.86 1.10 0.80
Cervaro NVPWR 0.81 0.71 0.79 0.63
SYCn 0.64 0.69 1.01 0.42
SMVF 1.75 1.30 1.77 1.12
Carapelle NVPWR 0.80 0.70 0.78 0.66
SYCn 0.83 0.96 1.31 0.79
SMVF 1.18 1.00 1.41 0.87
Ofanto NVPWR 0.70 0.64 0.69 0.58
SYCn 1.65 1.19 1.62 0.94
SMVF 1.09 0.89 1.06 0.71
Bradano NVPWR 0.82 0.77 0.88 0.66
SYCn 0.62 0.56 0.78 0.53
SMVF 1.03 0.90 1.05 0.60
Fortore NVPWR 0.70 0.63 0.63 0.50
SYCn 0.65 0.81 1.20 0.56
SMVF 0.92 1.02 1.27 0.97
Table A3.2 - Summary of NVPWR, SYCn and SMEF results. Red (green) values indicate worse (better) conditions wrt. baseline.

35
A.4.1 INTRODUCTION
Coastal zones represent highly vulnerable systems as theyare characterized by the equilibrium between terrestrialand aquatic environments, playing a crucial ecologic andsocio-economic role in the development and productionof ecosystem and productive services (e.g. agriculture,tourism, biodiversity, fishing, leisure) (IPCC 2014). Climatechange, with its potential negative effects (e.g. sea-levelrise inundation, drought, alteration in water quality andquantity), is posing additional pressures to this fragileenvironment and, together with increasing exposure andvulnerability patterns, can affect different coastal naturaland human systems and sectors causing losses anddamage both in monetary and not monetary terms.
The objective of this Annex is to describe the riskassessment approach applied for the identification and
prioritization of targets and hotspots at risk from sea-levelrise inundation in low-lying coastal areas of the Pugliaregion. Specifically, the report describes how RegionalRisk Assessment and the DEcision support SYstem forCOastal climate change impact assessment (DESYCO)were applied for the assessment of sea-level rise risk forsignificant targets in the Puglia coastal areas (i.e. beaches,wetlands, urban areas, agricultural areas, terrestrial andbiological systems) providing impact and risk indicatorsand maps for local stakeholders and coastal managers inthe case study. As described in Sect. 4.4 of the main text,the indicators and maps produced for coastal areas arepart of a broader approach developed for the Pugliacase study for the integrated assessment of climatechange impacts on water and coasts and provide a quickscan tool for the definition of adaptation priorities andpathways aimed at increasing the resilience of coastalsystems to climate change and at planning precautionarymeasures for the sustainable management of coastalresources, in view of climate change.
A.4.2 DATA AND METHODS
The methodological approach applied to evaluate coastalrisk was based on a Regional Risk Assessment procedurecomposed of four main phases (Figure A4.1) that -according to the latest definitions proposed by the IPCC(2014) and UNISDR (2009) - builds upon the main pillarsof risk (i.e. hazard, exposure and vulnerability).
Figure A4.1 - Main steps of the RRA methodology applied for the evaluation of sea-level rise inundation in coastal areas.
Annex A.4
Risk analysis forcoastal areas
INPUT DATA
Risk maps
RISK=f (H,E,V)
HazardAssessment
Hazard maps
Hazard metric:• Sea-level rise anomaliesPathway factor:
• Digital Elevation Model (DEM)
VulnerabilityAssessment
Vulnerability mapsPhysical and enviromental factors
ExposureAssessment
Exposure maps
Receptors• Beaches• Agricultural areas• Terrestral and biological systems• Wetlands• Protected areas
Relative RiskAssessment
36
The hazard assessment allows to identify low-lyingcoastal areas that could be potentially submerged by sea level rise, according to future climate scenarios.Considering the preferences of local stakeholders and thecoherence of choices across Pilot studies in the ThematicCenter 2 of OrientGate on Drought, Water and Coasts twothirty year periods were selected for the analysis: themedium-term timeframe 2021-2050 and the long terminterval 2041-2070.
The hazard assessment was performed aggregating sea-level rise projections for the medium and long termperiods, with topographic information coming fromDigital Elevation Model (DEM). Sea level rise anomalieswere provided by the Global Climate Model (GCM)CMCC-CM with a regular grid of about 80 km for the Euro-Mediterranean region. Specifically, for the consideredcase study area 12 grid points were selected in front ofthe coastline of Puglia region (Adriatic and Ionian sides).The analysis was focused on the results obtained for theRCP8.5 scenario, selected as the worst case with meansea level anomalies of about 10 cm for the timeframe2021-2050 and 21 cm for the timeframe 2041-2070. The hazard assessment was then performed applying a simplified approach that projects inland the sea waterheight (represented by the sea level anomalies) related tothe mid and long term scenarios (i.e. 10 and 21 cm), andinundates all land areas at an elevation below this levelusing the topographic information coming from the DEM.
The exposure and vulnerability assessment allowed toidentify and select the receptors (i.e. elements at risk) that can be subject to potential sea level rise inundation in the considered case study. For the Puglia case study the analysis was focused, considering the availability ofhomogeneous territorial data at the regional scale and thepriorities expressed by local stakeholders, on severalcoastal receptors including beaches, wetlands, urbanareas, protected areas, agricultural areas and terrestrialbiological systems. The following assessment ofvulnerability was focused on the evaluation of physical-environmental aspects determining the predisposition of a receptor to be adversely impacted by sea-level rise.Particularly, it was precautionary assumed that sea levelrise affects all the receptors in the same way, causing apermanent loss (submergence) of receptors based ontheir elevation. The same vulnerability score equal to 1was therefore assigned to each cell of the receptorslocalized in the case study area. Finally, the riskassessment phase integrated information about the sea-level rise hazard with the exposure andvulnerability of coastal receptors, in order to provide an integrated risk score, allowing to rank sub-areas at riskfrom permanent inundation due to sea level rise,according to the selected scenarios.The methodology to evaluate the effect of sea-level risein coastal areas was applied in Puglia by means of the
DEcision support SYstem for COastal climate changeimpact assessment (DESYCO) (Torresan et al. 2013).Considering the availability of data and projections for the Mediterranean Sea side within the OrientGate project(see Section 4 of the main text) and the spatial resolutionof the available data for the land side at the regional level(i.e. Regional Land Cover map (1:5.000); Digital ElevationModel 8m), the assessment was carried out at the meso-scale level (i.e. sub-national scale), adopting the landuse/land cover classes proposed by the CORINE LandCover dataset, as major spatial units of reference (Büttneret al. 2007). However, the methodology and the tool aresufficiently flexible to be applied at different spatial levels(e.g. micro scales) based on the purposes of theassessment, the geographical extent of the case studyand the level of detail of input dataset. Moreover, thespatial resolution of the assessment was performedbased on geographical units (i.e. raster cells) of 8m,representing the highest feasible detail according to theavailable land dataset. The geographical limits of theanalysis were set according to the Coastal Regional Plan(PCR) (2009). A region of about 2.563 km2 was defined,including a territory of variable length from the shoreline,following the pattern of important physical and socio-economic characteristics (i.e. geology, geomorphology,hydrography, vegetation system, presence of waterbodies and lagoons, human use) of the Puglia coastalsystems.
A.4.3 RESULTS
The application of the RRA methodology and DESYCO tothe case study area produced a range of risk maps andstatistics useful to synthesize the information aboutpotential land (and receptors) losses due to sea level rise,and to facilitate the communication of results tostakeholders and decision makers. For what concern thehazard assessment, most of the coastal zone of the casestudy area (i.e. about 98%) resulted to be not exposed tosea level rise inundation in future timeframes. Moreprecisely, only about 2 % of the coastal territory is hazardprone both for mid-term scenario (2021-2050) and forthe long term one (2041-2070).
The exposure assessment highlights that wetlands andprotected areas are widely represented in the case studyarea, especially in correspondence with the lakes ofLesina-Varano and the Gulf of Manfredonia. Agriculturalareas (i.e. permanent crops, stable meadow-pastures,arable land) are spread all over the coastal territory whileterrestrial and biological systems (i.e. natural grasslandsand meadows, shrubs and forests) are distributed insmall surfaces fragmented in the case study area. Finally,small surfaces of urban areas (i.e. residential, commercialand industrial areas) are located along the wholecoastline mainly in correspondence with touristic urban

37
centers (i.e. Manfredonia, Otranto, Gallipoli).After the assessment of hazard and exposure, the following analysis of risks was focused on theevaluation of receptors at higher risk to be submergedby sea-level rise. The ranking of targets at risk at theregional scale showed that urban areas present verysmall surfaces at risk (only about 0.35 km2 for the lowand 0.89 km2 for the medium SLR scenario). The otherreceptors (i.e. wetlands, protected areas, beaches,agricultural areas, terrestrial and biological systems) are mainly located in correspondence with Lesina and Varano lakes and around the Manfredonia Gulf,therefore specific statistics and maps of risk wereproduced for these two focus areas.The analysis showed that “wetlands” is the receptor
characterized by higher percentage, about 70%, of surface at risk for both scenarios and focus areas.Protected areas in Manfredonia show about 23% of surface at risk while only about 5% in Lesina-Varano. The receptor beaches, presents the 12% and 6% of surface at risk in Lesina and Manfredonia concentratedin small strips (10-40m) of territory in correspondence of low-lying sandy beaches (Figure A4.2).
The risk assessment for this receptor allowed to estimatealso the length (km) of beaches at risk to be submergedby rising sea-levels, at the regional scale. About 25% (212 km) of the total length of the Puglia shoreline (865km) resulted to be at risk (low and very low risk classes)in the mid-term scenario, up to 29% (250 km)
Figure A4.2 - Risk map for the receptor beaches, showing coastal parcels at risk in the focus area of Lesina- Varano, mid (a) and long-term scenario (b).
in the long-term sea-level rise scenario.
Finally, as far as agricultural areas are concerned, the surface at risk resulted less than the 4% (4.85 km2) in the ‘Lesina/Varano’ focus area; and about 1% in Manfredonia (2.89km2) while terrestrial biologicalsystems present less than 1% of surface at risk in the Lesina - Varano area and about 10% (1,45 km2) of surface at risk in the Manfredonia area.
A.4.4 CONCLUSIONThe spatially resolved regional risk assessment approachapplied to the coastal zone of the Puglia region allowedto produce screening risk maps and statistics supportingthe identification and ranking of key areas and sensitivetargets at risk to be permanently submerged by sea-levelrise. The present assessment provides a first step analysisof potentially submerged areas, however, the resultscould be refined with higher resolution territorial data
38
(e.g. high resolution laser scanning data) and with theevaluation of the role of existing defense barriers andsubsidence phenomena influencing hazard intensity andexposure at the local scale. Moreover, a multi-stressorperspective should be adopted with the aim to provide a more integrated view of the multiple threats and coastaldynamics related to climate change in the investigatedarea (e.g. coastal erosion, storm surges, salt waterinclusion into groundwater). Finally, considering theimportance of specific productive activities in the casestudy area (i.e. tourism, salines, tourism, agriculture) an assessment of socio-economic value of receptors (i.e. touristic and recreative value of beaches, value ofdifferent crops’ typologies) should be performed inorder to estimate potential damages related to sea-levelrise inundation.
The fruitful process of involvement of local stakeholdersin the OrientGate project should also be empowered inthe future, encouraging the development of a knowledgenetwork between scientists and policy makers aimed atguaranteeing that the available climate information areused in the more efficient way to improve solutions forcoastal adaptation.
REFERENCES
Antonioli F. & Leoni G., 2007. Mappa Nazionale delle areea rischio di allagamento da parte del mare. Dossier ENEAper lo studio dei cambiamenti climatici e loro effetti. RT ENEA, 83pp.
ARPA, 2002. Il mare in Puglia.Büttner, G. & Kosztra, B., 2007. CLC2006 TechnicalGuidelines.
IPCC, 2014. Climate Change 2014: Impacts, Adaptation,and Vulnerability. Contribution of Working Group II to theFifth Assessment Report of the Intergovernmental Panelon Climate Change. Cambridge University Press,Cambridge, United Kingdom and New York, NY, USA.
Mastronuzzi G., Sansò P., Calcagnile L., D’Elia M., PignatelliC., Quarta G.,2013. Cronologia C14 delle evidenzedell’impatto di tsunami lungo la costa della Puglia,CONGRESSO AIQUA 2013, Napoli.
UNISDR, 2009. Global assessment report on disaster riskreduction 2009. United Nations.

39
SHORT NAME SHORT DESCRIPTION REFERENCE
BFIBase Flow Index: The ratio of the base flow to thetotal flow.
Institute of Hydrology (1980)
SYCn
Indicator based on the area under the Storage YieldCurve (natural), representing the storage capacityneeded to provide a given basin yield or,alternatively, the firm basin yield produced from agiven level of water storage. Only based on naturalinflow and calculated both on absolute andstandardized (i.e. over Mean Annual Runoff) yieldand storage.
New formulated indicator based on Thomas & Burden (1963).
SDI
Streamflow Drought Index: drought severity indexbased on the cumulative streamflow for overlappingperiods of 3, 6, 9, 12 months within the hydrologicalyear. Positive SDI values reflect wet conditions whilenegative values indicate a hydrological drought.Based on the SDI, five states of hydrological droughtare defined.
Nalbantis and Tsakiris (2008)
SLR_HAZ
Sea level rise hazard: it aggregates sea-level riseprojections with topographic data (e.g. DEM, Lidar)in order to identify and prioritize areas and targetsthat could be submerged by rising water levels, underchanging climate conditions.
This report
SLR_RISK
Sea-level rise risk: it integrates information about thehazard (i.e. sea-level rise projections andtopographic data) with the territorial exposure andvulnerability, in order to identify and prioritizereceptors and coastal areas at risk of inundation dueto sea-level rise.
This report
CDDConsecutive Dry Days: maximum length of dry spell. It counts the largest number of consecutive days inchosen period where RR < 1 mm.
See OrientGate report on "Proposed set of indicators";http://www.seevccc.rs/ORIENTGATE/
AI
Aridity Index: it is a numerical indicator of the degreeof dryness of the climate at a given location. Let P beaccumulated precipitation and PET potentialevapotranspiration (under various formulations) inthe chosen period, the aridity index for the period isgiven by P/PET.
See OrientGate report on "Proposed set of indicators";http://www.seevccc.rs/ORIENTGATE/
Annex A.5
Indicator list

40
SHORT NAME SHORT DESCRIPTION REFERENCE
NVPWR
Natural Variation of Potential Water Resources: it is theratio between the area below the actual and futureflow duration curves both derived in the naturalscenario.
OrientGate report on the Pilot "Water resourcesand the use of hydroelectricity in AutonomousProvince of Trento" and this report
SMEF
Sustainability of Minimum Environmental Flow: thisindex compares the actual and future frequency ofoccurrence of the minimum environmental flow(MEF) as described in the provincial/regionalregulation by analyzing the actual and future durationcurves evaluated at specific control sections over thebasin in natural conditions.
OrientGate report on the Pilot "Water resourcesand the use of hydroelectricity in AutonomousProvince of Trento" and this report
WSDIWarm Spell Duration Index: it is a count of days in aspan of at least six days where TX > 90th percentile.
See OrientGate report on "Proposed set of indicators";http://www.seevccc.rs/ORIENTGATE/
PSMDPotential Soil Moisture Deficit: it is the cumulated soilwater shortage during the growing season.
See OrientGate report on "Proposed set of indicators";http://www.seevccc.rs/ORIENTGATE/
SLR
Sea Level Rise: it represents the anomaly of the seasurface height above the geoid (ZOS variable in IPCC-AR5). The anomaly can be calculated asdifference between the mean or median of twoperiods or, for a more precautionary choice, asmaximum minus minimum of two periods, or the 90th
percentile minus the 10th percentile of two periods.
This report
Stat-RORunOff Statistics: they include mean and percentile(indicating a ranking of runoff anomalies in the normaldistribution fit of runoff events).
This report
ATRAnnual Temperature Range: difference betweenannual absolute maximum and annual absoluteminimum temperature.
See OrientGate report on "Proposed set of indicators";http://www.seevccc.rs/ORIENTGATE/
MATMean Annual Temperature: mean temperature for theyear.
See OrientGate report on "Proposed set of indicators";http://www.seevccc.rs/ORIENTGATE/
APAAnnual Precipitation Amount: total precipitation in a year.
See OrientGate report on "Proposed set of indicators";http://www.seevccc.rs/ORIENTGATE/
GDDGrowing Degree Days: the number of temperaturedegrees above a threshold base temperature (8°C or 10°C) in a chosen period.
See OrientGate report on "Proposed set of indicators";http://www.seevccc.rs/ORIENTGATE/
R5mmPrecipitation days with a daily amount (RR) ≥ 5 mm. It counts the number of days in chosen period (duringgrowing season; other seasons).
See OrientGate report on "Proposed set of indicators";http://www.seevccc.rs/ORIENTGATE/
CWDConsecutive Wet Days: it counts the largest number ofconsecutive days in chosen period where RR ≥ 1 mm.
See OrientGate report on "Proposed set of indicators";http://www.seevccc.rs/ORIENTGATE/

41
SHORT NAME SHORT DESCRIPTION REFERENCE
PET-HA
Potential Evapotranspiration - Hargreaves: thePotential Evapo-Transpiration (PET) is a measure of the ability of the atmosphere to remove waterthrough Evapotranspiration processes. The Hargreaves method requires monthly average of mean temperature, daily temperature range andextra-terrestrial radiation (RA, radiation on top ofatmosphere expressed in mm/month as equivalent of evaporation). Daily temperature range is aneffective proxy to describe the effect of cloud coveron the quantity of extra-terrestrial radiation reachingthe land surface and, as such, it describes morecomplex physical processes with easily availableclimate data at high resolution.
Hargreaves (1994)
Ky
Yield-response factor: a yield response factorrepresenting the effect of a reduction inevapotranspiration on yield losses. Captures theessence of the complex linkages between productionand water use by a crop, where many biological,physical and chemical processes are involved.
FAO, Land and Water Division,Rome, Italy, 2012
HyDemCro
Hydro-demand of crops: It represents the degree towhich the crops are influenced by the water stress.Vulnerability score is related to the Yield-Responsefactor (Ky) that indicates the relation between thewater deficit and the reduction of efficiency.
This report
SystLoss
System Losses (Degree of efficiency): it representsthe level of efficiency and robustness of the irrigationnetworks by losses' value of each ReclamationConsortia. System losses decrease the efficiency ofthe system and increase their vulnerability to climatechange impacts.
This report
DiverSrc
Degree of diversification of sources: It represents thedegree of which the different Reclamation Consortiatends to rely their demand on different sources(reservoirs or groundwater) to fulfil water demandfor irrigation.
This report
HyDroHaz
Degree of fulfilment of the Consortia’s demand(Mm3/year): it represents the degree of fulfilment ofwater demand for irrigation due to changes in thehydrological pattern in selected river basins(Mm3/year) compared with the total wateravailability stored in the different reservoirs.
This report
HyDroRsk
Hydrological drought risk: it integrates informationabout the hazard (i.e. fulfilment of water demand)with the territorial exposure and vulnerability, in orderto identify and prioritize receptors (i.e. ReclamationConsortia, irrigated lands) at risk of hydrologicaldrought for the irrigation compartment.
This report


43
20C3M 20th Century historical GHG concentrations
ARPA Regional Environment Protection Agency
CMCC Centro Euro-Mediterraneo sui Cambiamenti Climatici
CMIP5 Climate Model Intercomparison Project 5
CNR Italian National Research Council
DEM Digital Elevation Model
FDC Flow Duration Curve
GCM General Circulation Model
GDP Gross Domestic Product
GHG Green House Gas
HRU Hydrologic Response Unit
IAMB Istituto Agronomico Mediterraneo Bari
ICZM Integrated Coastal Zone Management
IMELS Italian Ministry for the Environment Land and Sea
IPCC Intergovernmental Panel on Climate Change
LAP Local Action Programme
MCDA Multi Criteria Decision Analysis
NAP National Adaptation Plan
NAS National Adaptation Strategy
RCM Regional Climate Model
RCP4.5 Representative Concentration Pathways 4.5 W/m2
RCP8.5 Representative Concentration Pathways 8.5 W/m2
RRA Regional Risk Assessment
SEE South East Europe
SLR Sea Level Rise
UNCCD United Nations Convention to Combat Desertification
UN-DRR United Nations Office for Disaster Risk Reduction
UNISDR United Nations International Strategy on Disaster Reduction
WPMP Water Protection Master Plan
ZOS Sea Surface Height above the Geoid
Annex A.6
Glossary (list of definitionsand acronyms)

44
► Antonioli F. Leoni G. (2007) - Mappa Nazionale delle aree a rischio di allagamento da parte del mare. Dossier ENEA per lo studio dei cambiamenti climatici e loro effetti. RT ENEA, 83pp.
► Antonioli F., Silenzi S., (2007). Variazioni relative del livello del mare e vulnerabilità delle pianure costiere italiane. Quaderni della Società Geologica Italiana, 2, 29 pp. (www.socgeol.it/files/download/Quaderni/quaderno2.pdf)
► Diffenbaugh N, Giorgi, F (2012) Climate change hotspots in the CMIP5 global climate model ensemble. Climatic Change 114(3), 813�822.
► EUROIDEES (2013) Il turismo in Puglia nel 2012-2013 e le prospettive di crescita al 2020; http://www.agenziapugliapromozione.it/portal/documents/10180/127304/Report%20turismo%20Puglia%202013-2012
► Ferrise R., Moriondo M., Trombi G., Miglietta F., Bindi M. (2013) Climate Change Impacts on Typical Mediterranean Crops and Evaluation of Adaptation Strategies to Cope With. In: A. Navarra, L. Tubiana. Regional Assessment of Climate Change in the Mediterranean. Volume 2: Agriculture, Forests and Ecosystem Services and People, pp. 49-70, Springer, ISBN:9789400757714.
► Fiore A., Gallicchio S., Blu Giandonato P., Iurilli V.,Mastronuzzi G., Pieri P., Sabato L., Sansò P., Selleri G., Simone O., Sollitto D., Tropeano M., Valletta S., Il Patrimonio Geologico della Puglia - Territorio e Geositi, 4/2010 di Geologia dell’ Ambiente, SIGEA, ottobre 2010 http://www.pugliaindifesa.org/files/Volume_Patrimonio_Geologico_lowres-20.pdf
► Garcia-Herrera R.F., P. Lionello, and U. Ulbrich, 2014: Understanding dynamics and current developments of climate extremes in the Mediterranean region, Nat. Hazards Earth Syst. Sci., 14:309-316.
► Giorgi F (2006) Climate change hot�spots. Geophys. Res. Lett. 33, L08707.► Giorgi, F., Lionello, P., 2008. Climate change projections for the Mediterraneanregion. Global Planet. Change 63, 90-104.► Goodess, C.M. et al. (2013) Integration of the Climate Impact Assessments with Future Projections. In: A.Navarra
and L.Tubiana eds., Regional Assessment of Climate Change in the Mediterranean, Volume 3: Case studies. Advances in Global Change Research 52, 105-162, Springer Netherlands.
► Gualdi S., Somot S., Li L., Artale V., Adani M., Bellucci A., Braun A., Calmanti S., Carillo A., Dell'Aquila A., Déqué M., Dubois C., Elizalde A., Harzallah A., Jacob D., L'Hévéder B., May W., Oddo P., Ruti P., Sanna A., Sannino G. (2013) The CIRCE Simulations: Regional Climate Change Projections with� Realistic Representation of the Mediterranean Sea Bulletin of the American Meteorological Society, 94, 65-81.
► Hemming et al. (2013). Climate Impact Assessment. In: A.Navarra and L.Tubiana eds., Regional Assessment of Climate Change in the Mediterranean, Volume 3: Case studies. Advances in Global Change Research, 52: Case Studies, 61-104 Springer Netherlands.
► IPCC (2012) Managing the Risks of Extreme Events and Disasters to Advance Climate Change Adaptation. A Special Report of Working Groups I and II of the Intergovernmental Panel on Climate Change [Field, C.B., V. Barros, T.F. Stocker, D. Qin, D.J. Dokken, K.L. Ebi, M.D. Mastrandrea, K.J. Mach, G.-K. Plattner, S.K. Allen, M. Tignor, and P.M. Midgley (eds.)]. Cambridge University Press, Cambridge, UK, and New York, NY, USA, 582 pp.
► IPCC (2013) Climate Change 2013: The Physical Science Basis. Contribution of Working Group I to the Fifth Assessment Report of the Intergovernmental Panel on Climate Change [Stocker, T.F., D. Qin, G.-K. Plattner, M. Tignor, S.K. Allen, J. Boschung, A. Nauels, Y. Xia, V. Bex and P.M. Midgley (eds.)]. Cambridge University Press, Cambridge, United Kingdom and New York, NY, USA, 1535 pp.
► IPCC (2014) Climate Change 2014: Impacts, Adaptation, and Vulnerability. Part A: Global and Sectoral Aspects. Contribution of Working Group II to the Fifth Assessment Report of the Intergovernmental Panel on Climate Change [Field, C.B., V.R. Barros, D.J. Dokken, K.J. Mach, M.D. Mastrandrea, T.E. Bilir, M. Chatterjee, K.L. Ebi, Y.O. Estrada, R.C. Genova, B. Girma, E.S. Kissel, A.N. Levy, S. MacCracken, P.R. Mastrandrea, and L.L. White (eds.)]. Cambridge University Press, Cambridge, United Kingdom and New York, NY, USA, 1132 pp.
► IRGC (2005) White Paper No1 “Risk Governance - Towards an Integrative Approach”, IRGC, Geneva.► ISTAT (2011) 15° Censimento Popolazione e Abitazioni 2011;
http://www.istat.it/en/population-and-housing-census/population-and-housing-2011
► Landis WG. (2005) Regional scale ecological risk assessment. In: Landis WG, editor. Using the relative risk model. CRC Press.
► Marti�nez R., D. Hemming, L. Malone, N. Bermudez, G. Cockfield, A. Diongue, J. Hansen, A. Hildebrand, K. Ingram,
References

45
G. Jakeman, M. Kadi, G. R. McGregor, S. Mushtaq, P. Rao, R. Pulwarty, O. Ndiaye, G. Srinivasan, Eh. Seck, N. White and R. Zougmore (2012). Improving Climate Risk Management at Local Level - Techniques, Case Studies, Good Practices and Guidelines for World Meteorological Organization Members, Risk Management - Current Issues and Challenges, Dr. Nerija Banaitiene (Ed.), ISBN: 978-953-51-0747-7, InTech, DOI: 10.5772/51554.
► Mastronuzzi G. & Sansò P. (2012) The role of strong earthquakes and tsunami in the Late Holocene evolution of the Fortore River coastal plain (Apulia, Italy): A synthesis. Geomorphology, 138(1): 89-99 http://www.sciencedirect.com/science/article/pii/S0169555X11004582
► Mereu V., Iocola I., Spano D., Murgia V., Duce P., Cesaraccio C., Tubiello F. N., Fischer G. (2008) Land suitability and potential yield variations of wheat and olive crops determined by climate change in Italy. Italian Journal of Agronomy, 3(3): 797-798.
► Moriondo M., Trombi G., Ferrise R., Brandani G., Dibari C., Ammann C.M., Mariotti Lippi M., Bindi M. (2013) Olive trees as bio-indicators of climate evolution in the Mediterranean Basin. Global Ecology and Biogeography, 22, 818-833.
► OECD (2011), “Sustainable Tourism and Local Development in Apulia Region”, OECD Local Economic and Employment Development (LEED) Working Papers, No. 2011/02.
► Pasini S., Torresan S., Rizzi J., Zabeo A., Critto A., Marcomini A. (2012). Climate change impact assessment in Veneto and Friuli Plain groundwater. Part II: A spatially resolved regional risk assessment, Sci Total Environ, 440: 219-235.
► Piccinni A.F., Portoghese I., Balacco G. (2008) Potential of wastewater reuse for the implementation of new measures to contrast sea water intrusion in the Apulia region. PRIMAC Final meeting September 24-26, 2008.
► Polemio M., Casarano D., Dragone V. (2007) Trend termopluviometrico, siccità e disponibilità di acque sotterranee in Italia meridionale. In: Carli, B. Cavarretta, G. Colacino, M. Fuzzi, S. (eds) Clima e cambiamenti climatici: le attività di ricerca del CNR, pp. 585-588.
► Polemio M., Casarano D., Limoni P.P. (2010) Apulian coastal aquifers and management criteria. SWIM21 - 21st Salt Water Intrusion Meeting. June 21 - 26, 2010. Azores, Portugal.
► Ponti L., Gutierrez A.P., Ruti P.M., Dell’Aquila A. (2014) Fine-scale ecological and economic assessment of climate change on olive in the Mediterranean Basin reveals winners and losers. Proc. Natl. Acad. Sci. U S A, 111(15): 5598-5603.
► Ramieri E., Hartley A., Barbanti A., Duarte Santos F., Gomes A., Hilden M., Laihonen P., Marinova N., Santini M. (2011) Methods for assessing coastal vulnerability to climate change. ETC CCA Technical Paper 1/2011. ETC/CCA, Bologna, IT, October 2011, 93 pp.
► Reale M., Congedi L., Tanzarella A., Lionello P. (2011) Information sheet on future climate and impacts for the CIRCE rural case studies: Apulia, Italy. Available at: http://www.cru.uea.ac.uk/projects/circe/Puglia.html
► Sansò P. & Mastronuzzi G., Torri costiere e tettonica attuale nella Penisola Salentina (Puglia meridionale, Italia), CONGRESSO AIQUA 2013, Napoli 19-21 giugno 2013.
► SOGESID (2009) Piano di Tutela delle Acque della Regione Puglia - Final version► Steduto P., Hsiao T.C., Fereres E., Raes D. (2012) Crop yield response to water, Food And Agriculture
Organization of the United Nations (FAO), Rome.► UNISDR (2009) Terminology on disaster risk reduction, 30 pp. Available at:
http://www.preventionweb.net/files/7817_UNISDRTerminologyEnglish.pdf
► U.S. Agency for International Development (USAID). 2009. Adapting to Coastal Climate Change: A Guidebook for Development Planners. Can be downloaded from: http://www.usaid.gov/our_work/environment/climate/policies_prog/vulnerability.html orhttp://www.crc.uri.edu/download/CoastalAdaptationGuide.pdf
► World Health Organization (2011) Guidance on water supply and sanitation in extreme weather events. L. Sinisi and R. Aertgeerts. xxi + 104 pages. ISBN 9789289002585. Available at: http://www.euro.who.int/_data/assets/pdf_file/0016/160018/WHOGuidanceFVLR.pdf?ua=1
► Zaccarelli, N., I. Petrosillo, G. Zurlini, and K. Hans Riitters 2008. Source/sink patterns of disturbance and cross-scale mismatches in a panarchy of social-ecological landscapes. Ecology and Society 13(1): 26. Available at: http://www.ecologyandsociety.org/vol13/iss1/art26


"OrientGate - A structured network for integration of climate knowledge into policy and territorialplanning"
The project is co-funded by the South East Europe(SEE) Transnational Cooperation Programme underPriority Axes 2 “Protection and improvement of theenvironment”, respectively the Area of Intervention“Improve prevention of environmental risks” and coordinated by the Euro- Mediterranean Centreon Climate Change.
The South East Europe programme (SEE) is a uniqueinstrument which, in the framework of the RegionalPolicy´s Territorial Cooperation Objective, aims toimprove integration and competitiveness in an areawhich is as complex as it is diverse.

Contacts
Lead partner, project coordinator
Giulia GalluccioEuro-Mediterranean Centre on Climate Change (CMCC)Corso Magenta 63 l 20123 Milan l Italy Tel.: +39 02 43986856 • E-mail: [email protected]
Thematic centre leader and pilot study 3 coordinator
Monia SantiniEuro-Mediterranean Centre on Climate Change E-mail: [email protected]
Antonio TrabuccoEuro-Mediterranean Centre on Climate Change E-mail: [email protected]
www.orientgateproject.org