May 2012 - Blue Grass Chemical Agent-Destruction Pilot Plant Monthly Status Briefing
DECEMBER 1974REPORT NO. ENV.E. 44-74-9
PILOT PLANT STUDIESOF WASTE WATER CHEMICALCLARIFICATION USING ALUM
C James Martel
Francis A. DiGiano
Robert E. Pariseau
Report to the Division of Water Pollution Control
Massachusetts Water Resources Commission
Contract Number 73-01 (1)
ENVIRONMENTAL ENGINEERING "..
-DEPARTMENT OF CIVIL 'ENGINEERING
"", UNIVERSITY. OF MASSACHUSETTS
.. AMHERST, MASSACHUSETTS '
III
i
PILOT PLANT. STUDIES OF WASTEWATER
CHEMICAL CLARIFICATION USING ALUM
• By
C. James MartelResearch Associate
Francis A. DiGiano— Assistant Professor of Civil Engineering
Robert E. PariseauResearch Chemist
Division of Water Pollution Control
Massachusetts Water Resources Commission
A Contract Number MDWPC 73-07(1)
I Environmental Engineering Program
• , Department of Civil Engineering
University of Massachusetts
• Amherst, Massachusetts 01002
iiiii
III
I
I
IIII
ABSTRACT
The treatment effectiveness of the chemical clarification process
using alum was evaluated through jar tests and pilot plant studies.
I Jar tests indicated that flocculation times of 15 minutes or greater
resulted in the greatest phosphorus removal. Pilot plant studies
were conducted using an alum dosage of 175 mg/1 and a flowrate of
4 gpm. At a flocculation time of 16 minutes, 89 percent of the totalIphosphorus, 94 percent of the dissolved phosphorus, 76 percent of the
• turbidity,, and 81 percent of the suspended solids were removed.
The pilot plant studies also indicated that a pH control or monitor
I system should be included in the process design to prevent periodic pH
'• depressions below 6.0. The average pH and alkalinity of the clarified
effluent were 6.3 and 35 mg/1 as CaC03 respectively. Lower pH readings
f (below 6.0) were often recorded during the pilot plant studies.
As a result of alum addition, primary sludge production was
I estimated to be 2100 Ibs/MG, or approximately double that expected of
a conventional primary treatment facility. Percent solids were estimated
to be 2.25.
I The operating and amortized capital costs for alum addition to an
existing primary treatment facility were estimated to total $.09/1000
JH' gallons; of this, $0.06/1000 gallons represents the cost of alum.
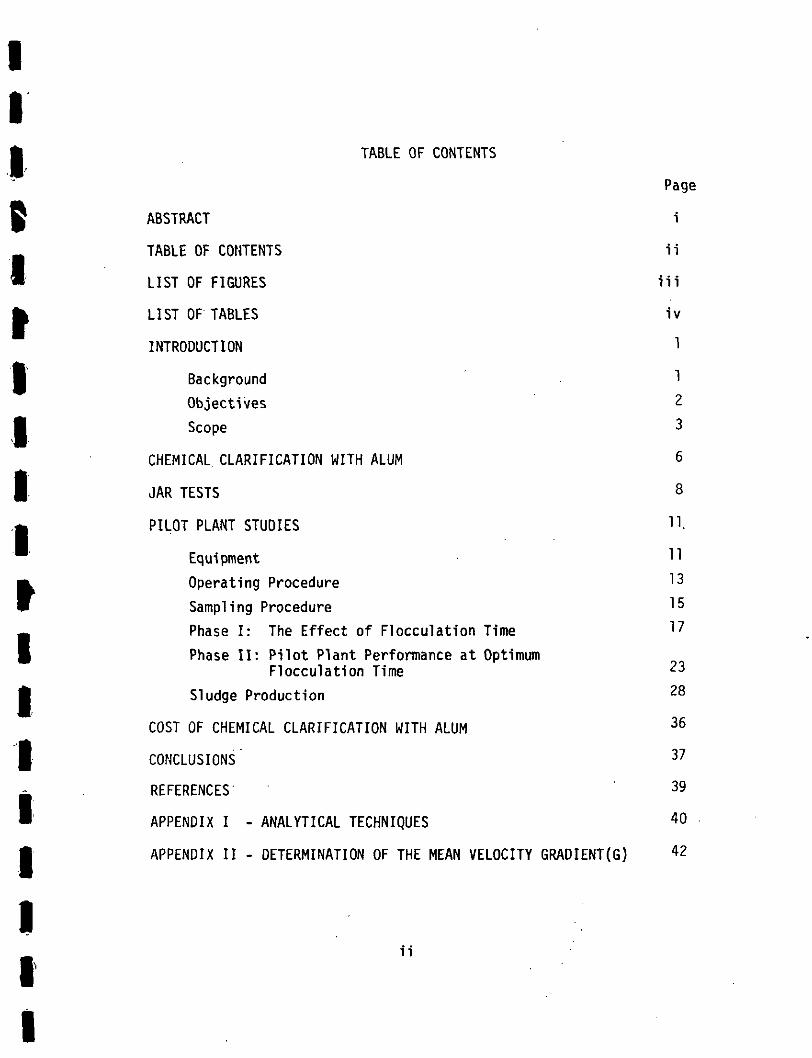
I TABLE OF CONTENTS
Page
^ ABSTRACT i
TABLE OF CONTENTS ii
W LIST OF FIGURES 111
fc LIST OF TABLES iv
INTRODUCTION 1
• Background - 1Objectives 2
• Scope 3
CHEMICAL CLARIFICATION WITH ALUM 6
|
g
»
JAR TESTS 8
PILOT PLANT STUDIES H
Equipment H
Operating Procedure 13
Sampling Procedure ^5
£ Phase I: The Effect of Flocculation Time 17
| Phase II: Pilot Plant Performance at OptimumFlocculation Time 23
A Sludge Production 28
COST OF CHEMICAL CLARIFICATION WITH ALUM 36
§ CONCLUSIONS' 37
^ . REFERENCES 39• APPENDIX I - ANALYTICAL TECHNIQUES 40
APPENDIX II - DETERMINATION OF THE MEAN VELOCITY GRADIENT(G) 42|
Iti
11
IIII
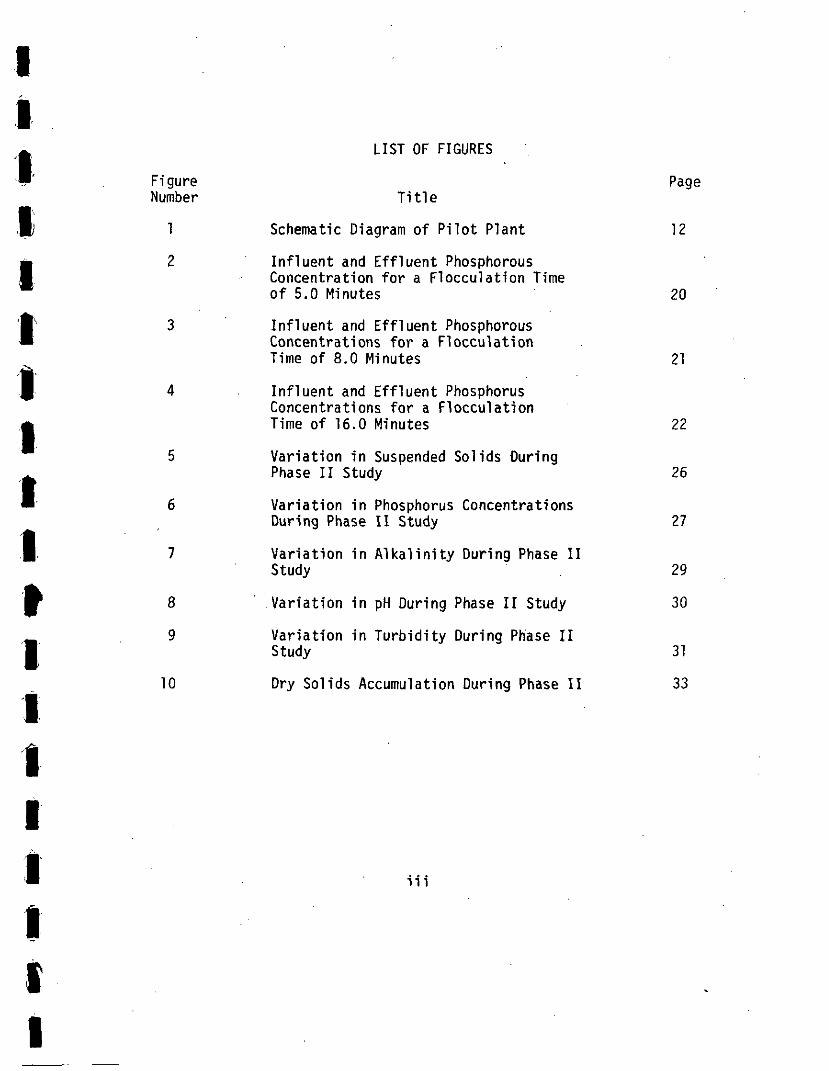
LIST OF FIGURES
Figure PageNumber Title
1 Schematic Diagram of Pilot Plant 12
1 2 Influent and Effluent PhosphorousConcentration for a Flocculation Timeof 5.0 Minutes 20
Ii
ii
Influent and Effluent PhosphorousConcentrations for a FlocculationTime of 8.0 Minutes 21
4 Influent and Effluent PhosphorusConcentrations for a Flocculation
f Time of 16.0 Minutes 22
5 Variation in Suspended Solids DuringPhase II Study 26i
it 9 Variation in Turbidity During Phase II• Study 31
10 Dry Solids Accumulation During Phase II 33i
6 Variation in Phosphorus ConcentrationsDuring Phase II Study 27
7 Variation in Alkalinity During Phase IIStudy 29
8 Variation in pH During Phase II Study 30
iii
II
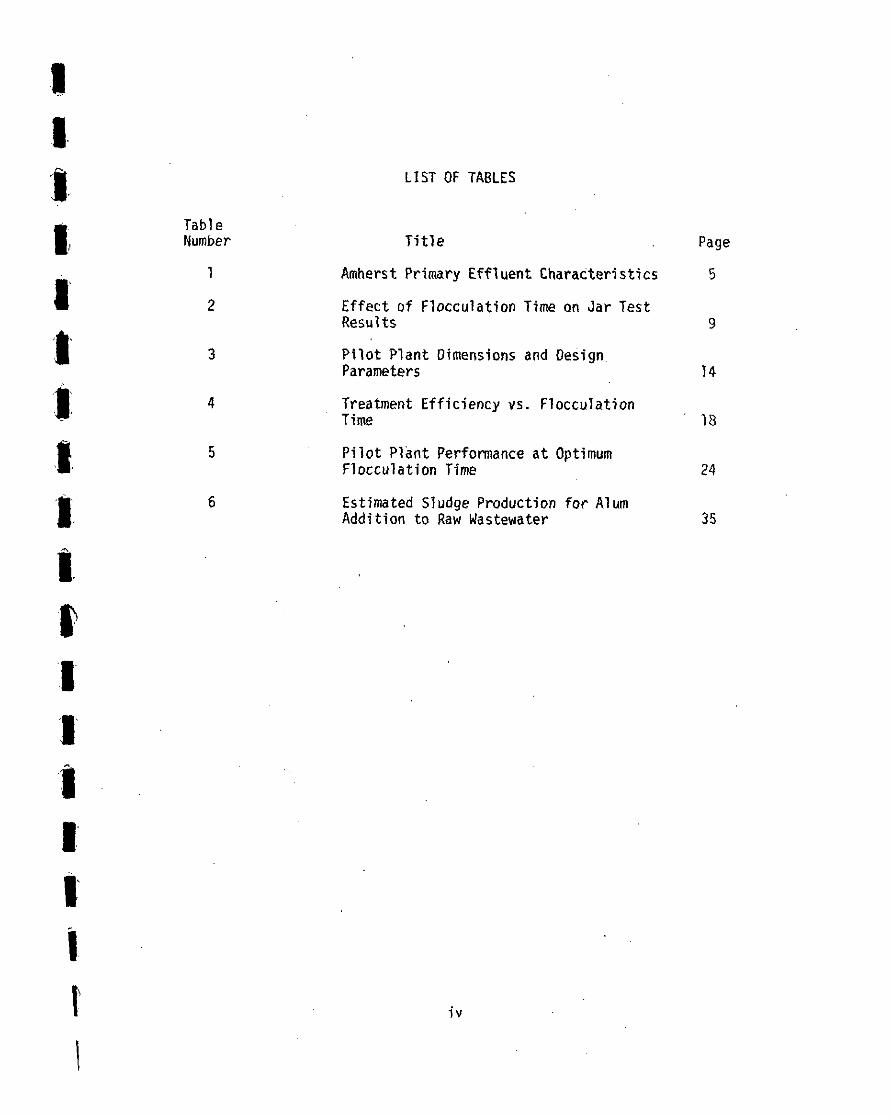
LIST OF TABLES
I Table, Number Title . Page
• 1 Amherst Primary Effluent Characteristics 5
2 Effect of Flocculation Time on Jar TestResults 9
3 Pilot Plant Dimensions and DesignParameters J4
t1 4 Treatment Efficiency vs. FloccuJation
T-imn
I
Time ' 18
5 Pilot Plant Performance at OptimumFlocculation Time 24
§ 6 Estimated Sludge Production for AlumAddition to Raw Wastewater 35
i
IV
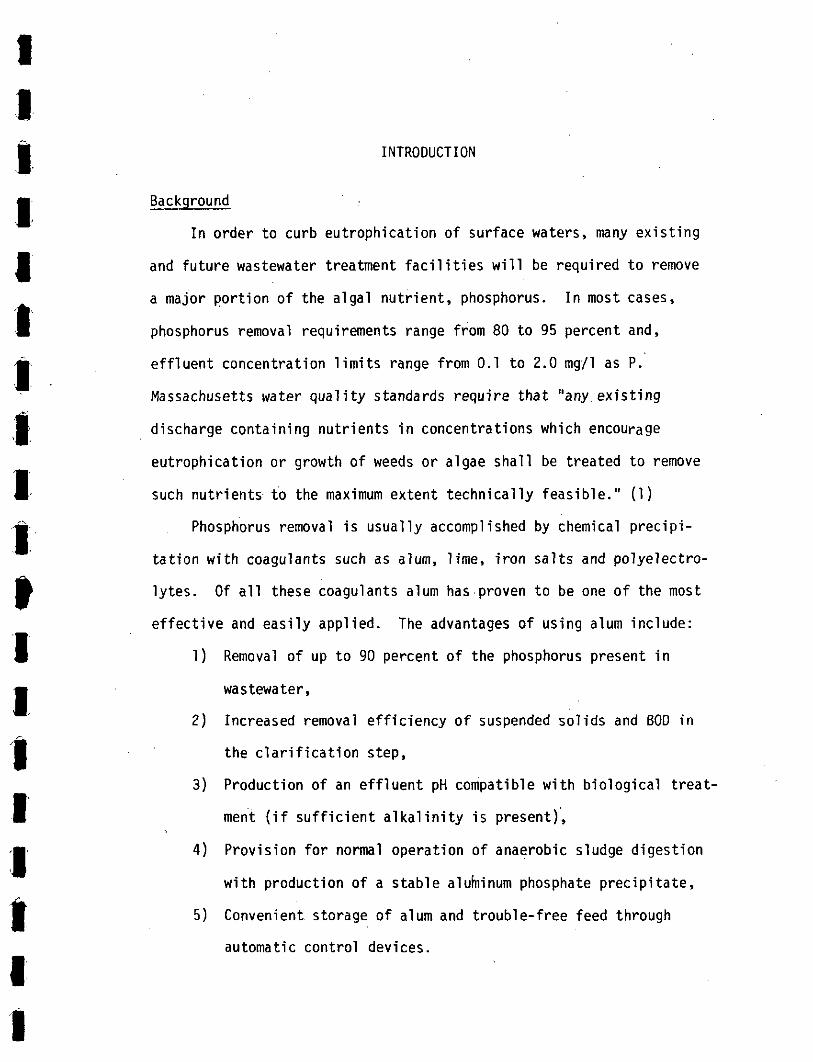
III INTRODUCTION
BackgroundtIn order to curb eutrophication of surface waters, many existing
I and future wastewater treatment facilities will be required to remove
a major portion of the algal nutrient, phosphorus. In most cases,
I phosphorus removal requirements range from 80 to 95 percent and,
• effluent concentration limits range from 0.1 to 2.0 mg/1 as P.
Massachusetts water quality standards require that "any existing
•• discharge containing nutrients in concentrations which encourage
eutrophication or growth of weeds or algae shall be treated to remove
1 .such nutrients to the maximum extent technically feasible." (1)
4|-. Phosphorus removal is usually accomplished by chemical precipi-
tation with coagulants such as alum, lime, iron salts and polyelectro-
f lytes. Of all these coagulants alum has proven to be one of the most
effective and easily applied. The advantages of using alum include:
I 1) Removal of up to 90 percent of the phosphorus present in
• wastewater,
2) Increased removal efficiency of suspended solids and BOD in
I the clarification step,
3) Production of an effluent pH compatible with biological treat-
ment (if sufficient alkalinity is present),
4) Provision for normal operation of anaerobic sludge digestion
with production of a stable aluminum phosphate precipitate,
5) Convenient storage of alum and trouble-free feed through
automatic control devices.
In contrast to the advantages of using alum, lime often elevates
IIXPthe pH beyond a range amenable to biological treatment. Moreover, the
calcium phosphate precipitate thus formed redissolves under the acidic •
conditions of sludge digestion and returns phosphorus to the system.
Ferric chloride reacts much like alum except that a highly colored K
effluent is produced if it is overdosed. .
In spite of the many advantages of using alum, its acidic nature •
may cause a severe pH depression in typically soft, low alkalinity, •
New England wastewaters. A severe drop in pH would occur when alum
is overdosed and all the alkalinity is depleted. Even if alum dosage '•
is controlled, a pH adjustment may be required prior to further
treatment such as chlorination or biological nitrification. Also, s™
effluent pH values below 6.0 would violate the minimum level of effluent ir
quality standards for secondary treatment (2) and would be less than
the water quality standards for pH in Class C waters (1). W
Other disadvantages of alum clarification include: )•
1) Difficulties in dewatering because of the light gelatinous •
sludge produced, •
2) Unavailability of any proven technique to recover and reuse
alum, I
3) The higher cost of alum compared to other precipitants such
as lime or ferric chloride. »
Objectives •
The basic objectives of this pilot plant study were as follows:
1) To demonstrate the application of alum as a chemical precipitant I
iI
-3-
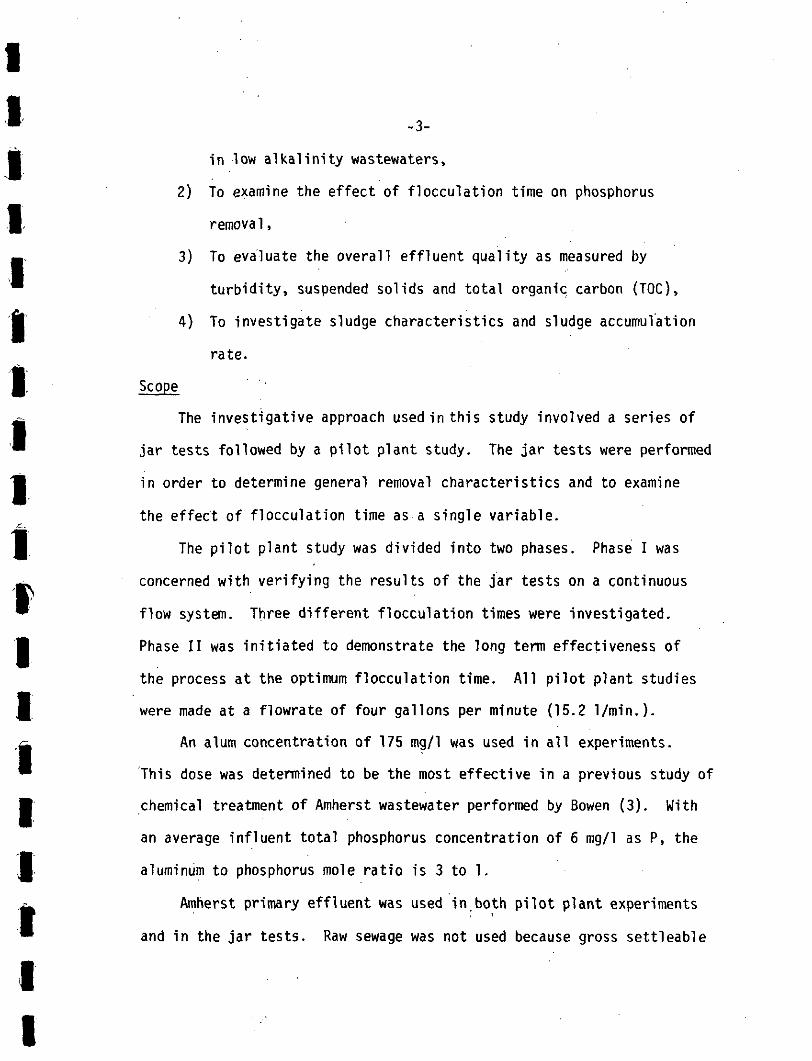
in low alkalinity wastewaters,
2) To examine the effect of flocculation time on phosphorus
removal,
3) To evaluate the overall effluent quality as measured by
turbidity, suspended solids and total organic carbon (TQC),
4) To investigate sludge characteristics and sludge accumulation
rate.
Scope
The investigative approach used in this study involved a series of
jar tests followed by a pilot plant study. The jar tests were performed
in order to determine general removal characteristics and to examine
the effect of flocculation time as a single variable.
The pilot plant study was divided into two phases. Phase I was
^. concerned with verifying the results of the jar tests on a continuous
™ flow system. Three different flocculation times were investigated,
• Phase II was initiated to demonstrate the long term effectiveness of
the process at the optimum flocculation time. All pilot plant studies
£ were made at a flowrate of four gallons per minute (15.2 1/min.}.
,^ An alum concentration of 175 mg/1 was used in all experiments.
" This dose was determined to be the most effective in a previous study of
• chemical treatment of Amherst wastewater performed by Bowen (3). With
an average influent total phosphorus concentration of 6 mg/1 as P, the
1-aluminum to phosphorus mole ratio is 3 to 1.
^ Amherst primary effluent was used in both pilot plant experiments
'" and in the jar tests. Raw sewage was not used because gross settleable
Ii
III
-4-
solids would often clog pumps and pipes in the small pilot plant system.
However, the use of primary effluent rather than raw sewage should not
detract from the results of this investigation. This is because the I
Amherst Sewage Treatment Plant often discharges a strong effluent due
to a chronic condition of hydraulic overloading. The strength of this •
effluent is shown in Table 1 for the period during which pilot plant l|
studies were made.
The parameters analyzed during the jar tests and pilot plant I
studies include pH, alkalinity, turbidity, TOC, suspended solids,
total and dissolved phosphorus. Percent volatile solids, specific Ji
gravity, and sludge accumulation rate were determined during the sludge •
accumulation studies. iiii_ -_
iiiii
-5-
IIIIJ
IIII1
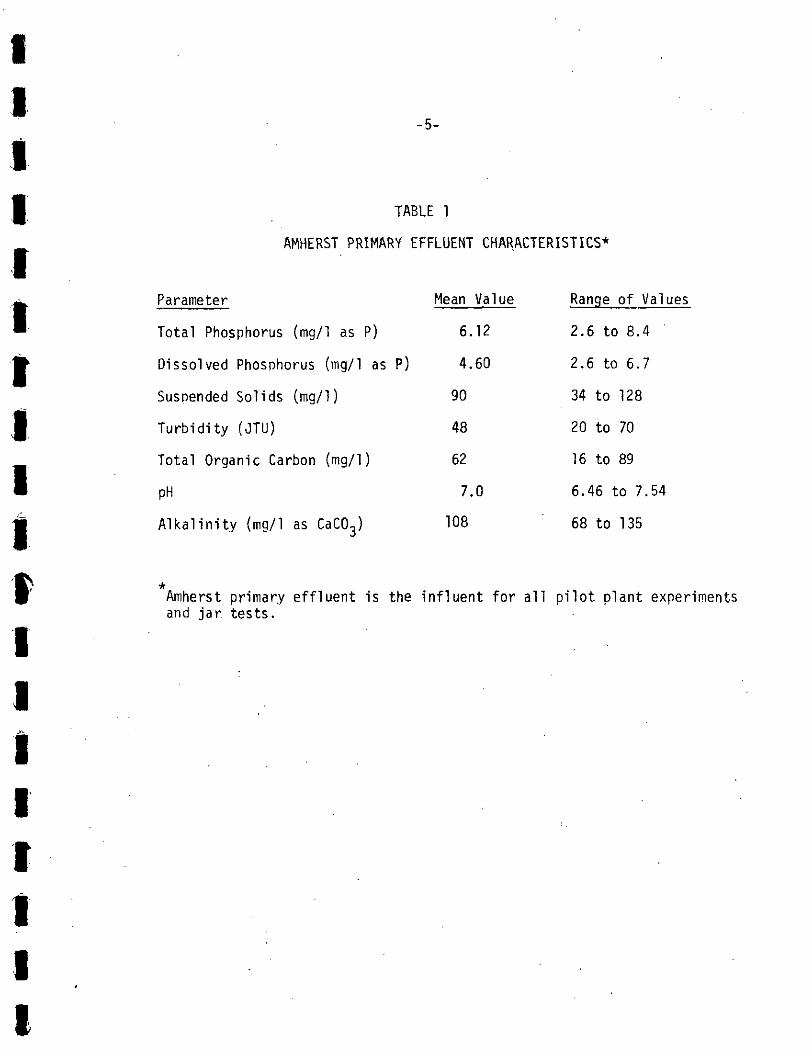
AMHERST PRIMARY EFFLUENT CHARACTERISTICS*
Parameter Mean Value Range of Values
Total Phosphorus (mg/1 as P) 6.12 2.6 to 8.4
•If Dissolved Phosphorus (mg/1 as P) 4.60 2.6 to 6.7
Suspended Solids (mg/1) 90 34 to 128
J Turbidity (JTU) 48 20 to 70
Total Organic Carbon (mg/1) 62 16 to 89
• pH 7.0 6.46 to 7.54
Alkalinity (mg/1 as CaC03) 108 68 to 135
Amherst primary effluent is the influent for all pilot plant experimentsand jar. tests.
-6-
CHEMICAL CLARIFICATION WITH ALUM
III
Chemical clarification with alum has long been used as a water
purification process to remove fine suspended particles which would I
otherwise escape from the sedimentation process. The alum forms a m
flocculent precipitate which enmeshes the slowly settleable and
colloidal particles to form rapidly settling aggregates or floes. 1
Added to wastewater, alum performs the same function .causing greater
removals of suspended solids, turbidity and organics. More importantly •
however, addition of aluminum ions removes phosphorus both directly f
by precipitation and indirectly, by enmeshment in an aluminum hydroxide
floe. The combined results is the production of an effluent of suffi- I
cient quality to nearly match the performance of a good secondary
treatment system. J§
There are many excellent publications available to the reader on s*
the basic design considerations of the alum clarification process. The
most comprehensive and useful from a practical application standpoint •
are those published by the EPA Technology Transfer Program. Some of
these stress the phosphorus removal capability of alum while others .•
are oriented towards the chemical clarification function of alum m
addition. An excellent example of the former is the "Process Design
Manual for Phosphorus Removal" (4) which presents the latest techniques I
for removing phosphorus from various treatment processes; another
report, entitled "Designing to Remove Phosphorus Using Metal Salts and |
Polymers in Conventional Plants" (5), deals with the application of
alum and other chemicals to remove phosphorus in existing treatment
III facilities.
_ If the design emphasis is on physical-chemical treatment using
• ' alum, the reader should consult the EPA publication "Physical-Chemical
• Wastewater Treatment Plant Design" (6); all necessary plant design
, considerations are presented as well as case histories of applications,
I Another useful publication is "Physical-Chemical Processes" (7) by the
Advanced Waste Treatment Research Laboratory in Cincinnati, Ohio.
•• Design criteria are discussed and descriptions and performance
• evaluations of some physical-chemical pilot plants are presented.
Although these EPA publications, as well as the research
• literature, provide a wealth of information on phosphorus control
^ strategies, there are few case histories of experience with low
9 alkalinity wastewaters as to be encountered in the New England area,
f- This report provides pilot plant data on removal of phosphorus from
wastewater in Amherst, Massachusetts. Problem areas likely to be
I encountered in similar applications in New England are discussed.
Moreover, this report deals with the effect of flocculation time on
™ phosphorus removal, an area of process research often neglected.
iiiiii
II
JAR TESTS g
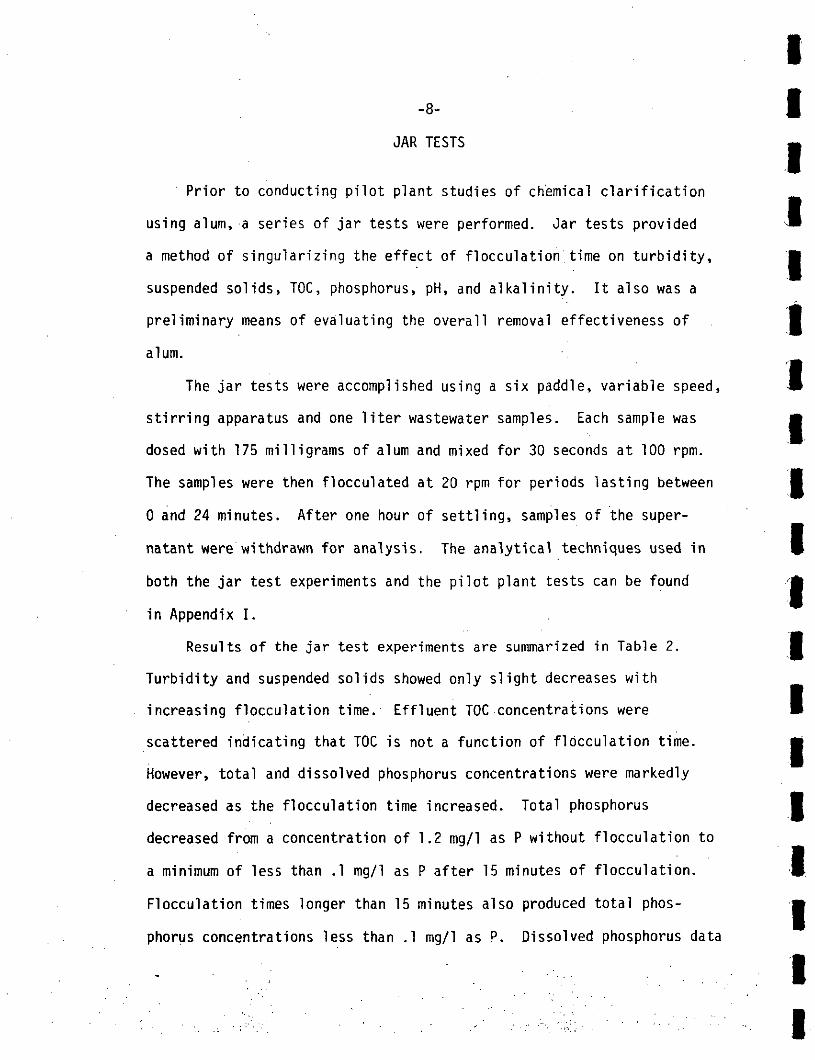
Prior to conducting pilot plant studies of chemical clarification
using alum, a series of jar tests were performed. Jar tests provided •"
a method of singularizing the effect of flocculation time on turbidity, •
suspended solids, TOC, phosphorus, pH, and alkalinity. It also was a
preliminary means of evaluating the overall removal effectiveness of I
alum.
IThe jar tests were accomplished using a six paddle, variable speed, *
stirring apparatus and one liter wastewater samples. Each sample was m
dosed with 175 milligrams of alum and mixed for 30 seconds at 100 rpm.
The samples were then flocculated at 20 rpm for periods lasting between I
0 and 24 minutes. After one hour of settling, samples of the super-
natant were withdrawn for analysis. The analytical techniques used in 9
both the jar test experiments and the pilot plant tests can be found ft
in Appendix I.
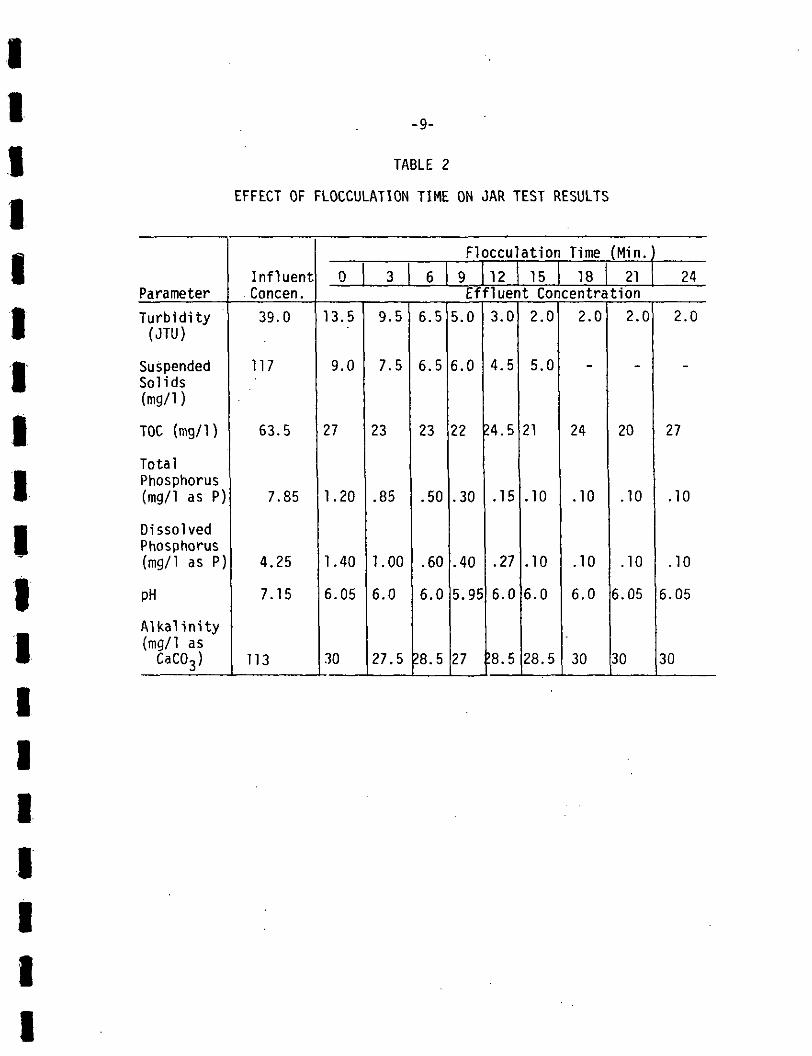
Results of the jar test experiments are summarized in Table 2. •
Turbidity and suspended solids showed only slight decreases with
increasing flocculation time. Effluent TOC concentrations were •
scattered indicating that TOC is not a function of flocculation time. m
However, total and dissolved phosphorus concentrations were markedly
decreased as the flocculation time increased. Total phosphorus I
decreased from a concentration of 1.2 mg/1 as P without flocculation to
a minimum of less than .1 mg/1 as P after 15 minutes of flocculation. m
Flocculation times longer than 15 minutes also produced total phos- m
phorus concentrations less than .1 mg/1 as P. Dissolved phosphorus data
Ii
I111IIIIIIIIIIIIIII
-9-
TABLE 2
EFFECT OF FLOCCULATION TIME ON JAR TEST RESULTS
ParameterTurbidity(JTU)
SuspendedSolids(rng/1)
TOC (mg/1)
TotalPhosphorus(mg/1 as P)
DissolvedPhosphorus(mg/1 as P)
PH
Alkalinity(mg/1 asCaC03)
InfluentConcen.39.0
117
63.5
7.85
4.25
7.15
113
Flocculation Time (Min.0 3 6 9 12 15 18 21 24
Effluent Concentration13.5
9.0
27
1.20
1.40
6.05
30
9.5
7.5
23
.85
1.00
6.0
27.5
6.5
6.5
23
.50
.60
6.0
28.5
5.0
6.0
22
.30
.40
5.95
27
3.0
4.5
24.5
.15
.27
6.0
J8.5
2.0
5.0
21
.10
.10
6.0
28.5
2.0
~
24
.10
.10
6.0
30
2.0
—
20
.10
.10
6.05
30
2.0
~
27
.10
.10
6.05
30
is diluted.
II-10-
is almost identical to total phosphorus indicating the absence of any
participate matter in the supernatant. Alkalinity and pH remained m
relatively constant for all flocculation times. ft
Based on this data it appears that the primary justification for
longer flocculation times is the significant increase in phosphorus I
removal. Maximum phosphorus removals occurred at flocculation times of
15 minutes or greater. The fact that greater phosphorus removals are I
achieved at longer flocculation times is probably due to promotion of m
a greater number of particle contacts. This permits the amorphous
aluminum phosphate precipitate to aggregate and settle out. I
The data also indicates that pH and alkalinity depression could
be a problem in typical New England wastewaters. Initial pH and m
alkalinity of the Amherst wastewater sample used in jar tests was 7.15 m-
and 113 mg/1 as CaCOo respectively. After flocculation these values
were reduced to approximately 6.0 and 30 mg/1 as CaC03- While a •
treatment plant effluent containing pH and alkalinity values of this
magnitude may be satisfactory most of the time, there will be occasions m
when the effluent pH and alkalinity may be further reduced. This is •
likely to occur during wet weather flows when the influent alkalinity
Iiiiii
III
-11-
PILOT PLANT STUDIES
Oar tests demonstrated that maximum phosphorus removals occurrediat flocculation times of 15 minutes or greater. Further studies using
I a continuous flow system were needed to assess the effect of different
flocculation times under actual plant operating conditions, and to
I evaluate the overall effluent quality produced.
M Phase I of the pilot plant investigations was devoted to examining
the overall effect of flocculation time on the treatment effectiveness
I of the chemical clarification process using alum. The pilot plant
facility was operated at flocculation times of 5.0, 8.0, and 16.0
I minutes. Data was collected continuously for three days at each
• flocculation time. The objective of this phase was to verify jar test
results and to select the optimum flocculation time for further pilot
• plant testing.
Phase II consisted of data collection for 16 days at the optimum
I flocculation time determined from Phase I. The intent of the second
• phase was to evaluate the system for a sustained period. In addition,
this extended study permitted measurement of sludge characteristics
I and accumulation rate.
Equi pment
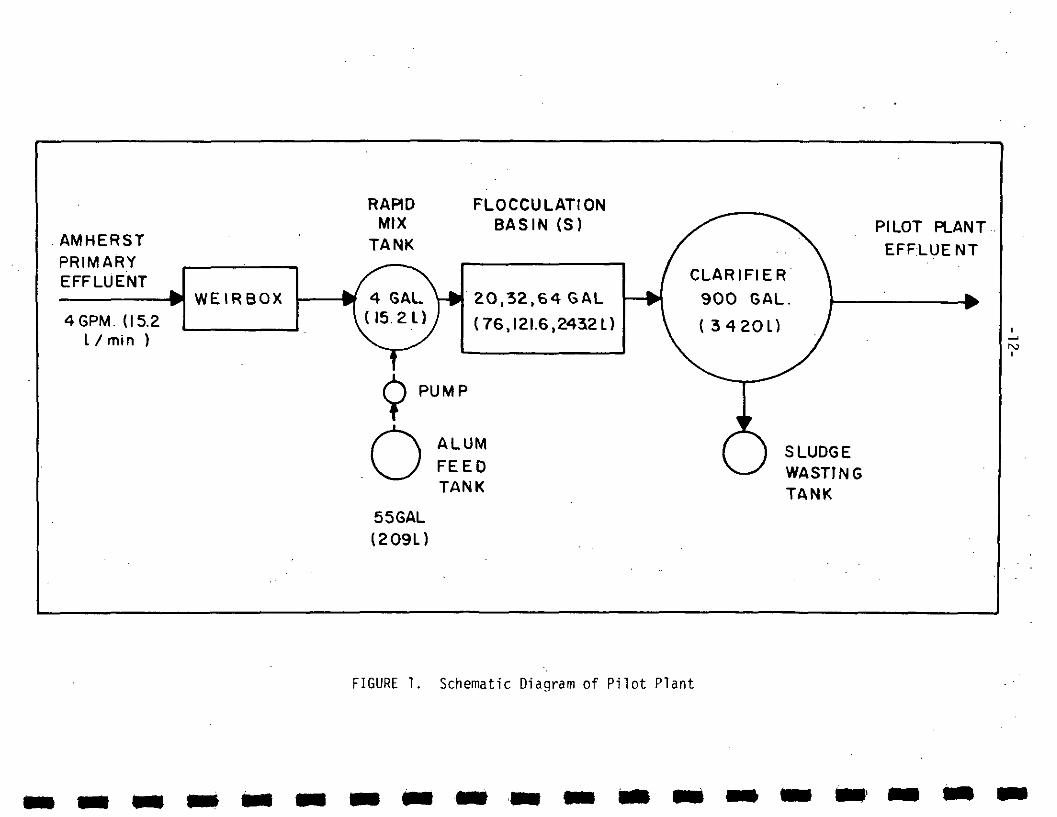
I A schematic diagram of the pilot plant facility used during both
m phases is shown in Figure 1. The facility includes a rapid mix tank
which provides a one minute detention time at 4 gpm (152 1/min.). It
• also includes two flocculation tanks with a full capacity of 32 gallons
(121.6 1) each. Different flocculation times were obtained using
i
AMHERSTPRIMARYEFFLUENT
^•^^^^^•^^^^^^^^^^^•V^BBBIB
4GPM. (15.2L / min )
W E I R B O X
RAPIDMIX
TANK
FLOCCULATIONBASIN (S)
2O.32.64GAL
(76J2I.6.2432L)
CLARIFIER
900 GAL.
PILOT PLANT
EFFLUENT
noi
SLUDGEWASTINGTANK
5 5 GAL(209L)
FIGURE 1. Schematic Diagram of Pilot Plant
II -13-
4ft various combinations of these two tanks. Effluent from the tanks flows
to a 900 gallon (3420 1) circular clarifier which provides a 3.75 hour
• detention time at 4 gpm (15.2 1/min.). The clarifier has a rim inlet
chamber and a center weir overflow. The cone shaped clarifier bottom
™ contains a shaft mounted sludge scraper and a plexiglass window to
• monitor sludge accumulation.
In addition to these treatment units, the facility also includes
• a weirbox, an alum'feed unit, and a sludge wasting tank. The weirbox
is mounted at the influent end of the pilot plant and is used to
m monitor and maintain the desired 4 gpm (15.2 1/min.).flowrate. The
• liquid alum feed is controlled by a Sigmamotor metering pump. It was
necessary to dilute the alum tenfold in order to accurately control
I the feed rate. By maintaining a constant flowrate at 41 ml/min. the
desired concentration of 175 mg/1 in the rapid mix tank was assured.
V The liquid alum was supplied by Holland Company of North Adams,
• Massachusetts. It contained 5.4 pounds of alum per gallon (0.74 kg/1).
Connected to the bottom of the clarifier is a 55 gallon (209 1)
M sludge wasting tank. Sludge sampling is accomplished by opening a
connecting valve which allows accumulated sludge to flow into the
• wasting tank,
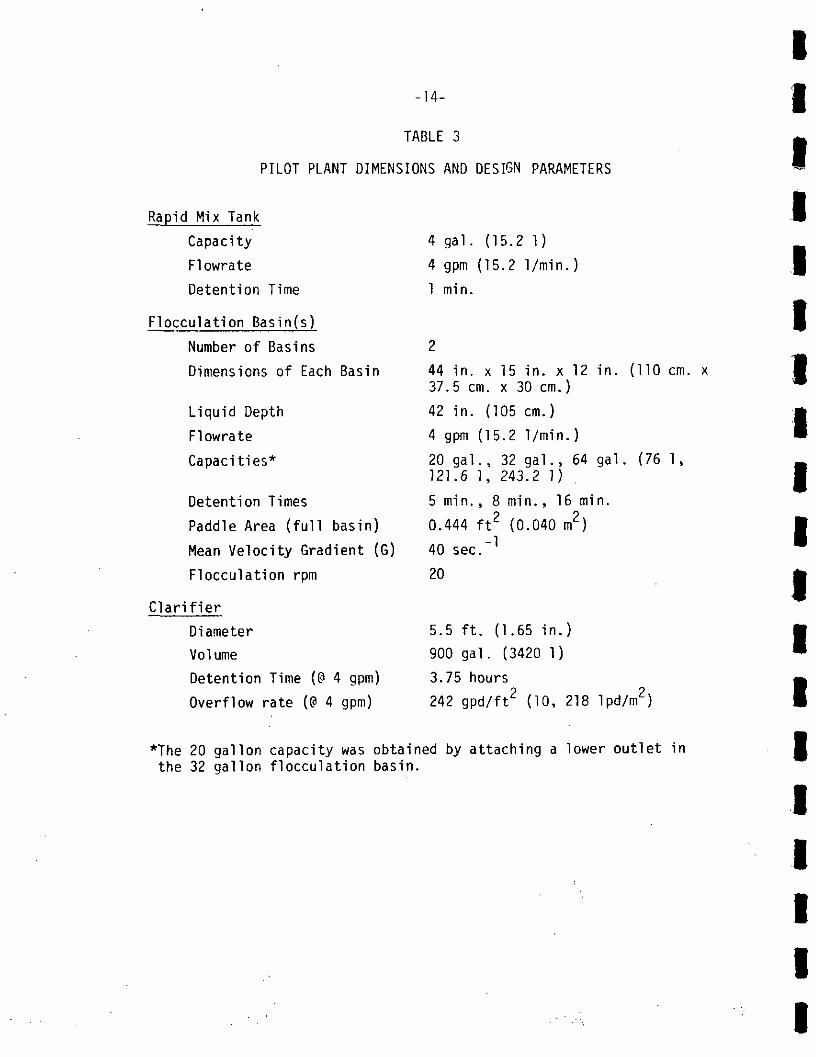
• A more detailed listing of the pilot plant dimensions and design
parameters is shown in Table 3.
I Operating Procedure
After connecting the flocculation bafcin(s) required for the desired
m detention time, primary effluent was discharged into the weirbox and
ii
-14-
TABLE 3
PILOT PLANT DIMENSIONS AND DESIGN PARAMETERS
Rapid Mix Tank
Capacity 4 gal. (15.2 1)
Flowrate 4 gpm (15.2 1/min.)
Detention Time 1 min.
Flocculation Basin(s)
Number of Basins 2
Dimensions of Each Basin 44 in. x 15 in. x 12 in. (110 cm. x37.5 cm. x 30 cm.)
Liquid Depth 42 in. (105 cm.)
Flowrate 4 gpm (15.2 1/min.)
Capacities* 20 gal., 32 gal., 64 gal. (76 1,121.6 1, 243.2 1)
Detention Times 5 min., 8 min., 16 min.
^-1
Paddle Area (full basin) 0.444 ft (0.040 m2)
Mean Velocity Gradient (G) 40 sec.
Flocculation rpm 20
Clarifier
Diameter 5.5 ft. (1.65 in.)
Volume 900 gal. (3420 1)
Detention Time (@ 4 gpm) 3.75 hours
Overflow rate (@ 4 gpm) 242 gpd/ft2 (10, 218 lpd/m2)
*The 20 gallon capacity was obtained by attaching a lower outlet inthe 32 gallon flocculation basin.
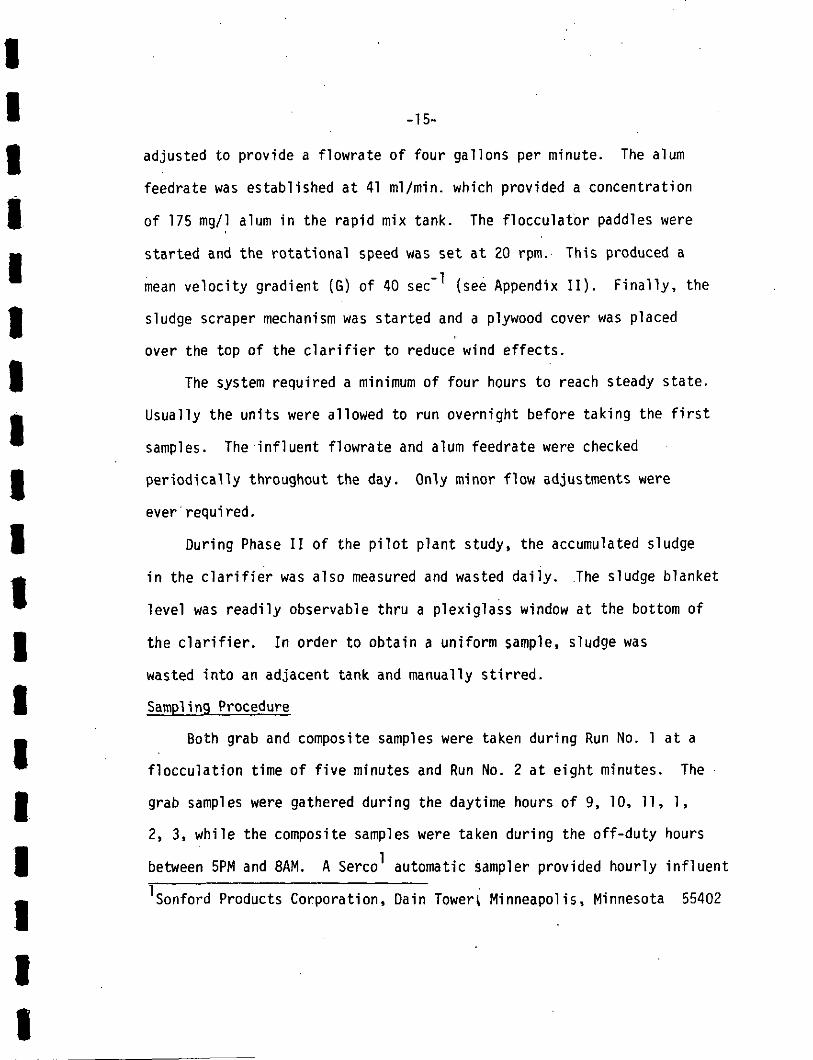
-15-
adjusted to provide a flowrate of four gallons per minute. The alum
feedrate was established at 41 ml/min. which provided a concentration
of 175 mg/1 alum in the rapid mix tank. The flocculator paddles were
started and the rotational speed was set at 20 rpm. This produced a
mean velocity gradient (G) of 40 sec" (see Appendix II). Finally, the
sludge scraper mechanism was started and a plywood cover was placed
over the top of the clarifier to reduce wind effects.
The system required a minimum of four hours to reach steady state.
Usually the units were allowed to run overnight before taking the first
samples. The influent flowrate and alum feedrate were checked
periodically throughout the day. Only minor flow adjustments were
ever required.
During Phase II of the pilot plant study, the accumulated sludge
in the clarifier was also measured and wasted daily. The sludge blanket
level was readily observable thru a plexiglass window at the bottom of
the clarifier. In order to obtain a uniform sample, sludge was
wasted into an adjacent tank and manually stirred.
Sampling Procedure
Both grab and composite samples were taken during Run No. 1 at a
flocculation time of five minutes and Run No. 2 at eight minutes. The
grab samples were gathered during the daytime hours of 9, 10, 11, 1,
2, 3, while the composite samples were taken during the off-duty hours
between 5PM and SAM. A Serco automatic sampler provided hourly influent
Sonford Products Corporation, Dain Toweri Minneapolis, Minnesota 55402
-16-
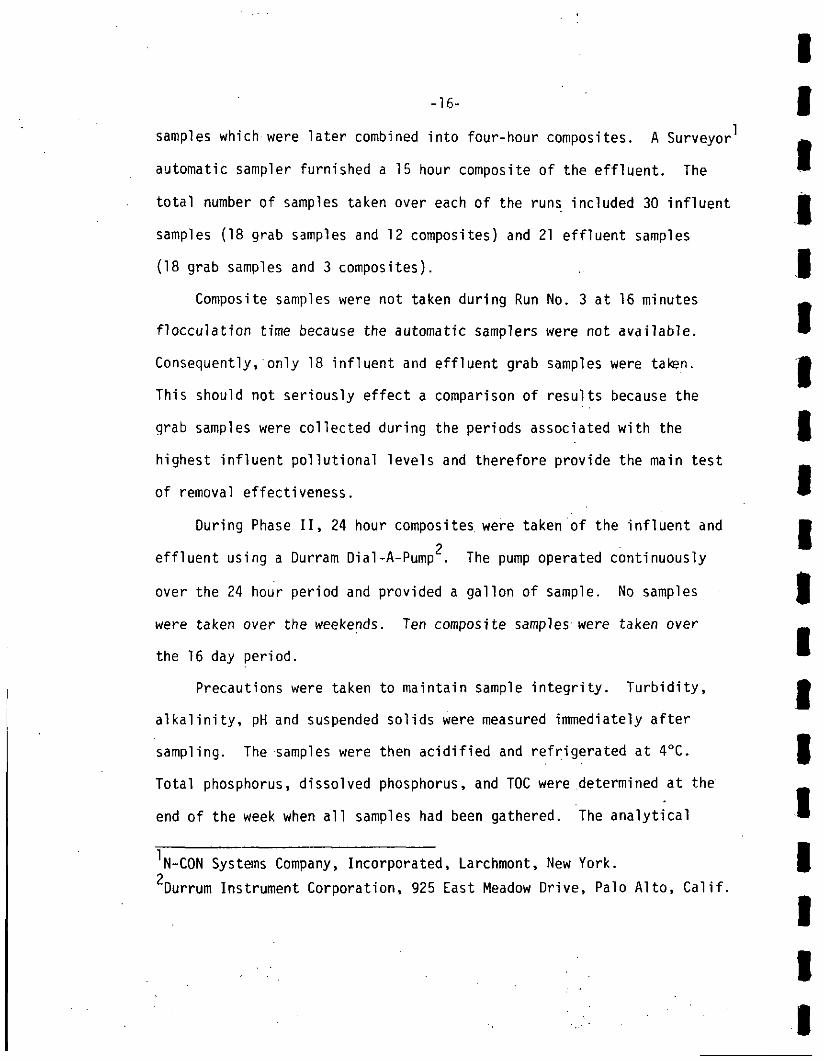
samples which were later combined into four-hour composites. A Surveyor
automatic sampler furnished a 15 hour composite of the effluent. The
total number of samples taken over each of the runs included 30 influent
samples (18 grab samples and 12 composites) and 21 effluent samples
(18 grab samples and 3 composites).
Composite samples were not taken during Run No. 3 at 16 minutes
flocculation time because the automatic samplers were not available.
Consequently, only 18 influent and effluent grab samples were taken.
This should not seriously effect a comparison of results because the
grab samples were collected during the periods associated with the
highest influent pollutional levels and therefore provide the main test
of removal effectiveness.
During Phase II, 24 hour composites, were taken of the influent and2
effluent using a Durram Dial-A-Pump . The pump operated continuously
over the 24 hour period and provided a gallon of sample. No samples
were taken over the weekends. Ten composite samples were taken over
the 16 day period.
Precautions were taken to maintain sample integrity. Turbidity,
alkalinity, pH and suspended solids were measured immediately after
sampling. The samples were then acidified and refrigerated at 4°C.
Total phosphorus, dissolved phosphorus, and TOC were determined at the
end of the week when all samples had been gathered. The analytical
N-CON Systems Company, Incorporated, Larchmont, New York.2Durrum Instrument Corporation, 925 East Meadow Drive, Palo Alto, Calif.
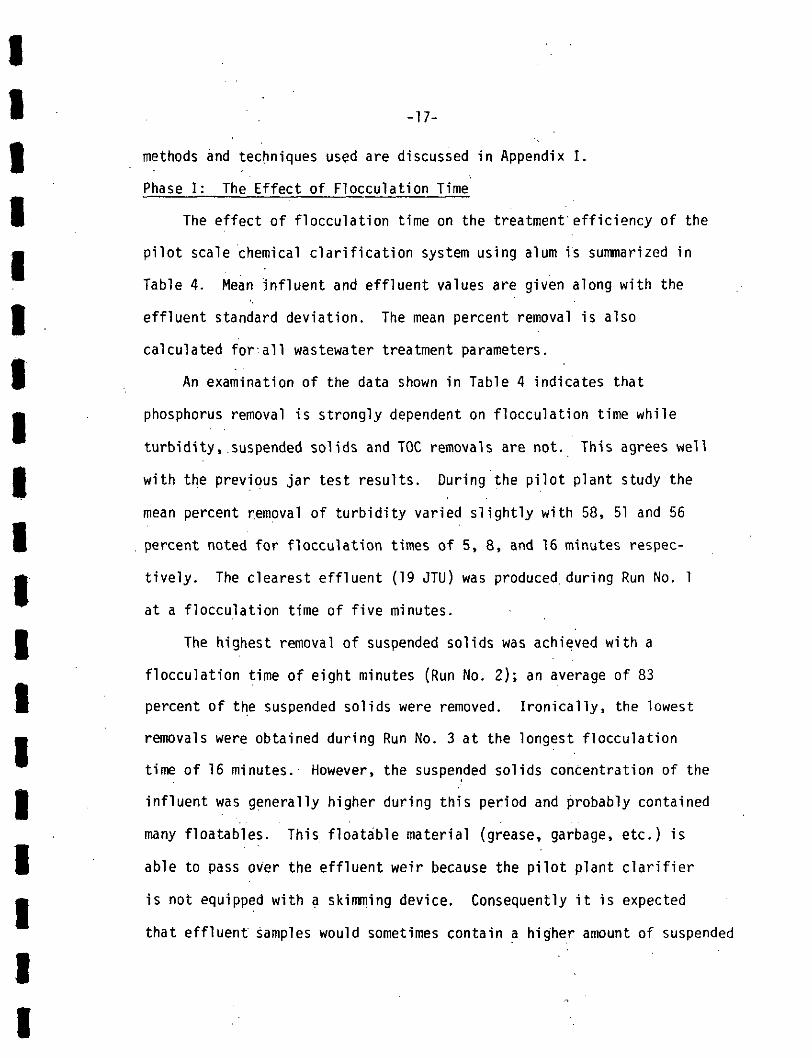
II• methods and techniques used are discussed in Appendix I.
Phase I: The Effect of Flocculation Time
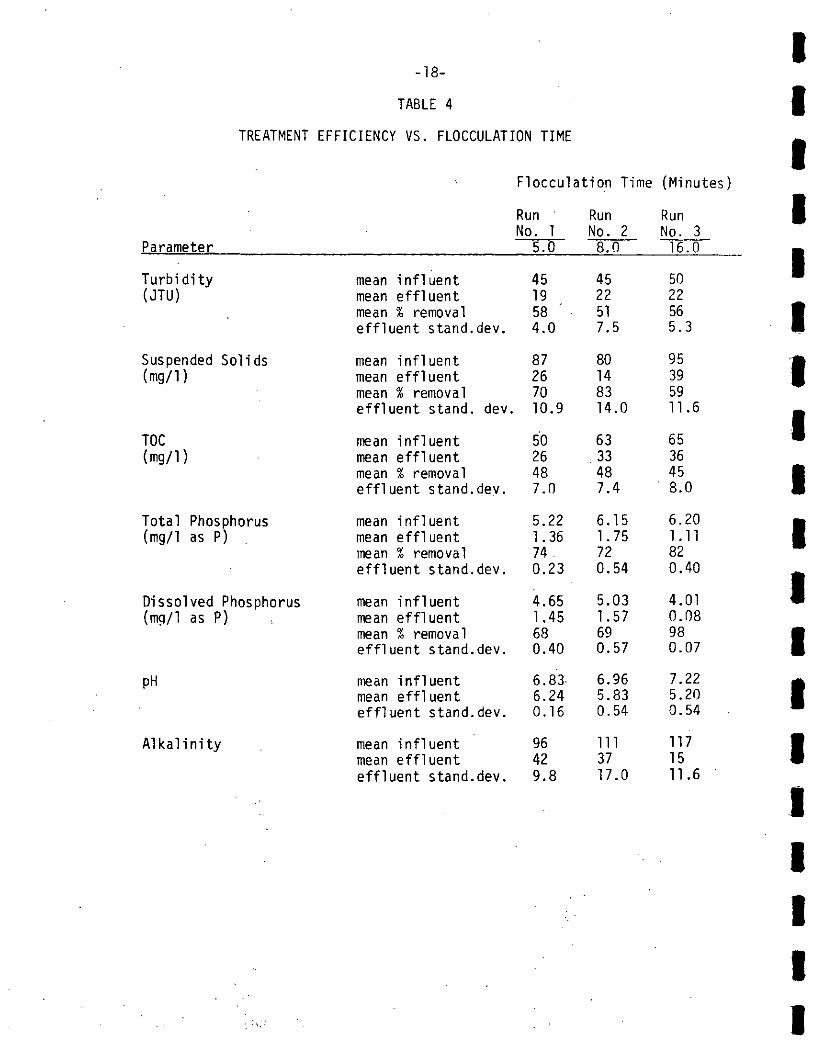
8 The effect of flocculation time on the treatment efficiency of the
m pilot scale chemical clarification system using alum is summarized in
Table 4. Mean influent and effluent values are given along with the
• effluent standard deviation. The mean percent removal is also
calculated for-all wastewater treatment parameters.
8 . An examination of the data shown in Table 4 indicates that
m . phosphorus removal is strongly dependent on flocculation time while
turbidity, .suspended solids and TOC removals are not. This agrees well
• with the previous jar test results. During the pilot plant study the
mean percent removal of turbidity varied slightly with 58, 51 and 56
8 . percent noted for flocculation times of 5, 8, and 16 minutes respec-
f tively. The clearest effluent (19 JTU) was produced, during Run No. 1
at a flocculation time of five minutes.
I The highest removal of suspended solids was achieved with a
flocculation time of eight minutes (Run No. 2); an average of 83
8 percent of the suspended solids were removed. Ironically, the lowest
M removals were obtained during Run No. 3 at the longest flocculation
time of 16 minutes.' However, the suspended solids concentration of the
8 influent was generally higher during this period and probably contained
many floatables. This floatable material (grease, garbage, etc.) is
8 able to pass over the effluent weir because the pilot plant clarifier
g is not equipped with a skimming device. Consequently it is expected
that effluent samples would sometimes contain a higher amount of suspended
Ii
-18-
TABLE 4
TREATMENT EFFICIENCY VS. FLOCCULATION TIME
Flocculation Time (Minutes)
RunNo. 1
Parameter
Turbidity(JTU)
Suspended Solids(mg/1)
TOC(mg/1)
Total Phosphorus(mg/1 as P) .
Dissolved Phosphorus(mg/1 as P)
PH
Alkalinity
mean influentmean effluentmean % removaleffluent stand. dev.
mean influentmean effluentmean % removaleffluent stand, dev.
mean influentmean effluentmean % removaleffluent stand. dev.
mean influentmean effluentmean % removaleffluent stand. dev.
mean influentmean effluentmean % removaleffluent stand. dev.
mean influentmean effluenteffluent stand. dev.
mean influentmean effluenteffluent stand. dev.
5.0
4519584.0
87267010.9
5026487.0
5.221.3674.0.23
4.651.45680.40
6.83.6.240.16
96429.8
RunNo. 28.0
4522517.5
80148314.0
6333487.4
6.151.75720.54
5.031.57690.57
6.965.830.54
1113717.0
RunNo. 316.0
5022565.3
95395911.6
6536458.0
6.201.11820.40
4.010.08980.07
7.225.200.54
1171511.6
IIIIIIIIIIIIIIIIIII
-19-
solids than normal. Later results obtained during Phase II of the pilot
plant studies will show that 81 percent of the suspended solids were
removed at the 16 minute flocculation time.
TOC removal remained relatively constant for all flocculation
times. Forty-eight percent of the TOC was removed during Run No. 1 and
Run No. 2 and 45 percent during Run No. 3.
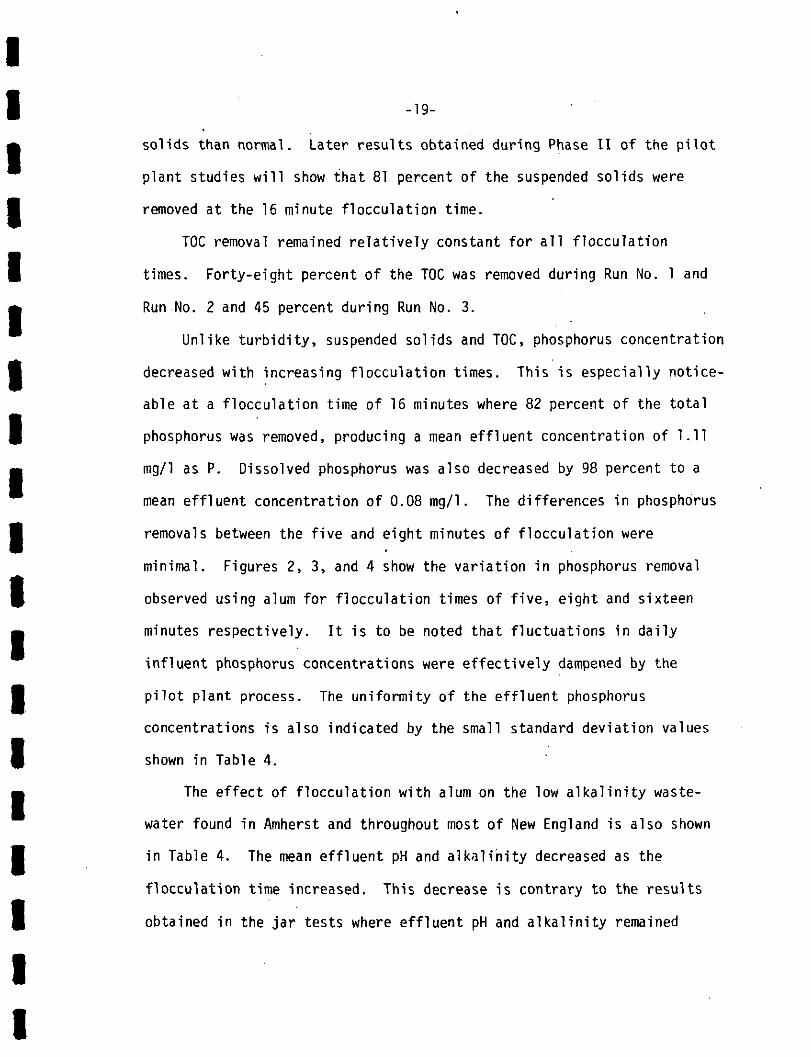
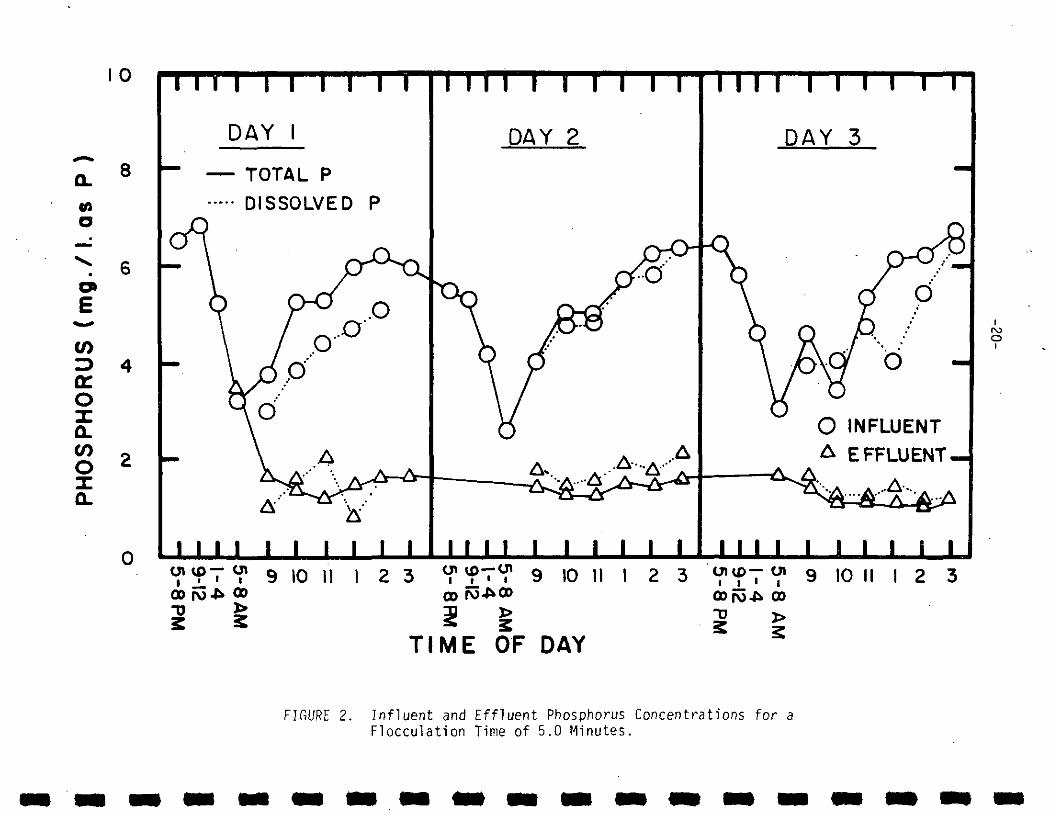
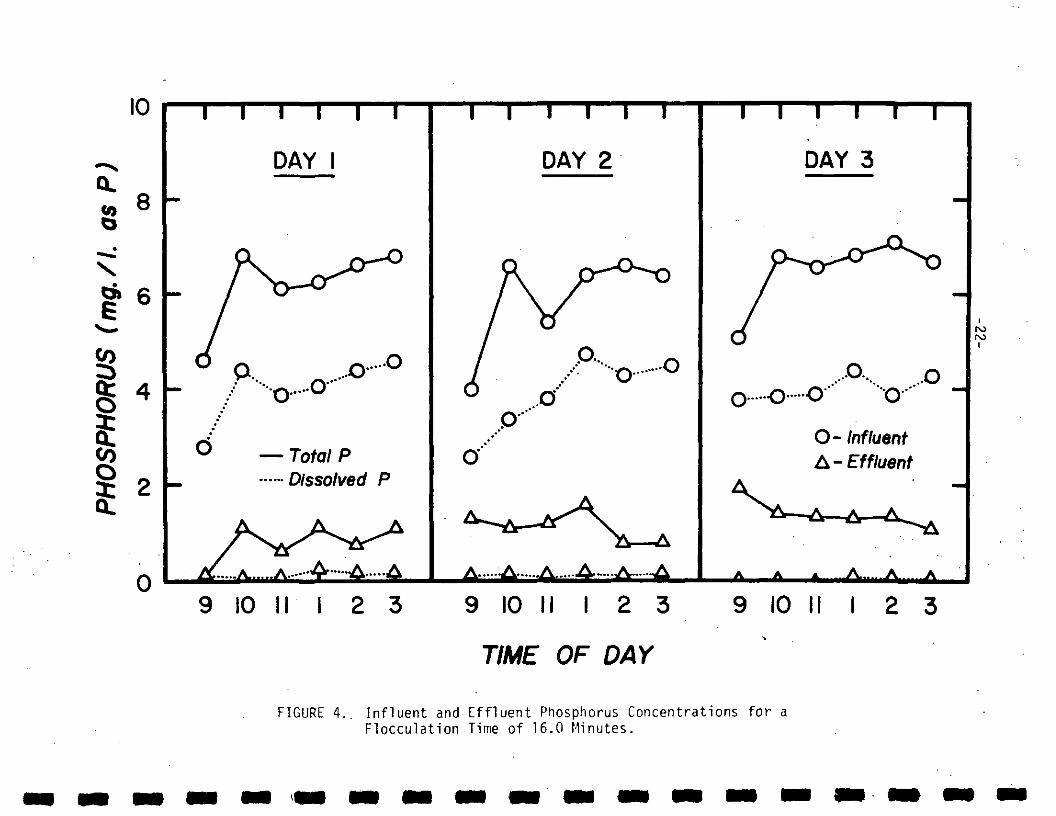
Unlike turbidity, suspended solids and TOC, phosphorus concentration
decreased with increasing flocculation times. This is especially notice-
able at a flocculation time of 16 minutes where 82 percent of the total
phosphorus was removed, producing a mean effluent concentration of 1.11
mg/1 as P. Dissolved phosphorus was also decreased by 98 percent to a
mean effluent concentration of 0.08 mg/1. The differences in phosphorus
removals between the five and eight minutes of flocculation were
minimal. Figures 2, 3, and 4 show the variation in phosphorus removal
observed using alum for flocculation times of five, eight and sixteen
minutes respectively. It is to be noted that fluctuations in daily
influent phosphorus concentrations were effectively dampened by the
pilot plant process. The uniformity of the effluent phosphorus
concentrations is also indicated by the small standard deviation values
shown in Table 4.
The effect of flocculation with alum on the low alkalinity waste-
water found in Amherst and throughout most of New England is also shown
in Table 4. The mean effluent pH and alkalinity decreased as the
flocculation time increased. This decrease is contrary to the results
obtained in the jar tests where effluent pH and alkalinity remained
8
MO
t 6
v>z>a:oa.v>o
i i i I II n FT
DAY I
~ — TOTAL P
DISSOLVED P
I I I I I I II II
DAY 2
O INFLUENT
EFFLUENT-
I I I I I I i I I I
I I I I I I I I I I
DAY 3
oI
I I I I i I I I i I9 10 II 1 23 9 10 II I 10 II I 2 3
oo oo oo
TIME OF DAY1
FIGURE 2. Influent and Effluent Phosphorus Concentrations for aFlocculation Time of 5.0 Minutes.
I I I I 1 1 I I 1 I
DAY
i i i I i I i i I i
DAY 2
I I I I I I I I 1 I
DAY 3
— Total P— Dissolved P
O-InfluentA-£ff/uent
i I I I I I I I I • i i i I i i i i i ii l lCJl 10 7- Ol Q |f\I ' i & l\J 2 3
T/ME OF
FIGURE 3. Influent and Effluent Phosphorus Concentrations for aFlocculation Time of 8.0 Minutes.
10
to 8
£ 6
3S 4
0
I I I I I I
DAY
O
— Total PDissolved P
A A
I I I I I I
DAY 2
O
A A-.....A A~...,A... .-A
I I I I I I
DAY 3
,.-0-,. ..OO O O" "O"" "1
O- InfluentA- Effluent
A. A A
9 10 I I I 23 9 10 II I 23
TIME OF DAY
9 10 I I I 23
FIGURE 4.. Influent and Effluent Phosphorus Concentrations for aFlocculation Time of 16.0 Minutes.
-23-
relatively constant. It is also to be noted that the mean effluent pH
values were below 6.0 at the 8 and 16 minute flocculation times. The
probable cause of this result is a temporary overdosing of alum.
Consequently, it appears that a pH monitoring or control system is
necessary in order to avoid temporary overdoses which may cause
serious pH reductions or alkalinity depletions.
Phase II: Pilot Plant Performance at Optimum Flocculation Time
Phase I study confirmed jar test findings in that greater phosphorus
removals were possible using a longer period of flocculation. However,
in order to more fully evaluate the performance of the chemical
clarification process using alum, it was decided to extend the study
period to 16 days. The Phase I study only provided a three day
evaluation period at the optimum 16 minute flocculation time. Infor-
mation was also needed in Phase II, on the sludge characteristics and
accumulation rate. Studies of longer duration will be conducted in
conjunction with the upcoming ammonia removal investigations with
activated carbon. This information will be contained in a subsequent
report.
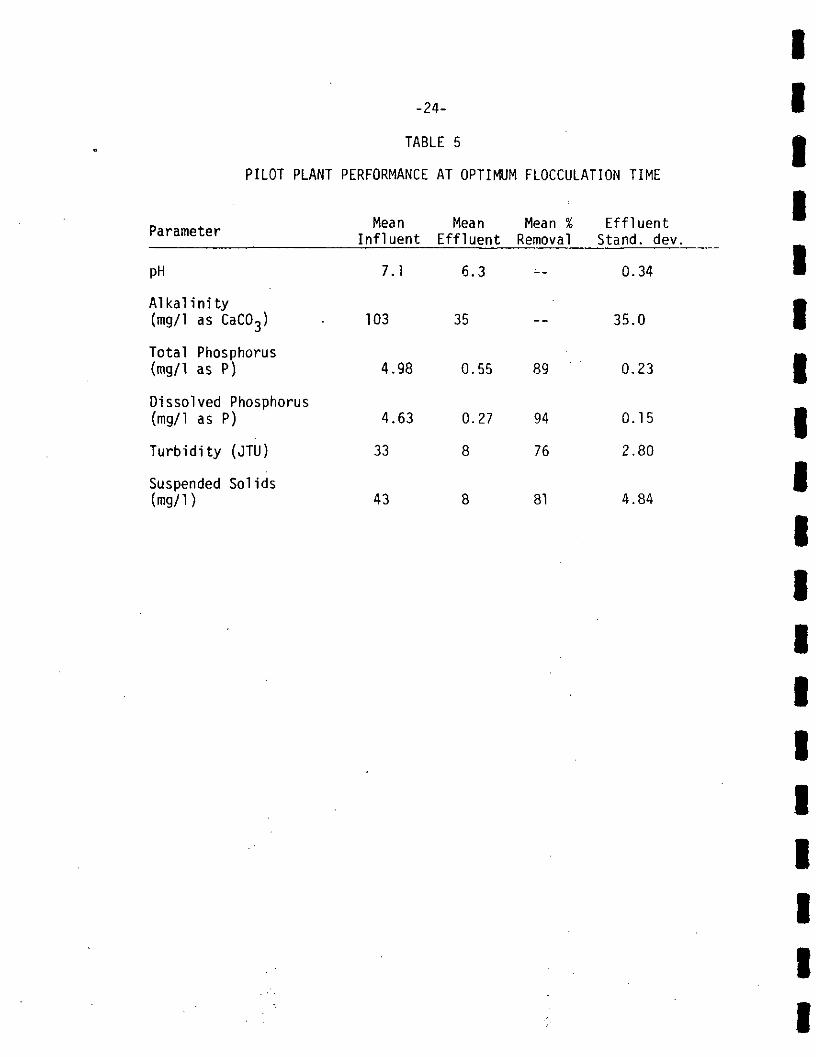
The data obtained from the Phase II study is summarized in Table 5.
During the phase II study, the mean influent concentrations were slightly
lower than those experienced in the Phase I study. This can be seen by
comparing the mean influent values in Table 4 with those in Table 5.
The cause of this discrepancy is the improved treatment efficiency of
the Amherst plant during the summer months when the student population
is minimal. That is, the clarifiers of the Amherst plant are able to
-24-
TABLE 5
PILOT PLANT PERFORMANCE AT OPTIMUM FLOCCULATION TIME
Mean Mean Mean % EffluentInfluent Effluent Removal Stand, dev.
pH 7.1 6.3 -- 0.34
Alkalinity(mg/1 as CaC03) • 103 35 — 35.0
Total Phosphorus(mg/1 as P) 4.98 0.55 89 0.23
Dissolved Phosphorus{mg/1 as P) 4.63 0.27 94 0.15
Turbidity (JTU) 33 8 76 2.80
Suspended Solids(mg/1) 43 8 81 4.84
-25-
effectively treat the lower summer flows. As in Phase I, the Amherst
plant effluent was used as the pilot plant influent.
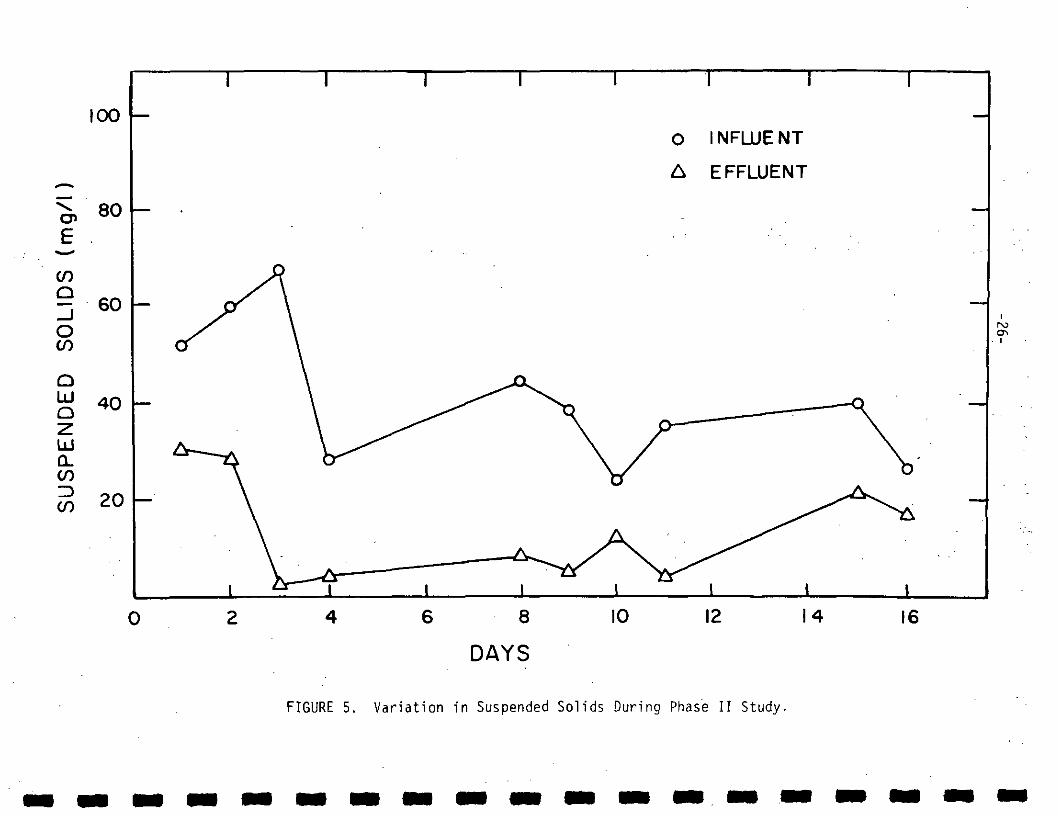
The only parameter significantly affected by the improved perfor-
mance of the Amherst clarifiers was the influent suspended solids
concentration. It ranged between an average of 80 to 95 mg/1 during
the Phase I study while Phase II produced an average value of only 43
mg/1. Although higher suspended solids concentrations would provide
I better test of the system, the main concern of this study is the
g effectiveness and suitability of alum for removing phosphorus in low
alkalinity wastewaters. It is already well known that alum addition
I enhances suspended solids removal. Even with this low influent con-
centration, the average removal of suspended solids during Phase II
| was 81 percent with a mean effluent concentration of 8 mg/1 being
• produced. Figure 5 shows the influent and effluent suspended solids
concentrations during the study period.
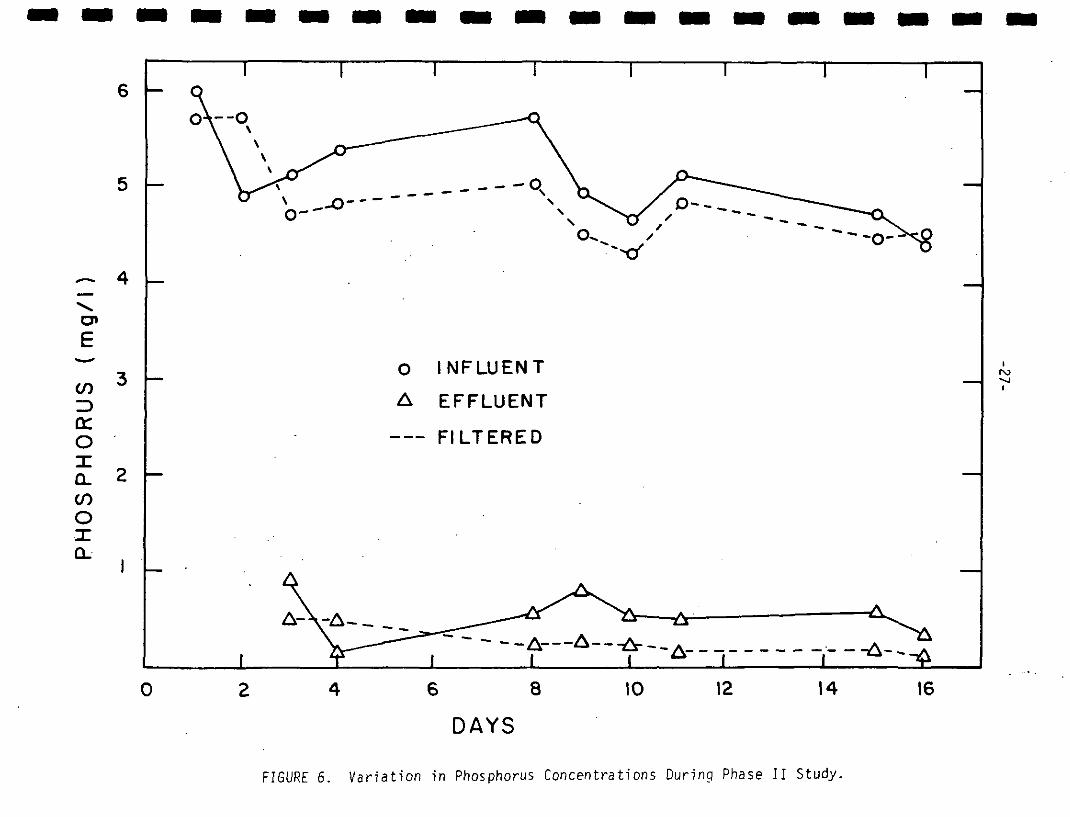
I As shown in Table 5, 89 percent of the total phosphorus and 94
percent of the dissolved phosphorus was removed during the Phase II
I study. The individual total and dissolved sample concentrations are
£ shown in Figure 6. The mean effluent concentrations were 0.55 and 0.27
• mg/1 as P for total phosphorus and dissolved phosphorus respectively.
• This treatment efficiency should satisfy most phosphorus removal
requirements. However, it may be possible to reduce total phosphorus
I concentrations .even further by injecting an anionic polymer into a lower
f energy mixing zone following alum addition. The polymer would aid in
settling suspended matter which contains much of the residual phosphorus,
ii
100 -
80
O INFLUENT
A EFFLUENT
en9 sooCO
QLJQZLiJO.
cn
40
20
0 8
DAYS
10 12
roCTiI
FIGURE 5. Variation in Suspended Solids During Phase II Study,
o-
~ 4
IDo:o
O INFLUENT
A EFFLUENT
FILTERED
ro>-ji
eno
A
o 6 8
DAYS
10 12 14 16
FIGURE 6. Variation in Phosphorus Concentrations During Phase II Study.
-28-
The total phosphorus concentration of this effluent would then be nearly
equal to dissolved phosphorus concentrations.
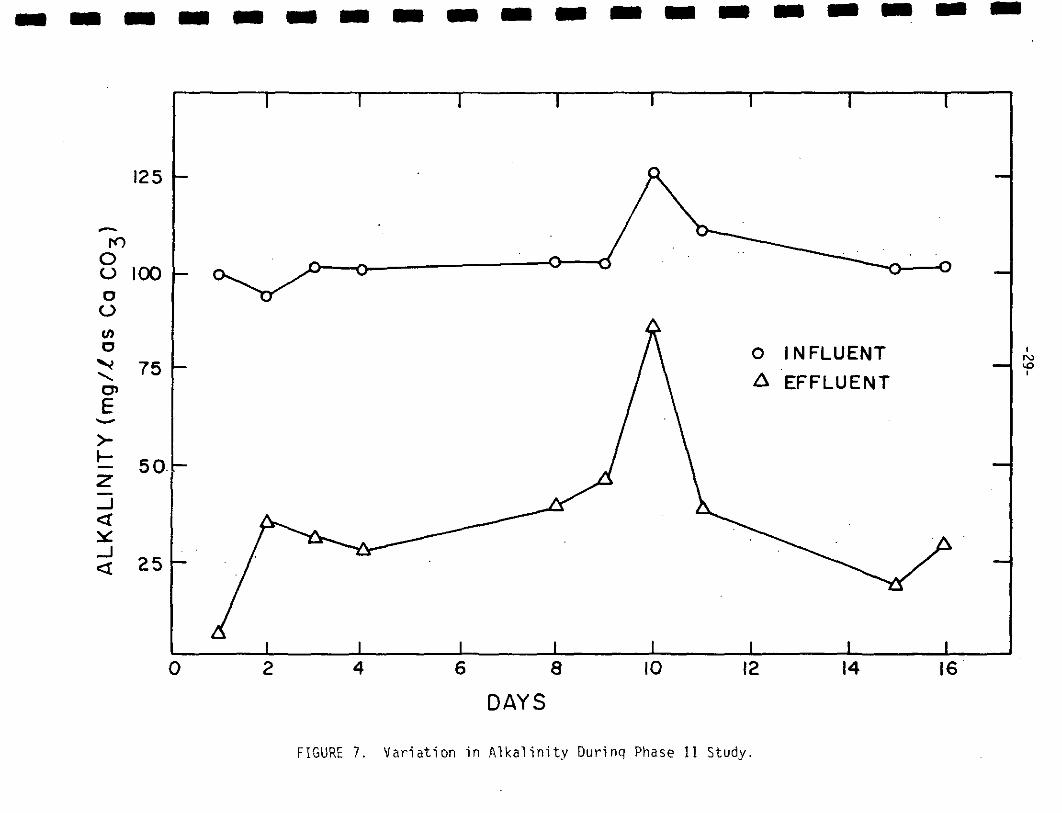
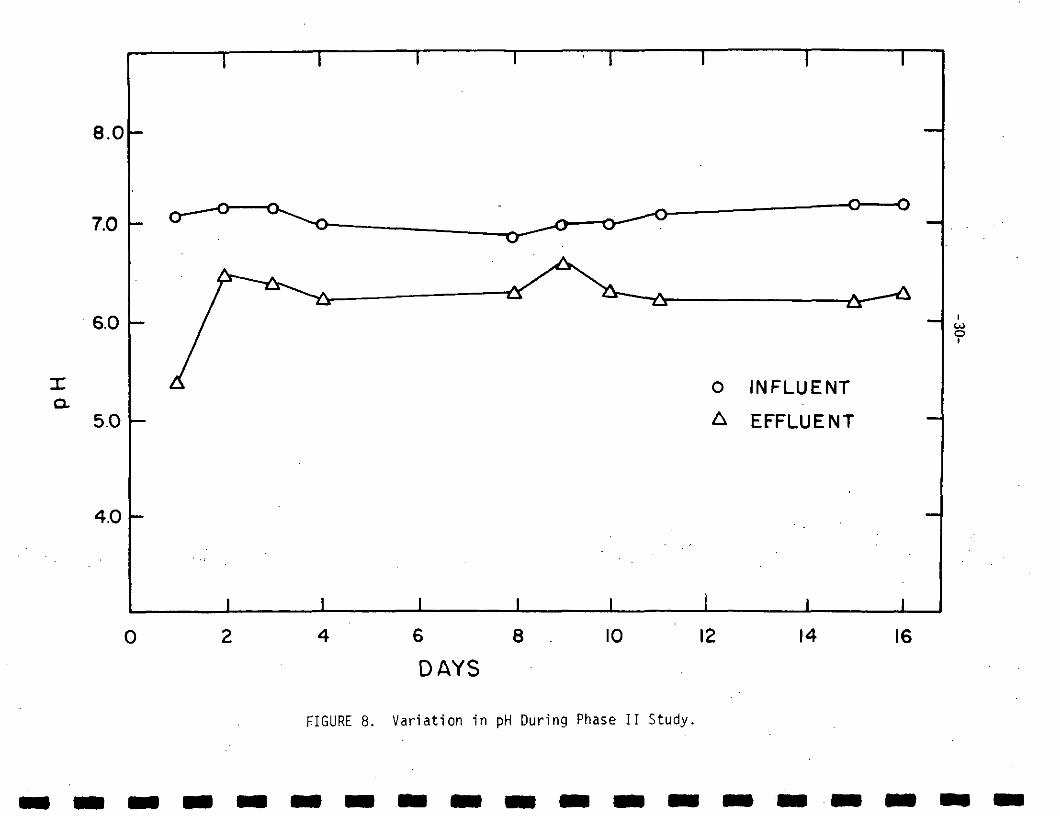
On the average, alkalinity and pH were not severely depressed
during the Phase II study even though 2.76 inches of rain fell during
the 16 day period. Alkalinity and pH readings are shown in Figures 7 and
8. The mean effluent pH was 6.3 and the alkalinity was reduced to 35
mg/1 as CaCOn from an influent of 103 mg/1 as CaCO^. However, as shown
in Figure 7 the lowest alkalinity recorded during the Phase II study was
only 7 mg/1 and the pH was 5.4. Similar low pH values were recorded
during the Phase I study. The occurrence of occasional pH depressions
as noted in both pilot plant studies reinforces the conclusion that
some degree of pH control or monitor system is necessary. Such a
system would warn the operator of any malfunction in the alum feed
system and maintain the effluent pH above 6.0.
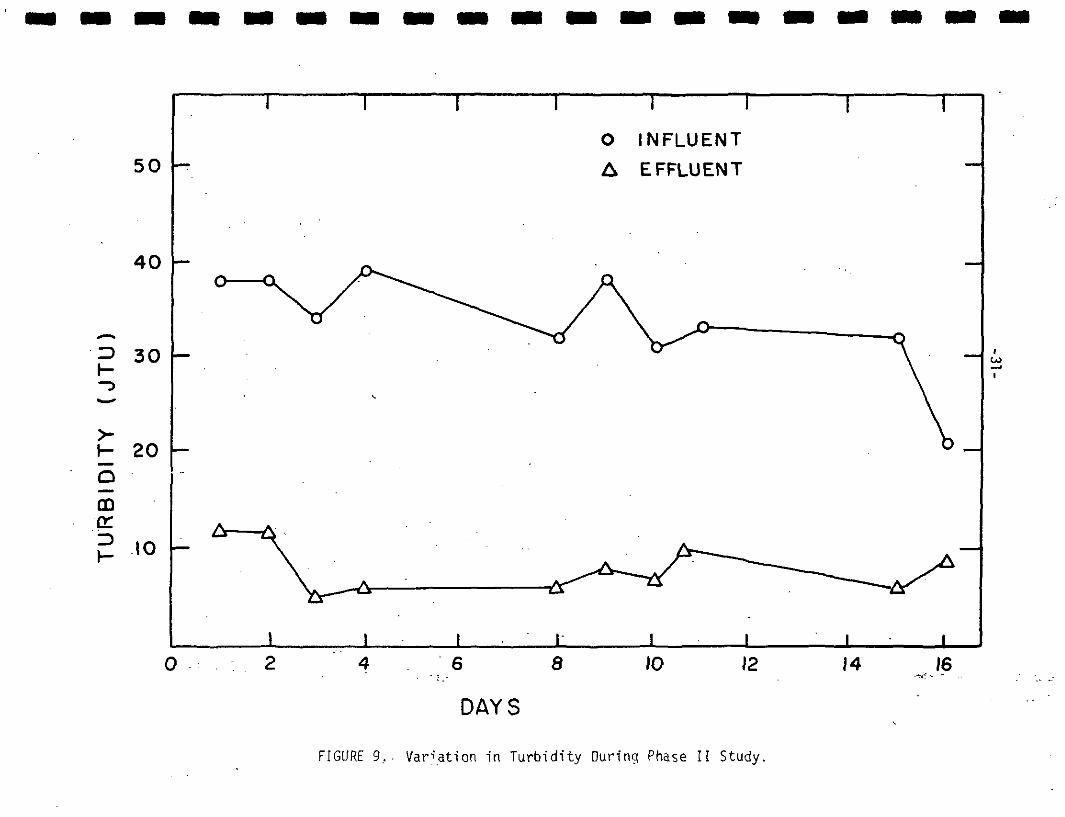
The use of alum in the chemical clarification process produces a
very clear effluent as revealed by the turbidity removal data. Seventy-
six percent of the turbidity was removed; the-average effluent turbidity
was 8 JTU. Daily influent and effluent concentrations of turbidity are
shown in Figure 9.
Sludge Production
Sludge collected during the Phase II study was usually black near
the bottom of the clarifier and grey near the top of the sludge blanket.
It had an objectionable odor and often times contained sludge worms if
not wasted daily. The most notable sludge characteristics measured were
specific gravity (1.0045) and total volatile dry solids (58 percent).
125
roOOoO
100
^ 75
i.- 50
< 25 -
0 8 10
DAYS
O INFLUENT
A EFFLUENT
ro10
12 14 16
FIGURE 7. Variation in Alkalinity Durinq Phase II Study.
8.0
7.0
6.0
Ia.
5.0
O INFLUENT
A EFFLUENT
COOI
4.0
0 8
DAYS
10 12
FIGURE 8. Variation in pH During Phase II Study.
14 16
50
O INFLUENT
A EFFLUENT
O
CDa:IDi-
40
30
20
(O
DAYS
8 10 12 14 16
FIGURE 9... Variation in Turbidity During Phase I! Study
-32-
Approximately 50 gallons C 190 1) of wet sludge were wasted daily
from the 5760 gallon per day pilot plant. Scaled up accordingly, this
is equivalent to 8680 gallons per million gallons. Assuming that the
total wet sludge accumulation rate is equivalent to the sum of the
Amherst STP and pilot plant sludge accumulation rates, the total wet
sludge accumulation rate is therefore 11,225 gallons per million gallons
(Amherst STP sludge wastage rate - 2545 gallons per million gallons).
This large volume is not surprising considering the light gelatinous
nature of alum sludges as evidenced by the average dry solids concen-
tration of 1.25 percent obtained in this study. These results are
similar to those reported in the EPA Process Design Manual for Sludge
Treatment and Disposal (8) where the percent sludge solids averaged 1.2
percent and the sludge volume production rate varied between 10,000
and 36,000 gallons per million gallons.
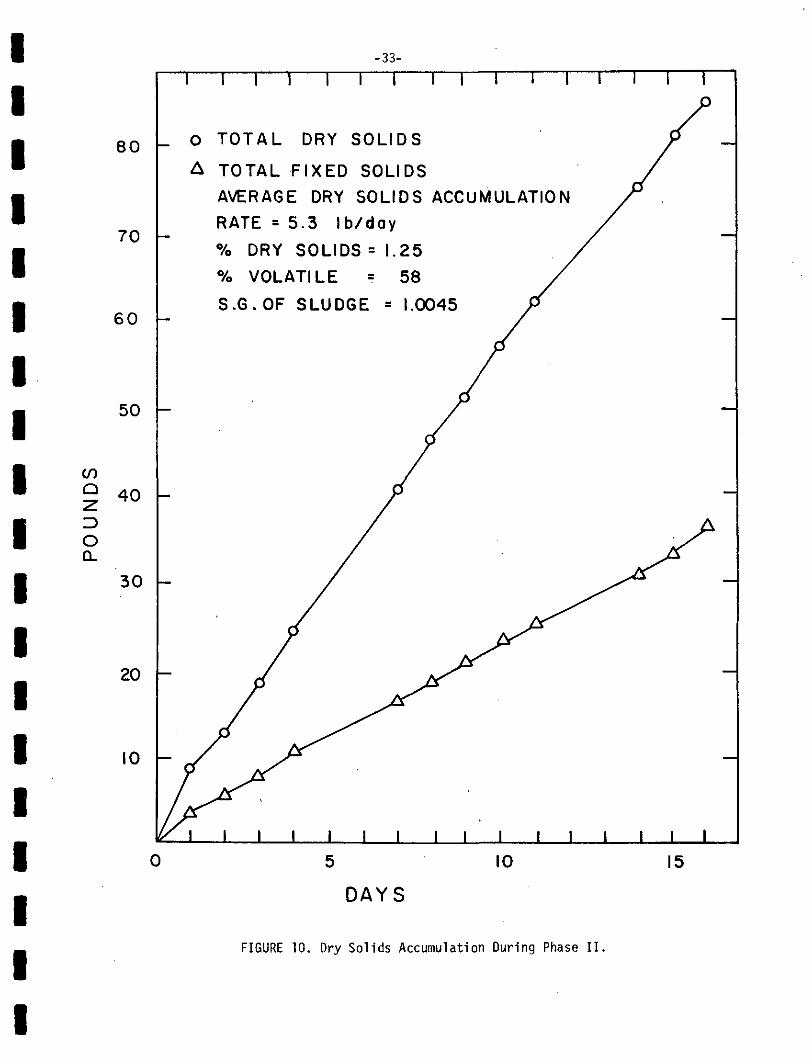
The dry solids accumulation during the Phase II study is shown in
Figure 10. Both the cummulative pounds of total and fixed solids wasted
over the 16 day period are represented. From this data the average dry
solids accumulation rate was determined to be 5.3 pounds (2.4 kg) per
day or 920 pounds (414 kg) per million gallons of sewage. Similar
results were obtained in a study by Burns and Shell (9) where 930
pounds per million gallons was obtained from a wastewater of comparative
strength. If the dry solids accumulation rate resulting from the
Amherst primary clarifiers (1180 pounds per million gallons) is added to
the alum generated sludge (920 pounds per million gallons) the total
sludge accumulation rate is then 2100 pounds per million gallons. From
IIIIIIIIIIIIIIIIIII
8O
70
60
50
Q2IDOQ_
40
30
10
-33-
T \ T
O TOTAL DRY SOLIDS
A TOTAL FIXED SOLIDS
AVERAGE DRY SOLIDS ACCUMULATION
RATE = 5.3 Ib/day
% DRY SOLIDS = 1.25
% VOLATILE 58
S.G.OF SLUDGE = 1.0045
I I I I I I I I I I I I10 15
D A Y S
FIGURE 10. Dry Solids Accumulation During Phase II.
-34-
this data it is apparent that the use of alum in the chemical clarifi-
cation process will nearly double the dry solids accumulation rate of
primary sedimentation alone.
Table 6 summarizes the findings obtained for alum sludge production
in treatment of primary effluent and the estimated production of sludge
in a raw wastewater feed system.
Future studies will be aimed at measurement of sludge accumulation
when raw wastewater is used as the influent to the chemical
clarification system. Moreover, these later studies will focus
attention upon pilot scale testing of alternative methods of sludge
handling.

-35-
TABLE 6
ESTIMATED SLUDGE PRODUCTION FOR ALUM'
ADDITION TO RAW WASTEWATER
SludgeProductionParameter
% Solids
gal./M.G.
Ibs/M.G.
AmherstPrimarySludge
5.5
2,545
1,180
Pilot PlantAlum Sludge(AmherstPrimary
Effluent Feed)
1.25
8,680
920
Estimated TotalSludge UsingRaw Wastewater
2.25*
11,225
2,100
Calculated from volume and pounds of sludge produced,
assuming specific gravity of 1.0.
-36-
COST OF CHEMICAL CLARIFICATION WITH ALUM
It is beyond the scope of this study to present detailed cost
analyses for chemical clarification with alum. These costs will vary
according to the size of the treatment facility and the degree of
removal required. Costs will also differ between new plants and
upgraded facilities. The most detailed and usable cost information
can be found in EPA Technology Transfer Publications (4,5,6,7). Pub-
lications by Cecil (10), Minton and Carlson (11), and Geinopolos and
Vilen (12) also present valuable cost information.
A major portion of the total cost of chemical clarification with
alum is the cost of alum itself. Using Amherst as an example, almost
6600 pounds of alum would be required daily (average flowrate =
4.5 MGD). Based on a cost of $0.04 per pound of dry alum (dry alum
is 49 percent by weight of liquid alum) the cost of alum treatment is
then approximately $0.06 per 1000 gallons. Including the cost of a
storage and feeding system at $0.02 per 1000 gallons (5) and a supple-
mentary sludge handling cost of $0.01 per 1000 gallons (5) the total
cost of chemical clarification would be approximately $0.09 per 1000
gallons of which 66 percent would be the cost of alum. Pending the
development of a viable method of alum recovery, the chemical cost
of alum will continue to be a major cost item in the clarification
process.
-37- ;
CONCLUSIONS
1) The chemical clarification process using alum can be applied to
low alkalinity wastewaters provided a pH control or monitor system
is included in the process design.
2) Chemical clarification with alum can produce, an effluent of
sufficient quality to meet most secondary treatment requirements.
During the pilot plant demonstrations at optimum flocculation time
89 percent of the total phosphorus, 94 percent of the dissolved
phosphorus, 76 percent of the turbidity, and 81 percent of the
suspended solids were removed. These removals were achieved
using an alum dosage of 175 mg/1. The average pH and alkalinity
of the effluent was 6.3 and 35 mg/1 as CaC03 respectively.
3) Flocculation time has a significant effect on the amount of
phosphorus removed from wastewater. Jar tests and pilot studies
. indicate that flocculation times of 15 minutes or greater pro-
. ,\duced the least effluent phosphorus concentrations.
4) Removal of turbidity, suspended solids, and TOC did not appear
to be a function of flocculation time.
5) Jhe dry solids accumulation rate doubled as a result of alum addi-
tion. Fifty-eight percent of the dry solids were volatile.
6) The resulting chemical sludge produced in the clarification pro-
cess had a moisture content of 98 percent. A denser sludge should
be produced by the combined removal of primary and chemical sludge
in a full-scale clarifier. More tests are needed to determine
sludge dewaterability.
-38-
7. A major portion of the total cost of the chemical clarification
process is the high cost of alum. Based on a cost of $0.04 per
pound of dry alum, the total cost of alum addition would be
approximately $0.09 per 1000 gallons of which $0.06 per 1000
gallons would be the cost of alum.
-39-
REFERENCES
1. Massachusetts Water Quality Standards, Massachusetts WaterResources Commission, adopted April 11, 1974.
2. Rules and Regulations, Title 40, Subchapter D, Part 133 -Secondary Treatment Information, Federal Register, Vol. 38,No. 159, August 17, 1973.
3. Bowen, S. P., "Evaluation of Process Design Parameters for Phos-phorus Removal from Domestic Wastewater by Chemical Clarification"Doctoral Dissertation, University of Massachusetts, Department ofCivil Engineering (1974).
4. Process Design Manual for Phosphorus Removal, Black and VeatchConsulting Engineers, U. S. Environmental Protection AgencyTechnology Transfer (October 1971).
5. Laughlin, J. E., "Designing to Remove Phosphorus Using Metal Saltsand Polymers in Conventional Plants," presented at EPA TechnologyTransfer Design Seminar for Wastewater Treatment Facilities,Boston, Ma. (Sept. 1974.)
6. "Physical-Chemical Wastewater Treatment Plant Design," EPA Tech-nology Transfer Publication (August 1973).
7. "Physical-Chemical Processes," prepared for the U. S. EnvironmentalProtection Agency Technology Transfer Design Seminar, NERC,Cincinnati, Ohio, {September 1974J.
8. Process Design Manual for Sludge Treatment and Disposal, U. S.Environmental Protection Agency Technology Transfer, EPA 623/1-74-006, p. 3-5 (October 1974).
9. Bums, D. E. and Shell, G. L., "Physical Chemical Treatment ofa Municipal Wastewater Using Powdered Carbon," EnvironmentalProtection Technology Series, EPA-R2-73-264 {August 1973}
10. Cecil, L. K., "Evaluation of Processes Available for Removal ofPhosphorus from Wastewater," for the Office of Research andMonitoring EPA, Project No. 17010DRF (October 197T}.
11. Minton, G. R. and Carlson, D. A., "Combined Biological-ChemicalPhosphorus Removal," Jour. Water Poll. Control Fed., 44, 1736(1972).
12. Geinopolos, A. and Vilen, F. I., "Process Evaluation-PhosphorusRemoval," Jour. Water Poll. Control Fed., 43, 1975 (1971).
-40-
APPENDIX I - ANALYTICAL TECHNIQUES
All analyses were performed in accordance with the 13th Edition
of Standard Methods for the Examination of Uater and Hastewater.
The method of analysis selected for each measured parameter is dis-
cussed below.
Phosphorus - Total phosphorus was determined by both the Vana-
domolybdophosphoric acid and Ascorbic Acid methods. The former
method was used during the jar tests and Phase I pilot plant studies
were relative concentrations and were of primary concern. The latter
method was used during the Phase II pilot plant studies where the
lowest effluent phosphorus concentrations were experienced. The
persulfate digestion preceeded both methods.
All glassware was washed in hot 1 + 1 hydrochloric acid and filled
with distilled water until use. At least two standards were analyzed
with every test and colorimetric determinations were made on a Bausch
and Lomb Spectronic 20.
Soluble phosphorus was determined by filtration through a 0.45
micron membrane filter prior to analysis.
Alkalinity - Alkalinity was measured by titrating each sample
with .01N HoSO* to an endpoint of 4.5. Potentiometric titrations were
carried out using an Orion expanded scale pH meter. Results are
expressed in mg/1 as CaC03.
Total Organic Carbon - A Beckman Model 915A Organic Carbon Analyzer
was used in analyzing 20 microliter samples. Replicate injections
were made until reproducible results were obtained. A calibration
-41-
curve was generated before each use.
Turbidity - Turbidity measurements were obtained using a Hach
Model 2100A Turbidimeter. The meter was standardized before each use
and the data was expressed in Jackson Turbidity Units.
Suspended Solids - The glass fiber filter technique with a membrane
filter holder was used throughout the study. The volatile portion was
determined by ignition at 550°C for 15 minutes.
Total Solids - Fifty milliliters of sample was evaporated on a
dried and tared dish. The residue was dried at 103°C, cooled in a
dessicator, and weighed.
Total Volatile and Fixed Residue - The residue from the total
solids determination was ignited at 550°C for 15 minutes, cooled and
weighed.
-42-
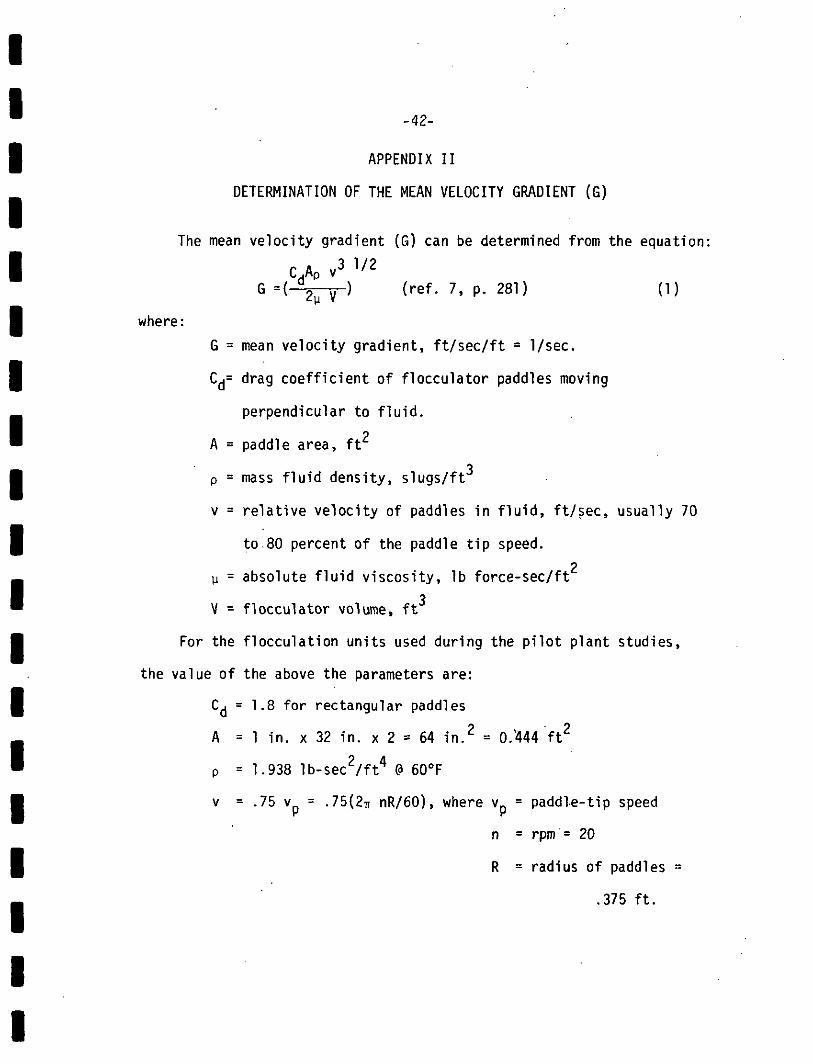
APPENDIX II
DETERMINATION OF THE MEAN VELOCITY GRADIENT (G)
The mean velocity gradient (G) can be determined from the equation:3 1/2C.AP vj l/£-
G =( % v ) (ref. 7, p. 281) (1)
where:G = mean velocity gradient, ft/sec/ft = I/sec.
Cj= drag coefficient of flocculator paddles moving
perpendicular to fluid.
A = paddle area, ft
3p = mass fluid density, slugs/ft
v = relative velocity of paddles in fluid, ft/sec, usually 70
to.80 percent of the paddle tip speed.
p = absolute fluid viscosity, Ib force-sec/ft3
V = flocculator volume, ft
For the flocculation units used during the pilot plant studies,
the value of the above the parameters are:
Cj = 1.8 for rectangular paddles
A = 1 in. x 32 in. x 2 = 64 in.2 = 0/444 "ft2
p = 1.938 Ib-sec2/ft4 @ 60°F
v = .75 v = .75(2ir nR/60), where v_ = paddle-tip speed
n = rpm = 20
R = radius of paddles =
.375 ft.
-43-
y = 2.36 x 10~5 lb-sec/ft2
V = 32 gal. = 4.278 ft3
Substituting in equation 1, the mean velocity gradient G is 40 sec"
This is well within the range of 20 to 75 sec" recommended in
"Wastewater Engineering" (ref. 7, p. 282).