Pile group tension cyclic loading: Field test … Health & Safety Executive Pile group tension...
51
HSE Health & Safety Executive Pile group tension cyclic loading: Field test programme at Kinnegar N.Ireland Prepared by Imperial College Consultants (ICON) for the Health and Safety Executive 2003 RESEARCH REPORT 101
Transcript of Pile group tension cyclic loading: Field test … Health & Safety Executive Pile group tension...
HSE Health & Safety
Executive
Pile group tension cyclic loading: Field test programme at Kinnegar N.Ireland
Prepared by Imperial College Consultants (ICON) for the Health and Safety Executive 2003
RESEARCH REPORT 101

HSE Health & Safety
Executive
Pile group tension cyclic loading: Field test programme at Kinnegar N.Ireland
B.M. Lehane (Univ. of Western Australia)
R.J. Jardine (Imperial College London)
B.A. McCabe (University College Galway)
This report describes an experimental investigation into the performance under cyclic tension loading of field-scale pile groups, and single piles, driven in soft clay. The work was commissioned by the UK Health and Safety Executive (HSE) and was performed by Imperial College London (IC) and Trinity College Dublin (TCD). TCD conducted the fieldwork, with assistance from IC, at a test site in Kinnegar, near Belfast, Northern Ireland. The project was developed as an extension of a separate TCD pile research testing programme at the same site which focussed on group action under static vertical and lateral loading.
This report and the work it describes were funded by the Health and Safety Executive (HSE). Its contents, including any opinions and/or conclusions expressed, are those of the authors alone and do not necessarily reflect HSE policy.
HSE BOOKS

© Crown copyright 2003
First published 2003
ISBN 0 7176 2705 5
All rights reserved. No part of this publication may bereproduced, stored in a retrieval system, or transmitted inany form or by any means (electronic, mechanical,photocopying, recording or otherwise) without the priorwritten permission of the copyright owner.
Applications for reproduction should be made in writing to: Licensing Division, Her Majesty's Stationery Office, St Clements House, 2-16 Colegate, Norwich NR3 1BQ or by e-mail to [email protected]
ii
EXECUTIVE SUMMARY
Research has been carried out into the cyclic loading response of piles driven in soft clay, considering both groups and single control piles. This involved field tests on industrial scale piles at Kinnegar, near Belfast, Northern Ireland, using facilities set up by Trinity College, Dublin and Imperial College London.
The project was commissioned by HSE following a suggestion by the Offshore Inspectorate that that group cyclic tension loading might lead to a greater degree of axial capacity degradation than other types of loading.
The work undertaken consisted of improving the site’s geotechnical characterisation;
installing a new five-pile group and a new single pile; and performing cyclic tension
tests to failure on these installations. Two existing five-pile groups and one existing
reference pile were also tested cyclically under one-way tension loading. The main
conclusions are:
• High level cyclic tension loading degraded shaft capacity by an amount that
depended on the combination of the cyclic and average loads, and the number
of cycles applied. This could be expressed by cyclic interaction diagrams.
• Degradation started an earlier stage with the groups and had more severe
effects than with single piles. Under extreme one-way loading single piles
degraded once the peak load exceeded 90% of static capacity. With the groups
degradation started in the most critical pile once loads exceeded 60% of the
overall static capacity. Repeated one-way cyclic loading keeping an average
factor of safety of 1.5 would lead to some loss of capacity in the Kinnegar pile
groups.
• Cyclic failure led to the capacity of single piles falling by up to 14%, while
groups could lose 18% of their overall capacity. The capacity of the most
critical pile could fall by up to 23%. However, capacity tended to recover with
time after experiencing a cyclic failure.
• Extreme two-way cycling would undoubtedly cause more severe effects than
one-way loading. The effects of cycling can also be expected to vary with soil
conditions and pile group layout.
iii

ACKNOWLEDGEMENTS
The authors would like to acknowledge the considerable contribution to the success of the project made by the Trinity College Dublin technicians: George Jones, David McAuley and Martin Carney. The assistance, on site, of Emilio Salvidar (Imperial College) and Paul Kieran (Trinity College) is also gratefully acknowledged. The authors also thank the Northern Irish Department of the Environment for permission to use the site at Kinnegar.
iv

CONTENTS
Page
1.0 INTRODUCTION 1 1.1 General 1 1.2 Background 1 1.3 Scope of work undertaken 1
2.0 SITE DESCRIPTION AND TESTING ARRANGEMENTS 2 2.1 Site location 2 2.2 Pile test notation 2 2.3 Pile test programme 3 2.4 Experimental procedures 4
3.0 GEOTECHNICAL SITE CONDITIONS AND SOIL PROPERTIES 9 3.1 Scope of site investigation 9 3.2 Site geology 9 3.3 Site stratigraphy 10 3.4 Soil composition 10 3.5 In-situ tests 13 3.6 Behaviour in 1-D compression 15 3.7 Permeability and coefficient of consolidation 16 3.8 Shear strength 16 3.9 Shear stiffness 20 3.10 Residual strength 21
4.0 CYCLIC TENSION TEST RESULTS 22 4.1 Cyclic single pile test results 22 4.2 Cyclic pile group test results 25 4.3 Development of accumulated displacement 31
5.0 INTERPRETED TEST RESULTS 33 5.1 General characteristics of pile shaft capacities 33 5.2 Degradation of shaft capacity caused by cycling 33 5.3 Cyclic interaction diagrams 36
6.0 CONCLUSIONS 40
7.0 REFERENCES 42
v

vi

1.0 Introduction
1.1 General
This report describes an experimental investigation into the performance under cyclic tension loading of field-scale pile groups, and single piles, driven in soft clay. The work was commissioned by the UK Health and Safety Executive (HSE) and was performed by Imperial College London (IC) and Trinity College Dublin (TCD). TCD conducted the fieldwork, with assistance from IC, at a test site in Kinnegar, near Belfast, Northern Ireland. The project was developed as an extension of a separate TCD pile research testing programme at the same site which focussed on group action under static vertical and lateral loading. The latter was funded by the UK Institution of Civil Engineers under a grant co-held with Imperial College, with additional support from local Contractors, Consultants and TCD. The static pile group research has been described by Lehane et al (1999), McCabe (2002) and Phillips (2002).
1.2 Background
The work commissioned by HSE at Kinnegar resulted from concerns expressed by the HSE Offshore Inspectorate that cyclic group tension loading might lead to a greater degree of cyclic degradation in clays than other types of loading. Review work carried out by Imperial College Consultants (ICON) for HSE could find no reference to any such tests having been performed in the field. ICON therefore proposed a suite of low cost field tests that could check whether tension groups were particularly susceptible to cyclic loading. The investment made by TCD and their partners at Kinnegar in ground investigations, site facilities and static tests made the site a natural choice for a cost effective cyclic testing programme.
1.3 Scope of work undertaken
HSE’s funding for the initial and final (extended) project allowed two single reference piles (designated S1 and S2) and 3 five-pile groups (designated G1,G2 and G3) to be tested in cyclic tension. G3 and S2 were installed specifically for the HSE sponsored cyclic testing programme and had not been previously load tested, while G1, G2 and S1 had been installed as part of TCD’s static research programme. These three installations had been tested to ultimate conditions statically prior to the HSE funded cyclic experiments. Part of the HSE’s funding was allocated to improving the site’s geotechnical characterisation and reporting on the results obtained.
1

2.0 Site description and testing arrangements
2.1 Site location
The ‘Kinnegar’ site is located on the south side of Belfast Lough, 10km north east of Belfast city and 2km south east of Holywood village; see Figure 2.1. The site is immediately south of Kinnegar sludge de-watering plant and is within 100m of the Tillysburn gate entrance to Belfast Harbour Industrial Estate. Permission to use the site as a geotechnical test bed was granted to TCD by the Dept. of the Environment (Northern Ireland) in 1996.
Figure 2.1 Test Site location (OSNI, 1:50000, Sheet 15 (20000), 150%
The site measures about 250m by 100m, is relatively level and lies just north of a ‘pond’, which is connected hydraulically to Belfast Harbour. The pond and its surrounds provide habitat to a variety of wildlife. Only the southern half of the site (close to the pond) was used for pile testing and site characterisation studies.
2.2 Pile test notation
The notation used for this report has been devised so that the test code summarises the history of each test including the key installation and test characteristics. The first letter (S or G) denotes Single pile or pile Group, the following numeral signifies the order in which the pile or group was installed (1 = oldest). The next letter indicates
2

the type of the first test performed on the installation (C static compression, T static Tension, or CY Cyclic tension). If the test concerned followed a prior test then, following a forward slash, its secondary (or tertiary) history is denoted in the same way. Taking three examples:
S1:C/CY Cyclic test (CY) of single reference pile number 1 (S1), which was previously loaded statically in compression (C)
G2:C/CY/T Static tension test (T) of pile group number 2, which was first loaded statically in compression (C) and then loaded cyclically (CY)
G3:CY First time Cyclic test (CY) on pile group number 3
2.3 Pile testing programme
The full programme of relevant tests performed at Kinnegar is summarised in Table 2.1. The letters A to H refer to the area designations defined by McCabe (2002); each zone is typically a 12 x 12m area.
Table 2.1 Sequence of relevant piling events for cyclic testing Date
4/9/1997 17/9/1998 29/4/1999 17/5/1999 5/8/1999 7/8/1999 5/10/1999
14/12/1999 10/5/2000 11/5/2000 1/6/2000 18/12/2000
8/5/2001
June 2001
Event
Installation of tension 5-pile group (G1) (A)Tension pile group static load test (A)Installation of ‘instrumented’ compression group (G2) (C)Installation (at (D)) of single pile for use in compression test Compression pile group static load test (C)Compression single pile static load test (D)Cyclic tension pile group test followed by static test (A) G1:T/CY and G1:T/CY/T Tension single pile static load test (E)Cyclic tension single pile test, S1:C/CY (D)
Tension single pile static load test, S1:C/CY/T (D)Cyclic tension pile group test, G2:C/CY (C)Installation of new 5-pile group (G) and single pile (H) for tension cyclic loading (G3 and S2) Cyclic and static single pile tension test (H) S2:CY and S2:CY/T Cyclic and static pile group tension test (G) G3:CY and G3:CY/T
3

2.4 Experimental procedures
The main features of the experimental programme were as follows:
• All piles employed were 250mm square, precast concrete sections, which were driven by Lowry Piling Ltd. to a depth of 6m into the soft silt at the test site.
• Each of the three pile groups installed comprised four ‘edge’ or ‘corner’ piles driven in a 1m square grid and one pile located at the centre of the grid. Two single piles were driven remote from the pile groups.
• Each pile had a purpose-built load cell located at its pile head.
• A pre-fabricated steel pile cap connected the group piles so they could redistribute the applied overall load through group action. The cap was located above the pile head load cells, as shown on Figure 2.3.
• Static tests were conducted under a maintained loading style which was governed by residual creep rate criteria. The procedures followed were similar to those adopted in other work performed by Imperial College for HSE (see Jardine and Standing 1999).
• Cyclic tests were performed under manual load control. The cyclic period was typically 60 seconds, which is around 3 to 10 times longer than the period of typical offshore waves. It was possible to apply several hundred cycles if required. Longer duration tests were not feasible for operational reasons.
• In all but one case static tension tests were performed after the cyclic tests, these typically taking place within 8 hours of the cyclic experiment.
• The tests were conducted at various times after installation. Set up time and prior loading were both found to affect static and cyclic capacity. The latter led to an unanticipated large static capacity when group G1 was first tested cyclically, with the result that it could not be brought to cyclic failure under the pre-planned loading regime.
4
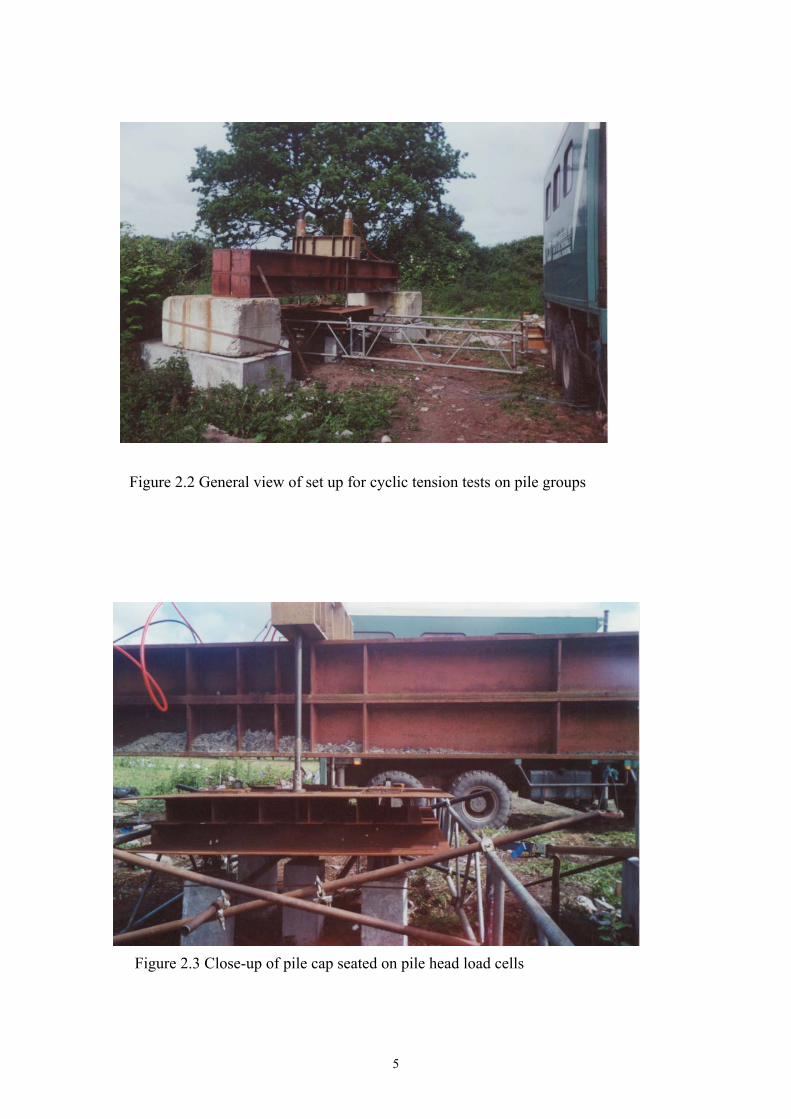
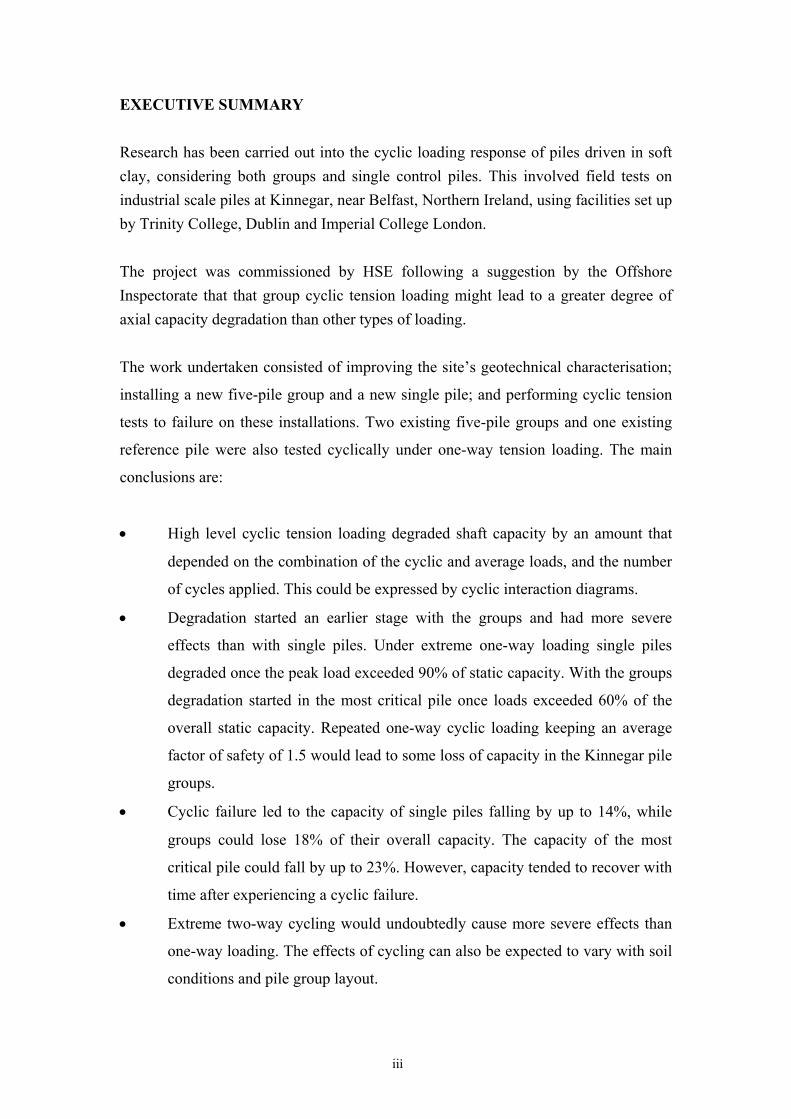
Figure 2.2 General view of set up for cyclic tension tests on pile groups
Figure 2.3 Close-up of pile cap seated on pile head load cells
5

Figure 2.4 View from underneath pile cap
2.4.1 Arrangement for cyclic tension testing of pile groups
Photographs of the set-up employed for cyclic testing of the pile groups are presented
in Figures 2.2, 2.3 and 2.4. Vertical reaction was provided for the applied tension
group loads by slip coated driven precast concrete piles bearing on the medium dense
sand layer at 9m depth (i.e. 3m below the base level of the test piles). The two twin
sets of reaction piles were located on either side of the test groups and at a minimum
distance of 2.4m (around ten pile widths) from the group centres. Concrete pile caps,
typically 0.6m in thickness, linked the two piles in each set; these were cast in-situ on
a 50mm thick layer of expanded polystyrene.
The free-standing pile length left after driving was typically about 1m. The piles were
cut using a con-saw to within 300-500mm of the ground surface, leaving all pile
heads at the same level. A 32mm diameter, 1.1m deep hole was subsequently drilled
into centre of the head of each pile. One metre long, high strength Dywidag bars
(25mm diameter) were then grouted into the holes (with the epoxy resin Fosroc
Lokset S25) to provide an anchorage point for the pile head load cells. All pile heads
were topped with a self-levelling cement-based screed to provide a smooth contact
with the load cells. The load cells were located over the 0.1m length of protruding
6

Dywidag bar and were fixed in place by Dywidag nuts. The steel pile cap was then
lowered centrally by crane onto the five load cells. Plates bolted to the top of each
load cell were welded to the pile cap.
As illustrated in Figure 2.2, a 6m long, 880mm square, steel reaction beam spanned
between the concrete caps of the reaction piles. The level of the beam was raised
using concrete blocks seated on these caps to provide adequate clearance for the pile
cap. A 1.2m long beam was located on top of the centre of the reaction beam and at
right angles to it; two 500kN jacks were seated near the ends of the short beam. High
strength Macalloy steel bars (diameter 40mm) were passed through a void in the short
beam and through each hollow jack and secured at the top of the jack with a Macalloy
nut. A load cell was fitted to the head of one jack, with a hydraulic T-piece hose
ensuring that both jacks were pressurised equally The lower end of the Macalloy bar
passed through holes burned at the appropriate locations in the pile cap and secured to
the pile cap’s top and bottom plates with Macalloy nuts; see Figure 2.4.
2.4.2 Arrangements for loading single piles
The TCD cone truck was employed for cyclic testing of single piles. Dywidag bars
were cast in drilled holes to protrude 100mm from the pile head, as with group piles.
These bars were coupled to a further length of Dywidag bar that passed into the truck
through the hole normally used for lowering the cone rods. The jack and load cell
were both located within the truck.
2.4.3 Load testing procedures
Two parallel scaffold frameworks, as illustrated in Figure 2.2, were employed as
reference beams in the group tests. These frameworks were supported by vertically
driven rods at their ends and were stiffened in the lateral direction by further poles
and ratchet straps linking each framework (see Figure 2.3). Poles passing close to the
pile provided an attachment point for the magnetic clamps and retort stands to locate
two displacement transducers on each pile (see Figure 2.4). One 3.5m long scaffold
beam passing beneath the cone truck was used as the reference beam for the single
pile tests
7

A ‘Power Team’ petrol driven pump with manual valve control was used to regulate
load levels. Excellent control was achieved with near sinusoidal load cycles1 being
applied (with period T = 60secs) by controlling the valve through manual feedback
from a digital load cell display and a stop-watch. The technician responsible for load
control undertook training sessions prior to the field tests; these trials contributed to
the success of the load cycling.
Cyclic failure was deemed to have occurred once the accumulated mean pile head
displacement reached 25mm. Cycling was then halted. Static tension tests were
performed as soon as possible after cycling. The maintained style was adopted and the
static tests were all conducted within 8 hours of completing the cycling.
The static tests were intended to follow the same relative incremental loading patterns
in both the single pile and group tests. The load increments ranged between 5% and
15% of the total capacity estimated for each installation. Load increments were
maintained until the pile creep rate had reduced to less than 0.24mm/hour.
The TCD cone truck was used to house the computer and data acquisition hardware
for the pile head load cells and the displacement transducers.
1 Although the time from peak to trough was the same as from trough to peak, the cycles were slightly non-symmetric. The rate of load reduction post peak was often marginally faster than would be ideal for a sine wave and the loading rate applying immediately after the trough was often slightly slower.
8
3.0 Geotechnical site conditions and soil properties
3.1 Scope of site investigation
The Kinnegar pile tests mainly involved the soft Holocene clayey silt known locally as the Sleech. Earlier investigations of the Sleech at a site close to the Kinnegar test site have been reported by Crooks & Graham (1976) and Bell (1977). The site specific investigations conducted or commissioned at the test site by Trinity College Dublin (TCD) include:
• ‘Geonor’ 54mm diameter sampling.
• 100mm diameter piston sampling (carried out by the Northern Ireland Department of the Environment)
• Trial pits
• Piezocone, standard electric cone penetration tests and field vane tests (conducted with the TCD truck)
• Seismic cone, cone pressuremeter and dilatometer tests conducted by Building Research Establishment (BRE)
• Classification testing at TCD, including X-ray diffraction and electron microscope analyses.
• Chemical analyses performed by Lutenegger and Cerato (2000)
• Laboratory soil parameter determinations in oedometer, shear box, ring shear, simple shear and triaxial tests conducted at the TCD laboratories.
This report provides a relatively detailed summary of the main findings from these investigations. Further information is provided in McCabe (2002) and Phillips (2002).
3.2 Site geology
The geological succession of the drift deposits at the test site comprises around 8.5m of estuarine Sleech clays, silts and sands overlying harder glacial tills. The glacial retreat that took place around 10,000 years ago was followed by considerable isostatic uplift and a general rise in sea level (Crooks & Graham 1976). The estuarine materials were transported and deposited by the Lagan, Connswater and Blackstaff rivers, all of which flow into Belfast Lough; see Figure 2.1. Manning et al. (1972) considered that
9

___________________________________________________________________
_____________________________________________________________________
_____________________________________________________________________
the Sleech was laid down over the past 3000 years in shallow waters, which varied up to a maximum depth of 9m. This depositional environment is thought to be somewhat more energetic than that of the Bothkennar clay-silt (which has been the subject of extensive research, Geotechnique 1992).
Post-depositional processes are thought to include bonding, some leaching and groundwater fluctuations. Approximately 1m of sandy fill material was placed in the vicinity of the pile tests during construction of the nearby sewage treatment plant about 20 years ago.
3.3 Site stratigraphy
The boreholes, trial pits and Cone Penetration Tests carried out in the general area of the pile tests revealed the stratigraphy summarised in Table 3.1.
Table 3.1 Stratigraphy in general area of pile tests
Stratum Approx. Description Depth (m)
1 0-1.0 Matrix of building rubble with loose to dense silty sand and very silty gravel overlain by 0.1m of topsoil
2 1.0 to Loose dark grey organic very silty SAND with some 1.3-2.5 clayey silt lenses and shell fragments
3 1.3-2.5 Soft dark grey organic clayey SILT with shell to 8.5 fragments
4 8.5-11 Medium dense brown silty fine to medium SAND
3.4 Soil composition
The particle size distributions, Atterberg limits and water content determinations are summarised on Figures 3.1 and 3.2. Most of these determinations were performed on samples from Strata 2 and 3, which are estuarine Sleech deposits.
10

Dep
th (m
) Pe
rcen
tage
pas
sing
100
90
80
70
60
50
40
30
20
10
0 0.001 0.01 0.1
Particle size (mm)
s
7.55m
4.8m
6.65m
3.3m
5.7m
1
Figure 3.1 Particle size distribution
% clay,silt,sand wP - w - wL (%)
0 20 40 60 80 100 0 20 40 60 80 100 0
silt sand
clay
0 Fill
1 1
2 2
3 3
4 4
5 5
6 6
7 7
8 8
9 9
10 10
Figure 3.2 Summary of index properties
11
Sand-Sleec
hc
Silt-Slee hSand

Stratum 1 This stratum is highly variable and reduces in thickness towards the lake/pond at the south of the site. While it can be generally classified as sandy gravel or gravelly sand, topsoil was observed to extend to a depth of about 1m at a number of locations while poorly compacted brick and concrete rubble extended to 1.5m at other locations. A discontinuous 100mm thick vein of fibrous peat existed at the base of this layer in one trial pit.
Stratum 2 Although being of the same colour and containing similar quantities of organic matter and shells to Stratum 3, this stratum is generally non-plastic and contains a much higher percentage of coarse silt and fine sand. Observations made in trial pits and in the CPT’s indicate that the stratum is primarily a silty sand but contains layers and lenses of sandy silt and occasional clayey silt.
Stratum 3 Stratum 3 may be generally described as a clayey organic silt, although clay fractions vary significantly from about 8% to 38%; such variability was not indicated by any of the in-situ tests (see Section 3.5). X-ray diffraction analyses indicated that the clay fraction is composed predominantly of illite and chlorite; quartz and calcite exist in smaller quantities and some traces of smectite were detected. Organic contents determined by the loss on ignition method at 450oC showed variability of less than 1% about the mean value of 11.5%. Chemical analyses reported by Luttenegger and Cerato (2000) on material smaller than 40µm (i.e. between ≈75 and 95% of the material) indicated a composition comprising about 50% quartz, between 15 and 20% dolomite and between 4 and 8% calcite. Electron microscope images, such as those shown on Figure 3.3, confirmed the presence of clay minerals and revealed a significant quantity of (siliceous) diatoms.
Water contents are typically 60 ±10% and are generally consistent with an average liquidity index of ≈0.8 throughout the stratum. The mean liquid limit of 65 ±10% and plasticity index of 35 ±5% plot in the high plasticity range of the Casagrande plasticity chart. However, a number of Atterberg limit determinations performed on samples with the organic fraction removed (by loss on ignition at 450oC) indicated that the liquid limit fell by about 20% and the plastic limit remained unchanged. The material with the organic fraction removed falls in the intermediate plasticity range. Sample inspections revealed that at least part of the organic fraction is composed of coarse fibrous plant material. As with the Bothkennar clay-silt, the organic fraction
12

may also reflect the residues of marine organisms that have become attached to the clay mineral plates.
Stratum 4 No laboratory tests have been performed on this stratum and reliance is placed on visual inspections, which describe it as a ‘uniform fine to medium sand’.
Figure 3.3 Typical electron microscope images of Stratum 3
3.5 In-situ tests
The profiles of CPT end resistance (qc), peak strengths from in-situ vanes (cu-vane), shear wave velocities from seismic cone tests (vs) and limit pressures in cone pressuremeter (CPM) tests (pL) are summarised on Figure 3.4.
The qc values provide a clear indication of the significant lateral variability within the fill (Stratum 1) and the sandy upper portion of the ‘Sleech’ (Stratum 2). For example, the lower bound qc profile suggests a virtual total absence of Stratum 2 while the upperbound qc profile indicates relatively competent soils to a depth of 2.5m. The stronger consistency of Stratum 2, compared to Stratum 3, is confirmed by the higher vane strength and (slightly higher) shear wave velocities measured at 1.9m and the higher CPM pL value at 2.3m.
The qc profiles in Stratum 3 are remarkably uniform, despite the variations in composition indicated by Figure 3.1. Total cone resistances, qt (i.e. qc corrected for pore pressures acting on the cone’s filter stone) increases linearly with depth from ≈200 kPa at 2.5m to 400kPa at 8m. Vane strengths increase over the corresponding depth interval from ≈20 kPa to 25 kPa and shear wave velocities increase from ≈72m/s to 80m/s.
13

0 qc (MPa) cu (vane), kPa
1 2 3 4 5 0 10 20 30 40 50 0
2
4
6
8
10
)
/
0
2
4
6
8
10
Dep
th (m
Average
Upper lower bound
vs (m/s) SCPT CPM limit pressure (kPa)
0 50 100 150 200 0 100 200 300
00
22
44
6 6
8 8
10 10
Figure 3.4 In-situ test results
14

3.6 Behaviour in 1-D compression
Compressibility The response of the sleech in standard 24 hour 1-D compression tests is shown for typical tests on Figure 3.5, which also plots the measured intrinsic compression line (ICL) of the same material after reconstitution at 1.3 times the liquid limit. The initial classical response of a natural (structured) soil is in evidence (i.e. a compression curve well above the ICL), which is followed by general convergence with the ICL at a stress of about 1 MPa. Measured compression indices for the reconstituted soil (Cc*) were in close agreement with those deduced from the Burland (1990) correlation between Cc* and the void ratio at the liquid limit. Use of this correlation for all oedometer tests indicated a relatively constant Cc/Cc* ratio of 1.3 ±0.1 (where Cc , which had a average value of 0.6, is the measured normal consolidation compression index of the intact soil up to σ’v= 1MPa). The ratio of the creep coefficient, Cα, to Cc
was relatively constant at 0.04 ±0.01 in all oedometer tests in the normally consolidated range.
Voi
d ra
tio
2.0
1.8
1.6
1.4
1.2
1.0
0.8
0.6
0.4
Depth=4m Depth=6.1m Reconstituted at 1.3wL
1 10 100 1000 10000 σ'v (kPa)
Figure 3.5 Typical 1-D compression curves for Stratum 3
Overconsolidation Vertical yield stress ratios (YSR= σ’vy/σ’v0) inferred from oedometer tests on Stratum 3 varied from ≈1.6 at a depth of 3m to about unity at a depth of 8m (McCabe 2002).
15

This variation in YSR results from σ’vy being effectively constant with depth at 55 ±5 kPa2.
Although the soil in Stratum 2 is generally a silty sand, one sample of clayey silt was recovered from a depth of 1.4m. A standard oedometer test on this sample indicated a vertical yield stress of 60 kPa (≡ YSR of 2.7) and a Cc value of 0.28 which is less than half of the average for Stratum 3.
3.7 Permeability and coefficient of consolidation
Vertical permeabilities calculated from oedometer tests on Stratum 3 reduced with increasing stress level but were typically in the range 1.5 x10⁻¹⁰ to 5x10⁻¹⁰ m/s at insitu stress levels.
Vertical coefficients of consolidation (cv) determined in the same set of oedometer tests reduced from about 3m2/year in the overconsolidated region to ≈0.5m2/year at a vertical effective stress of 100 kPa. Piezocone dissipation tests performed in Stratum 3 indicated that horizontal (reloading) coefficient of consolidation, ch (determined using the procedure of Houlsby and Teh 1988) varied from ≈7m2/year to ≈12m2/year.
Despite the high silt content of Stratum 3, its clay fraction is sufficiently influential to lead to permeabilities and coefficients of consolidation which are more typical of a clay than a silt.
3.8 Shear strength
3.8.1 Undrained strength in triaxial compression A typical effective stress path3 followed by a Geonor 54mm diameter piston sample during a CK0U undrained triaxial compression test (at an axial strain rate of 5%/day) is shown on Figure 3.6a. The in-situ effective stress state of this sample (taken at 4.8m depth) was re-imposed by following a prescribed anisotropic consolidation and swelling path which ended with a one day ageing period. The undrained effective stress path displayed is typical of lightly overconsolidated materials in CKoU tests: the
2 Better quality samples (e.g. block, Laval or Sherbrooke) are likely to have indicated slightly higher σ’vy values at all depths within the stratum.
3 It should be noted that many of the stress paths shown by reconsolidated 100mm diameter piston samples recovered by DoE, Northern Ireland (and tested about 1 year after sampling) indicated a tendency to dilate at mobilised friction angles of ≈ 30o. Following inspection by TCD and Queen’s University Belfast, these samples were adjudged to have suffered gross sampling disturbance.
16

20
30
40
Dev
iato
r stre
ss, q
(kPa
) deviator stress reaches a peak value at a low axial strain level (0.5% in this case) and subsequently drops sharply as the mean effective reduces and the mobilised angle of shearing resistance increases.
500
400
Gsei ic 0sm /p' 300
Gse
c /p'0
200
10 100
0 0 0 10 20 30 40 0.001 0.01 0.1 1
mean effective stress, p' (kPa) Axial strain (%)
Figure 3.6 CK0U triaxial compression test stress path and shear stiffness
The undrained shear strength ratio applying in triaxial compression (cutc/σ’v) was 0.41 for the test plotted on Figure 3.6a. This value falls in the range of 0.4 to 0.45 measured in other similar tests performed at TCD, and in CKoU tests reported by Crooks & Graham (1976). Adopting the cutc value of 17 kPa recorded in the test shown on Figure 3.6a and the average yield stress (σ’vy = 55kPa) measured in oedometer tests yields a cutc/σ’vy ratio of 0.31. Better quality block or Sherbrooke samples are likely to give higher cutc and σ’vy values, and probably yield slightly higher cutc/σ’vy ratios .
Our best estimate for the in-situ cutc range in Stratum 3 is 17 to 22 kPa. As at the Bothkennar test site, this undrained triaxial compression shear strength range forms an approximate lower bound to the undrained strength measured in field vane tests; see Figure 3.4.
The rate dependence of the undrained strength (cu) of normally consolidated ‘Sleech’ was investigated in two undrained triaxial compression tests performed on 54mm diameter Geonor piston samples from between depths of 4m and 5m. These samples
17
10

were isotropically consolidated to a mean effective stress (p’i) of 100 kPa and each was then subjected to triaxial compression at an initial lower axial strain rate and then again at a final faster axial strain rate. The results from these tests are summarised on Figure 3.7, where it is evident that the cu/p’i ratios increase by a factor of around 15% for each log cycle increase in strain rate4. The stiffness of the samples is also evidently affected in a similar way to their strength.
0
20
40
60
80
i)
1%/min
/min
/min
/min
0
cu/ p
'i (p
'i
100
Dev
ator
stre
ss (k
Pa
Test 1 Test 2
0.01%
0.001%
0.1%
0.05
0.1
0.15
0.2
0.25
0.3
0.35
0.4
0.45
=10
0 kP
a)
Extrapolated strength
Measured strength
15% per l leog cyc
CU tests, pi les (4.5m) ston sampIs otropic cons ol. to p' i =100 kPa
0 2 4 6 8 10 0.001 0.01 0.1 1
Axial strain (%) Axial strain rate (%/min)
Figure 3.7 Investigation of rate effects in traxial compression tests on Sleech
Crooks & Graham (1976) measured a lower strain rate dependence than that indicated on Figure 3.7 for overconsolidated sleech (which, in some instances, was as low as ≈7% per log cycle change in strain rate). It is therefore proposed that, based on the available evidence, a strain rate dependence of strength and stiffness of 12% per log cycle variation in strain rate may be adopted as an average for assessment of rate effects in the pile tests. The potential errors associated with the use of such an average value should, however, be borne in mind.
4The ‘extrapolated’ cu/p’i ratios plotted on Figure 3.6b refer to ratios estimated from the initial slower rate adopted in each test.
18

3.8.2 Effective stress shear strength parameters The effective stress shear strength parameters of Stratum 3 were determined in a range of consolidated undrained triaxial compression tests on 38mm, 54mm and 100mm diameter piston samples. All samples were recovered from depths between 3m and 7m and were tested in undrained compression after consolidation to the estimated in-situ mean effective stress, p’0 (i.e. between about 40 and 70 kPa). Isotropic overconsolidation ratios of up to 5 were induced in some samples while samples subjected to anisotropic consolidation and swelling followed stress paths similar to those illustrated on Figure 3.6a.
The values of the t and s’ effective stress co-ordinates applying at ultimate conditions (i.e. ≈10-20% axial strain) plotted on Figure 3.8 indicate an ultimate angle of shearing resistance (φ’cv) that is not affected significantly by stress history, sample depth or sample quality. As indicated on Figure 3.8, the ultimate shear strength in triaxial compression is well represented by c’=0 and φ’cv = 33.5o. This relatively high angle is comparable to that of the Bothkennar clay-silt, which has a slightly higher clay fraction but a lower percentage of clay minerals. It is also noteworthy that the variability in the particle size distributions within this stratum did not lead to a wide range in the φ’cv angles.
t= (
σ 1-
σ 3)
/2, k
Pa
45
40
35
30
25
20
15
10
5
0
CIUC (38mm), OCR's [1.0 to 5.0]
CIUC (100mm), OCR =1.5
CKoUC (100mm), OCR=1.0-1.5
CKoUC (54mm), OCR=1.2 c'=0, φ '=33.5o
0 10 20 30 40 50 60 70
s' = (σ'1+σ'3)/2, kPa
Figure 3.8 Strength envelope of Stratum 3 measured in triaxial compression
19

Shear box tests were performed on recompacted samples of the Stratum 2 at normal effective stresses between 50 kPa and 200 kPa. These revealed best fit ultimate effective stress strength parameters of c’=0 and φ’cv=35o for the stratum. Shear box tests performed on samples of Stratum 3 at the same stress levels indicated φ’cv values of between 25o and 30o - 3.5o to 8.5o lower than the φ’cv value measured in triaxial compression. This feature may reflect anisotropy within the clay, or the effects of non-uniformity within the shear box.
3.9 Shear Stiffness
The undrained secant shear stiffness values Gsec measured in the CKoU test illustrated in Figure 3.6a are plotted against local axial strain5 on Figure 3.6b, normalised in this case by the initial mean effective stress applying at the beginning of undrained shear (p’0). The observed variation of Gsec/p’0 compares well with data from similar tests on Bothkennar clay-silt (Hight et al. 1992) although the Sleech’s Gsec/p’0 values are typically ≈15% lower.
3.10 Residual strength
Samples of the Sleech were subjected to large displacement soil-soil shear tests in the TCD Bromhead ring shear apparatus.
φ 'r esp, φ 'res (degrees) 0 10 20 30 40
Dep
th (m
)
0
1
2
3
4
5
6
7
8
Pe
Ult
ak residu
imate res
al
idual
Figure 3.9 Residual soil-soil frictions angles for Sleech
5 Measured using two Hall effect gauges
20

Following Ramsey et al’s. (1998) recommendations for ring shear tests intended for input into displacement pile design, the samples were first consolidated to representative in-situ values of normal effective stress and then subjected to a relatively large displacement (≈500mm) at a (fast) rate of 200mm/minute. The samples were then re-consolidated at a representative normal effective stress and (after a rest period of one day) re-sheared at a slow drained rate of displacement. The soil-soil peak and ultimate residual friction angles (φ’pres, φ’res) measured in the drained shear tests (conducted at normal effective stress of 100 kPa) are plotted against depth on Figure 3.9. It is evident that down to around 3m, φ’res ≈ φ’cv – as measured in triaxial compression tests, implying that the shearing mode is ‘turbulent’. However, below this depth, φ’res varies between 19.5o and 25.5o, indicating a ‘transitional’ mode where both turbulent and sliding shear takes place within the shear zone. This mode, and the observed φ’res range, is consistent with the clay-silt composition described in Section 3.4.
21

4.0 Cyclic tension test results
4.1 Cyclic Single Pile Test Results
The cyclic single pile tests were conducted to (i) provide a reference for the cyclic group tests and (ii) to establish the effects of time and pre-cycling on subsequent cyclic behaviour. Details are provided for each single pile test in Table 4.1, including the time elapsed between installation and cycling, and the number of cycles imposed.
The tension load cycles and the corresponding mean pile head displacements are shown in Figures 4.1 and 4.2 for both S1:C/CY and S2:CY and the corresponding variations of the pile head displacement amplitudes (one half of the difference between minimum and maximum displacements in any one cycle) are shown in Figure 4.3. The pile head load-displacements plots for the static tension tests (at a creep rate of 0.004mm/min), which were performed approximately 10 hours after cycling of each pile, are provided in Figure 4.4.
Table 4.1 Cyclic single pile tests
Pile S1 Pile S2 Any previous test (time since driving) Compression (88 days) None
The cyclic test (time since driving) S1:C/CY (358 days) S2:CY(142 days)
The cyclic period 60 secs 60 secs
Total number of cycles 560 187
Number of cycles at specified peak 276 (64 kN) 19 (56 kN)
applied load level 246 (72 kN) 30 (62 kN)
38 (81 kN) 27 (67 kN)
111 (72 kN)
Maximum tension load applied in static 68 kN (S1:C/CY/T) 64 kN (S2:CY/T)
test (Test No.)
Ultimate static shaft tension6 (Test No.) 64.7 kN (S1:C/CY/T) 54.4 kN (S2:CY/T)
6 Failure is defined as the point where the pile head displacement reaches 25mm (≡B/10) with a drained creep rate of 0.004mm/min. Corrections are made for pile weight and the pore pressure acting at the pile base.
22

0
10
20
30
40
50
60
70
80
90
Max
. and
min
. pile
hea
d lo
ad (k
N)
/S1:C CY
S2:CY
0 100 200 300 400 500
Number of cycles
600
Figure 4.1 Maximum and minimum loads for single piles
0
5
10
15
20
25
30
35
40
Pile
hea
d di
spla
cem
ent (
mm
) S1:C/CY
S2:CY
0 100 200 300 400 500 600
Number of cycles
Figure 4.2 Accumulated displacements for single piles
23

0
1
2 A
mpl
itude
0.5
1.5
S2:CY S1:C/CY
0 100 200 300 400 500 600
Number of cycles
Figure 4.3 Displacement amplitudes (mm) observed during cyclic tests on single piles
0
10
20
30
40
50
60
70
)
/T /T
Pile
hea
d lo
ad (k
N
S1:C/CYS2:CY
0 5 10 15 20
Pile head displacement (mm)
Figure 4.4 Static load tests on single piles after cycling
24

4.2 Cyclic Pile Group Test Results
Details of the tension tests on the virgin pile group (G3) and the two reloaded pile
groups (G1 and G2) are provided in Table 4.2. The load cycles and displacements of
all the individual piles are reported by McCabe (2002); plots are given below for just
the average of the four corner piles, and for the single central piles.
Pile groups G1 and G3
The test data for pile groups G1 and G3 are presented as follows:
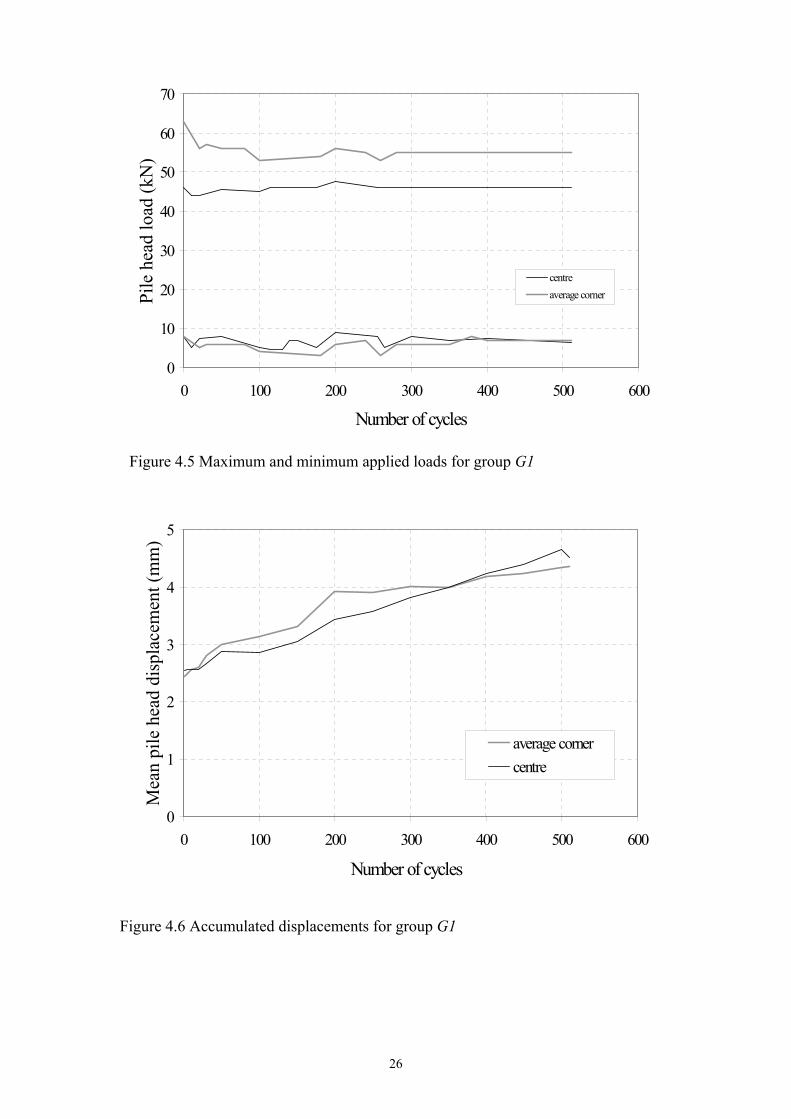
• Pile head load and mean pile head displacement against number of cycles for G1:T/CY (Figures 4.5 and 4.6)
• Pile head load and mean pile head displacement against number of cycles for G3:
CY (Figures 4.7 and 4.8)
• Displacement amplitudes for G1:T/CY and G3:CY (Figures 4.9 and 4.10)
• Pile head load displacement responses in static tension tests G1:T/CY/T and G3:CY/T i.e. conducted following cyclic tests G1:T/CY and G3:CY (Figures 4.11 and 4.12)
Table 4.2: Cyclic and subsequent static Pile Group Tests Group G1 Group G3 Group G2
Any previous test (time since driving) Tension (378) none Comp. (101) The cyclic test (time since driving) G1:T/CY
(761) G3:CY (170) G2:C/CY(398)
The cyclic period 60 secs 60 secs 60 secs Total number of cycles 512 440 247 Number of cycles at each peak 512 (260 kN) 18 (174kN) 247 (260kN) applied load level 33 (189kN)
28 (200kN) 157 (220kN) 118 (232kN) 62 (244kN) 24 (261kN)
Maximum applied tension load in 365 kN 241 kN None static test (Test No.) (G1:T/CY/T) (G3:CY) Ultimate static shaft tension7 (Test 357kN 241kN None No.) (G1:T/CY/T) (G3:CY/T)
at 25mm (≡B/10) mean pile head displacement and drained creep rate of 0.004mm/min with corrections made for weight of pile cap, pile weight and pore pressure acting at the pile base.
25
7
0
10
20
30
40
50
60
70
Pile
hea
d lo
ad (k
N)
centre average corner
0 100 200 300 400 500
Number of cycles
Figure 4.5 Maximum and minimum applied loads for group G1
0
1
2
3
4
5
Mea
n pi
le h
ead
disp
lace
men
t (m
m)
average corner centre
0 100 200 300 400 500 600
Number of cycles
Figure 4.6 Accumulated displacements for group G1
26
600

0
10
20
30
40
50
60
Pile
hea
d lo
ad (k
N)
centre average corner
0 50 100 150 200 250 300 350 400 450 500
Number of cycles
Figure 4.7 Maximum and minimum applied loads for group G3
0
5
10
15
20
25
30
35
40
45
Mea
n pi
le h
ead
disp
lace
men
t (m
m)
average corner
centre
0 50 100 150 200 250 300 350 400 450 500
Number of cycles
Figure 4.8 Accumulated displacements for group G3
27

0
1
2
Am
plitu
de
0.5
1.5
2.5
centre
average corner
0 100 200 300 400 500
Number of cycles
0
1
2
3
Am
plitu
de
0.5
1.5
2.5
3.5
centre
average corner
0 100 200 300 400 500 600
Number of cycles
600
Figure 4.10 Displacement amplitudes (mm) during G3:CY
Figure 4.9 Displacement amplitudes (mm) during G1:T/CY
28

0
20
40
60
80 Pi
le h
ead
load
(kN
)
centre
corner
0 5 10 15
Pile head displacement (mm)Figure 4.11 Pile head load displacement variations during G1:T/CY/T
0
10
20
30
40
50
60
Pile
hea
d lo
ad (k
N)
centre
corner
0 5 10 15 20
Pile head displacement (mm)
Figure 4.12 Pile head load displacement variations during G3:CY/T
29
20
25

0
10
20
30
40
50
60
70
80
90
0 100 150
Max
. and
Min
. Pile
hea
d lo
ad (k
N)
[1]
[2]
[3]
[4]
[3]
[1]
50 200 250 300
Number of cycles [2]/[4]
Figure 4.13 Maximum and minimum pile head loads and accumulated displacements during G2:C/CY
0
10
20
30
40
50
Max
. and
Min
. Pile
hea
d di
spla
cem
ent (
mm
)
[1]
[2]
[3]
[4] 5
2
4
3
1
0 50 100 150 200 250 300
Number of cycles
Figure 4.14 Maximum and minimum pile head loads and accumulated displacements in G2:C/CY30
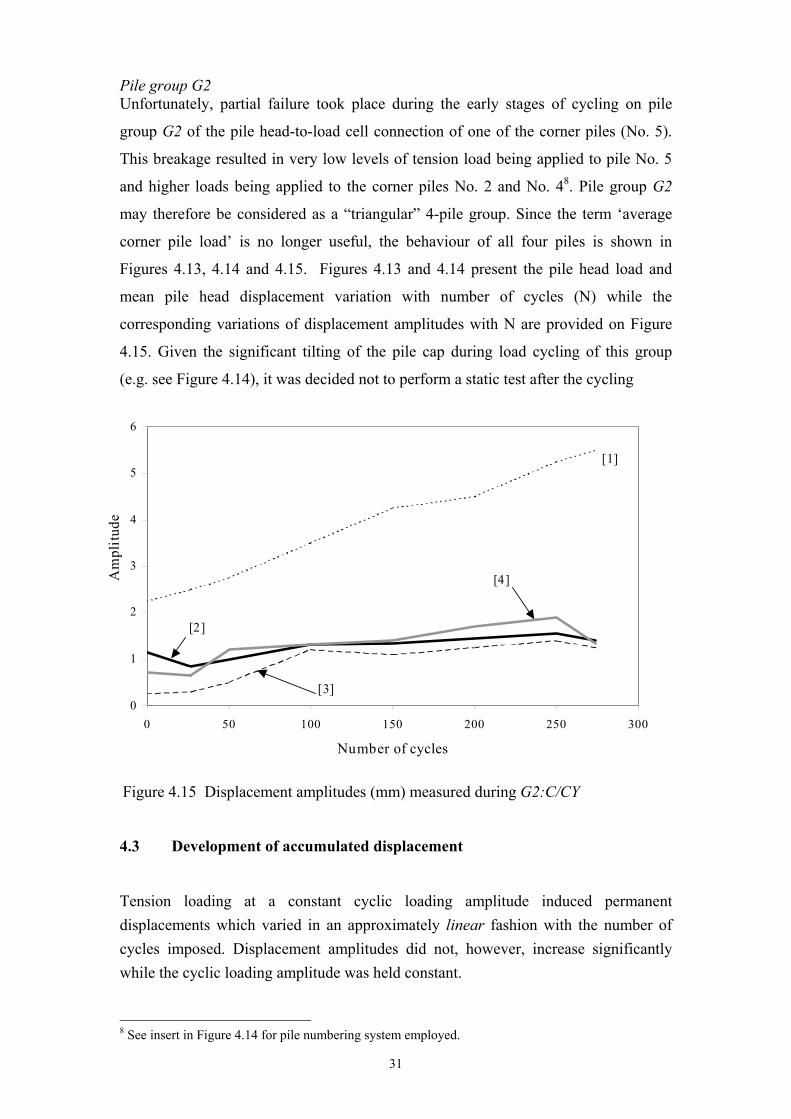
Pile group G2 Unfortunately, partial failure took place during the early stages of cycling on pile
Am
plitu
de
group G2 of the pile head-to-load cell connection of one of the corner piles (No. 5).
This breakage resulted in very low levels of tension load being applied to pile No. 5
and higher loads being applied to the corner piles No. 2 and No. 48. Pile group G2
may therefore be considered as a “triangular” 4-pile group. Since the term ‘average
corner pile load’ is no longer useful, the behaviour of all four piles is shown in
Figures 4.13, 4.14 and 4.15. Figures 4.13 and 4.14 present the pile head load and
mean pile head displacement variation with number of cycles (N) while the
corresponding variations of displacement amplitudes with N are provided on Figure
4.15. Given the significant tilting of the pile cap during load cycling of this group
(e.g. see Figure 4.14), it was decided not to perform a static test after the cycling
6
5
4
3
2
1
0 0 50 100 150 200 250 300
[1]
[3]
[4]
[2]
Number of cycles
Figure 4.15 Displacement amplitudes (mm) measured during G2:C/CY4.3 Development of accumulated displacement
Tension loading at a constant cyclic loading amplitude induced permanent displacements which varied in an approximately linear fashion with the number of cycles imposed. Displacement amplitudes did not, however, increase significantly while the cyclic loading amplitude was held constant.
8 See insert in Figure 4.14 for pile numbering system employed.
31

As may be seen on Figures 4.1, 4.5, 4.7 and 4.13, step increases in cyclic loading amplitude were applied during each test. These stepped increases were imposed as the piles initially withstood higher cyclic loading levels than had been anticipated, mainly due to the unexpected enhancement of pile static capacity caused by pre-testing and ageing. Raising the load amplitudes led to (moderate) increases in the displacement amplitude and significant increases to the rate of generation of permanent displacement with N (the number of cycles). This latter rate, referred to as ∆δ/∆N, remained roughly constant as cycling continued at the same amplitude; ∆δ/∆N grew systematically with the cyclic loading amplitude and mean cyclic displacement amplitude. However, as shown in Figure 4.16, ∆δ/∆N was not related uniquely to the cyclic displacement amplitude. Inspection of the data showed that (for the high level loading Kinnegar tests) ∆δ/∆N also depended strongly on the magnitude of the peak cyclic load applied in each set of cycles. The values of ∆δ/∆N are relatively small when the peak cyclic loads are less than about 70-80% of the dynamic tension capacity of the piles but ∆δ/∆N increases dramatically at higher peak cyclic loads.
∆δ/∆
Ν (m
m/c
ycle
)
1
0.1
0.01
0.001
S2:CY S1:C/CY
G3:/CY (centre)
G3:CY (corner)
G1:T/CY (corner) G1:T/CY (centre)
0 0.5 1 1.5 2 2.5
Amplitude (mm)
3
Figure 4.16 Rate of accumulation of displacement as a function of imposed pile head displacement amplitude; note logarithmic scale for ∆δ/∆N
32

5.0 Interpreted test results
5.1 General characteristics of pile shaft capacities
The main features of the static pile tests conducted at Kinnegar on 6m long, 250mm square, driven pre-cast concrete piles were summarised by McCabe (2002) as follows:
(i) The pore water pressures and radial stress changes generated by pile driving take around 3m months to equalise fully after installation.
(ii) Piles that are left undisturbed show little further change in their axial capacity over the two years that follow the initial equalisation processes.
(iii) The fully equalised tension shaft capacity is almost identical to the compression shaft capacity.
(iv) Slow maintained static tension testing to failure (in which failure was approached with creep rates of around 0.004mm/min) led to a reduction in the piles’ current shaft capacity of between 10 and 15%.
(v) The reduction was inferred from relatively rapid re-tests. Assessing the exact degree of reduction relied on assumptions regarding the rate dependency of pile capacity. In this case, it was assumed that shaft capacity increased by 12% for every log cycle increase in displacement rate.
(vi) An extended re-equalisation process was triggered by pre-testing that led to capacity recovering and growing with time. Reloading experiments conducted five or more months after the first test to failure give capacities that are around 28% higher than those available to undisturbed piles. This percentage increase is similar to that noted by Karlsrud & Haugen (1985) in re-tests on piles driven in a comparable low OCR marine clay deposit (Haga clay).
5.2 Degradation of shaft capacity caused by cycling
The observations summarised in Section 5.1 provide the rationale for developing estimates for the current static axial capacity available prior to any cyclic test: Qs bef. This measure is defined as the static tension load that would have been available (after applying a displacement of 25mm) to a pile had a low maintained load test been conducted just before a particular experiment. This capacity is the key parameter by which the cyclic tests can be normalised so that effects of cycling (as expressed by a cyclic failure, or by a measured reduction in static capacity) can be gauged. Because Qs bef values cannot be measured without affecting the subsequent cyclic tests
33

severely, reliance has to be placed on estimates projected from virgin static shaft capacity (Qs ref) measurements, with corrections being made for the effects of any prior testing to failure. Other terms employed in the following are:
• Qpcy: The peak axial tension load applied in each cyclic test (which was performed with a load period of 60 seconds).
• Qcy: The amplitude of the tension load cycles.
• Qav: The average tension load applied during cycling.
• Qd bef: The anticipated pile shaft capacity immediately before the cyclic test at the relatively fast displacement rate employed in the cyclic test. This (dynamic capacity) is inferred from Qs bef with a strain rate correction applied.
• Qs aft: The static shaft capacity measured after cycling; this is defined (in the usual way) as the load at a pile head displacement of 25mm and a creep rate of 0.004mm/min.
• Qd aft: The anticipated shaft capacity after the cyclic test at the displacement rate employed in the cyclic tests. This capacity is inferred from Qs aft with a strain rate correction applied.
When determining shaft resistances from the applied pile head loads, corrections were made for the weights of the piles and pile caps, and for the pore pressures at the pile bases. The pore pressures acting on the base were assumed to be hydrostatic at ultimate conditions (defined as corresponding to an upward displacement of 25mm). These corrections led to the ultimate applied tension loads being typically about 6 kN greater than the corresponding ultimate shaft capacities.
Table 5.1 summarises all relevant shaft capacity parameters and makes no distinction
between centre and corner piles in the groups. For the extreme one way cycling
imposed (with low minimum tension values) the ratio, Qpcy/Qs bef, is a good measure of
the severity of cycling imposed on the piles. This ratio was approximately unity for
both single piles (S1 and S2) and about 0.85 for piles groups G2 and G3. The level of
tension cycling of G1 was, however, relatively light (Qpcy/Qs bef =0.70) compared to all
other tests9. The reduction in static shaft capacity brought about by cycling (involving
between 180 and 550 cycles) is given by the Qs aft/Qs bef ratio. As expected, this ratio is
close to unity for group G1, for which cycling resulted in an average accumulated
displacement of only 2mm (see Fig. 4.4b). The Qs aft/Qs bef ratio for the single piles
9 As explained before, the cyclic loading level applied to G1 was set before the long-term positive effects of pre-failure had been discovered.
34

averaged 0.86, while that for G3 was 0.82 - at a lower level of load cycling. It would
therefore appear that tension load cycling to ultimate conditions (i.e. to a displacement
=25mm) causes more degradation of capacity to groups than to single piles. This is
examined further in Table 5.2, which lists the relevant shaft loads for the centre pile in
groups G1 and G3.
Table 5.1 Shaft capacity measurements and predictions for full groups10
Single pile/group S1:C/CY S2:CY G1:T/CY G3:/CY G2:C/CY
Cyclic test
(Virgin/ reloaded)
Reloaded Virgin Reloaded Virgin Reloaded
Qs ref (kN) 59.2 66.9 267 267 278 (Test used) (S1:C) (S3:T) (G1:T) (G1:T) (G2:C) Qs bef (kN) 75.2 66.9 339 267 353 Qd bef (kN) 101.1 87.8 459 363 480 Qpcy (kN) 75.1 66.1 237 232 237 Qs aft (kN) 64.7 57.5 336 220 none Qd aft (kN) 87.0 75.5 456 298 none Qpcy/Qs bef 1.0 0.99 0.70 0.87 0.845
Qpcy/Qd bef 0.74 0.75 0.52 0.64 0.6211
Qs aft/Qs bef (=Qd aft/Qd bef) 0.86 0.86 0.99 0.82 -
A comparison of Tables 5.1 and Table 5.2 indicates that centre piles in the groups
suffered more degradation in shaft capacity through cycling to failure than the groups
do as a whole. In the case of G3, the centre pile lost about 7% more of its capacity
than the average, and 10% more than a comparator single pile. Even in the case of
group G1, which was not failed by cycling, the centre pile lost 4% of its capacity
while the corner piles experienced no loss. The trends are summarised in Figure 5.1,
by plotting Qs aft/Qs bef (which defines the degradation of static capacity due to
cycling) against
Qpcy/Qs bef (a measure of the severity of cycling imposed). The trends plotted show
that cycling to failure at Qpcy/Qsbef = 0.82 degrades the static shaft capacity of the
centre pile by ≈23% while the group, as a whole, loses ≈15% and a single pile’s
capacity degrades by less than 5%. The transfer of loads through the silt to the centre
pile from neighbouring piles is believed to the primary mechanism for the additional
10 (assuming 12% per log cycle rate effect)
35

damage to this pile; the corner piles in the group are affected to a lesser extent while
single isolated piles do not experience any loads other than those applied at the pile
head.
Table 5.2 Shaft capacity measurements and predictions for centre pile in group
Centre pile G1:T/CY G3:CY
Cyclic test (Virgin/ reloaded) Reloaded Virgin Qs ref (kN) 51.5 51.5 Qs bef (kN) 65.4 51.5 Qd bef (kN) 84.2 65.4
Qpcy (kN) 38.1 42.1 Qs aft (kN) 63.1 39.5
Qpcy/Qd bef 0.58 0.82 Qpcy/Qd bef 0.45 0.64
Qs aft/Qs bef (=Qd aft/Qd bef) 0.96 0.77
The trend lines sketched on Figure 5.1 indicate that the onset of significant
degradation (taken here as 5%) of shaft capacity occurs at Qpcy/Q s bef ≈ 0.9 for a
single isolated pile and at about Qpcy/Q sbef = 0.75 for a typical group pile or
Qpcy/Qsbef = 0.60 for the centre pile. These findings may be compared with the short
term reduction of 10-15% in static capacity following static failure (McCabe 2002).
5.3 Cyclic Interaction diagrams
Cyclic Interaction diagrams offer a convenient way of expressing the interactions
between: (i) the amplitudes and average loads sustained and (ii) the numbers of cycles
N imposed in cyclic experiments. Ideally, a large number of tests should be performed
on previously untested piles, or pile groups, in which a wide range of Qcy/Qsbef and
Qav/Qsbef combinations are applied (involving both one and two-way cycling with both
compression and tension loads) until either a failure is obtained (without changing the
loading parameters), or the cyclic number N reaches a pre-set upper limit. Contours
may then be drawn for various fixed values of N that establish the conditions under
which cyclic failure can be induced. The limiting value of Qcy/Qsbef that can be
imposed, for at least a small number of cycles, is around 0.5 for one-way loading
(depending on rate effects), whereas the ratio can rise to around unity under two way
11 Taking into account that there were only four ‘active’ piles, ratio multiplied by 5/4
36
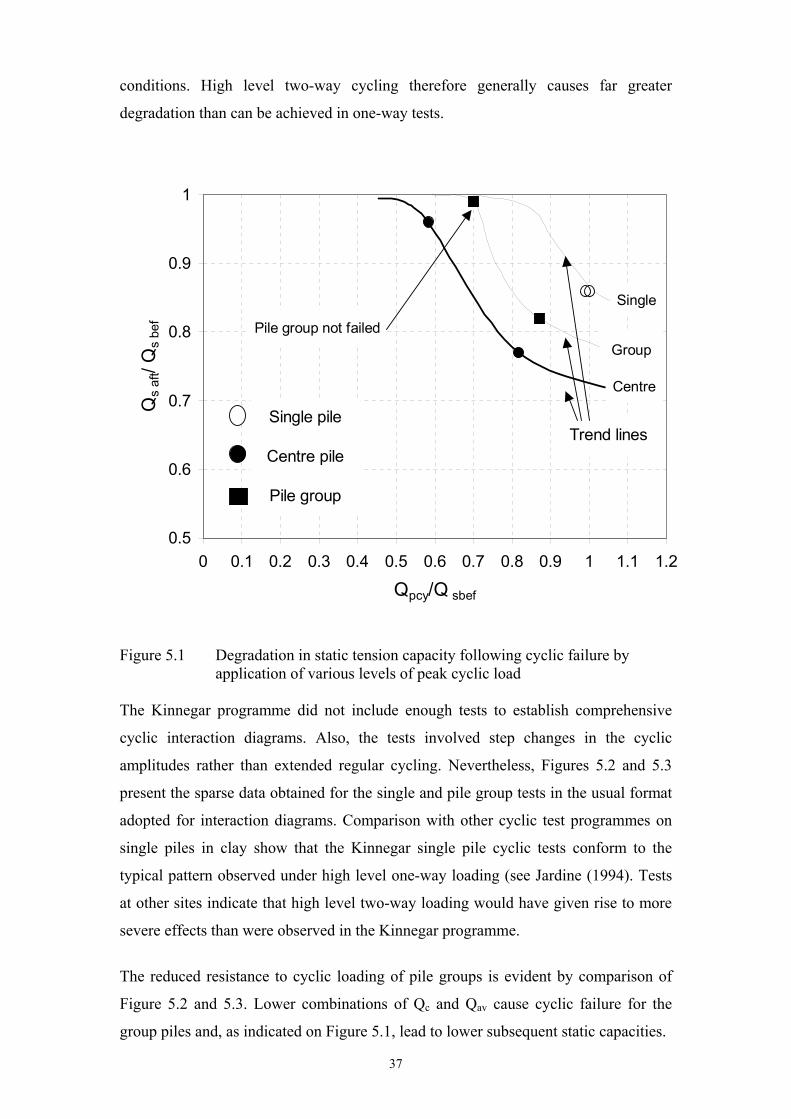
conditions. High level two-way cycling therefore generally causes far greater
degradation than can be achieved in one-way tests.
Qs
aft/
Qs
bef
1
0.9
0.8
0.7
0.6
0.5
Single
Pile group not failed Group
Centre
Single pile Trend lines
Centre pile
Pile group
0 0.1 0.2 0.3 0.4 0.5 0.6 0.7 0.8 0.9 1 1.1 1.2
Qpcy/Q sbef
Figure 5.1 Degradation in static tension capacity following cyclic failure by application of various levels of peak cyclic load
The Kinnegar programme did not include enough tests to establish comprehensive
cyclic interaction diagrams. Also, the tests involved step changes in the cyclic
amplitudes rather than extended regular cycling. Nevertheless, Figures 5.2 and 5.3
present the sparse data obtained for the single and pile group tests in the usual format
adopted for interaction diagrams. Comparison with other cyclic test programmes on
single piles in clay show that the Kinnegar single pile cyclic tests conform to the
typical pattern observed under high level one-way loading (see Jardine (1994). Tests
at other sites indicate that high level two-way loading would have given rise to more
severe effects than were observed in the Kinnegar programme.
The reduced resistance to cyclic loading of pile groups is evident by comparison of
Figure 5.2 and 5.3. Lower combinations of Qc and Qav cause cyclic failure for the
group piles and, as indicated on Figure 5.1, lead to lower subsequent static capacities.
37

1
Qc/Q
sbef
0.9
0.8
0.7
0.6
0.5
0.4
0.3
0.2
0.1
0
/Qmax = Q
Qc=QNf
Nf=178
S1:C CY
S2:CY
TWO-WAY
ONE-WAY
sbef
ave =550
0 0.1 0.2 0.3 0.4 0.5 0.6 0.7 0.8 0.9 1
Qav/Qsbef
Figure 5.2 Cyclic interaction diagram for single piles at Kinnegar; note Nf = number of cycles required for the accumulation of 25mm permanent displacement.
38

Qc/Q
sbef
1
G1:T/CY corner 0.9 G3:CY centre = Qsbef
G3:CY corner Qmax
0.8 G1:T/CY centre
G2 (average)0.7
0.6
N=512 Nf =270 0.5 (not failed) Nf =430
0.4 Qc=Qave
0.3 Nf =422TWO-WAY
0.2
0.1 ONE-WAY
0 0 0.1 0.2 0.3 0.4 0.5 0.6 0.7 0.8 0.9 1
Qav/Qsbef
Figure 5.3 Cyclic interaction diagram for group piles at Kinnegar; note Nf = number
of cycles required for the accumulation of 25mm permanent displacement.
39

6.0 Conclusions
This report has described the static and cyclic experiments performed on 6m long
250mm square precast concrete driven piles, and groups of such piles, driven into soft
clay silt at Kinnegar, Northern Ireland. The programme of tests combined with the
other TCD pile research programme at Kinnegar allowed:
a. The dependence of ultimate static tensile capacity on (a) loading rate, (b) pre
shearing to failure and (c) ageing following pre-shearing to be established.
b. Following from (1) above, an assessment to be made of the different effects of
high level one-way cyclic tension loading on single piles and small pile
groups.
It is emphasised that the Kinnegar tests involved only one-way tension loading. The
interpretation made of the full programme of tests leads to the following main
conclusions:
• Cyclic tension loading leads to shaft capacity degradation in single piles and
pile groups. The level of this degradation depends on the combination of the
cyclic and average loads, and the number of cycles applied.
• Under the extreme one-way cycling applied (with relatively low minimum
tension values) the severity of loading is principally related to the peak cyclic
tension load.
• Degradation became significant with single piles when the peak tension load
exceeded 0.9 of the piles’ slow static tension capacity. This threshold limit fell
to ≈0.75 for the pile groups (on average) or ≈0.60 for the most severely
affected central pile. Lower thresholds would undoubtedly apply under
extreme two-way loading.
• Piles that are brought to failure by high level cycling suffer immediate
reductions in static shaft capacity. Reductions of up to 14% were found for
single piles, up to 18% for groups (overall), and up to 23% for the worst
40

individual piles in the groups. The higher level of degradation noted for the
group piles merits further research.
• If pile groups such as those installed at Kinnegar were subjected to extreme
(one-way) repeated cyclic loading at a level corresponding to a (typical of
practice) average factor of safety of 1.5, the most severely affected (central)
pile would eventually fail, losing at least 10% of its capacity. Two-way
loading at the same level would cause much more severe degradation.
• The rates at which permanent pile displacements accumulate during cycling
also depend on the combination of the cyclic and average loads, and the
number of cycles applied. The displacements appear to increase almost
linearly with N and the gradients increase dramatically as the peak cyclic load
approaches the piles’ (dynamic) current capacity.
• The Kinnegar piles showed recovery in capacities with time after being pre
failed. Re-tests performed weeks or months after a static or cyclic failure
indicated enhanced capacities.
• The effects of cycling can be expected to vary with soil conditions and pile
group layout.
41

7.0 References
Bell, A. (1977) Laboratory Studies of the Belfast Estuarine Deposits. PhD Thesis,
Queen’s University of Belfast.
Burland, J.B. (1990) On the Compressibility and Shear Strength of Natural Clays.
Geotechnique, 40(3), 327-378.
Crooks, J.H.A. and Graham, J (1976) Geotechnical properties of the Belfast estuarine
deposits. Geotechnique 26(2), 293-315.
Hight, D.W., Bond, A.J. and Legge, J.D. (1992) Characterization of the Bothkennar
clay: an overview. Géotechnique 42(2), 303-347.
Houlsby, G.T. and Teh C.I. (1988) Analysis of the Piezocone in Clay. Proc. Conf. on
Penetration Testing, Balkema, Rotterdam, 777-783.
Jardine, R.J. (1994) Review of offshore pile design for cyclic loading: North Sea
clays. HSE Offhore Technology Report, OTN 94 157.85.
Karlsrud, K and Haugen, T (1985). Behaviour of Piles in Clay under Cyclic Axial
Loading – Results of Field Model Tests. Norwegian Geotechnical Institute,
Publication No. 166
Lehane B.M., McCabe B.A. and Phillips D.T. (2000) Instrumented Single and Group
Piles in Belfast Soft Clay. Australian Geomechanics, 35(4), 33-45
Lutenegger, A.J. (2001). Personal communication.
Manning, P.I., Robbie, J.A. and Wilson, H.E., (1970) Geology of Belfast and the
Lagan Valley. HMSO, Belfast.
McCabe, B.A. (2002). Experimental investigations of pile group behaviour in soft silt.
PhD Thesis, Univ. of Dublin (Trinity College Dublin).
Phillips, D.T., (2002). The behaviour of concrete piles under lateral loading. PhD
Thesis, Univ. of Dublin (Trinity College Dublin).
Ramsey N., Jardine R.J., Lehane B.M. and Ridley A. A review of soil-steel interface
testing with the ring shear apparatus. Proc. VI Conf. on Offshore site investigation and
foundation behaviour, Soc. for Underwater Technology, London, 1998, 237-258.
42

Printed and published by the Health and Safety ExecutiveC30 1/98
Printed and published by the Health and Safety Executive C1.25 07/03

ISBN 0-7176-2705-5
RR 101
£10.00 9 78071 7 62705 9