
PIGE experience in IPPE Institute of Physics and Power Engineering, Obninsk, Russia A.F. Gurbich.
33
PIGE experience in IPPE Institute of Physics and Power Engineering, Obninsk, Russia A.F. Gurbich
Transcript of PIGE experience in IPPE Institute of Physics and Power Engineering, Obninsk, Russia A.F. Gurbich.
PIGE experience in IPPE
Institute of Physics and Power Engineering, Obninsk, Russia
A.F. Gurbich

Overview
• For the analysis of carbon, sodium, aluminum, and chromium resonance PIGE was employed. The excitation functions for the corresponding reactions were measured in the vicinity of resonances favorable for analytical applications.
• The oxygen analysis using gammas from direct non-resonant radiative capture was undertaken.
• PIGE was used for the analysis of various samples including semiconductor structures and nuclear reactor materials.
• Hydrogen analysis using resonance 1H(19F,)16O reaction was used to study hydrogen penetration into coating layers on the surface of zirconium pipes.
• Propagation of the spectrometer efficiency calibration on the high energy region was made using cascade gamma quanta from the resonance 27Al(p,)28Si reaction with known gamma ray branching.
• Tickonov’s regularization method was applied to resolve the ill-posed problem of the determination of concentration on depth distribution.
• Pulsed incident beam was used to substantially enhance the sensitivity of the PIGE analysis due to suppression of the background gamma-radiation.
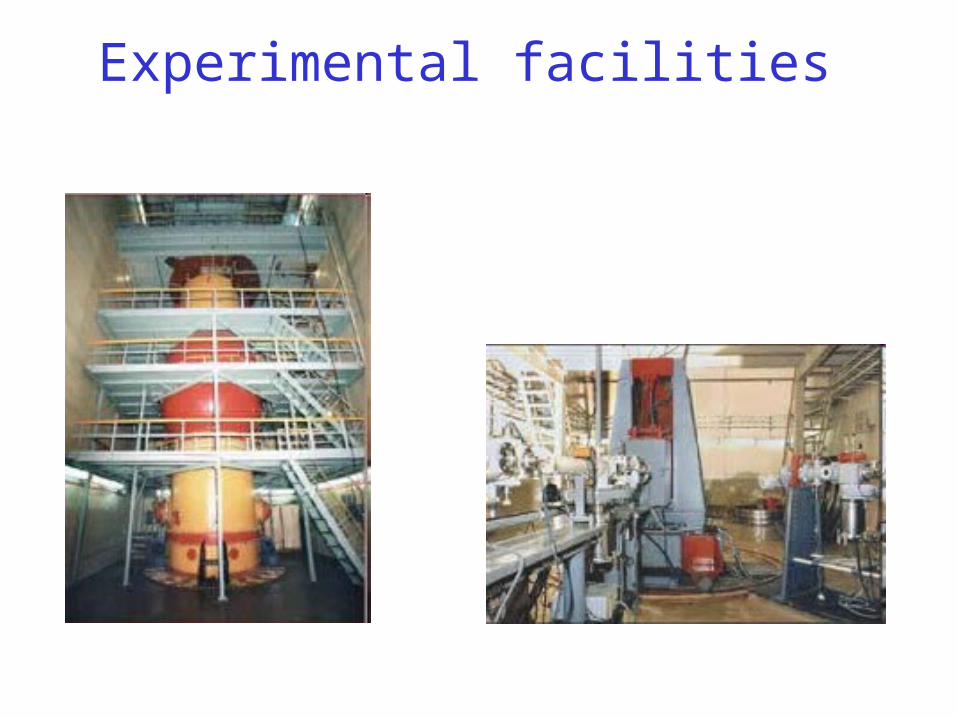
Experimental facilities

Thick target yield for resonance
The resonance yield per unity solid angle and unity incident particles charge for prompt gamma-rays emission from homogenous target with energy thickness of ET is defined as
where N0 - is Avogadro constant, A - is a molecular mass, c - is element concentration in the target.
Assuming the Breit-Wigner resonance
where R - is a cross section at resonance energy ER and - is a resonance width,
the yield for an infinitely thick target (ET>>) is
The R, , and ER may be regarded as free parameters and these have to be found by fit of theoretical yield
to measured data.
Y cN
A
p
dE dxdE
E E
E
T
0 ( , )
/,
( , )/
( )
p
E ER
R
2
22
4
4
YcN
A dE dx
E ER R 0 1
2 2 2
/
( tan/
)
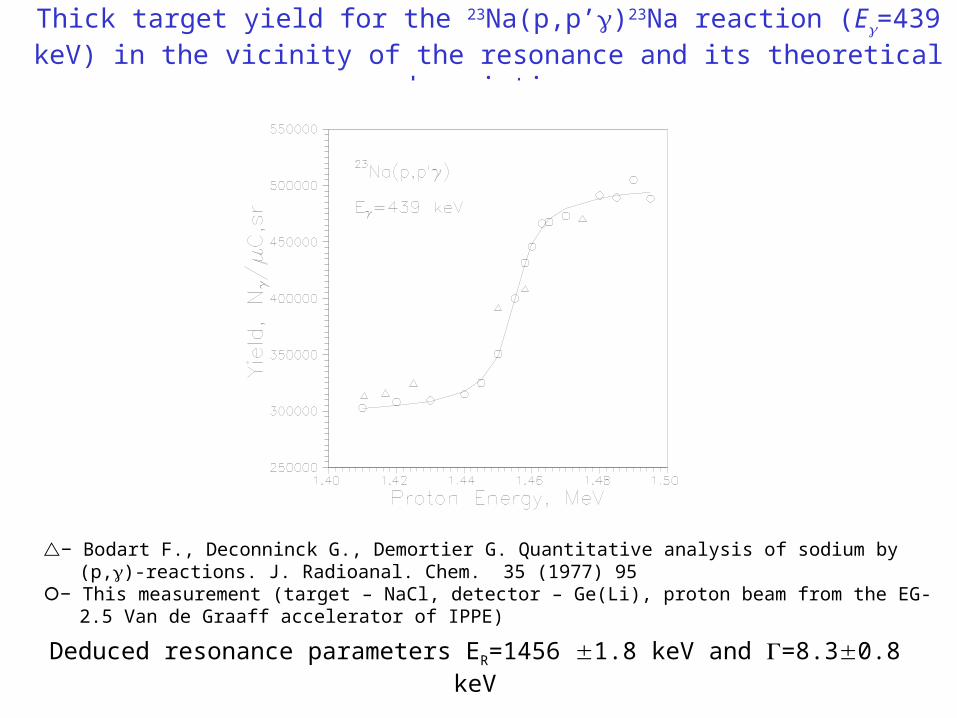
Thick target yield for the 23Na(p,p’)23Na reaction (E=439 keV) in the vicinity of the resonance and its theoretical description
− Bodart F., Deconninck G., Demortier G. Quantitative analysis of sodium by (p,)-reactions. J. Radioanal. Chem. 35 (1977) 95
− This measurement (target – NaCl, detector – Ge(Li), proton beam from the EG-2.5 Van de Graaff accelerator of IPPE)
Deduced resonance parameters ER=1456 1.8 keV and =8.30.8 keV
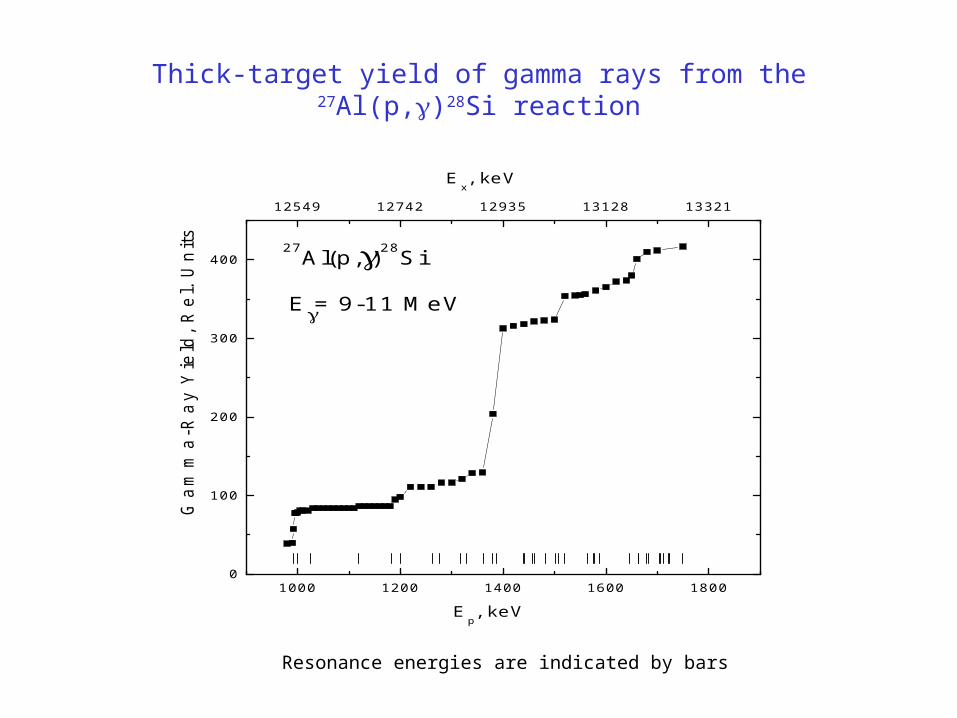
Thick-target yield of gamma rays from the 27Al(p,)28Si reaction
1000 1200 1400 1600 18000
100
200
300
400
12549 12742 12935 13128 13321
Ex, keV
E= 9-11 MeV
27Al(p,)28Si
G
am
ma
-Ra
y Y
ield
, R
el. U
nits
Ep, keV
Resonance energies are indicated by bars
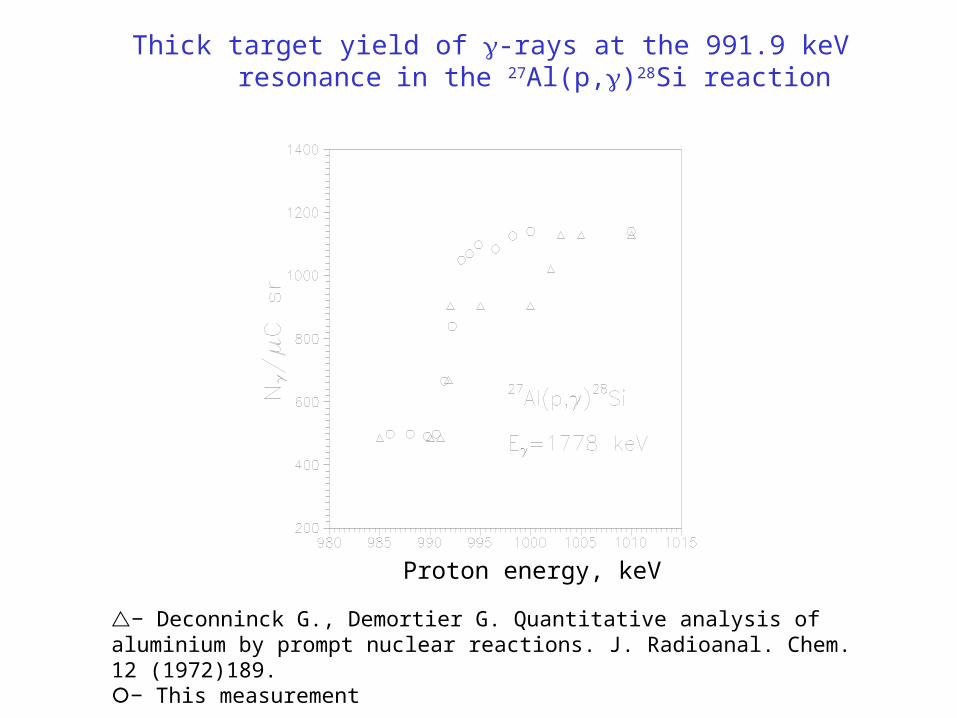
Thick target yield of -rays at the 991.9 keV resonance in the 27Al(p,)28Si reaction
Proton energy, keV
− Deconninck G., Demortier G. Quantitative analysis of aluminium by prompt nuclear reactions. J. Radioanal. Chem. 12 (1972)189.− This measurement
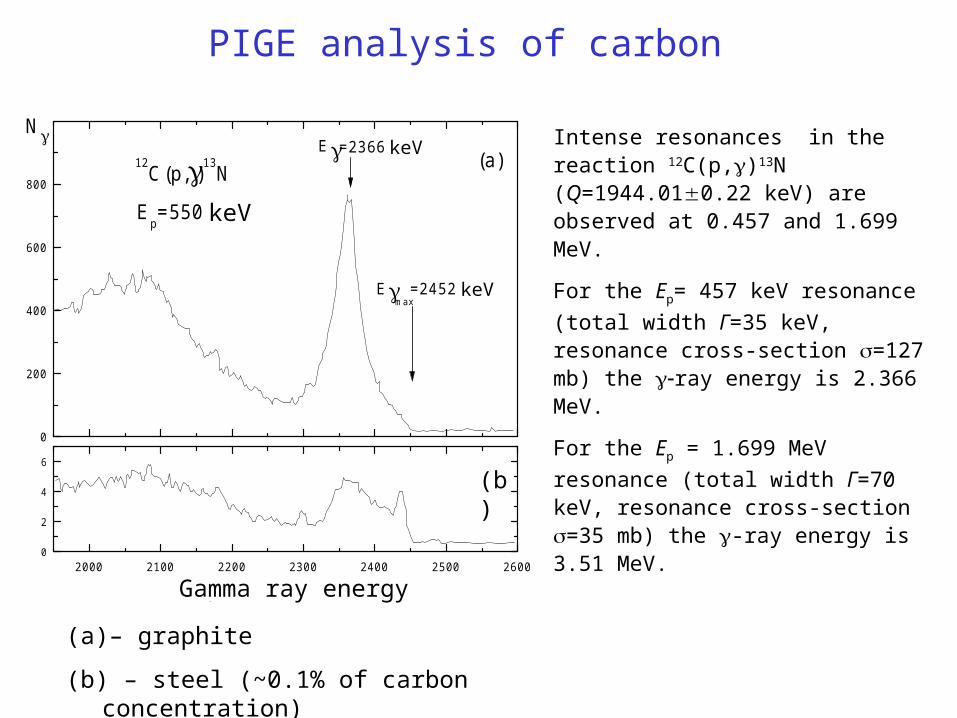
PIGE analysis of carbon
0
200
400
600
800
(а)
Ep=550 кэВ
=2452 кэВ
12C(p,)13N=2366 кэВE
Emax
N
2000 2100 2200 2300 2400 2500 26000
2
4
6(б)
Энергия гамма-квантов
Intense resonances in the reaction 12С(p,)13N (Q=1944.010.22 keV) are observed at 0.457 and 1.699 MeV.
For the Еp= 457 keV resonance (total
width Г=35 keV, resonance cross-section =127 mb) the ray energy is 2.366 MeV.
For the Еp = 1.699 MeV resonance
(total width Г=70 keV, resonance cross-section =35 mb) the -ray energy is 3.51 MeV.
Gamma ray energy
(b)
keV
keV
keV
(a) – graphite
(b) – steel (~0.1% of carbon concentration)
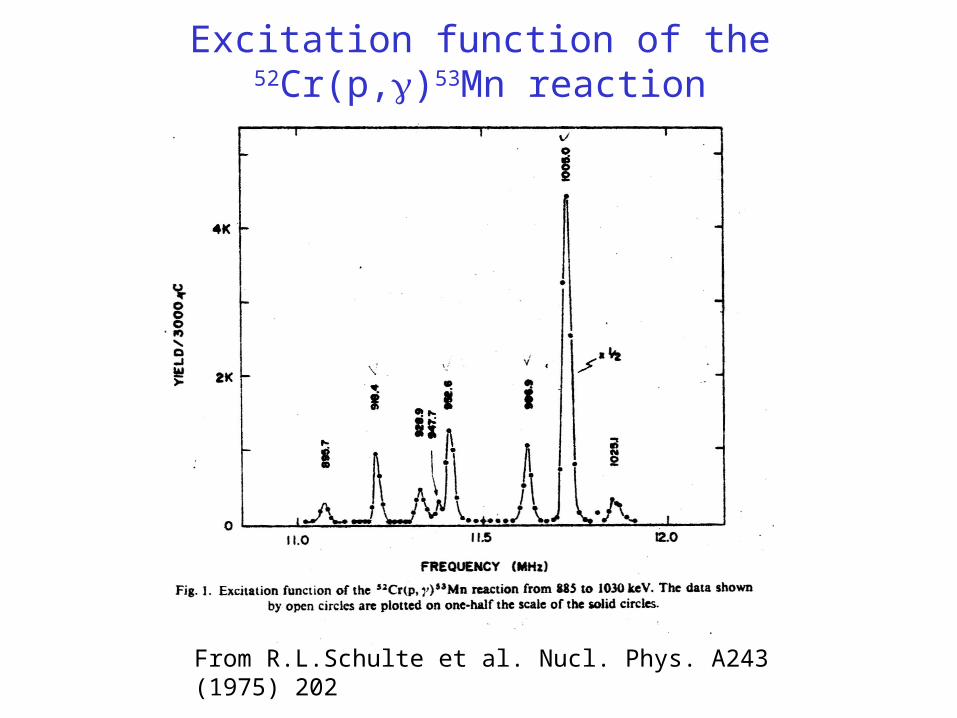
Excitation function of the 52Cr(p,)53Mn reaction
From R.L.Schulte et al. Nucl. Phys. A243 (1975) 202
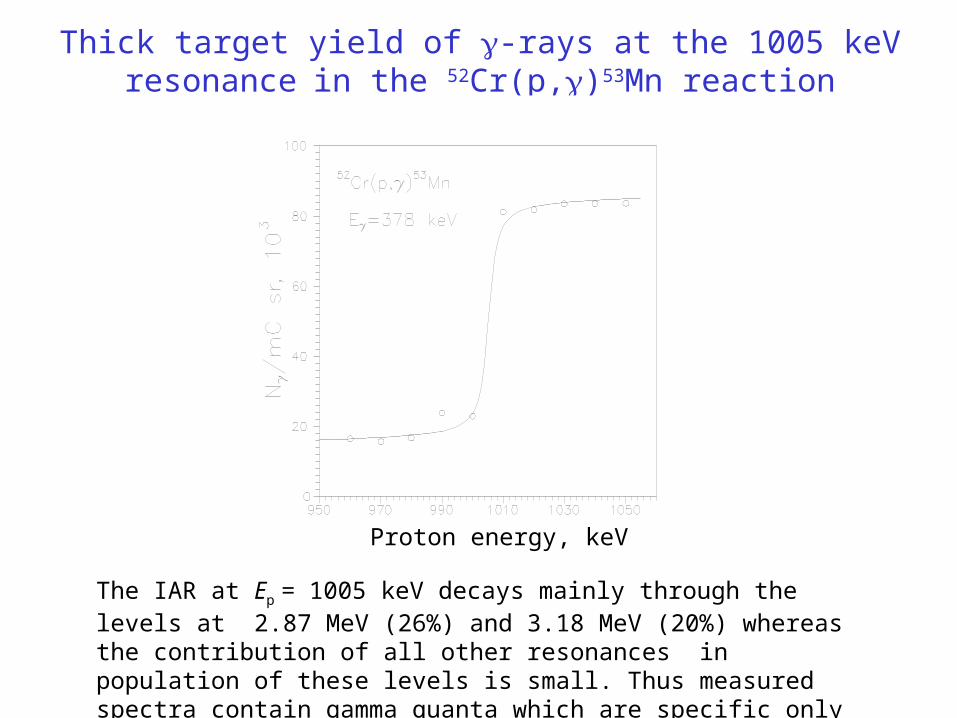
Thick target yield of -rays at the 1005 keV resonance in the 52Cr(p,)53Mn reaction
Proton energy, keV
The IAR at Еp = 1005 keV decays mainly through the levels at 2.87 MeV (26%) and 3.18 MeV (20%) whereas the contribution of all other resonances in population of these levels is small. Thus measured spectra contain gamma quanta which are specific only for this resonance.
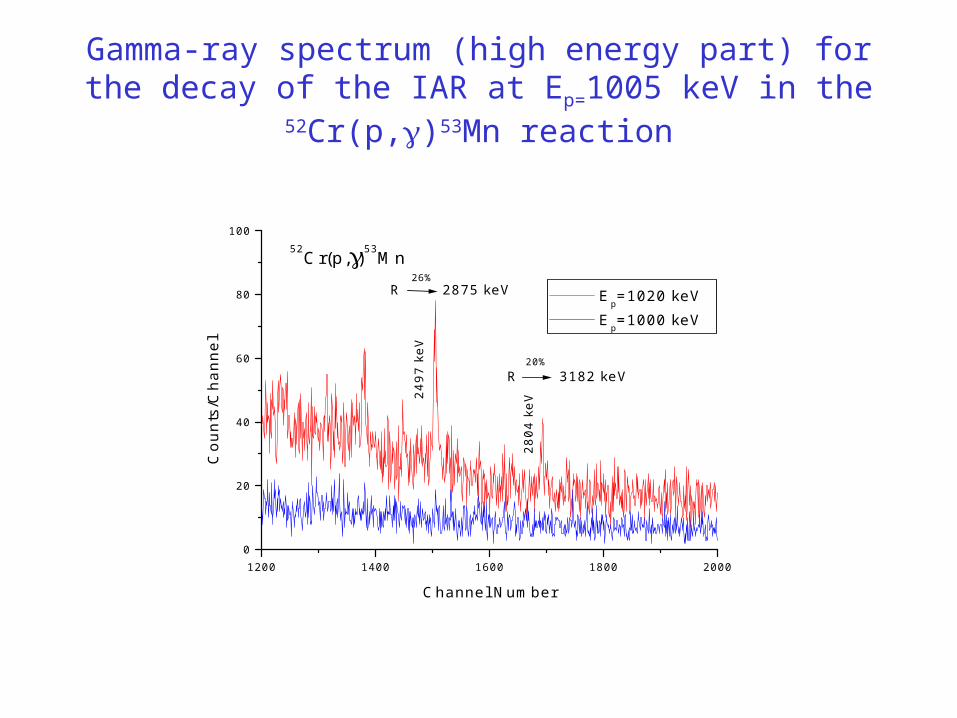
Gamma-ray spectrum (high energy part) for the decay of the IAR at Ep=1005 keV in the 52Cr(p,)53Mn reaction
1200 1400 1600 1800 20000
20
40
60
80
10052Cr(p,)53Mn
2804
keV
20%R 3182 keV
2497
keV
26%R 2875 keV E
p=1020 keV
Ep=1000 keV
Cou
nts/
Cha
nnel
Channel Number
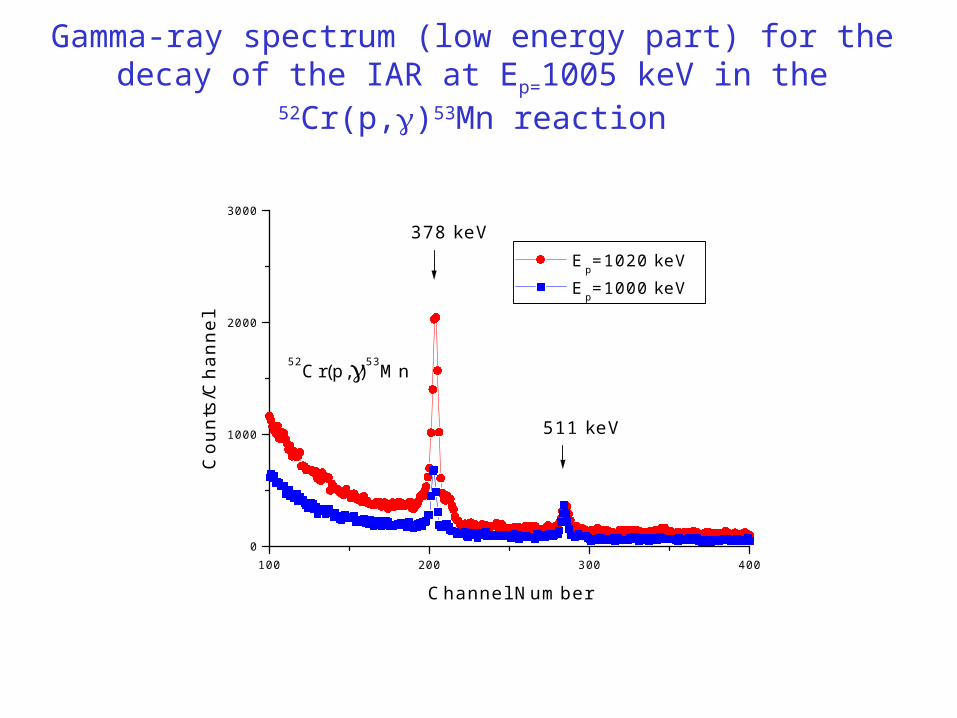
Gamma-ray spectrum (low energy part) for the decay of the IAR at Ep=1005 keV in the 52Cr(p,)53Mn reaction
100 200 300 4000
1000
2000
3000
52Cr(p,)53Mn
378 keV
511 keV
Ep=1020 keV
Ep=1000 keV
Cou
nts/
Cha
nnel
Channel Number

Oxygen analysis using gammas from direct non-resonant radiative capture
( ) ( ( ))E E E constp p E EM
M mE x Q E Ep p ( ) ( )
1
N E EN
Mq c x E E x E x
xAp p( , ) ( ) ( ( ( ))) ( ( ), )
cos
Co
unt
s/C
han
nel
Channel Number
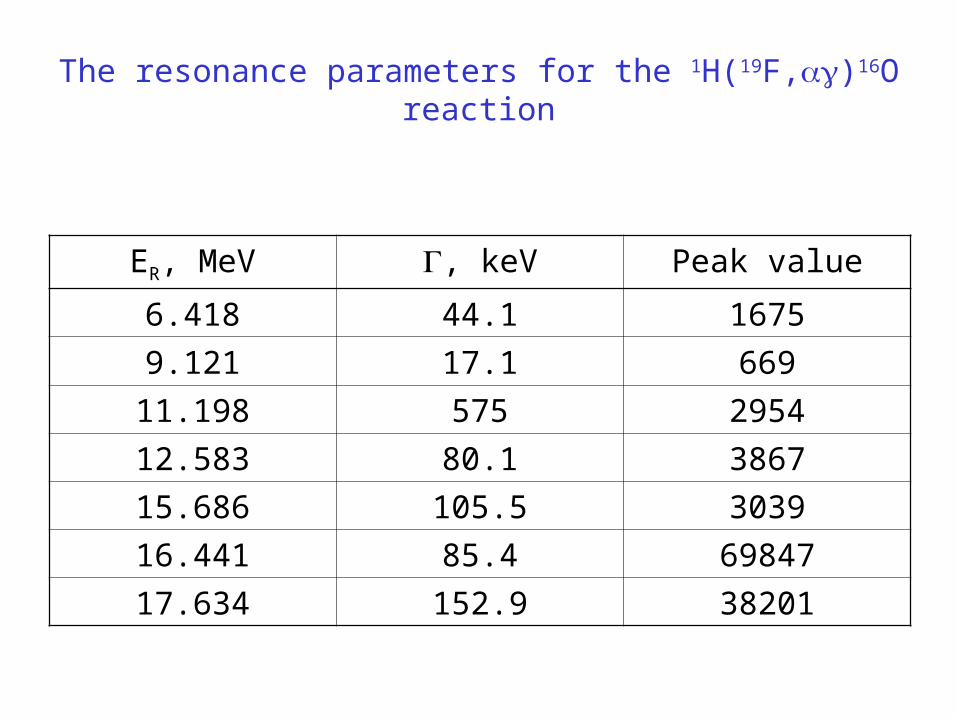
The resonance parameters for the 1H(19F,)16O reaction
ER, MeV , keV Peak value
6.418 44.1 1675
9.121 17.1 669
11.198 575 2954
12.583 80.1 3867
15.686 105.5 3039
16.441 85.4 69847
17.634 152.9 38201

The gamma ray yield for the 1H(19F,)16O reaction. The EXFOR data for the 19F(p,)16O reaction were converted for the case when 19F is a
projectile
6000 8000 10000 12000 14000 16000 18000 200000
100
200
300
400
500
600
1H(
19F,)16
O
0.1
Ga
mm
a R
ay
Yie
ld, a
rbitr
ary
un
its
Energy, keV
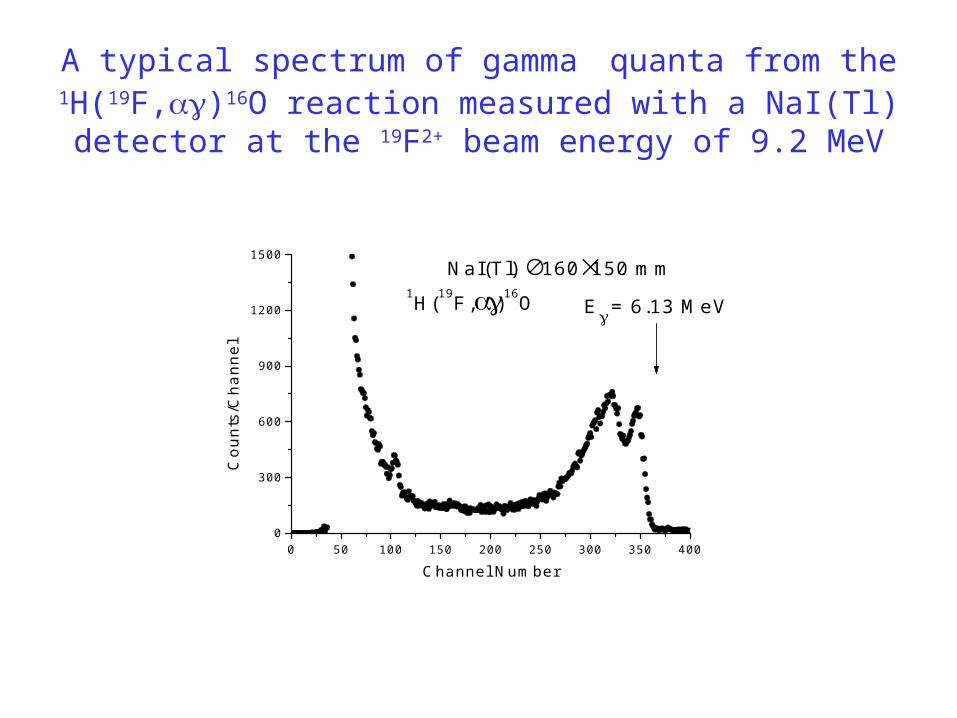
A typical spectrum of gamma quanta from the 1H(19F,)16O reaction measured with a NaI(Tl) detector at
the 19F2+ beam energy of 9.2 MeV
0 50 100 150 200 250 300 350 4000
300
600
900
1200
1500
NaI(Tl) 160150 mm1H(19F,)16O E = 6.13 MeV
Co
un
ts/C
ha
nn
el
Channel Number

The spectrum of gamma rays for the 27Al(p,)28Si reaction from which the spectrometer efficiency for high energy
gamma quanta was determined
2 1 2
1 2 1
,I S
I S
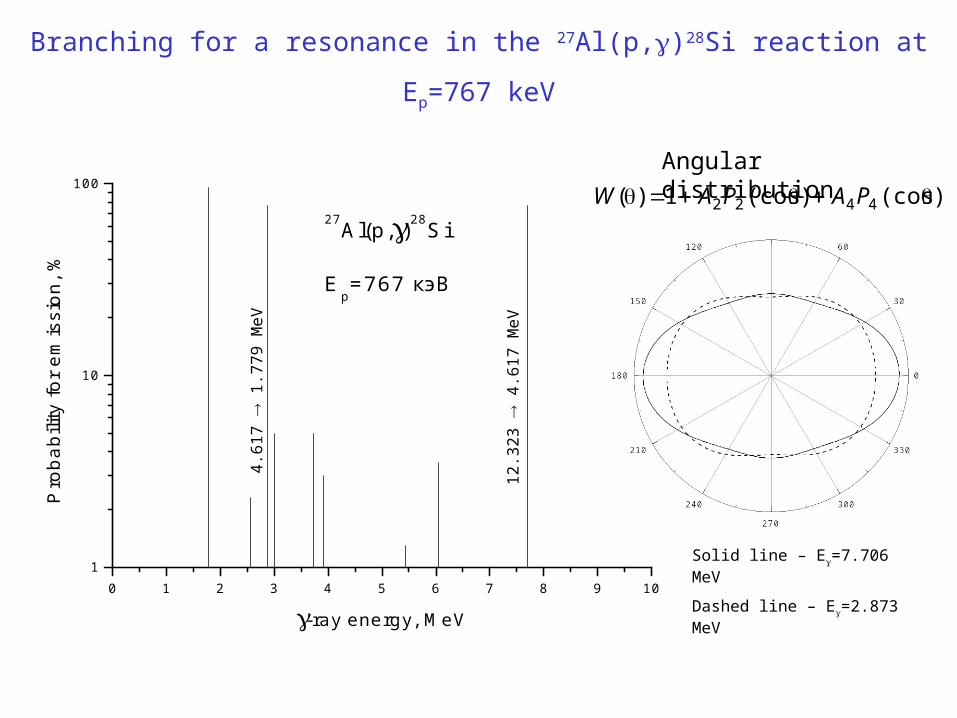
Branching for a resonance in the 27Al(p,)28Si reaction at Ep=767 keV
0 1 2 3 4 5 6 7 8 9 101
10
100
Ep=767 кэВ
27Al(p,)28Si
Pro
babi
lity
for
emis
sion
, %
-ray energy, MeV
12
.32
3
4.6
17
Me
V
4.6
17
1
.77
9 M
eV
Solid line – E=7.706 MeV
Dashed line – E=2.873 MeV
Angular distribution
)(cos)(cos1)( 4422 PAPAW
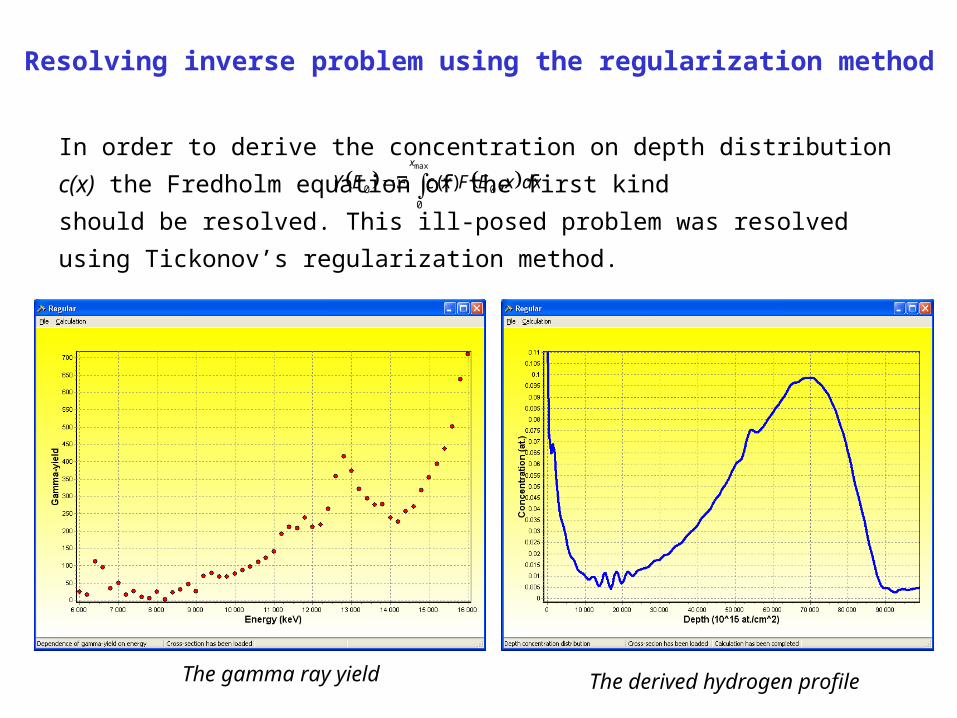
Resolving inverse problem using the regularization method
The gamma ray yield The derived hydrogen profile
In order to derive the concentration on depth distribution c(x) the Fredholm
equation of the first kind
should be resolved. This ill-posed problem was resolved using Tickonov’s
regularization method.
dxxEFxcEYx
max
0
00 ,)(

Gamma-ray yield for the aluminized steel sample
1000 1100 1200 1300 1400 1500 1600 17000
5000
10000
15000
20000
25000
30000
35000
Гам
ма-
выхо
д (
отн.
ед
.)
Ep, кэВ
Dots – experiment
Line – theoretical fit
Yie
ld,
arbi
trar
y un
its
keV
27Al(p,28Si


Block diagram of the electronics
Pre-amplifier
LogicShaper
Delay
Pre-amplifier
Detector
Spectro-scopic
Amplifier
DifferentialDiscrim.
FastAmplifier
ConstantFraction
Discr.
Time toAmplitudeConverter
Analog toDigital
Converter
stopstart
t
E
TargetPick-up
strobe

Energy and timing spectra
Channel Number (Energy) Channel Number (Time)
Cou
nts/
Cha
nnel
Cou
nts/
Cha
nnel
Tar
get
Slit
s
0.75 ns/channel
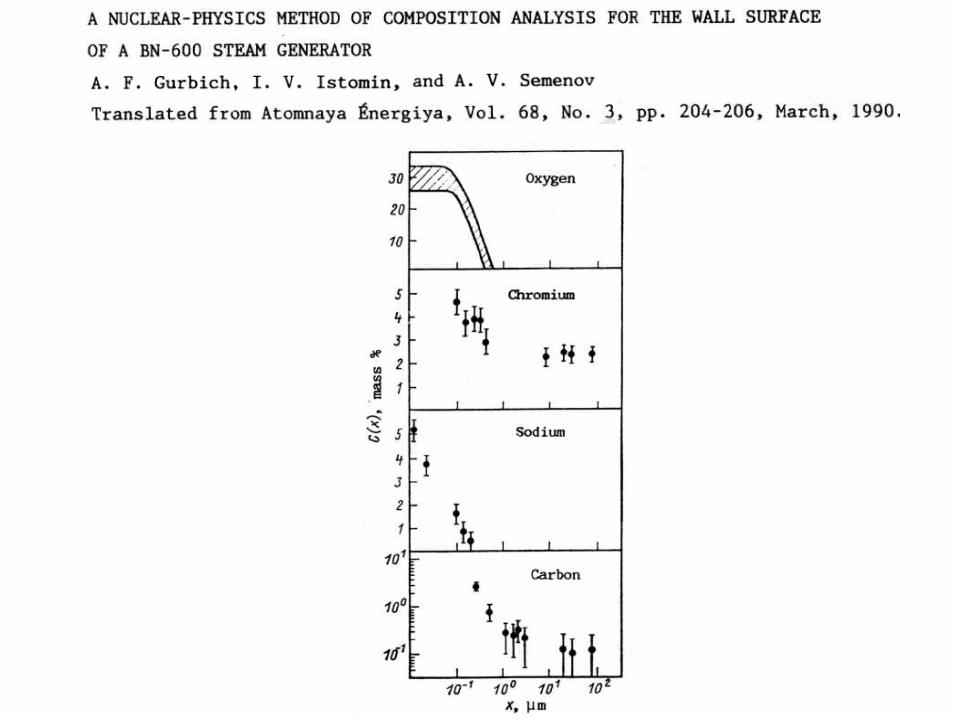
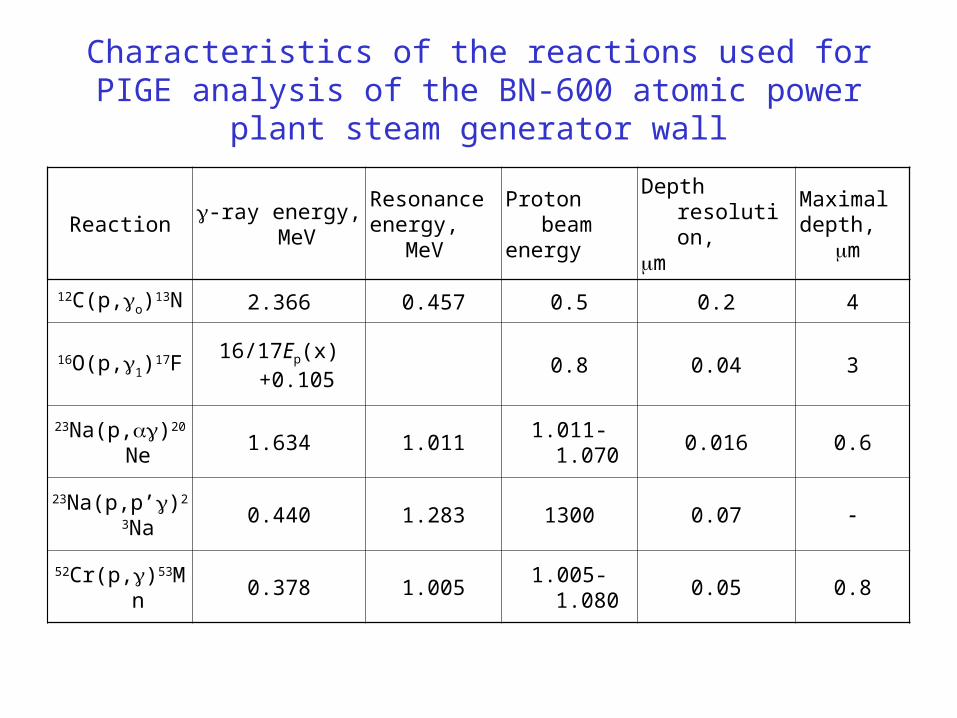
Characteristics of the reactions used for PIGE analysis of the BN-600 atomic power plant steam generator wall
Reaction -ray energy, MeVResonance energy, MeV
Proton beamenergy
Depth resolution,m
Maximal depth, m
12C(p,o)13N 2.366 0.457 0.5 0.2 4
16O(p,1)17F 16/17Ep(x)+0.105 0.8 0.04 3
23Na(p,)20Ne 1.634 1.011 1.011-1.070 0.016 0.6
23Na(p,p’)23Na 0.440 1.283 1300 0.07
52Cr(p,)53Mn 0.378 1.005 1.005-1.080 0.05 0.8

Sodium distribution near the surface of an oxidized silicon wafer
The insert shows a part of gamma-spectrum around the sodium line at E=439 keV for oxidized () and virgin () samples for irradiation with a proton beam of Ep=1470 keV
mas
s %
m
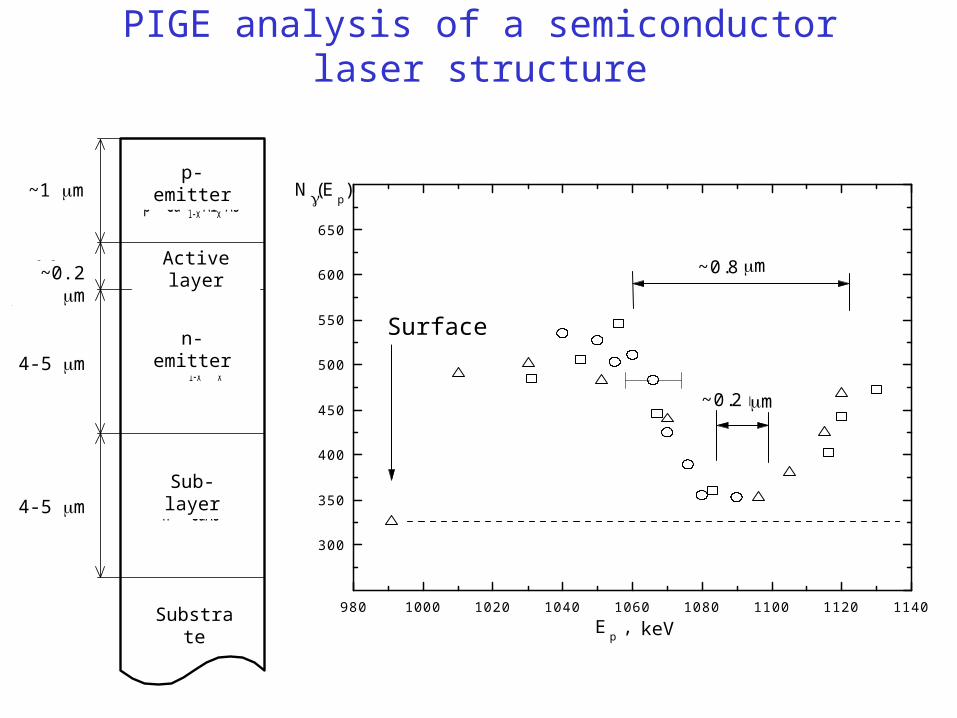
PIGE analysis of a semiconductor laser structure
p- эмиттер
p - Ga 1-x Al x As
Активный слойp - GaAs
n - эмиттер
n - Ga 1-x A lxAs
Подслой
n - GaAs
Подложка
~1мкм
~0.2 мкм
4 - 5 мкм
4 - 5 мкм
980 1000 1020 1040 1060 1080 1100 1120 1140
300
350
400
450
500
550
600
650
N(Ep)
Поверхность
~0.2 мкм
~0.8 мкм
Ep , кэВSubstrate
Sub-layer
n-emitter
Active layer
p-emitter
Surface
keV
~1 m
~0.2 m~0.2 m
4-5 m
4-5 m
m
m

Aluminum depth profile near surface of the samples tested in the flow of melted lead. Solid line – results obtained using 27Al(d,p0+1)28Al reaction. Dashed line – PIGE results.
0.25
0.30
0.35
0.40
0.45
0.0
0.1
0.2
0.3
0.4
0.0
0.1
0.2
0.3
0.4
0 1 2 30.0
0.1
0.2
0.3
Virgin
Ato
mic
Con
cent
ratio
n
2000 hours
3000 hours
4000 hours
Depth, m

Mistakes in PIGE data presentation in IBANDL
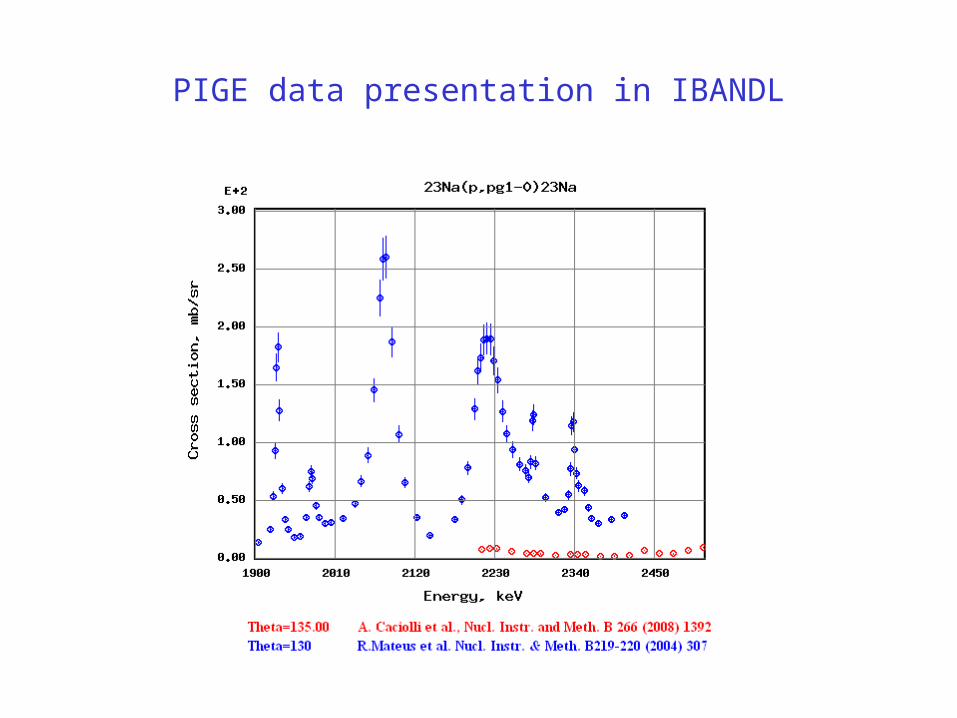
PIGE data presentation in IBANDL
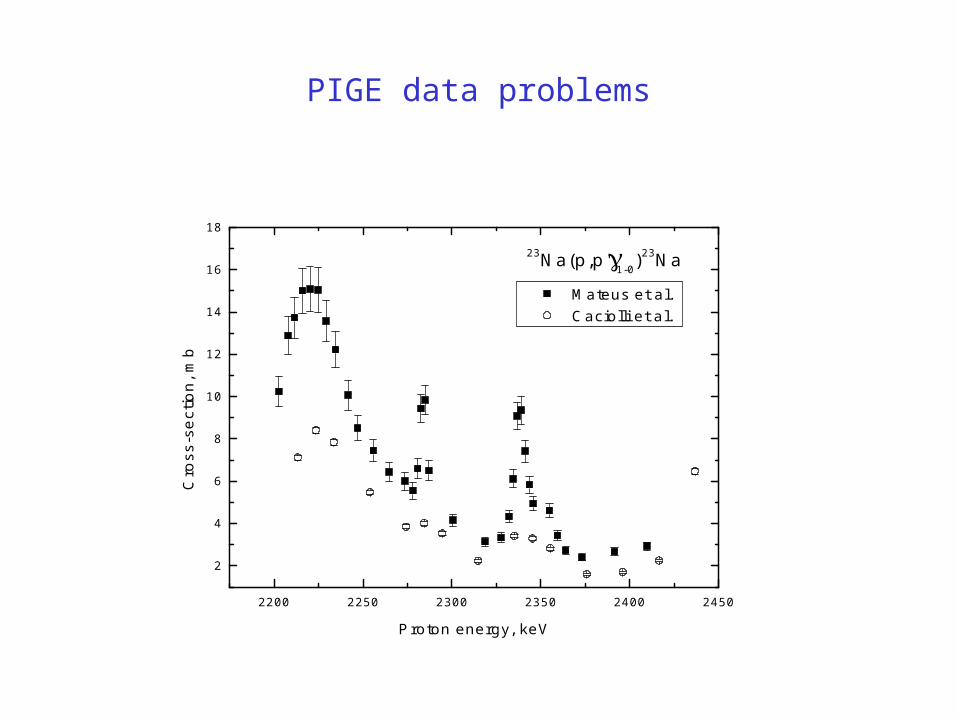
PIGE data problems
2200 2250 2300 2350 2400 2450
2
4
6
8
10
12
14
16
18
Mateus et al. Caciolli et al.
Cro
ss-s
ect
ion
, mb
Proton energy, keV
23Na(p,p'1-0)23Na
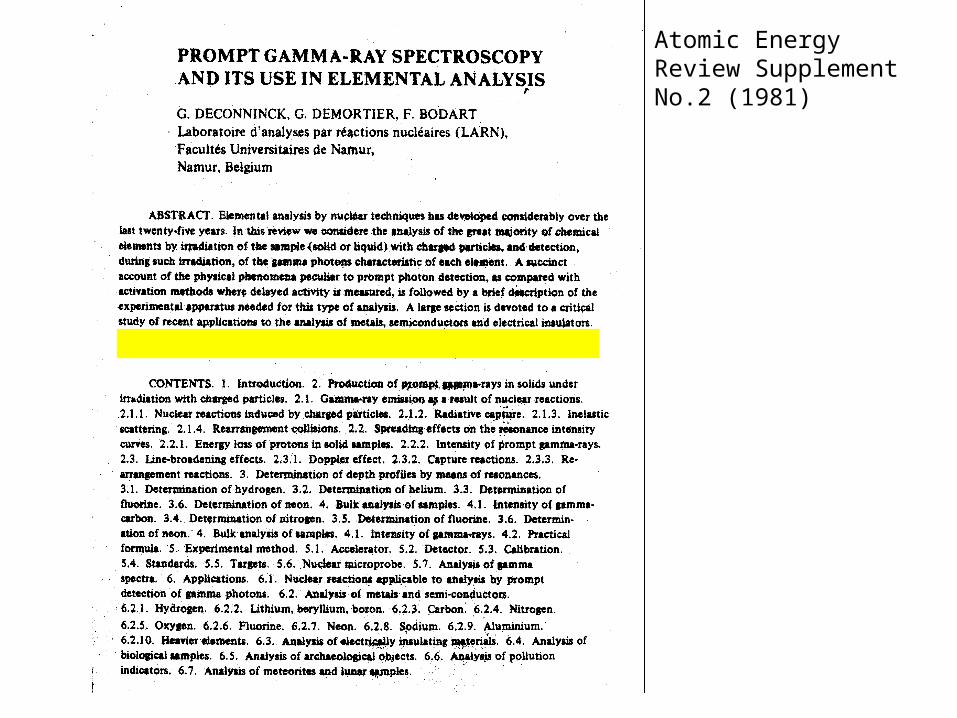
Atomic Energy Review Supplement No.2 (1981)
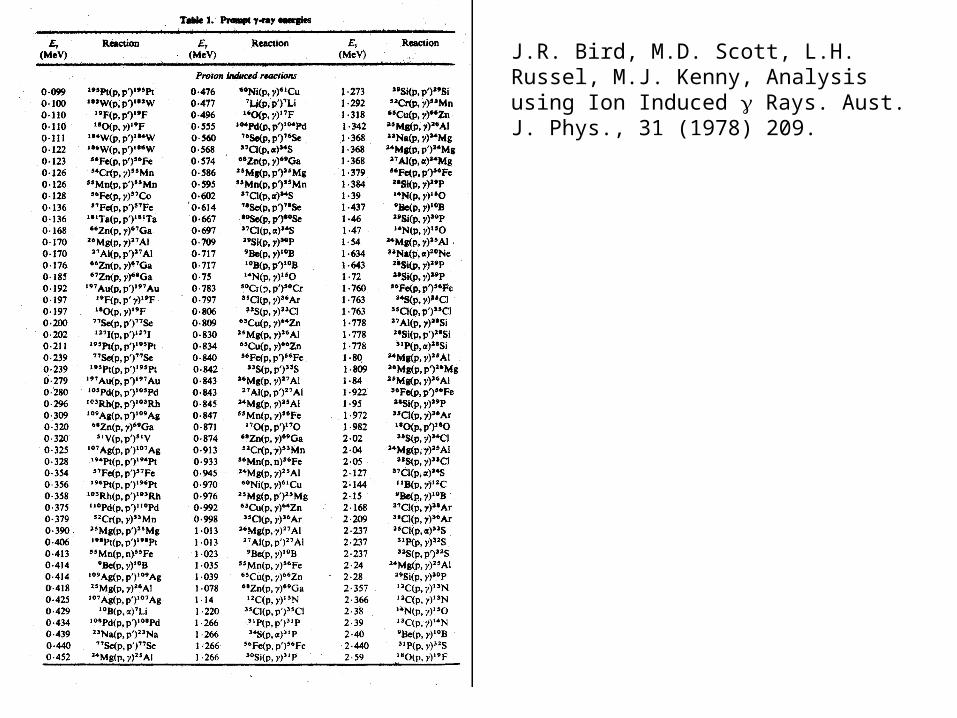
J.R. Bird, M.D. Scott, L.H. Russel, M.J. Kenny, Analysis using Ion Induced Rays. Aust. J. Phys., 31 (1978) 209.


![GeneralRelativityProblemofMercury’s ...arXiv:1008.1811v1 [ ] 10 Aug 2010 GeneralRelativityProblemofMercury’s PerihelionAdvanceRevisited Anatoli Andrei Vankov IPPE,Obninsk,Russia](https://static.fdocuments.us/doc/165x107/5aab543c7f8b9a8d678bb401/generalrelativityproblemofmercurys-arxiv10081811v1-10-aug-2010-generalrelativityproblemofmercurys.jpg)


