NCompass Live: Tech Talk with Michael Sauers: Artificial Intelligence: Transforming Reference
Upload
farida-visCategory
view
1.081download
0
Picturing the Social: Analysing Social Media Images
A talk for the Transforming Digital Methods Winter School at the University of Exeter, 11 December 2014
Farida Vis, Information School
University of Sheffield
@flygirltwo

750 MILLION - 1.8 BILLION
IMAGES SHARED
DAILY
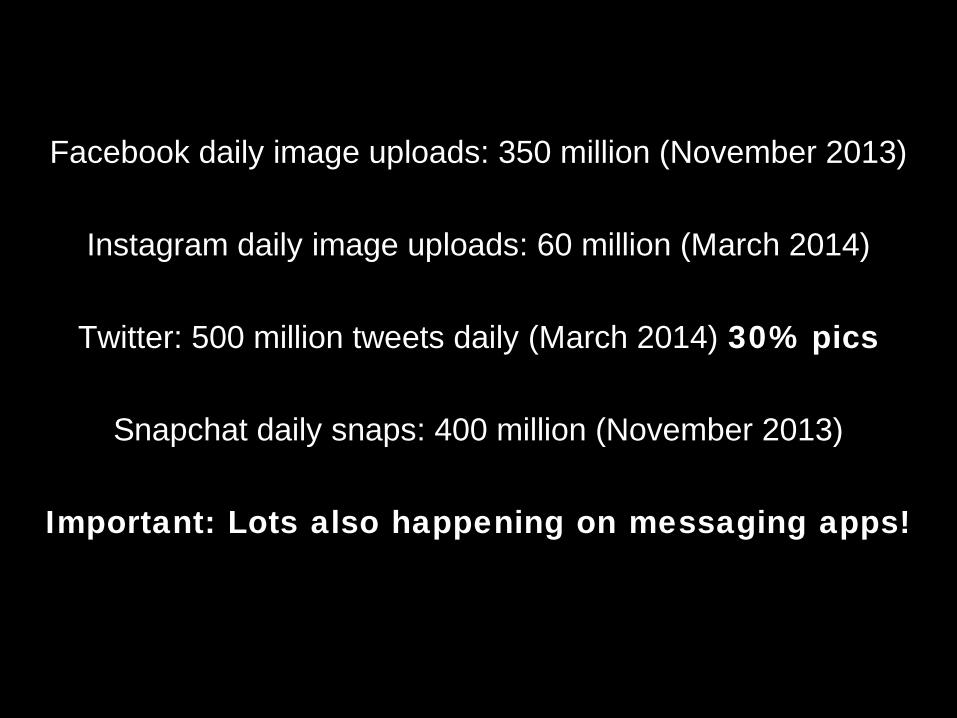
Facebook daily image uploads: 350 million (November 2013)
Instagram daily image uploads: 60 million (March 2014)
Twitter: 500 million tweets daily (March 2014) 30% pics
Snapchat daily snaps: 400 million (November 2013)
Important: Lots also happening on messaging apps!

Everyday snaps Witnessing events
Now we carry a camera with us all the time

High smartphone penetration (65% US/UK)
80% by January 2015, 90% towards end of 2017
Rise of platforms and apps focused on visual content
Tumblr
Vine
Snapchat

‘a photo of Barack and Michelle Obama, posted immediately after Obama’s re-election as President of the United States in November 2012, rapidly became the single most retweeted message in the history of Twitter.’
(‘Introduction’, Twitter and Society, 2013)

Picturing the Social: transforming our understanding of images in social media and Big Data research
(NB – still images only!)
ESRC Transformative Research grant
(18-months, started in September 2014)
Interested in everyday/mundane/exceptional
-> Taking research beyond Twitter <-
Twitter all social media | may not be ‘right’ platform≠

The project topic screams out for interdisciplinarity!
Farida Vis (PI) – Media and Communication
Simon Faulkner – Art History/Visual Culture
James Aulich - Art History/Visual Culture
Olga Gorgiunova – Software Studies/Sociology
Mike Thelwall – Information Science/software
Francesco D’Orazio – Industry/Media/software
Anne Burns (RA) – Visual Culture / Media Studies

Diverse and cross sector (with industry)!
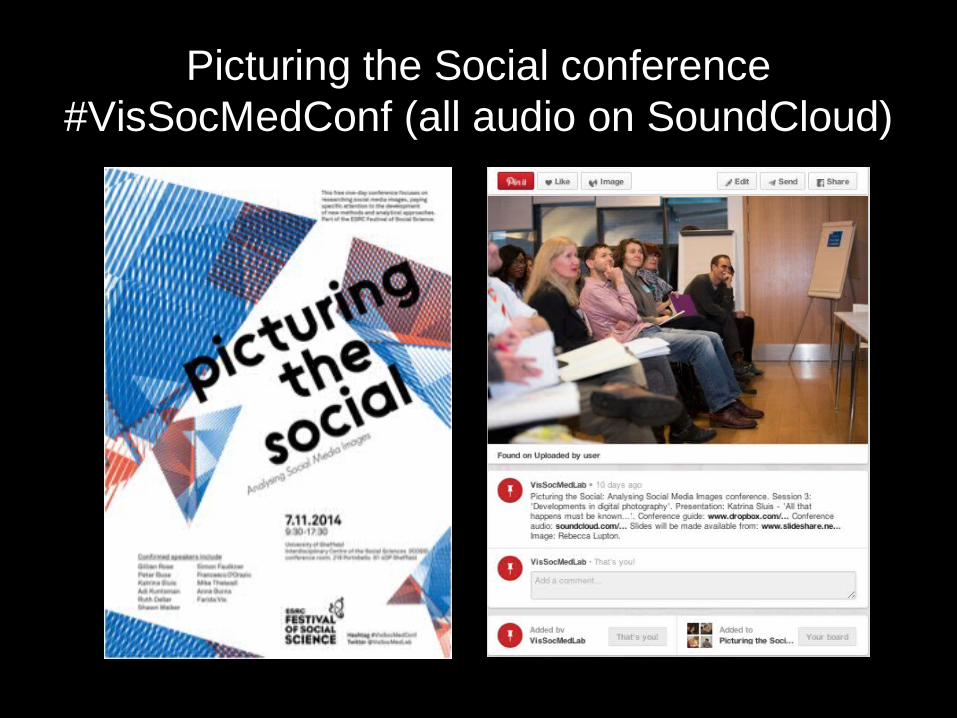
Picturing the Social conference #VisSocMedConf (all audio on SoundCloud)

• Screen Shot 2014-07-09 at 06.05.51
Creating PhD/postdoc opportunities in the Lab
VisSocMedLabTwitterPinterestSoundCloudStorify

Research Questions driving Picturing the Social project:
1. How can these new forms of social expression be understood through studying their technical infrastructures?
2. How can a bottom-up understanding of social media users inform how these structures are experienced?
3. How can we devise comprehensive methodological and theoretical strategies for the capture and interpretation of social media image data at different scales?
4. How can the study of images become a central focus within social media and Big Data research and have an impact on key stakeholders and end-users?
FSA: various | WEF: UGC, verification, ethics (beyond true/false)
Images largely ignored in social media research
Not easy to ‘mine’
Hard to figure out meaning
Context! Context! Context!
Huge interest in industry (rapid new developments!)
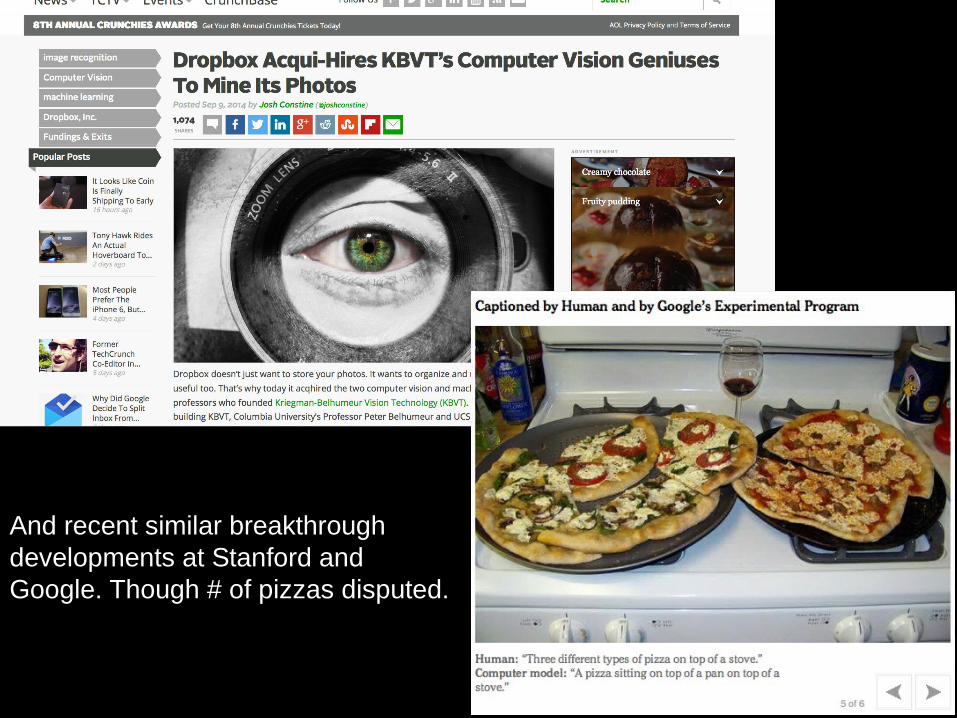
And recent similar breakthrough developments at Stanford and Google. Though # of pizzas disputed.

Rapid rise in visual social media analytics platforms

Location based image searching
Topic based image searching
Using cutting edge industry tools + firehose social media data to build image tool for academia
Based on team + wider user requirements
D’Orazio: social media data and beyond; tracking content across the social web.
Thelwall: Using public APIs to test and experiment
“Qualitative data on a quantitative scale” (D’Orazio, 2013)
Aim: free image tool for research community

Tools developed by Francesco D’OrazioReal innovation: weighs the visibility
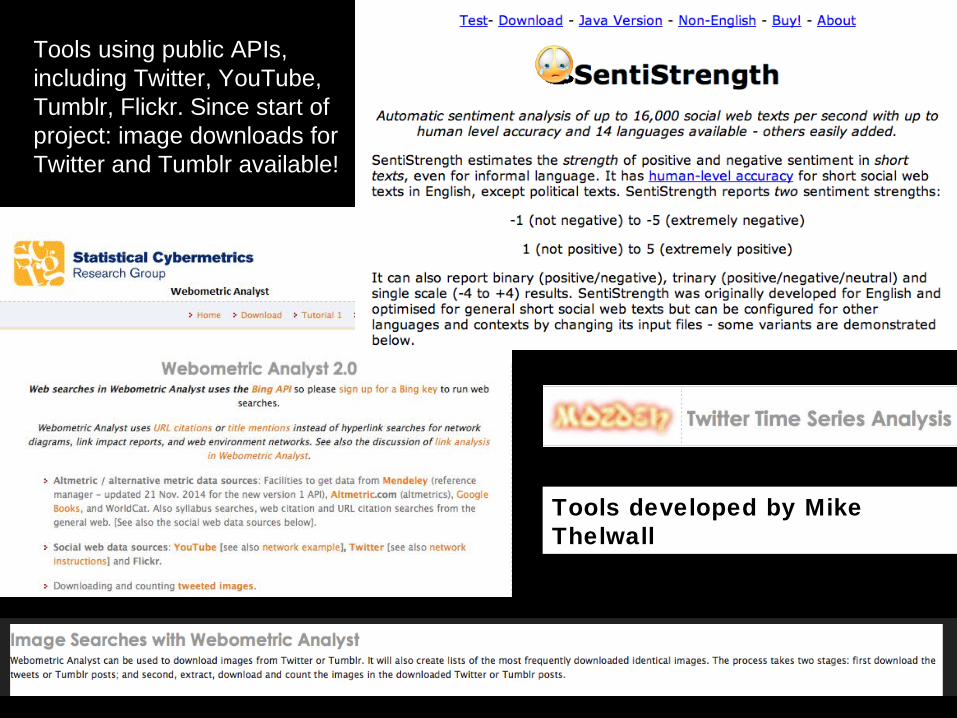
Tools using public APIs, including Twitter, YouTube, Tumblr, Flickr. Since start of project: image downloads for Twitter and Tumblr available!
Tools developed by Mike Thelwall

Building new theory: traditional broadcasting model
Production of message
Message = text
Reception of the message

Picturing the Social approach
Structures
Users
Content

Structures
Users
Content
Doing interdisciplinarity
Facet Methodology (Mason 2011)
Cut gemstone and their facets
‘The aim of our facet methodology approach is to create a
strategically illuminating set of facets in relation to specific
research concerns and questions: not a random set, or an
eclectic set, or a representative set, or a total set. The
rigour or the approach comes ultimately from researcher
skill, inventiveness, insight and imagination – in deciding
how best to carve the facets so that they catch the light in
the best possible way.’ (77: 2011)

IInformed by Facet Methodology
• Episodic (event driven)• Temporal• Ontological• Cultural• Place/location

• Episodic: Thatcher death tweets• Temporal: Slices of time: 24 hrs (public) | 1 sec (firehose) • Ontological: What is the thing?• Cultural: The atlas project• Place : Sheffield (geolocation, location, location)
• Make up of these teams: key is to unsettle
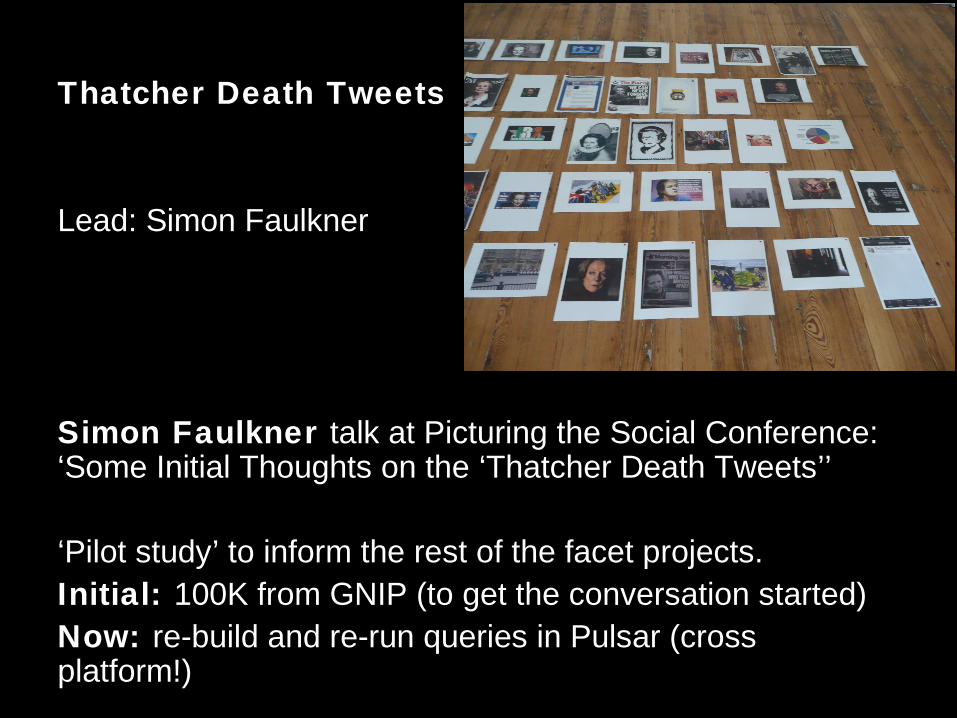
Thatcher Death Tweets
Lead: Simon Faulkner
Simon Faulkner talk at Picturing the Social Conference: ‘Some Initial Thoughts on the ‘Thatcher Death Tweets’’
‘Pilot study’ to inform the rest of the facet projects.Initial: 100K from GNIP (to get the conversation started)Now: re-build and re-run queries in Pulsar (cross platform!)

Cross-cutting methods
• 36 in-depth interviews with: industry, academia, social researchers
• (users) Nationally representative survey - If we want to know how/why users create content and meaning: we should ask them not simply project!
• (users) Series of focus groups• (users) 12-month digital ethnography• Building a tool (based on user requirements!!!)• Throughout all: structures, users, content

Thinking a bit more about structures
• How platforms make images visible? • How tensions between companies make images
more/less visible – dynamic field (capital = key)• How do APIs give access to the data‘we want’?• How companies act as data intermediaries• How do these both strip and add metadata? • How interfaces and dashboards add further
layers and structure our thinking and research?• How we know quite little about the tools we use.

How do social media companies make images visible?

Seen on a friend’s FB wall because she had liked it. Close friend -> surfaced on my newsfeed as well.

Algorithmic visibility:
seeing the image through Edgerank
How does Edgerank ‘see’?
Finding and (re)tracing the image
Image as ‘image’ | Image as ‘link’

Think critically how we study ‘the feed’ ‘the stream’ and at the same time realise they’re not the only game in town!
Visibility not a ‘given’ – linked to a series of small actions, the connections between users and value attributed by the algorithm.
How can we think about new scopic regimes in this context? How can we make their workings visible?
Belting: images as ‘nomads’ (and also shape shifters?)
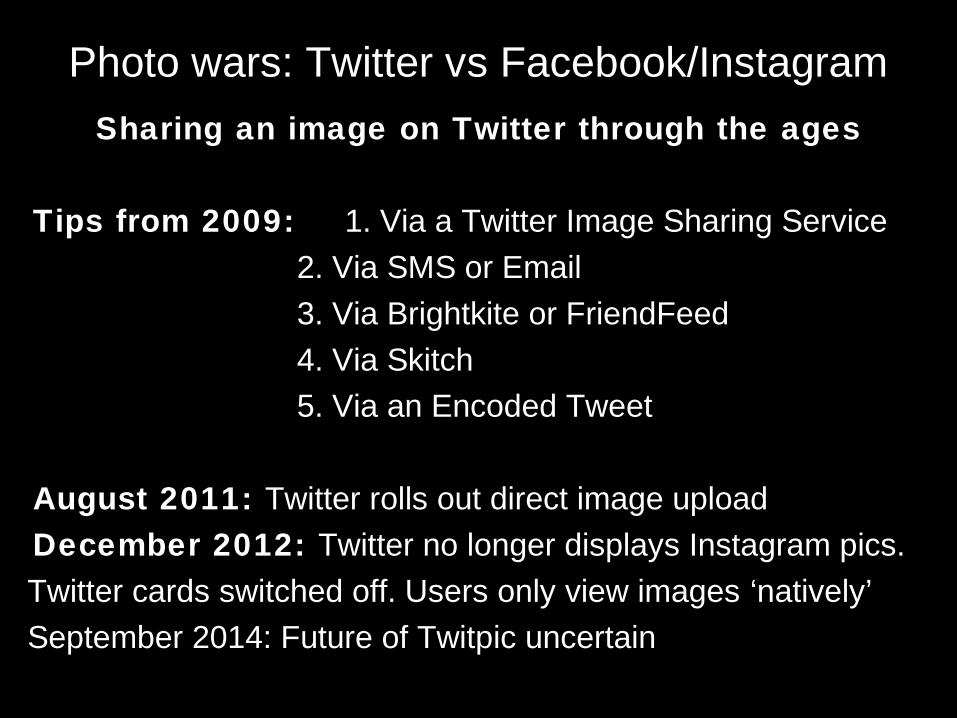
Photo wars: Twitter vs Facebook/Instagram
Sharing an image on Twitter through the ages
Tips from 2009: 1. Via a Twitter Image Sharing Service
2. Via SMS or Email
3. Via Brightkite or FriendFeed
4. Via Skitch
5. Via an Encoded Tweet
August 2011: Twitter rolls out direct image upload
December 2012: Twitter no longer displays Instagram pics.
Twitter cards switched off. Users only view images ‘natively’
September 2014: Future of Twitpic uncertain


Users hack solutions using IFTTT recipes

Using APIs and data intermediaries: GNIP
Beyond Twitter!
What do they offer?
Firehose data = ‘complete access’
Including historical access to Twitter

‘Managed public API access’ GNIP
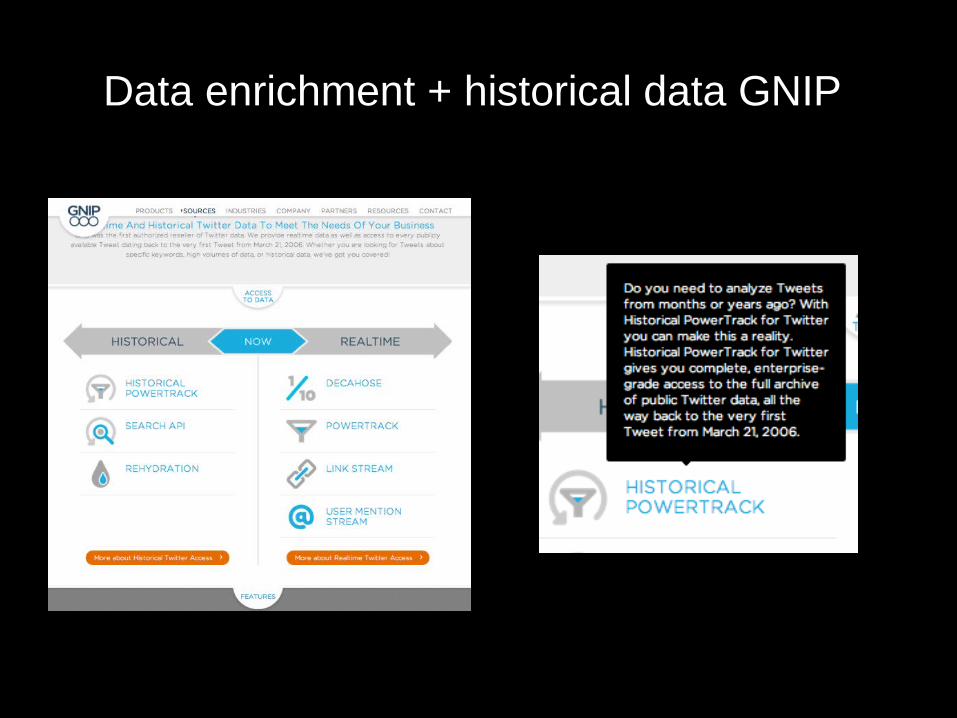
Data enrichment + historical data GNIP

Data sources: DataSift (used for Pulsar)
Twitter: 200+ million active users Tumblr: 300+ million active users
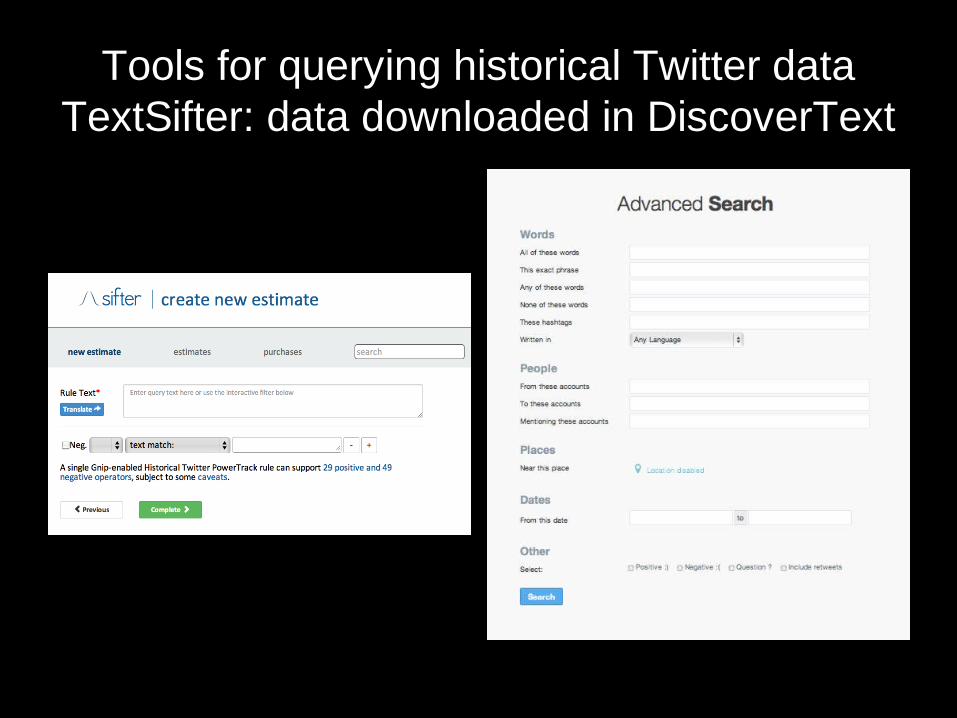
Tools for querying historical Twitter data TextSifter: data downloaded in DiscoverText

Limited access APIs: for specific users
Reading the API fine-print: Instagram’s Terms of Use 3. You cannot use the Instagram API to crawl or store users’ media without their express consent.

How do our academic (Twitter) tools work?
• Due to open access API ecosystem, we have witnessed an explosion in Twitter tools. But how do we evaluate them? NB - Do we evaluate them?
• What kinds of research questions do they allow us to answer? What kind of research question do we ask?
• What kind of ‘method’ is using an API? • How do these tools allow us to search for data? • What methods do these tools foreground?• What research possibilities do they close off?• NB - No ‘Forrester Wave’ for academic social media
tools. Maybe we should change that!

Picturing the Social
• Moving beyond the descriptive and counting• Moving beyond studies about single platforms• How are they connected within wider ecosystem?
Include all other media! • How can we study the circulation of these images?• How can we develop approaches that take into
account structures, users and content?• Where does the social come in? What can we learn
about these new social worlds?