PI-RADS Prostate Imaging - pcih.fr v2 (Barentsz, Eur Urol, 2016).pdf · (mpMRI), which combines...
25
Platinum Priority – Prostate Cancer Editorial by Jelle O. Barentsz, Jeffrey C. Weinreb, Sadhna Verma et al on pp. 41–49 of this issue PI-RADS[1_TD$DIFF] Prostate Imaging [30_TD$DIFF]– Reporting and Data System: 2015, Version 2 Jeffrey C. Weinreb a,y, *, Jelle O. Barentsz b,y , Peter L. Choyke c , Francois Cornud d , Masoom A. Haider e , Katarzyna J. Macura f , Daniel Margolis g , Mitchell D. Schnall h , Faina Shtern i , Clare M. Tempany j , Harriet C. Thoeny k , Sadna Verma l a Yale School of Medicine, New Haven, CT, USA; b Radboudumc, Nijmegen, The Netherlands; c National Institutes of Health, Bethesda, MD, USA; d Rene ´ Descartes University, Paris, France; e University of Toronto, Sunnybrook Health Sciences Centre, Toronto, Canada; f Johns Hopkins University, Baltimore, MD, USA; g University of California, Los Angeles, CA, USA; h University of Pennsylvania, Philadelphia, USA; i AdMeTech Foundation, Boston, MA, USA; j Harvard University, Boston, MA, USA; k University Hospital of Bern, Bern, Switzerland; l University of Cincinnati, Cincinnati, OH, USA 1. Introduction Magnetic Resonance Imaging (MRI) has been used for noninvasive assessment of the prostate gland and sur- rounding structures since the 1980s. Initially, prostate MRI was based solely on morphologic assessment using T1- weighted (T1W) and T2-weighted (T2W) pulse sequences, and its role was primarily for locoregional staging in patients with biopsy proven cancer. However, it provided limited capability to distinguish benign pathological tissue and clinically insignificant prostate cancer from significant cancer. Advances in technology (both in software and hardware) have led to the development of multiparametric MRI EUROPEAN UROLOGY 69 (2016) 16–40 available at www.sciencedirect.com journal homepage: www.europeanurology.com Article info Article history: Accepted August 29, 2015 Associate Editor: James Catto Keywords: Prostate mpMRI Prostate MRI Magnetic resonance imaging Prostate Prostate cancer Please visit www.eu-acme.org/ europeanurology to read and answer questions on-line. The EU-ACME credits will then be attributed automatically. Abstract The Prostate Imaging [30_TD$DIFF]– Reporting[36_TD$DIFF] and Data System Version 2 (PI-RADS TM v2) is the product of an international collaboration of the American College of Radiology (ACR), European Society of Uroradiology (ESUR), and AdMetech Foundation. It is designed to promote global standardization and diminish variation in the acquisition, interpretation, and reporting of prostate [37_TD$DIFF]multiparametric magnetic resonance [38_TD$DIFF]imaging (mpMRI) ex- amination, and it is based on the best available evidence and expert consensus opinion. It establishes minimum acceptable technical parameters for prostate mpMRI, simplifies and standardizes terminology and content of reports, and provides assessment catego- ries that summarize levels of suspicion or risk[39_TD$DIFF] of clinically significant prostate cancer that can be used to assist selection of patients for biopsies and management. It is intended to be used in routine clinical practice and also to facilitate data collection and outcome monitoring for research. # 2015 European Association of Urology. Published by Elsevier B.V. All rights reserved. y These authors are co-first authors. * Corresponding author. Tel. +[35_TD$DIFF]1 203 785 5913. E-mail address: [email protected] (J.C. Weinreb). http://dx.doi.org/10.1016/j.eururo.2015.08.052 0302-2838/# 2015 European Association of Urology. Published by Elsevier B.V. All rights reserved.
Transcript of PI-RADS Prostate Imaging - pcih.fr v2 (Barentsz, Eur Urol, 2016).pdf · (mpMRI), which combines...

E U R O P E A N U R O L O G Y 6 9 ( 2 0 1 6 ) 1 6 – 4 0
avai lable at www.sciencedirect .com
journal homepage: www.europeanurology.com
Platinum Priority – Prostate CancerEditorial by Jelle O. Barentsz, Jeffrey C. Weinreb, Sadhna Verma et al on pp. 41–49 of this issue
PI-RADS [1_TD$DIFF] Prostate Imaging [30_TD$DIFF]– Reporting and Data System: 2015,
Version 2
Jeffrey C. Weinreb a,y,*, Jelle O. Barentsz b,y, Peter L. Choyke c, Francois Cornud d,Masoom A. Haider e, Katarzyna J. Macura f, Daniel Margolis g, Mitchell D. Schnall h,Faina Shtern i, Clare M. Tempany j, Harriet C. Thoeny k, Sadna Verma l
a Yale School of Medicine, New Haven, CT, USA; b Radboudumc, Nijmegen, The Netherlands; c National Institutes of Health, Bethesda, MD, USA; d Rene
Descartes University, Paris, France; e University of Toronto, Sunnybrook Health Sciences Centre, Toronto, Canada; f Johns Hopkins University, Baltimore, MD,
USA; g University of California, Los Angeles, CA, USA; h University of Pennsylvania, Philadelphia, USA; i AdMeTech Foundation, Boston, MA, USA; j Harvard
University, Boston, MA, USA; k University Hospital of Bern, Bern, Switzerland; l University of Cincinnati, Cincinnati, OH, USA
Article info
Article history:Accepted August 29, 2015
Associate Editor:
James Catto
Keywords:
Prostate mpMRI
Prostate MRI
Magnetic resonance imaging
Prostate
Prostate cancer
Abstract
The Prostate Imaging [30_TD$DIFF]– Reporting[36_TD$DIFF] and Data System Version 2 (PI-RADSTM v2) is theproduct of an international collaboration of the American College of Radiology (ACR),European Society of Uroradiology (ESUR), and AdMetech Foundation. It is designed topromote global standardization and diminish variation in the acquisition, interpretation,and reporting of prostate [37_TD$DIFF]multiparametric magnetic resonance [38_TD$DIFF]imaging (mpMRI) ex-amination, and it is based on the best available evidence and expert consensus opinion. Itestablishes minimum acceptable technical parameters for prostate mpMRI, simplifiesand standardizes terminology and content of reports, and provides assessment catego-ries that summarize levels of suspicion or risk[39_TD$DIFF] of clinically significant prostate cancerthat can be used to assist selection of patients for biopsies and management. It isintended to be used in routine clinical practice and also to facilitate data collection andoutcome monitoring for research.
# 2015 European Association of Urology. Published by Elsevier B.V. All rights reserved.
Please visit www.eu-acme.org/
europeanurology to read and
answer questions on-line.
The EU-ACME credits will then
be attributed automatically.
y These authors are co-first authors.* Corresponding author. Tel. + [35_TD$DIFF]1 203 785 5913.E-mail address: [email protected] (J.C. Weinreb).
1. Introduction
Magnetic Resonance Imaging (MRI) has been used for
noninvasive assessment of the prostate gland and sur-
rounding structures since the 1980s. Initially, prostate MRI
was based solely on morphologic assessment using T1-
weighted (T1W) and T2-weighted (T2W) pulse sequences,
http://dx.doi.org/10.1016/j.eururo.2015.08.0520302-2838/# 2015 European Association of Urology. Published by Elsevier
and its role was primarily for locoregional staging in
patients with biopsy proven cancer. However, it provided
limited capability to distinguish benign pathological tissue
and clinically insignificant prostate cancer from significant
cancer.
Advances in technology (both in software and hardware)
have led to the development of multiparametric MRI
B.V. All rights reserved.

E U R O P E A N U R O L O G Y 6 9 ( 2 0 1 6 ) 1 6 – 4 0 17
(mpMRI), which combines anatomic T2W with functional
and physiologic assessment, including diffusion-weighted
imaging (DWI) and its derivative apparent-diffusion coeffi-
cient (ADC) maps, dynamic contrast-enhanced (DCE) MRI,
and sometimes other techniques such as in-vivo MR
proton spectroscopy. These technologic advances, com-
bined with a growing interpreter experience with mpMRI,
have substantially improved diagnostic capabilities for
addressing the central challenges in prostate cancer
care: 1) Improving detection of clinically significant
cancer, which is critical for reducing mortality; and
2) Increasing confidence in benign diseases and dormant
malignancies, which are not likely to cause problems in a
man’s lifetime, in order to reduce unnecessary biopsies
and treatment.
Consequently, clinical applications of prostate MRI have
expanded to include, not only locoregional staging, but also
tumor detection, localization (registration against an ana-
tomical reference), characterization, risk stratification, sur-
veillance, assessment of suspected recurrence, and image
guidance for biopsy, surgery, focal therapy and radiation
therapy.
In 2007, recognizing an important evolving role for
MRI in assessment of prostate cancer, the AdMeTech
Foundation organized the International Prostate MRI
Working Group, which brought together key leaders of
academic research and industry. Based on deliberations
by this group, a research strategy was developed and a
number of critical impediments to the widespread
acceptance and use of MRI were identified. Amongst
these was excessive variation in the performance,
interpretation, and reporting of prostate MRI exams. A
greater level of standardization and consistency was
recommended in order to facilitate multi-center clinical
evaluation and implementation.
In response, the European Society of Urogenital
Radiology (ESUR) drafted guidelines, including a scoring
system, for prostate MRI known as PI-RADSTM version 1
(PI-RADSTM v1). Since it was published in 2012, PI-RADSTM v1
has been validated in certain clinical and research scenarios.
However, experience has also revealed several limita-
tions, in part due to rapid progress in the field. In an effort to
make PI-RADSTM standardization more globally acceptable,
the American College of Radiology (ACR), ESUR and the
AdMeTech Foundation established a Steering Committee to
build upon, update and improve upon the foundation of PI-
RADSTM v1. This effort resulted in the development PI-
RADSTM v2.
PI-RADSTM v2 was developed by members of the PI-RADS
Steering Committee, several working groups with interna-
tional representation, and administrative support from the
ACR using the best available evidence and expert consensus
opinion. It is designed to promote global standardization and
diminish variation in the acquisition, interpretation, and
reporting of prostate mpMRI examinations and it is intended
to be a ‘‘living’’ document that will evolve as clinical
experience and scientific data accrue. PI-RADSTM v2 needs
to be tested and validated for specific research and clinical
applications.
PI-RADSTM v2 is designed to improve detection, locali-
zation, characterization, and risk stratification in patients
with suspected cancer in treatment naıve prostate glands.
The overall objective is to improve outcomes for patients.
The specific aims are to:
� E
stablish minimum acceptable technical parameters forprostate mpMRI
� S
implify and standardize the terminology and content ofradiology reports
� F
acilitate the use of MRI data for targeted biopsy� D
evelop assessment categories that summarize levels ofsuspicion or risk and can be used to select patients for
biopsies and management (e.g., observation strategy vs.
immediate intervention)
� E
nable data collection and outcome monitoring� E
ducate radiologists on prostate MRI reporting andreduce variability in imaging interpretations
� E
nhance interdisciplinary communications with referringclinicians
PI-RADSTM v2 is not a comprehensive prostate cancer
diagnosis document and should be used in conjunction with
other current resources. For example, it does not address the
use of MRI for detection of suspected recurrent prostate
cancer following therapy, progression during surveillance,
or the use of MRI for evaluation of other parts of the body
(e.g. skeletal system) that may be involved with prostate
cancer. Furthermore, it does not elucidate or prescribe
optimal technical parameters; only those that should result
in an acceptable mpMRI examination.
The PI-RADS Steering Committee strongly supports the
continued development of promising MRI methodologies
for assessment of prostate cancer and local staging (e.g.,
nodal metastases) utilizing novel and/or advanced research
tools not included in PI-RADSTM v2, such as in-vivo MR
spectroscopic imaging (MRSI), diffusion tensor imaging
(DTI), diffusional kurtosis imaging (DKI), multiple b-value
assessment of fractional ADC, intravoxel incoherent motion
(IVIM), blood oxygenation level dependent (BOLD) imaging,
intravenous ultra-small superparamagnetic iron oxide
(USPIO) agents, and MR-PET. Consideration will be given
to incorporating them into future versions of PI-RADSTM as
relevant data and experience become available.
2. Section I: Clinical Considerations and Technical
Specifications
2.1. Clinical Considerations
2.1.1. Timing of MRI Following Prostate Biopsy
Hemorrhage, manifested as hyperintense signal on T1W,
may be present in the prostate gland, most commonly the
peripheral zone (PZ) and seminal vesicles, following system-
atic transrectal ultrasound-guided systematic (TRUS) biopsy
and may confound mpMRI assessment. When there is
evidence of hemorrhage in the PZ on MR images, consider-
ation may be given to postponing the MRI examination until a
later date when hemorrhage has resolved. However, this may

E U R O P E A N U R O L O G Y 6 9 ( 2 0 1 6 ) 1 6 – 4 018
not always be feasible or necessary, and clinical practice may
be modified as determined by individual circumstances and
available resources. Furthermore, if the MRI exam is
performed following a negative TRUS biopsy, the likelihood
of clinically significant prostate cancer at the site of post
biopsy hemorrhage without a corresponding suspicious
finding on MRI is low. In this situation, a clinically significant
cancer, if present, is likely to be in a location other than that
with blood products. Thus, the detection of clinically
significant cancer is not likely to be substantially compro-
mised by post biopsy hemorrhage, and there may be no need
to delay MRI after prostate biopsy if the primary purpose of
the exam is to detect and characterize clinically significant
cancer in the gland.
However, post biopsy changes, including hemorrhage
and inflammation, may adversely affect the interpretation of
prostate MRI for staging in some instances. Although these
changes may persist for many months, they tend to diminish
over time, and an interval of at least 6 weeks or longer
between biopsy and MRI should be considered for staging.
2.1.2. Patient Preparation
At present, there is no consensus concerning all patient
preparation issues.
To reduce motion artifact from bowel peristalsis, the use
of an antispasmodic agent (e.g. glucagon, scopolamine
butylbromide, or sublingual hyoscyamine sulfate) may be
beneficial in some patients. However, in many others it is
not necessary, and the incremental cost and potential for
adverse drug reactions should be taken into consideration.
The presence of stool in the rectum may interfere with
placement of an endorectal coil (ERC). If an ERC is not used,
the presence of air and/or stool in the rectum may induce
artifactual distortion that can compromise DWI quality. Thus,
some type of minimal preparation enema administered by
the patient in the hours prior to the exam may be beneficial.
However, an enema may also promote peristalsis, resulting
in increased motion related artifacts in some instances.
The patient should evacuate the rectum, if possible, just
prior to the MRI exam.
If an ERC is not used and the rectum contains air on the
initial MR images, it may be beneficial to perform the
mpMRI exam with the patient in the prone position or to
decompress the rectum using suction through a small
catheter.
Some recommend that patients refrain from ejaculation
for three days prior to the MRI exam in order to maintain
maximum distention of the seminal vesicles. However, a
benefit for assessment of the prostate and seminal vesicles
for clinically significant cancer has not been firmly
established.
2.1.3. Patient Information
The following information should be available to the
radiologist at the time of MRI exam performance and
interpretation:
� R
ecent serum prostate-specific antigen (PSA) level andPSA history
� D
ate and results of prostate biopsy, including number ofcores, locations and Gleason scores of positive biopsies
(with percentage of core involvement when available).
� O
ther relevant clinical history, including digital rectal exam(DRE) findings, medications (particularly in the setting of
hormones/hormone ablation), prior prostate infections,
pelvic surgery, radiation therapy, and family history.
2.2. Technical Specifications
Prostate MRI acquisition protocols should always be
tailored to specific patients, clinical questions, management
options, and MRI equipment, but T2W, DWI, and DCE should
be included in all exams. Unless the MRI exam is monitored
and no findings suspicious for clinically significant prostate
cancer are detected, at least one pulse sequence should use
a field-of-view (FOV) that permits evaluation of pelvic
lymph nodes to the level of the aortic bifurcation. The
supervising radiologist should be cognizant that superflu-
ous or inappropriate sequences unnecessarily increase
exam time and discomfort, and this could negatively impact
patient acceptance and compliance.
The technologist performing the exam and/or supervis-
ing radiologist should monitor the scan for quality control. If
image quality of a pulse sequence is compromised due
to patient motion or other reason, measures should be taken
to rectify the problem and the sequence should be repeated.
2.2.1. Magnetic Field Strength
The fundamental advantage of 3T compared with 1.5T lies
in an increased signal-to-noise ratio (SNR), which theoreti-
cally increases linearly with the static magnetic field. This
may be exploited to increase spatial resolution, temporal
resolution, or both. Depending on the pulse sequence and
specifics of implementation, power deposition, artifacts
related to susceptibility, and signal heterogeneity could
increase at 3T, and techniques that mitigate these concerns
may result in some increase in imaging time and/or decrease
in SNR. However, current state-of-the-art 3T MRI scanners
can successfully address these issues, and most members of
the PI-RADS Steering Committee agree that the advantages
of 3T substantially outweigh these concerns.
There are many other factors that affect image quality
besides magnetic field strength, and both 1.5T and 3.0T can
provide adequate and reliable diagnostic exams when
acquisition parameters are optimized and appropriate
contemporary technology is employed. Although prostate
MRI at both 1.5 T and 3T has been well established, most
members of the PI-RADS Steering Committee prefer, use,
and recommend 3T for prostate MRI. 1.5T should be
considered when a patient has an implanted device that
has been determined to be MR conditional[2_TD$DIFF]. 1.5T may also be
preferred when patients are safe to undergo MRI at 3T, but
the location of an implanted device may result in artifact
that could compromise image quality (e.g., bilateral
metallic hip prosthesis).
The recommendations in this document focus only on 3T
and 1.5T MRI scanners since they have been the ones used
for clinical validation of mpMRI. Prostate mpMRI at lower

E U R O P E A N U R O L O G Y 6 9 ( 2 0 1 6 ) 1 6 – 4 0 19
magnetic field strengths (<1.5T) is not recommended
unless adequate peer reviewed clinical validation becomes
available.
2.2.2. Endorectal Coil (ERC)
When integrated with external (surface) phased array coils,
endorectal coils (ERCs) increase SNR in the prostate at any
magnetic field strength. This may be particularly valuable
for high spatial resolution imaging used in cancer staging
and for inherently lower SNR sequences, such as DWI and
high temporal resolution DCE.
ERCs can also be advantageous for larger patients where
the SNR in the prostate may be compromised using only
external phased array RF coils. However, use of an ERC may
increase the cost and time of the examination, deform the
gland, and introduce artifacts. In addition, it may be
uncomfortable for patients and increase their reluctance
to undergo MRI.
With some 1.5T MRI systems, especially older ones, use of
an ERC is considered indispensable for achieving the type of
high resolution diagnostic quality imaging needed for staging
prostate cancer. At 3T without use of an ERC, image quality
can be comparable with that obtained at 1.5 T with an ERC,
although direct comparison of both strategies for cancer
detection and/or staging is lacking. Importantly, there are
many technical factors other than the use of an ERC that
influence SNR (e.g., receiver bandwidth, coil design, efficiency
of the RF chain), and some contemporary 1.5T scanners that
employ a relatively high number of external phased array coil
elements and RF channels (e.g., 16 or more) may be capable
of achieving adequate SNR in many patients without an ERC.
Credible satisfactory results have been obtained at both
1.5T and 3T without the use of an ERC. Taking these factors
into consideration as well as the variability of MRI
equipment available in clinical use, the PI-RADS Steering
Committee recommends that supervising radiologists [40_TD$DIFF] to
strive to optimize imaging protocols in order to obtain the
best and most consistent image quality possible with the
MRI scanner used. However, cost, availability, patient
preference, and other considerations cannot be ignored.
If air is used to inflate the ERC balloon, it may introduce
local magnetic field inhomogeneity, resulting in distortion
on DWI, especially at 3T. The extent to which artifacts
interfere with MRI interpretation will vary depending on
specific pulse sequence implementations, but they can be
diminished using correct positioning of the ERC and
distention of the balloon with liquids (e.g. liquid perfluoro-
carbon or barium suspension) that will not result in
susceptibility artifacts. When liquid is used for balloon
distention, all air should be carefully removed from the ERC
balloon prior to placement. Solid, rigid reusable ERCs that
avoid the need for inflatable balloons and decrease gland
distortion have been developed.
2.2.3. Computer-Aided Evaluation (CAE) Technology
Computer-aided evaluation (CAE) technology using special-
ized software or a dedicated workstation is not required for
prostate mpMRI interpretation. However, CAE may improve
workflow (display, analysis, interpretation, reporting, and
communication), provide quantitative pharmacodynamic
data, and enhance lesion detection and discrimination
performance for some radiologists, especially those with
less experience interpreting mpMRI exams. CAE can also
facilitate integration of MRI data with some forms of MR
targeted biopsy systems.
3. Section II: Normal Anatomy and Benign Findings
3.1. Normal Anatomy (Figure 1)
From superior to inferior, the prostate consists of the base
(just below the urinary bladder), the midgland, and the
apex. It is divided into four histologic zones: (a) the anterior
fibromuscular stroma, contains no glandular tissue; (b) the
transition zone (TZ), surrounding the urethra proximal to
the verumontanum, contains 5% of the glandular tissue; (c)
the central zone (CZ), surrounding the ejaculatory ducts,
contains about 20% of the glandular tissue; and (d) the outer
peripheral zone (PZ), contains 70%-80% of the glandular
tissue. When benign prostatic hyperplasia (BPH) develops,
the TZ will account for an increasing percentage of the gland
volume.
Approximately 70%-75% of prostate cancers originate in
the PZ and 20%-30% in the TZ. Cancers originating in the CZ
are uncommon, and the cancers that occur in the CZ are
usually secondary to invasion by PZ tumors.
Based on location and differences in signal intensity on
T2W images, the TZ can often be distinguished from the CZ
on MR images. However, in some patients, age-related
expansion of the TZ by BPH may result in compression and
displacement of the CZ. Use of the term ‘‘central gland’’ to
refer to the combination of TZ and CZ is discouraged as it is
not reflective of the zonal anatomy as visualized or reported
on pathologic specimens.
A thin, dark rim partially surrounding the prostate on
T2W is often referred to as the ‘‘prostate capsule.’’ It serves
as an important landmark for assessment of extra prostatic
extension of cancer. In fact, the prostate lacks a true
capsule; rather it contains an outer band of concentric
fibromuscular tissue that is inseparable from prostatic
stroma. It is incomplete anteriorly and apically.
The prostatic pseudocapsule (sometimes referred to as
the ‘‘surgical capsule’’) on T2W MRI is a thin, dark rim at the
interface of the TZ with the PZ. There is no true capsule in
this location at histological evaluation, and this appearance
is due to compressed prostate tissue.
Nerves that supply the corpora cavernosa are intimately
associated with arterial branches from the inferior vesicle
artery and accompanying veins that course posterolateral at
5 and 7 o’clock to the prostate bilaterally, and together they
constitute the neurovascular bundles. At the apex and base,
small nerve branches surround the prostate periphery and
penetrate through the capsule, a potential route for
extraprostatic extension (EPE) of cancer.
3.2. Sector Map (Appendix II)
The segmentation model used in PI-RADSTM v2 was adapted
from a European Consensus Meeting and the ESUR Prostate

[(Fig._1)TD$FIG]
Fig. 1 – Anatomy of the prostate illustrated on T2-weighted [26_TD$DIFF] imaging (modified from Bonekamp D, Jacobs MA, El-Khouli R, et al. Advancements in MRimaging[27_TD$DIFF] of the prostate: from diagnosis to interventions. Radiographics 2011;31(3):677; with permission.).
E U R O P E A N U R O L O G Y 6 9 ( 2 0 1 6 ) 1 6 – 4 020
MRI Guidelines 2012. It employs thirty-nine sectors/regions:
thirty-six for the prostate, two for the seminal vesicles, and
one for the external urethral sphincter. (Appendix II).
Use of the Sector Map will enable radiologists, urologists,
pathologists, and others to localize findings described in MRI
reports, and it will be a valuable visual aid for discussions
with patients about biopsy and treatment options.
Division of the prostate and associated structures into
sectors standardizes reporting and facilitates precise locali-
zation for MR-targeted biopsy and therapy, pathological

E U R O P E A N U R O L O G Y 6 9 ( 2 0 1 6 ) 1 6 – 4 0 21
correlation, and research. Since relationships between tumor
contours, glandular surface of the prostate, and adjacent
structures, such as neurovascular bundles, external urethral
sphincter, and bladder neck, are valuable information for
periprostatic tissue sparing surgery, the Sector Map may also
provide a useful roadmap for surgical dissection at the time of
radical prostatectomy.
Either hardcopy (on paper) or electronic (on computer)
recording on the Sector Map is acceptable.
For information about the use of the Sector Map, see
Section III and Appendix II.
3.3. Benign Findings
Many signal abnormalities within the prostate are benign.
The most common include:
3.3.1. Benign prostatic hyperplasia (BPH)
Benign prostatic hyperplasia (BPH) develops in response to
testosterone, after it is converted to di-hydrotestosterone.
BPH arises in the TZ, although exophytic and extruded BPH
nodules can be found in the PZ. BPH consists of a mixture of
stromal and glandular hyperplasia and may appear as band-
like areas and/or encapsulated round nodules with circum-
scribed margins. Predominantly glandular BPH nodules and
cystic atrophy exhibit moderate-marked T2 hyperintensity
and are distinguished from malignant tumors by their signal
and capsule. Predominantly stromal nodules exhibit T2
hypointensity. Many BPH nodules demonstrate a mixture
of signal intensities. BPH nodules may be highly vascular on
DCE and can demonstrate a range of signal intensities on DWI.
Although BPH is a benign entity, it may have important
clinical implications for biopsy approach and therapy since
it can increase gland volume, stretch the urethra, and
impede the flow of urine. Since BPH tissue produces
prostate-specific antigen (PSA), accurate measurement of
gland volume by MRI is an important metric to allow
correlation with an individual’s PSA level and to calculate
the PSA density (PSA/prostate volume).
3.3.2. Hemorrhage
Hemorrhage in the PZ and/or seminal vesicles is common
after biopsy. It appears as focal or diffuse hyperintense
signal on T1W and iso-hypointense signal on T2W.
However, chronic blood products may appear hypointense
on all MR sequences.
3.3.3. Cysts
A variety of cysts can occur in the prostate and adjacent
structures. As elsewhere in the body, cysts in the prostate
may contain ‘‘simple’’ fluid and appear markedly hyperin-
tense on T2W and dark on T1W. However, they can also
contain blood products or proteinaceous fluid, which may
demonstrate a variety of signal characteristics, including
hyperintense signal on T1W.
3.3.4. Calcifications
Calcifications, if visible, appear as markedly hypointense
foci on all pulse sequences.
3.3.5. Prostatitis
Prostatitis affects many men, although it is often sub-clinical.
Pathologically, it presents as an immune infiltrate, the
character of which depends on the agent causing the
inflammation. On MRI, prostatitis can result in decreased
signal in the PZ on both T2W and the ADC (apparent diffusion
coefficient) map. Prostatitis may also increase perfusion,
resulting in a ‘‘false positive’’ DCE result. However, the
morphology is commonly band-like, wedge-shaped, or
diffuse, rather than focal, round, oval, or irregular, and the
decrease in signal on the ADC map is generally not as great nor
as focal as in cancer.
3.3.6. Atrophy
Prostatic atrophy can occur as a normal part of aging or from
chronic inflammation. It is typically associated with wedge-
shaped areas of low signal on T2W and mildly decreased
signal on the ADC map from loss of glandular tissue. The
ADC is generally not as low as in cancer, and there is often
contour retraction of the involved prostate.
3.3.7. Fibrosis
Prostatic fibrosis can occur after inflammation. It may be
associated with wedge- or band-shaped areas of low signal
on T2W.
4. Section III: Assessment and Reporting
A major objective of a prostate MRI exam is to identify and
localize abnormalities that correspond to clinically signifi-
cant prostate cancer, and mpMRI is able to detect
intermediate to high grade cancers with volumes �0.5cc,
depending on the location and background tissue within
the prostate gland. However, there is no universal
agreement of the definition of clinically significant prostate
cancer.
In PI-RADSTM v2, the definition of clinically significant
cancer is intended to standardize reporting of mpMRI exams
and correlation with pathology for clinical and research
applications. Based on the current uses and capabilities of
mpMRI and MRI-targeted procedures, for PI-RADSTM v2
clinically significant cancer is defined on pathology/histology
as Gleason score �7 (including 3+4 with prominent but not
predominant Gleason 4 component), and/or volume �0.5cc,
and/or extra prostatic extension (EPE).
PI-RADSTM v2 assessment uses a 5-point scale based on
the likelihood (probability) that a combination of mpMRI
findings on T2W, DWI, and DCE correlates with the presence
of a clinically significant cancer for each lesion in the
prostate gland.
PI-RADSTM v2 Assessment Categories
[42_TD$DIFF]PI-RADS 1 – Very low (clinically significant cancer is
highly unlikely to be present)
[42_TD$DIFF]PI-RADS 2 – Low (clinically significant cancer is unlikely
to be present)
[42_TD$DIFF]PI-RADS 3 – Intermediate (the presence of clinically
significant cancer is equivocal)
E U R O P E A N U R O L O G Y 6 9 ( 2 0 1 6 ) 1 6 – 4 022
[42_TD$DIFF]PI-RADS 4 – High (clinically significant cancer is likely to
be present)
[42_TD$DIFF]PI-RADS 5 – Very high (clinically significant cancer is
highly likely to be present)
Assignment of a PI-RADSTM v2 Assessment Category
should be based on mpMRI findings only and should not
incorporate other factors such as serum prostate specific
antigen (PSA), digital rectal exam, clinical history, or choice
of treatment. Although biopsy should be considered for
PIRADS 4 or 5, but not for PIRADS 1 or 2, PI-RADSTM v2 does
not include recommendations for management, as these
must take into account other factors besides the MRI
findings, including laboratory/clinical history and local
preferences, expertise and standards of care. Thus, for
findings with PIRADS Assessment Category 2 or 3, biopsy
may or may not be appropriate, depending on factors other
than mpMRI alone.
It is anticipated that, as evidence continues to accrue in
the field of mpMRI and MRI-targeted biopsies and inter-
ventions, specific recommendations and/or algorithms
regarding biopsy and management will be included in
future versions of PI-RADSTM.
When T2W and DWI are of diagnostic quality, DCE plays
a minor role in determining PIRADS Assessment Category.
Absence of early enhancement within a lesion usually adds
little information, and diffuse enhancement not localized to
a specific T2W or DWI abnormality can be seen in the
setting of prostatitis. Moreover, DCE does not contribute to
the overall assessment when the finding has a low (PIRADS
1 or 2) or high (PIRADS 4 or 5) likelihood of clinically
significant cancer. However, when DWI is PIRADS 3 in the
PZ, a positive DCE may increase the likelihood that the
finding corresponds to a clinically significant cancer and
may upgrade the Assessment Category to PIRADS [43_TD$DIFF]4
([44_TD$DIFF]Table 1) [45_TD$DIFF]. Likewise when T2W [46_TD$DIFF]is [47_TD$DIFF]PIRADS [48_TD$DIFF]3 [49_TD$DIFF]in the TZ[50_TD$DIFF], DWI[51_TD$DIFF]
Table 1 – PI-RADS Assessment Category for the peripheral zone(PZ)
DWI T2W DCE PI-RADS
1 Any* Any 1
2 Any Any 2
3 Any – 3
+ 4
4 Any Any 4
5 Any Any 5
* ‘‘Any’’ indicates 1-5
Table 2 – PI-RADS Assessment Category for the transition zone (TZ)
T2W DWI DCE PI-RADS
1 Any* Any 1
2 Any Any 2
3 �4 Any 3
5 Any 4
4 Any Any 4
5 Any Any 5
* ‘‘Any’’ indicates 1-5
may increase the likelihood that the finding corresponds to
a clinically significant cancer and may upgrade the
Assessment Category to PIRADS 4 [52_TD$DIFF](Table [53_TD$DIFF]2).
4.1. Reporting (see Appendix I: Report Templates)
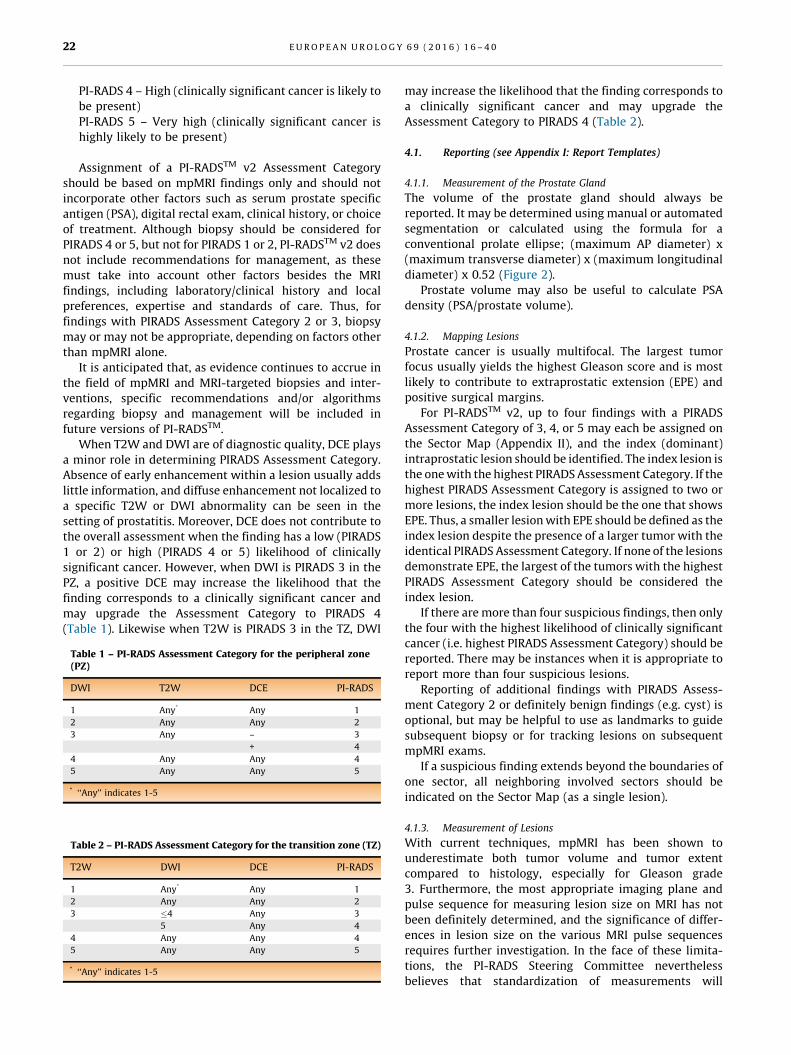
4.1.1. Measurement of the Prostate Gland
The volume of the prostate gland should always be
reported. It may be determined using manual or automated
segmentation or calculated using the formula for a
conventional prolate ellipse; (maximum AP diameter) x
(maximum transverse diameter) x (maximum longitudinal
diameter) x 0.52 (Figure 2).
Prostate volume may also be useful to calculate PSA
density (PSA/prostate volume).
4.1.2. Mapping Lesions
Prostate cancer is usually multifocal. The largest tumor
focus usually yields the highest Gleason score and is most
likely to contribute to extraprostatic extension (EPE) and
positive surgical margins.
For PI-RADSTM v2, up to four findings with a PIRADS
Assessment Category of 3, 4, or 5 may each be assigned on
the Sector Map (Appendix II), and the index (dominant)
intraprostatic lesion should be identified. The index lesion is
the one with the highest PIRADS Assessment Category. If the
highest PIRADS Assessment Category is assigned to two or
more lesions, the index lesion should be the one that shows
EPE. Thus, a smaller lesion with EPE should be defined as the
index lesion despite the presence of a larger tumor with the
identical PIRADS Assessment Category. If none of the lesions
demonstrate EPE, the largest of the tumors with the highest
PIRADS Assessment Category should be considered the
index lesion.
If there are more than four suspicious findings, then only
the four with the highest likelihood of clinically significant
cancer (i.e. highest PIRADS Assessment Category) should be
reported. There may be instances when it is appropriate to
report more than four suspicious lesions.
Reporting of additional findings with PIRADS Assess-
ment Category 2 or definitely benign findings (e.g. cyst) is
optional, but may be helpful to use as landmarks to guide
subsequent biopsy or for tracking lesions on subsequent
mpMRI exams.
If a suspicious finding extends beyond the boundaries of
one sector, all neighboring involved sectors should be
indicated on the Sector Map (as a single lesion).
4.1.3. Measurement of Lesions
With current techniques, mpMRI has been shown to
underestimate both tumor volume and tumor extent
compared to histology, especially for Gleason grade
3. Furthermore, the most appropriate imaging plane and
pulse sequence for measuring lesion size on MRI has not
been definitely determined, and the significance of differ-
ences in lesion size on the various MRI pulse sequences
requires further investigation. In the face of these limita-
tions, the PI-RADS Steering Committee nevertheless
believes that standardization of measurements will
[(Fig._2)TD$FIG]
Fig. 2 – Measurements of the prostate on T2-weighted images used for volume assessment with the prolate ellipsoid formula (length T width T heightT 0.52).
E U R O P E A N U R O L O G Y 6 9 ( 2 0 1 6 ) 1 6 – 4 0 23
facilitate MR-pathological correlation and research and
recommends that the following rules be used for measure-
ments.
The minimum requirement is to report the largest
dimension of a suspicious finding on an axial image. If the
largest dimension of a suspicious finding is on sagittal and/
or coronal images, this measurement and imaging plane
should also be reported. If a lesion is not clearly delineated
on an axial image, report the measurement on the image
which best depicts the finding.
Alternatively, if preferred, lesion volume may be deter-
mined using appropriate software, or three dimensions of
lesions may be measured so that lesion volume may be
calculated ([55_TD$DIFF]maximum [56_TD$DIFF]AP diameter[57_TD$DIFF]) � (maximum [58_TD$DIFF]transverse
diameter[57_TD$DIFF]) � (maximum [59_TD$DIFF]cranio-[59_TD$DIFF]caudal diameter[6_TD$DIFF]) [60_TD$DIFF]� 0.52.
In the PZ, lesions should be measured on ADC. In the TZ,
lesions should be measured on T2W.
If lesion measurement is difficult or compromised on
ADC (for PZ) or T2W (for TZ), measurement should be made
on the sequence that shows the lesion best.
In the mpMRI report, the image number(s)/series and
sequence used for measurement should be indicated.
4.2. Caveats for Overall Assessment
� I
n order to facilitate correlation and synchronizedscrolling when viewing, it is strongly recommended that
imaging plane angle, location, and slice thickness for all
sequences (T2W, DWI, and DCE) are identical.
� C
hanges from prostatitis (including granulomatous pros-tatitis) can cause signal abnormalities in the PZ with all
pulse sequences. Morphology and signal intensity may be
helpful to stratify the likelihood of malignancy. In the PZ,
mild signal changes on T2W and/or DWI that are not
rounded but rather indistinct, linear, lobar, or diffuse are
less likely to be malignant.
� F
or the PZ, DWI is the primary determining sequence(dominant technique). Thus, if the DWI score is 4 and
T2W score is 2, PIRADS Assessment Category should be [61_TD$DIFF]4
(Table 1).
� F
or the TZ, T2W is the primary determining sequence.Thus, if the T2W score is 4 and DWI score is 2, PIRADS
Assessment Category should be [61_TD$DIFF]4 (Table 2).
� S
ince the dominant factors for PIRADS assessment areT2W for the TZ and DWI for the PZ, identification of
the zonal location of a lesion is vital. Areas where this may
be especially problematic include the interface of the CZ
and PZ at the base of the gland and the interface of the
anterior horn of the PZ with TZ and anterior fibromus-
cular stroma.
� C
urrently, the capability of reliably detecting andcharacterizing clinically significant prostate cancer with
mpMRI in the TZ is less than that in the PZ.
� H
omogeneous or heterogeneous nodules in the TZ thatare round/oval, well- circumscribed, and encapsulated
are common findings [62_TD$DIFF]in men aged 40 and above. Often,
they demonstrate restricted diffusion and/or focal con-
trast enhancement, but they are considered to be benign
BPH. These do not have to be assigned a PIRADS
Assessment Category. Although such nodules may on
occasion contain clinically significant prostate cancer, the
probability is very low.
� B
ilateral symmetric signal abnormalities on any sequenceare often due to normal anatomy or benign changes.
� If
a component of the mpMRI exam (T2W, DWI, DCE) istechnically inadequate or was not performed, it should be
assigned PIRADS Assessment Category ‘‘X’’ for that
component [63_TD$DIFF] (Tables 3 and 4). This occurs most commonly
T
1
2
3
4
5
[(Fig._3)TD$FIG]
E U R O P E A N U R O L O G Y 6 9 ( 2 0 1 6 ) 1 6 – 4 024
with DWI. Since DWI is often crucial for diagnosis of
clinically significant cancers in the PZ, inadequate or
absent DWI data should usually prompt repeat of this
component of the mpMRI examination if the cause of
failure can be remedied. If this is not possible, assessment
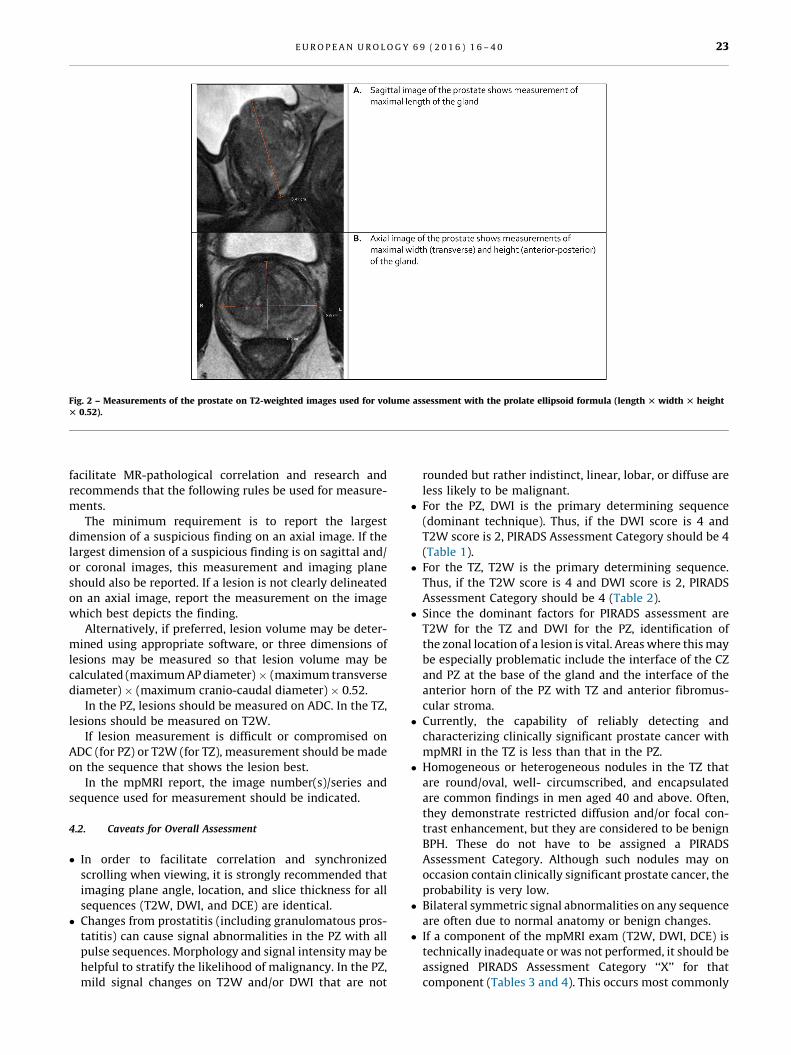
Table 3 – PI-RADS Assessment Category Without Adequate DWI forPZ and TZ
2W DWI DCE PI-RADS
X Any 1
X Any 2
X – 3
+ 4
X Any 4
X Any 5
T
1
2
3
4
5
Fig. 3 – PI-RADS assessment for periphera
may be accomplished with the other pulse sequences that
were obtained using the tables below. However, this is a
serious limitation, and it should be clearly acknowledged
in the exam report, even if it applies to only one area of
the prostate gland.
Table 4 – PI-RADS Assessment Category Without Adequate DCE forTZ
2W DWI DCE PI-RADS
Any X 1
Any X 2
�4 X 3
5 X 4
Any X 4
Any X 5
l zone on T2-weighted imaging.

E U R O P E A N U R O L O G Y 6 9 ( 2 0 1 6 ) 1 6 – 4 0 25
[7_TD$DIFF]If both DWI and DCE are inadequate or absent, assess-
ment should be limited to staging for determination of EPE.
5. Section IV: Multiparametric MRI (mpMRI)
5.1. T1-Weighted (T1W) and T2-Weighted (T2W)
Both T1W and T2W sequences should be obtained for all
prostate MR exams. T1W images are used primarily to
determine the presence of hemorrhage within the prostate
and seminal vesicles and to delineate the outline of the gland.
T1W images may also useful for detection of nodal and
skeletal metastases, especially following intravenous admin-
istration of a gadolinium-based contrast agent (GBCA).
[(Fig._4)TD$FIG]
Fig. 4 – PI-RADS assessment for transit
T2W images are used to discern prostatic zonal anatomy,
assess abnormalities within the gland, and to evaluate for
seminal vesicle invasion, EPE, and nodal involvement.
On T2W images, clinically significant cancers in the PZ
(Figure 3) usually appear as round or ill- defined hypointense
focal lesions. However, this appearance is not specific and can
be seen in various conditions such as prostatitis, hemorrhage,
glandular atrophy, benign hyperplasia, biopsy related scars,
and after therapy (hormone, ablation, etc.).
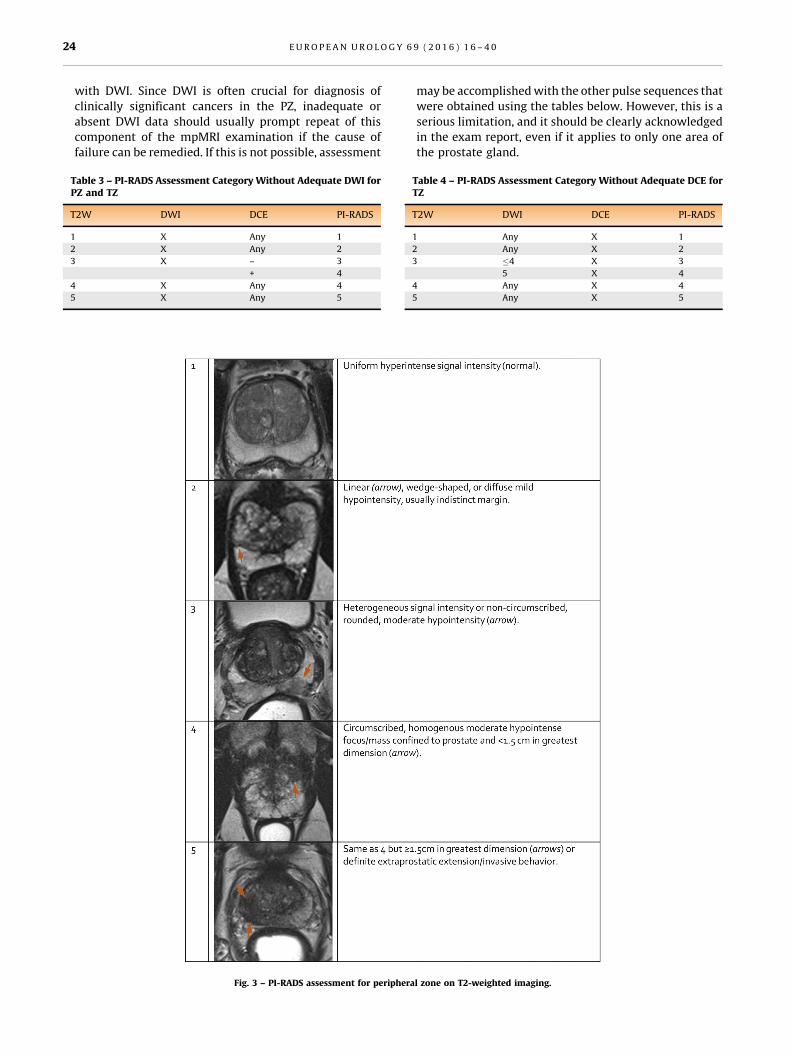
The T2W features of TZ tumors (Figure 4) include non-
circumscribed homogeneous, moderately hypointense
lesions (‘‘erased charcoal’’ or ‘‘smudgy fingerprint’’ appear-
ance), spiculated margins, lenticular shape, absence of a
complete hypointense capsule, and invasion of the urethral
sphincter and anterior fibromuscular stroma. The more
ion zone on T2-weighted imaging.

Table 6 – PI-RADS Assessment for T2W for TZ
Score Transition Zone (TZ)
1 Homogeneous intermediate signal intensity (normal)
2 Circumscribed hypointense or heterogeneous encapsulated
nodule(s) (BPH)
3 Heterogeneous signal intensity with obscured margins
Includes others that do not qualify as 2, 4, or 5
4 Lenticular or non-circumscribed, homogeneous, moderately
hypointense, and <1.5 cm in greatest dimension
5 Same as 4, but �1.5 cm in greatest dimension or definite
extraprostatic extension/invasive behavior
E U R O P E A N U R O L O G Y 6 9 ( 2 0 1 6 ) 1 6 – 4 026
features present, the higher the likelihood of a clinically
significant TZ cancer.
TZ cancers may be difficult to identify on T2W images
since the TZ is often composed of variable amounts of
glandular (T2-hyperintense) and stromal (T2-hypointense)
tissue intermixed with each other, thus demonstrating
heterogeneous signal intensity. Areas where benign stromal
elements predominate may mimic or obscure clinically
significant cancer.
Both PZ and TZ cancers may extend across anatomical
boundaries. Invasive behavior is noted when there is
extension within the gland (i.e. across regional parts of
the prostate), into the seminal vesicles, or outside the gland
(EPE).
5.1.1. Technical Specifications
5.1.1.1. T2W. Multiplanar (axial, coronal, and sagittal) T2W
images are usually obtained with 2D RARE (rapid acquisi-
tion with relaxation enhancement) pulse sequences, more
commonly known as fast-spin-echo (FSE) or turbo-spin-
echo (TSE). In order to avoid blurring, excessive echo train
lengths should be avoided.
� S
S
1
2
3
4
5
lice thickness: 3 mm, no gap. Locations should be the
same as those used for DWI and DCE
� F
OV: generally 12-20 cm to encompass the entireprostate gland and seminal vesicles
� In
plane dimension: �0.7 mm (phase) � �0.4 mm(frequency)
3D axial acquisitions may be used as an adjunct to 2D
acquisitions. If acquired using isotropic voxels, 3D acquisi-
tions may be particularly useful for visualizing detailed
anatomy and distinguishing between genuine lesions and
partial volume averaging effects. However, the soft tissue
contrast is not identical and in some cases may be inferior to
that seen on 2D T2W images, and the in-plane resolution
may be lower than their 2D counterpart.
5.1.1.2. T1W. Axial T1W images of the prostate may be
obtained with or without fat suppression using spin echo or
gradient echo sequences. Locations should be the same as
those used for DWI and DCE, although lower spatial
resolution compared to T2W may be used to decrease
acquisition time or increase anatomic coverage.
5.1.2. PI-RADS Assessment for T2W[8_TD$DIFF] ( [64_TD$DIFF]Tables 5[9_TD$DIFF] and [65_TD$DIFF]6)
Table 5 – PI-RADS Assessment for T2W for PZ
core Peripheral Zone (PZ)
Uniform hyperintense signal intensity (normal)
Linear or wedge-shaped hypointensity or diffuse mild
hypointensity, usually indistinct margin
Heterogeneous signal intensity or non-circumscribed, rounded,
moderate hypointensity
Includes others that do not qualify as 2, 4, or 5
Circumscribed, homogenous moderate hypointense
focus/mass confined to prostate and <1.5 cm in greatest dimension
Same as 4 but �1.5 cm in greatest dimension or definite extra
prostatic extension/invasive behavior
5.2. Diffusion-Weighted Imaging (DWI)
Diffusion-weighted imaging (DWI) reflects the random
motion of water molecules and is a key component of the
prostate mpMRI exam. It should include an ADC map and
high b-value images.
The ADC map is a display of ADC values for each voxel in
an image. In most current clinical implementations, it uses
two or more b-values and a monoexponential model of
signal decay with increasing b-values to calculate ADC
values. Most clinically significant cancers have restricted/
impeded diffusion compared to normal tissues and, thus,
appear hypointense on grey-scale ADC maps. Although ADC
values have been reported to correlate inversely with
histologic grades, there is considerable overlap between
BPH, low grade cancers, and high grade cancers. Further-
more, ADC calculations are influenced by choice of b-values
and have been inconsistent across vendors. Thus, qualita-
tive visual assessment is often used as the primary method
to assess ADC. Nevertheless, ADC values, using a threshold
of 750-900 mm2/sec, may assist differentiation between
benign and malignant prostate tissues in the PZ, with ADC
values below the threshold correlating with clinically
significant cancers.
‘‘High b-value’’ images utilize a b-value between
�1400sec/mm2. They display preservation of signal in
areas of restricted/impeded diffusion compared with
normal tissues, which demonstrate diminished signal due
to greater diffusion between applications of gradients with
different b-values. Compared to ADC maps alone, conspi-
cuity of clinically significant cancers is sometimes improved
on high b-value images, especially in those adjacent to or
invading the anterior fibromuscular stroma, in a subcapsu-
lar location, and at the apex and base of the gland. High b-
value images can be obtained in one of two ways: either
directly by acquiring a high b-value DWI sequence
(requiring additional scan time), or by calculating (synthe-
sizing) the high b-value image by extrapolation from the
acquired lower b-value data used to create the ADC map
(potentially less prone to artifacts because it avoids the
longer TEs required to accommodate the strong gradient
pulses needed for high b-value acquisitions). As the b-value
increases, the signal-to-noise ratio (SNR) decreases, so that
the optimum high b- value may be dependent on magnetic
field strength, software, and manufacturer. Thus, there is no
currently widely accepted optimal ‘‘high b-value’’, but if
adequate SNR permits, b-values of 1400-2000sec/mm2 or
higher seem to be advantageous.
E U R O P E A N U R O L O G Y 6 9 ( 2 0 1 6 ) 1 6 – 4 0 27
5.2.1. Technical Specifications
Free-breathing spin echo EPI sequence combined with
spectral fat saturation is recommended.
�
[(Fig._5)TD$FIG]
TE: �90 msec; TR: �3 000 msec
� S
lice thickness: �4 mm, no gap. Locations should matchor be similar to those used for T2W and DCE
� F
OV: 16-22 cm� I
n plane dimension: �2.5 mm phase and frequencyFor ADC maps, if only two b-values can be acquired due
to time or scanner constraints, it is preferred that the lowest
Fig. 5 – PI-RADS assessment for periphera
b-value should be set at 50-100 sec/mm2 and the highest
should be 800-1000sec/mm2. Additional b-values between
100 and 1000 may provide more accurate ADC calculations
and estimations of extrapolated high b-value images
(>1400sec/mm2).
Information regarding perfusion characteristics of tis-
sues may be obtained with additional b-values ranging from
0 to 500 sec/mm2,
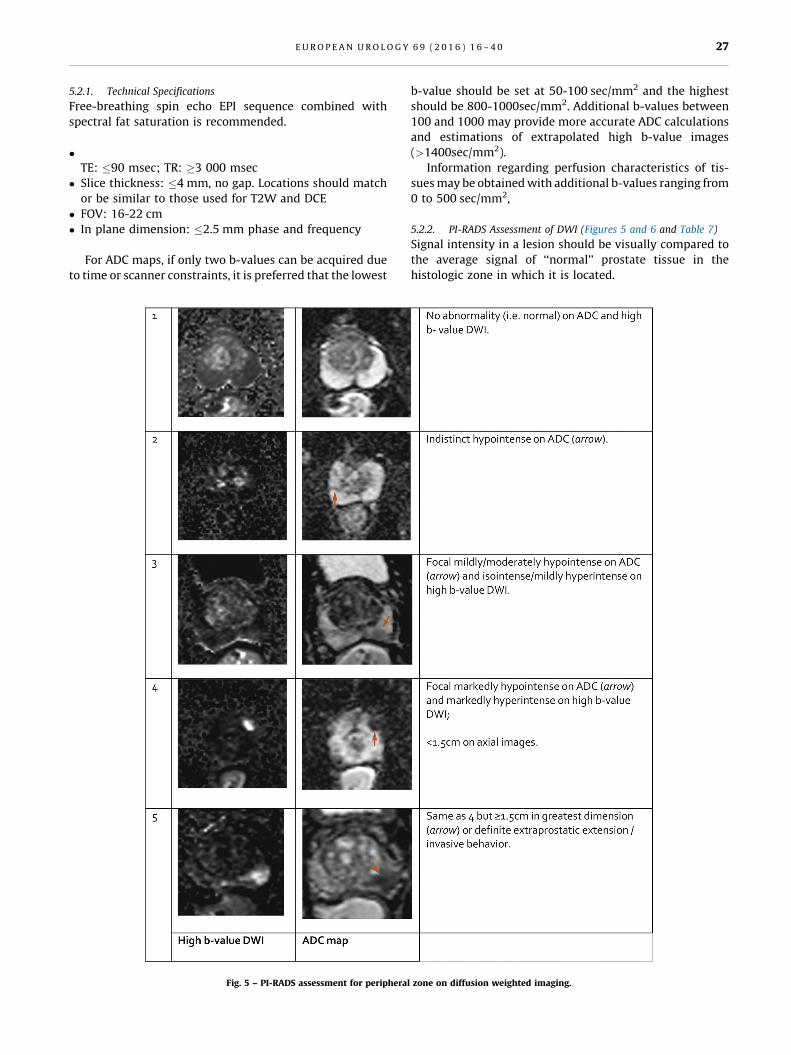
5.2.2. PI-RADS Assessment of DWI (Figures 5 and 6 [67_TD$DIFF] and Table 7)
Signal intensity in a lesion should be visually compared to
the average signal of ‘‘normal’’ prostate tissue in the
histologic zone in which it is located.
l zone on diffusion weighted imaging.
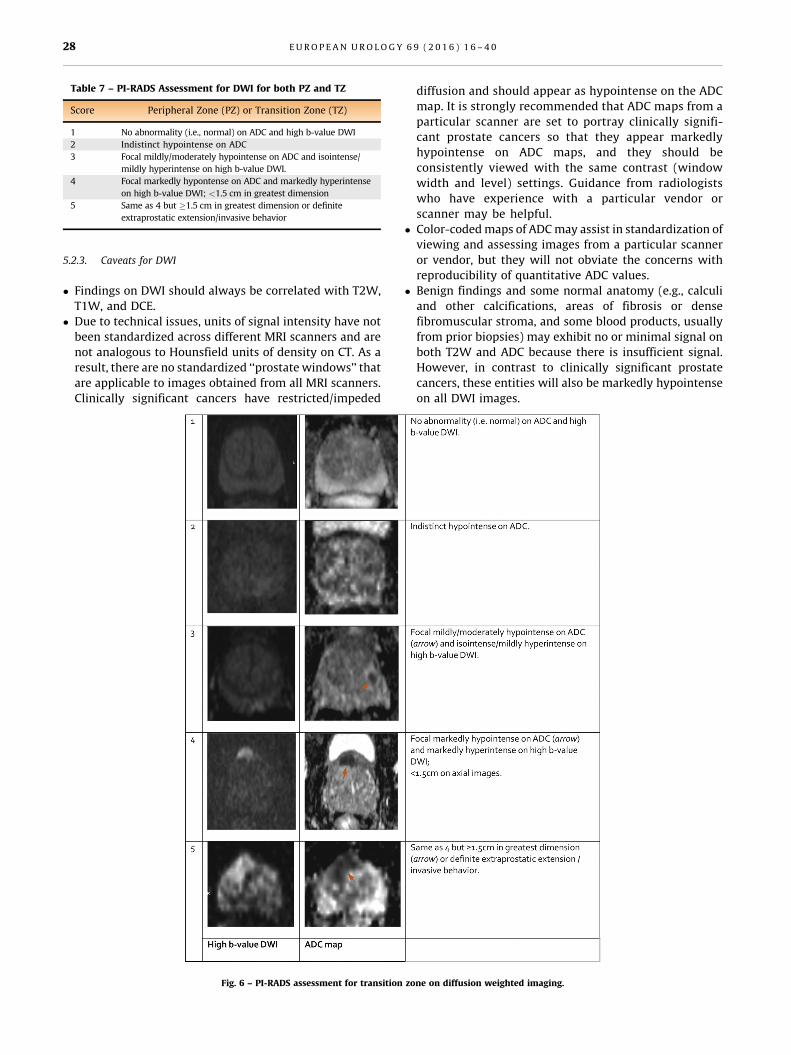
Table 7 – PI-RADS Assessment for DWI for both PZ and TZ
Score Peripheral Zone (PZ) or Transition Zone (TZ)
1 No abnormality (i.e., normal) on ADC and high b-value DWI
2 Indistinct hypointense on ADC
3 Focal mildly/moderately hypointense on ADC and isointense/
mildly hyperintense on high b-value DWI.
[29_TD$DIFF]4 Focal markedly hypontense on ADC and markedly hyperintense
on high b-value DWI; <1.5 cm in greatest dimension
5 Same as 4 but �1.5 cm in greatest dimension or definite
extraprostatic extension/invasive behavior
E U R O P E A N U R O L O G Y 6 9 ( 2 0 1 6 ) 1 6 – 4 028
5.2.3. Caveats for DWI
� F
[(Fig._6)TD$FIG]
indings on DWI should always be correlated with T2W,
T1W, and DCE.
� D
ue to technical issues, units of signal intensity have notbeen standardized across different MRI scanners and are
not analogous to Hounsfield units of density on CT. As a
result, there are no standardized ‘‘prostate windows’’ that
are applicable to images obtained from all MRI scanners.
Clinically significant cancers have restricted/impeded
Fig. 6 – PI-RADS assessment for transition zo
diffusion and should appear as hypointense on the ADC
map. It is strongly recommended that ADC maps from a
particular scanner are set to portray clinically signifi-
cant prostate cancers so that they appear markedly
hypointense on ADC maps, and they should be
consistently viewed with the same contrast (window
width and level) settings. Guidance from radiologists
who have experience with a particular vendor or
scanner may be helpful.
� C
olor-coded maps of ADC may assist in standardization ofviewing and assessing images from a particular scanner
or vendor, but they will not obviate the concerns with
reproducibility of quantitative ADC values.
� B
enign findings and some normal anatomy (e.g., calculiand other calcifications, areas of fibrosis or dense
fibromuscular stroma, and some blood products, usually
from prior biopsies) may exhibit no or minimal signal on
both T2W and ADC because there is insufficient signal.
However, in contrast to clinically significant prostate
cancers, these entities will also be markedly hypointense
on all DWI images.
ne on diffusion weighted imaging.

E U R O P E A N U R O L O G Y 6 9 ( 2 0 1 6 ) 1 6 – 4 0 29
� S
ome BPH nodules in the TZ are not clearly encapsulated,and they may exhibit hypointensity on ADC maps and
hyperintensity on high b-value DWI. Although morpho-
logic features may assist assessment in some cases, this is
currently a recognized limitation of mpMRI diagnosis.
� A
n encapsulated, circumscribed, round nodule in the PZ islikely an extruded BPH nodule, even if it is hypointense on
ADC. PIRADS Assessment Category for this finding should
be 2.
5.3. Dynamic Contrast-Enhanced (DCE) MRI
DCE MRI is defined as the acquisition of rapid T1W gradient
echo scans before, during and after the intravenous
administration of a low molecular weight gadolinium-
based contrast agent (GBCA). As with many other malig-
nancies following bolus injection of a GBCA, prostate
cancers often demonstrate early enhancement compared
to normal tissue. However, the actual kinetics of prostate
cancer enhancement are quite variable and heterogeneous.[(Fig._7)TD$FIG]
Fig. 7 – PI-RADS assessment for dy
Some malignant tumors demonstrate early washout, while
others retain contrast longer. Furthermore, enhancement
alone is not definitive for clinically significant prostate
cancer, and absence of early enhancement does not exclude
the possibility.
DCE should be included in all prostate mpMRI exams so
as not to miss some small significant cancers. The DCE data
should always be closely inspected for focal early enhance-
ment. If found, then the corresponding T2W and DWI
images should be carefully interrogated for a corresponding
abnormality. At present, the added value DCE is not firmly
established, and most published data show that the added
value of DCE over and above the combination of T2W and
DWI is modest. Thus, although DCE is an essential
component of the mpMRI prostate examination, its role
in determination of PI-RADSTM v2 Assessment Category is
secondary to T2W and DWI.
DCE is positive (Figure 7) when there is enhancement that
is focal, earlier or contemporaneous with enhancement of
adjacent normal prostatic tissues, and usually corresponds to
namic contrast enhanced MRI.

Table 8 – PI-RADS Assessment for DCE
Score Peripheral Zone (PZ) or Transition Zone (TZ)
(�) no early enhancement, or diffuse enhancement not corresponding
to a focal finding on T2W and/or DWI or focal enhancement
corresponding to a lesion demonstrating features of BPH on T2W
(+) focal, and; earlier than or contemporaneously with enhancement
of adjacent normal prostatic tissues, and corresponds to suspicious
finding on T2W and/or DWI
E U R O P E A N U R O L O G Y 6 9 ( 2 0 1 6 ) 1 6 – 4 030
a suspicious finding on T2W and/or DWI. Positive enhance-
ment in a lesion usually occurs within 10 seconds of the
appearance of the injected GBCA in the femoral arteries
(depending on temporal resolution used to acquire the
images, injection rate, cardiac output, and other factors).
The most widely available method of analyzing DCE is
direct visual assessment of the individual DCE time-points
at each slice location by either manually scrolling or using
cine mode. Visual assessment of enhancement may be
improved with fat suppression or subtraction techniques
(especially in the presence of blood products that are
hyperintense on pre-contrast enhanced T1W). Visual
assessment of enhancement may also be assisted with a
parametric map which color-codes enhancement features
within a voxel (e.g., slope and peak). However, any
suspicious finding on subtracted images or a parametric
map should always be confirmed on the source images.
Considerable effort has gone into ‘‘curve typing’’ (i.e.,
plotting the kinetics of a lesion as a function of signal vs.
time). However, there is great heterogeneity in enhance-
ment characteristics of prostate cancers, and at present
there is little evidence in the literature to support the use of
specific curve types. Another approach is the use of
compartmental pharmacokinetic modeling, which incorpo-
rates contrast media concentration rather than raw signal
intensity and an arterial input function to calculate time
constants for the rate of contrast agent wash-in (Ktrans) and
wash-out (kep). Commercial software programs are avail-
able that produce ‘‘maps’’ of Ktrans and keep and may
improve lesion conspicuity. Although pharmacodynamic
(PD) analysis may provide valuable insights into tumor
behavior and biomarker measurements for drug develop-
ment, the PI-RADS Steering Committee believes there is
currently insufficient peer reviewed published data or
expert consensus to support routine adoption of this
method of analysis for clinical use.
Thus, for PI-RADSTM v2, a ‘‘positive’’ DCE MRI lesion is
one where the enhancement is focal, earlier or contempo-
raneous with enhancement of adjacent normal prostatic
tissues, and corresponds to a finding on T2W and/or DWI. In
the TZ, BPH nodules frequently enhance early, but they
usually exhibit a characteristic benign morphology (round
shape, well circumscribed). A ‘‘negative’’ DCE MRI lesion is
one that either does not enhance early compared to
surrounding prostate or
enhances diffusely so that the margins of the enhancing
area do not correspond to a finding on T2W and/or DWI.
5.3.1. Technical Specifications
DCE is generally carried out for several minutes to assess the
enhancement characteristics. In order to detect early
enhancing lesions in comparison to background prostatic
tissue, temporal resolution should be <10 seconds and
preferably <7 seconds per acquisition in order to depict
focal early enhancement. Fat suppression and/or subtrac-
tions are recommended.
� A
lthough either a 2D or 3D T1 gradient echo (GRE)sequence may be used, 3D is preferred.
� T
R/TE: <100msec/ <5msec� S
lice thickness: 3 mm, no gap. Locations should be thesame as those used for DWI and DCE.
� F
OV: encompass the entire prostate gland and seminalvesicles
� In
plane dimension: �2 mm X �2 mm� T
emporal resolution: �15 sec (<7 sec is preferred)� T
otal observation rate: �2 min� D
ose: 0.1mmol/kg standard GBCA or equivalent highrelativity GBCA
Injection rate: 2-3cc/sec starting with continuous image
data acquisition (should be the same for all exams)
5.3.2. PI-RADS Assessment for DCE [73_TD$DIFF]([74_TD$DIFF]Table [75_TD$DIFF]8)
5.3.2.1. Caveats for DCE.
� D
CE should always be interpreted with T2W and DWI;Focal enhancement in clinically significant cancer usually
corresponds to focal findings on T2W and/or DWI.
� D
CE may be helpful when evaluation of DWI in part or allof the prostate is technically compromised (i.e., Assess-
ment Category X) and when prioritizing multiple lesions in
the same patient (e.g., all other factors being equal, the
largest DCE positive lesion may be considered the index
lesion).
� D
iffusely positive DCE is usually attributed to inflamma-tion (e.g., prostatitis). Although infiltrating cancers may
also demonstrate diffuse enhancement, these are uncom-
mon and usually demonstrate an abnormality on the
corresponding T2W and/or DWI.
� T
here are instances where histologically sparse prostatecancers are intermixed with benign prostatic tissues. They
may be occult on T2W and DWI, and anecdotally may
occasionally be apparent only on DCE. However, these are
usually lower grade tumors, and the enhancement might,
in some cases, be due to concurrent prostatitis.
6. Section V: Staging
MRI is useful for determination of the T stage, either
confined to the gland (<T2 disease) or extending beyond the
gland (>T3 disease).
The apex of the prostate should be carefully inspected.
When cancer involves the external urethral sphincter, there
is surgical risk of cutting the sphincter, resulting in
compromise of urinary competence. Tumor in this region
may also have implications for radiation therapy.

E U R O P E A N U R O L O G Y 6 9 ( 2 0 1 6 ) 1 6 – 4 0 31
High spatial resolution T2W imaging is required for
accurate assessment of extraprostatic extension (EPE),
which includes assessment of neurovascular bundle in-
volvement and seminal vesicle invasion. These may be
supplemented by high spatial resolution contrast-enhanced
fat suppressed T1W.
The features of seminal vesicle invasion include focal or
diffuse low T2W signal intensity and/or abnormal contrast
enhancement within and/or along the seminal vesicle,
restricted diffusion, obliteration of the angle between the
base of the prostate and the seminal vesicle, and
demonstration of direct tumor extension from the base of
the prostate into and around the seminal vesicle.
Imaging features used to assess for EPE include
asymmetry or invasion of the neurovascular bundles, a
bulging prostatic contour, an irregular or spiculated margin,
obliteration of the rectoprostatic angle, a tumor-capsule
interface of greater than 1.0 cm, breach of the capsule with
evidence of direct tumor extension or bladder wall invasion.
The next level of analysis is that of the pelvic and
retroperitoneal lymph nodes. The detection of abnormal
lymph nodes on MRI is currently limited to size, morpholo-
gy and shape, and enhancement pattern. In general, lymph
nodes over 8 mm in short axis dimension are regarded as
suspicious, although lymph nodes that harbor metastases
are not always enlarged. Nodal groups that should be
evaluated include: common femoral, obturator, external
iliac, internal iliac, common iliac, pararectal, presacral,
paracaval, and para-aortic to the level of the aortic
bifurcation.
Images should be assessed for the presence of skeletal
metastases.
Acknowledgements:
Administration
Mythreyi Chatfield
American College of Radiology, RestonSteering Committee
Jeffrey C. Weinreb:
Co-Chair
Yale School of Medicine, New Haven
Jelle O. Barentsz:
Co-Chair
Radboudumc, Nijmegen
Peter L. Choyke
National Institutes of Health, BethesdaFrancois Cornud
Rene Descartes University, ParisMasoom A. Haider
University of Toronto, SunnybrookHealth Sciences Ctr
Katarzyna J. Macura
Johns Hopkins University, BaltimoreDaniel Margolis
University of California, Los AngelesMitchell D. Schnall
University of Pennsylvania,Philadelphia
Faina Shtern
AdMeTech Foundation, BostonClare M. Tempany
Harvard University, BostonHarriet C. Thoeny
University Hospital of BernSadna Verma
University of CincinnatiWorking Groups:
T1 and T2
Clare Tempany: Chair
Robert Mulkern
Harvard University, BostonBaris Turkbey
National Institutes of Health, BethesdaAlexander Kagan
Mount Sinai Beth Israel Hospital, NewYork
Alberto Vargas
Memorial Sloan Kettering Hospital,New York
DCE
Pete Choyke: Chair-DCE
Aytekin Oto
University of ChicagoMasoom A. Haider
University of Toronto, SunnybrookHealth Sciences Ctr
Francois Cornud
Rene Descartes University, ParisFiona Fennessey
Harvard University, BostonSadna Verma
University of CincinnatiPete Choyke
National Institutes of Health, BethesdaJurgen Futterer
Radboudumc, NijmegenDWI
Francois Cornud: Chair
Anwar Padhani
Mount Vernon Cancer Centre,Middlesex
Daniel Margolis
University of California, Los AngelesAytekin Oto
University of ChicagoHarriet C. Thoeny
University Hospital of BernSadna Verma
University of CincinnatiPeter Choyke
National Institutes of Health, BethesdaJelle Barentsz
Radboudumc, NijmegenMasoom A. Haider
University of Toronto, SunnybrookHealth Sciences Ctr
Clare M. Tempany
Harvard University, BostonGeert Villeirs
Ghent University HospitalBaris Turkbey
National Institutes of Health, BethesdaSector Diagram
David A. Rini J
Johns Hopkins UniversityOther Reviewers/
Contributors ESUR
Alex Kirkham
University College London HospitalsClare Allen
University College London HospitalsNicolas Grenier
University BoordeauxValeria Panebianco
Sapienza University of RomeGeert Villeirs
Ghent University HospitalMark Emberton
University College London HospitalsJonathan Richenberg
The Montefiore Hospital, BrightonPhillippe Puech
Lille University School of MedicineUSA
Martin Cohen
Rolling Oaks Radiology, CaliforniaJohn Feller
Desert Medical Imaging, Indian Wells,Ca
Daniel Cornfeld
Yale School of Medicine, New HavenArt Rastinehad
Mount Sinai School of MedicineJohn Leyendecker
University of Texas SouthwesternMedical Center, Dallas
Ivan Pedrosa
University of Texas SouthwesternMedical Center, Dallas
Andrei Puryska
Cleveland ClinicAndrew Rosenkrantz
New York UniversityPeter Humphey
Yale School of Medicine, New HavenPreston Sprenkle
Yale School of Medicine, New HavenChina
Liang Wang
Tongji Medical CollegeAustralia
Les Thompson
Wesley Hospital, BrisbaneAuthor contributions: Jeffrey C. Weinreb had full access to all the data in
the study and takes responsibility for the integrity of the data and the
accuracy of the data analysis.
Study concept and design: Weinreb, Verma, Tempany, Thoeny, Shtern,
Margolis, Macura, Haider, Cornud, Choyke, Barentsz.
Acquisition of data: Weinreb, Verma, Tempany, Thoeny, Shtern, Margolis,
Macura, Haider, Cornud, Choyke, Barentsz.
Analysis and interpretation of data: Weinreb, Verma, Tempany, Thoeny,
Shtern, Margolis, Macura, Haider, Cornud, Choyke, Barentsz.
Drafting of the manuscript: Weinreb, Verma, Tempany, Thoeny, Shtern,
Margolis, Macura, Haider, Cornud, Choyke, Barentsz.

E U R O P E A N U R O L O G Y 6 9 ( 2 0 1 6 ) 1 6 – 4 032
Critical revision of the manuscript for important intellectual content:
Weinreb, Verma, Tempany, Thoeny, Shtern, Margolis, Macura, Haider,
Cornud, Choyke, Barentsz.
Statistical analysis: None.
Obtaining funding: None.
Administrative, technical, or material support: None.
Supervision: Weinreb, Barentsz.
Other (specify): None.
Appendix I
Report Templates (this section is under construction)
Standard (Free Text) Report
Structured Report
Appendix II
Sector Map
The segmentation model used in PI-RADSTM v2 employs thirty
seminal vesicles and one for the external urethral sphincter.
The prostate is divided into right/left on axial sections by
prostatic urethra), and into anterior/posterior by a horizontal
The right and left peripheral zones (PZ) at prostate base, m
anterior (a), medial posterior (mp), and lateral posterior (lp).
The right and left transition zones (TZ) at prostate base, m
anterior (a) and posterior (p).
The central zone (CZ) is included in the prostate base aroun
The anterior fibromuscular stroma (AS) is divided into righ
The seminal vesicles (SV) are divided into right/left.
The urethral sphincter (US) is marked in the prostate apex
The sector map illustrates an idealized ‘‘normal prostate’
prostates have components that are enlarged or atrophied, and
addition to the written report, a sector map which clearly indic
localization.
Financial disclosures: Jeffrey C. Weinreb certifies that all conflicts of
interest, including specific financial interests and relationships and
affiliations relevant to the subject matter or materials discussed in the
manuscript (eg, employment/affiliation, grants or funding, consultan-
cies, honoraria, stock ownership or options, expert testimony, royalties,
or patents filed, received, or pending), are the following: None.
Funding/Support and role of the sponsor: None
-nine sectors/regions: thirty-six for the prostate, two for the
a vertical line drawn through the center (indicated by the
line through the middle of the gland.
idgland, and apex are each subdivided into three sections:
idgland, and apex are each subdivided into two sections:
d the ejaculatory ducts.
t/left at the prostate base, midgland, and apex.
and along the membranous segment of the urethra.
’. In patients and their corresponding MRI images, many
the PZ may obscured by an enlarged TZ. In such instances, in
ates the location of the findings will be especially useful for

Appendix III
Lexicon
ABNORMALITY
Focal abnormality Localized at a focus, central point or locus
Focus Localized finding distinct from neighboring tissues, not a three-dimensional space occupying structure
Index Lesion Lesion identified on MRI with the highest PIRADS Assessment Category. If the highest PIRADS Assessment Category
is assigned to two or more lesions, the index lesion should be one that shows EPE or is largest. Also known as
dominant lesion
Lesion A localized pathological or traumatic structural change, damage, deformity, or discontinuity of tissue, organ, or body
part
Mass A three-dimensional space occupying structure resulting from an accumulation of neoplastic cells, inflammatory
cells, or cystic changes
Nodule A small lump, swelling or collection of tissue
Non-focal abnormality Not localized to a single focus
Diffuse Widely spread; not localized or confined; distributed over multiple areas, may or may not extend in contiguity, does
not conform to anatomical boundaries
Multifocal Multiple foci distinct from neighboring tissues
E U R O P E A N U R O L O G Y 6 9 ( 2 0 1 6 ) 1 6 – 4 0 33
Regional Conforming to prostate sector, sextant, zone, or lobe; abnormal signal other than a mass involving a large volume of
prostatic tissue
SHAPE
Round The shape of a circle or sphere
Oval The shape of either an oval or an ellipse
Lenticular Having the shape of a double-convex lens, crescentic
Lobulated Composed of lobules with undulating contour
Water-drop-shaped
Tear-shaped
Having the shape of a tear or drop of water; it differs from an oval because one end is clearly larger than the other
Wedge-shaped Having the shape of a wedge, pie, or V-shaped
Linear In a line or band-like in shape
Irregular Lacking symmetry or evenness
MARGINS
Circumscribed Well defined
Non-circumscribed Ill-defined
Indistinct Blurred
Obscured Not clearly seen or easily distinguished
Irregular Uneven
Spiculated Radiating lines extending from the margin of a mass
Encapsulated Bounded by a distinct, uniform, smooth low-signal line (BPH nodule)
Organized chaos Heterogeneous mass in transition zone with circumscribed margins, encapsulated (BPH nodule)
Erased charcoal sign Blurred margins as if smudged, smeared with a finger; refers to appearance of a homogeneously T2 low-signal lesion
in the transition zone of the prostate with indistinct margins (prostate cancer)
Hyperintense Having higher signal intensity (more intense, brighter) on MRI than background prostate tissue or reference tissue/
structure
T2 Hyperintensity Having higher signal intensity (more intense, brighter) on T2-weighted imaging
Isointense Having the same intensity as a reference tissue/structure to which it is compared; intensity at MRI that is identical
or nearly identical to that of background prostate
Hypointense Having less intensity (darker) than background prostate tissue or reference tissue/structure
Markedly hypointense Signal intensity lower than expected for normal or abnormal tissue of the reference type, e.g., when involved with
calcification or blood or gas
T2 hypointensity Having lower signal intensity (less intense, darker) on T2-weighted imaging
MR IMAGING SIGNAL CHARACTERISTICS
Restricted diffusion Limited, primarily by cell membrane boundaries, random Brownian motion of water molecules
within the voxel; having higher signal intensity than peripheral zone or transition zone prostate on
DW images acquired or calculated at b values >1400 accompanied by lowered ADC values.
Synonymous with ‘‘impeded’’ diffusion
Diffusion-weighted hyperintensity Having higher signal intensity, not attributable to T2 shine-through, than background prostate on
DW images
Apparent Diffusion Coefficient (ADC) A measure of the degree of motion of water molecules in tissues. It is determined by calculating the
signal loss in data obtained with different b-values and is expressed in units of mm2/sec or mm2/sec
ADC Map A display of ADC values for each voxel in an image
ADC Hyperintense Having higher signal intensity (more intense, brighter) than background tissue on ADC map
ADC Isointense Intensity that is identical or nearly identical to that of background tissue on ADC map
ADC Hypointense Having lower intensity (darker) than a reference background tissue on ADC map
b-value A measure of the strength and duration of the diffusion gradients that determines the sensitivity of a
DWI sequence to diffusion
Dynamic contrast enhanced DCE
Wash-in
Early arterial phase of enhancement; a period of time to allow contrast agent to arrive in the tissue
DCE Wash-out Later venous phase, de-enhancement, reduction of signal following enhancement; a period of time to
allow contrast agent to clear the tissue
Pharmacodynamic analysis PD curves Method of quantifying tissue contrast media concentration changes to calculate time constants for
the rate of wash-in and wash-out
Time vs. signal intensity curve
Enhancement kinetic curve
Graph plotting tissue intensity change (y axis) over time (x axis); enhancement kinetic curve is a
graphical representation of tissue enhancement where signal intensity of tissue is plotted as a
function of time
ENHANCEMENT PATTERNS
Early phase wash-in Signal intensity characteristic early after contrast agent administration; wash-in phase corresponding to contrast
arrival in the prostate
Delayed phase Signal intensity characteristic following its initial (early) rise after contrast material administration
Persistent delayed phase
Type 1 curve
Continued increase of signal intensity over time
E U R O P E A N U R O L O G Y 6 9 ( 2 0 1 6 ) 1 6 – 4 034

Plateau delayed phase
Type 2 curve
Signal intensity does not change over time after its initial rise, flat; plateau refers to signal that varies <10% from the
peak signal over the duration of the DCE MRI
Washout delayed phase
Type 3 curve
Signal intensity decreases after its highest point after its initial rise
Positive DCE Focal, early enhancement corresponding to a focal peripheral zone or transition zone lesion on T2 and/or DWI MRI
Negative DCE Lack of early enhancement
Diffuse enhancement not corresponding to a focal lesion on T2 and/or DWI MRI
Focal enhancement corresponding to a BPH lesion
ANATOMICAL TERMS
Prostate: Regional Parts The prostate is divided from superior to inferior into three regional parts: the base, the midgland, and
the apex.
Base of prostate The upper 1/3 of the prostate just below the urinary bladder.
Mid prostate The middle 1/3 of the prostate that includes verumontanum in the mid prostatic urethra; midgland
Apex of prostate The lower 1/3 of the prostate
Peripheral zone Covers the outer posterior, lateral, and apex regions of the prostate; makes up most of the apex of the
prostate
Transition zone Tissue around the urethra that is separated from the peripheral zone by the ‘‘surgical capsule’’
delineated as a low signal line on T2 weighted MRI; it is the site of most BPH
Central zone Tissue surrounding the ejaculatory ducts posterior and superior, from the base of the prostate to the
verumontanum; it has the shape of an inverted cone with its base oriented towards the base of the
gland; contains more stroma than glandular tissue
Anterior fibromuscular
stroma
Located anteriorly and contains smooth muscle, which mixes with periurethral muscle fibers at the
bladder neck; contains no glandular tissue
Prostate: Sectors Anatomical regions defined for the purpose of prostate targeting during interventions, may include
multiple constitutional and regional parts of the prostate. Thirty-six sectors for standardized MRI
prostate localization reporting are identified, with addition of seminal vesicles and membranous
urethra. Each traditional prostate sextant is sub-divided into six sectors, to include: the anterior
fibromuscular stroma, the transition zone anterior and posterior sectors, the peripheral zone anterior,
lateral, and medial sectors. The anterior and posterior sectors are defined by a line bisecting the
prostate into the anterior and posterior halves. [79_TD$DIFF] See Diagram [80_TD$DIFF] for reference
Prostate ‘‘capsule’’ Histologically, there is no distinct capsule that surrounds the prostate, however historically the
‘‘capsule’’ has been defined as an outer band of the prostatic fibromuscular stroma blending with
endopelvic fascia that may be visible on imaging as a distinct thin layer of tissue surrounding or
partially surrounding the peripheral zone.
Prostate pseudocapsule Imaging appearance of a thin ‘‘capsule’’ around transition zone when no true capsule is present at
histological evaluation. The junction of the transition and peripheral zones marked by a visible
hypointense linear boundary, which is often referred to as the prostate ‘‘pseudocapsule’’ or ‘‘surgical
capsule.’’
Seminal vesicle One of the two paired glands in the male genitourinary system, posterior to the bladder and superior to
the prostate gland, that produces fructose-rich seminal fluid which is a component of semen. These
glands join the ipsilateral ductus (vas) deferens to form the ejaculatory duct at the base of the prostate.
Neurovascular bundle
of prostate NVB
Nerve fibers from the lumbar sympathetic chain extend inferiorly to the pelvis along the iliac arteries
and intermix with parasympathetic nerve fibers branching off S2 to S4. The mixed nerve bundles run
posterior to the bladder, seminal vesicles, and prostate as the ‘‘pelvic plexus’’. The cavernous nerve
arises from the pelvic plexus and runs along the posterolateral aspect of the prostate on each side.
Arterial and venous vessels accompany the cavernous nerve, and together these structures form the
neurovascular bundles which are best visualized on MR imaging at 5 and 7 o’clock position. At the apex
and the base of the prostate, the bundles send penetrating branches through the ‘‘capsule’’, providing a
potential route for extraprostatic tumor spread.
Right neurovascular bundle Located at 7 o’clock posterolateral position.
Left neurovascular bundle Located at 5 o’clock posterolateral position.
Vas deferens The excretory duct of the testes that carries spermatozoa; it rises from the scrotum and joins the
seminal vesicles to form the ejaculatory duct, which opens into the mid prostatic urethra at the level
of the verumontanum.
Verumontanum The verumontanum (urethral crest formed by an elevation of the mucous membrane and its
subjacent tissue) is an elongated ridge on the posterior wall of the mid prostatic urethra at the site of
ejaculatory ducts opening into the prostatic urethra.
Neck of urinary bladder The inferior portion of the urinary bladder which is formed as the walls of the bladder converge and
become contiguous with the proximal urethra
Urethra: Prostatic The proximal prostatic urethra extends from the bladder neck at the base of the prostate to
verumontanum in the mid prostate.
The distal prostatic urethra extends from the verumontanum to the membranous urethra and
contains striated muscle of the urethral sphincter.
Urethra: Membranous The membranous segment of the urethra is located between the apex of the prostate and the bulb of
the corpus spongiosum, extending through the urogenital diaphragm.
External urethral sphincter Surrounds the whole length of the membranous portion of the urethra and is enclosed in the fascia of
the urogenital diaphragm.
E U R O P E A N U R O L O G Y 6 9 ( 2 0 1 6 ) 1 6 – 4 0 35
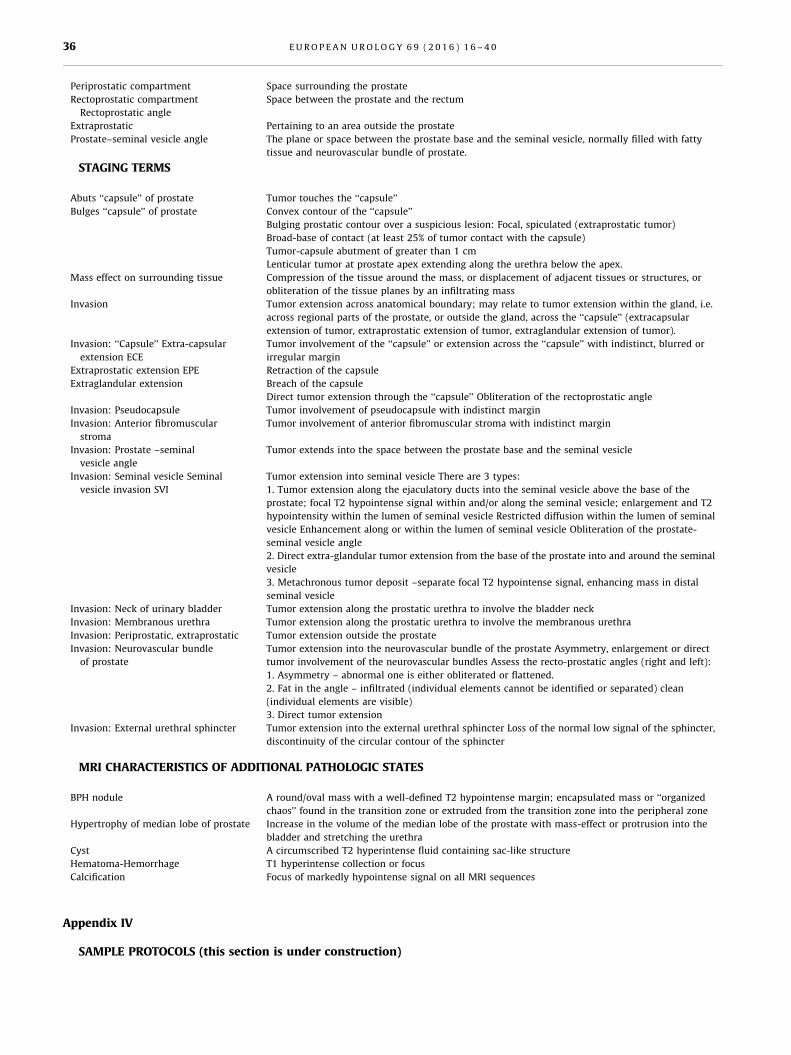
Periprostatic compartment Space surrounding the prostate
Rectoprostatic compartment
Rectoprostatic angle
Space between the prostate and the rectum
Extraprostatic Pertaining to an area outside the prostate
Prostate–seminal vesicle angle The plane or space between the prostate base and the seminal vesicle, normally filled with fatty
tissue and neurovascular bundle of prostate.
STAGING TERMS
Abuts ‘‘capsule’’ of prostate Tumor touches the ‘‘capsule’’
Bulges ‘‘capsule’’ of prostate Convex contour of the ‘‘capsule’’
Bulging prostatic contour over a suspicious lesion: Focal, spiculated (extraprostatic tumor)
Broad-base of contact (at least 25% of tumor contact with the capsule)
Tumor-capsule abutment of greater than 1 cm
Lenticular tumor at prostate apex extending along the urethra below the apex.
Mass effect on surrounding tissue Compression of the tissue around the mass, or displacement of adjacent tissues or structures, or
obliteration of the tissue planes by an infiltrating mass
Invasion Tumor extension across anatomical boundary; may relate to tumor extension within the gland, i.e.
across regional parts of the prostate, or outside the gland, across the ‘‘capsule’’ (extracapsular
extension of tumor, extraprostatic extension of tumor, extraglandular extension of tumor).
Invasion: ‘‘Capsule’’ Extra-capsular
extension ECE
Tumor involvement of the ‘‘capsule’’ or extension across the ‘‘capsule’’ with indistinct, blurred or
irregular margin
Extraprostatic extension EPE Retraction of the capsule
Extraglandular extension Breach of the capsule
Direct tumor extension through the ‘‘capsule’’ Obliteration of the rectoprostatic angle
Invasion: Pseudocapsule Tumor involvement of pseudocapsule with indistinct margin
Invasion: Anterior fibromuscular
stroma
Tumor involvement of anterior fibromuscular stroma with indistinct margin
Invasion: Prostate –seminal
vesicle angle
Tumor extends into the space between the prostate base and the seminal vesicle
Invasion: Seminal vesicle Seminal
vesicle invasion SVI
Tumor extension into seminal vesicle There are 3 types:
1. Tumor extension along the ejaculatory ducts into the seminal vesicle above the base of the
prostate; focal T2 hypointense signal within and/or along the seminal vesicle; enlargement and T2
hypointensity within the lumen of seminal vesicle Restricted diffusion within the lumen of seminal
vesicle Enhancement along or within the lumen of seminal vesicle Obliteration of the prostate-
seminal vesicle angle
2. Direct extra-glandular tumor extension from the base of the prostate into and around the seminal
vesicle
3. Metachronous tumor deposit –separate focal T2 hypointense signal, enhancing mass in distal
seminal vesicle
Invasion: Neck of urinary bladder Tumor extension along the prostatic urethra to involve the bladder neck
Invasion: Membranous urethra Tumor extension along the prostatic urethra to involve the membranous urethra
Invasion: Periprostatic, extraprostatic Tumor extension outside the prostate
Invasion: Neurovascular bundle
of prostate
Tumor extension into the neurovascular bundle of the prostate Asymmetry, enlargement or direct
tumor involvement of the neurovascular bundles Assess the recto-prostatic angles (right and left):
1. Asymmetry – abnormal one is either obliterated or flattened.
2. Fat in the angle – infiltrated (individual elements cannot be identified or separated) clean
(individual elements are visible)
3. Direct tumor extension
Invasion: External urethral sphincter Tumor extension into the external urethral sphincter Loss of the normal low signal of the sphincter,
discontinuity of the circular contour of the sphincter
MRI CHARACTERISTICS OF ADDITIONAL PATHOLOGIC STATES
BPH nodule A round/oval mass with a well-defined T2 hypointense margin; encapsulated mass or ‘‘organized
chaos’’ found in the transition zone or extruded from the transition zone into the peripheral zone
Hypertrophy of median lobe of prostate Increase in the volume of the median lobe of the prostate with mass-effect or protrusion into the
bladder and stretching the urethra
Cyst A circumscribed T2 hyperintense fluid containing sac-like structure
Hematoma-Hemorrhage T1 hyperintense collection or focus
Calcification Focus of markedly hypointense signal on all MRI sequences
Appendix IV
SAMPLE PROTOCOLS (this section is under construction)
E U R O P E A N U R O L O G Y 6 9 ( 2 0 1 6 ) 1 6 – 4 036
Appendix V
Atlas (this section is under construction)
Three (3) examples of each category (1-5) for T2, DWI, and D
E U R O P E A N U R O L O G Y 6 9 ( 2 0 1 6 ) 1 6 – 4 0 37
References
Introduction
1. Thornbury JR, Ornstein DK, Choyke PL, Langlotz CP,
Weinreb JC. Prostate Cancer: What is the future for
imaging? Am J Roentgenology 2001;176:17-22.
2. D
ickinson L, Ahmed HU, Allen C, Barentsz JO, Carey B,Futterer JJ, et al. Magnetic resonance imaging for the
detection, localisation, and characterisation of prostate
cancer: recommendations from a European consensus
meeting. European Urology.2011;4:477-94.
3. E
berhardt SC, Carter S, Casalino DD, Merrick G, Frank SJ,et al. ACR Appropriateness Criteria1 for Prostate
Cancer — pretreatment detection, staging and surveil-
lance. J Am Coll Radiol 2013;10(2);83-92
4. B
arentsz JO, Richenberg J, Clements R, Choyke P, VermaS, Villeirs G, et al. ESUR prostate MR guidelines 2012.
European Radiol 2012;4:746-57.
5. M
oore CM, Kasivisvanathan V, Eggener S, Emberton M,Futterer JJ, et al. Standards of reporting for MRI-targeted
biopsy studies (START) of the prostate: recommenda-
tions from an international working group. European
Urology 2013;64:544-552
6. R
osenkrantz AB, Kim S, Lim RP, Hindman N, Deng F-M,et al. Prostate cancer localization using multiparametric
MR imaging: comparison of Prostate Imaging Reproting
and Data System (PI-RADS) and Likert Scales. Radiology
2013:269:482-492
7. d
e Rooij M, Hamoen EHJ, Futterer JJ, Barentsz JO, RoversMM. Accuracy of muliparametric MRI for prostate
cancer detection: a meta-analysis. Am J Roentgenology
2014;202:343-351
8. A
rumainayagam N, Ahmed HU, Moore CM, Freeman A,Allen C, et al. Multiparametric MR imaging for detection
of clinically significant prostate cancer: a validation
cohort study with transperineal template prostate
mapping as the reference standard. Radiology
2013:268:761-769
9. D
ickinson L, Ahmed HU, allen C, Barentsz JO, Carey B,et al. Scoring systems used for the interpretation and
reporting of mulitparametric MRI for prostate cancer
detection, localization and chanarcterization: could
standardization lead to improved utilization of imaging
within the diagnostic pathway? J Magn Reson imaging
2013:37;48-58
10. C
ornelis F, Rigou G, Le Bras Y, Coutouly X, Hubrecht R,et al. Real-time contast-enhanced transprectal US-
guided prostate biopsy: diagnostic accuracy in men
with previously negative biopsy results and positive MR
imaging findings. Radiology 2013;269:159-166
11. P
uech P, Rouviere O, renard-Penna R, Villers A, Devos P,et al. Prostate cancer diagnosis: multiparametric
MR-targeted biopsy with cognitive and transrectal
U-MR fusion guidance versus systemic biopsy-pro-
spective mulitcenter study. Radiology 2013:268;461-
469
12. P
okorny MR, de Rooij M, Duncan E, Schroder FH,Parkinson R, et al. Prospective study of diagnostic
accuracy comparing proastate cancer detection by
transrectal ultrasound-guided biopsy versus magnetic
resonance (MR) imaging with subsequent MR-guided
biopsy in men without previous prostate biopsies.
European Urology 2014 (In press)
13. H
amoen EHJ, de Rooij M, Witjes JA, Barentsz J. Use of theProstate Imaging Reporting and Data System (PI-RADS)
for prostate cancer detection with mulitparametric
magnetic resonance imaging: a diagnostic meta-analy-
sis. European Urology 2014 (In press)
Section I: Clinical Considerations and Technical
Specifications
1. Wagner M, Rief M, Busch, Scheuring C, Taupitz M, et al.
Effect of butylscopolamine on image quality in MRI of
the prostate. Clin radiol 2012;65:460-465
2. R
osenkrantz AB, Kopec M, Kong X, Melamed J, DakwarG, Babb JS, et al. Prostate cancer vs. post-biopsy
hemorrhage: diagnosis with T2- and diffusion-weight-
ed imaging. J Magn Reson Imaging 2010 Jun;31(6):
1387-94.
3. R
osenkrantz AB, Mussi TC, Hindman N, Lim RP, KnongMX, et al. Impact of dealy after biopsy and post-biopsy
haemorrhage on prostate cancer tumor detection using
mulit-parametric MRI: a multi-reader study. Clin Radiol
2012;67:83-90
4. T
amada T, Sone T, Jo Y, Yamamoto A, Yamashita T,Egashira N, et al. Prostate cancer: relationships between
postbiopsy hemorrhage and tumor detectability at MR
diagnosis. Radiology 2008;248:531-539
5. B
arrett T, Vargas HA, Akin O, Goldman DA, Hricak H.Value of the hemorrhage exclusion sign on T1-
weighted prostate MR images for the detection of
prostate cancer. Radiology 2012;263:751-757
6. P
ark KK, Lee SH, LIm BJ, Kim JH, Chung BH. The effects ofthe period between biopsy and diffusion- weighted
magnetic resonance imaging on cancer staging in
localized prostate cancer. BJU Int 2010;106:1148-1151
7. M
edved M, Sammet S, Yousuf A, Oto A. MR imaging ofthe prostate and adjacent anatomic structures before,
during, and after ejaculation: qualitative and quantita-
tive evaluation. Radiology 2014;271(2):452-60.
8. R
ouviere O, Hartman RP, Lyonnet D. Prostate MRimaging at high-field strength: evolution or revolution?
European Radiol 2006;16(2):276-84.

E U R O P E A N U R O L O G Y 6 9 ( 2 0 1 6 ) 1 6 – 4 038
9. Jo
hnston R, Wong L-M, Warren A, Shah N, Neal D. Therole of 1.5T Tesla magnetic resonance imaging in
staging prostate cancer. ANZ J Surg 2013 (83);234-238
10. K
im BS, Kim TH, Kwon TG, Yoo ES. Comparison of pelvicphased-array versus endorectal coil magnetic reso-
nance imaging at 3 Tesla for local staging of prostate
cancer. Yonsei Med J 2012;53(3):550-6.
11. T
urkbey B, Merinio MJ, Gallardo EC, Shah V, Aras O, et al.Comparison of endorectal and nonendorectal coil T2W
and diffusion-weighted MRI at 3 Tesla for localizing
prostate cancer: comparison with whole- mount
histopathollogy. J Magn Reson Imaging 2014:39;1443-
1448
12. H
aider MA, krieger A, Elliot C, Da Rosa MR, Milot L.Prostate imaging: evaluation of reusable two- channel
endorectal receiver coil for MR imaging at 1.5T.
Radiology 2014:270;556-565
13. L
eake JL, Hardman R, Vijayanadh O, Thompson I,Shanbhogue A, et al. prostate MRI: access to the current
practice of prostate MRI in the United States. J Am Coll
Radiol 2014:11;156-160
14. R
osen Y, Bloch N, Lenkinski RE, Greenman RL, MarquisRP, Rofsky NM. 3T MR of the prostate: reducing
susceptibility gradients by inflating the endorectal coil
with barium sulfate suspension. Magn Reson Med
2007;57:898-904
15. R
oethke MC, Kuru TH, Schultze S, Tichy D, Kopp-Schneider A, Fenchel M, et al. Evaluation of the ESUR
PI-RADS scoring system for multiparametric MRI
of the prostate with targeted MR/TRUS fusion-guided
biopsy at 3.0 Tesla. European Radiol 2014 Feb;24(2):
344-52.
16. N
iaf E, Lartizien C, Bratan F, Roche L, Babilloud M, et al.Prostate focal peripheral zone lesions; characterization
at multiparametric MR imaging-influence of computer-
aided diagnosis system. Radiology 2014;271:761-769
17. H
ambrock T, Vos PC, Hulsbergen-van de Kaa CA,Barentsz JO, Huisman HJ. Prostate cancer: computer-
aided diagnosis with mulitparametric 3-T MR imaging-
effect on observer performance. Radiology 2013;266:
521-530
Section II: Normal Anatomy and Benign Findings
1. McNeal JE. The Zonal anatomy of the prostate. The
Prostate 1981;2:35-49 McNeal JE. Normal histology of
the prostate. Am J Surg Pathol 1988;12:619-33
2. V
illers A, Lemaitre L, Haffner J, Puech P. Current status ofMRI for the diagnosis, staging and prognosis of prostate
cancer: implications for focal therapy and active
surveillance. Curr Opin Urol 2009;19:274-82
3. V
argas HA, Akin O, Franiel T, Goldman DA, Udo K, et al.Normal cnetals zone of the prostate and central zone
involvement by prostate cancer: clinical and MR imaging
implications. Radiology 2012;262:894-902
4. S
hebel HM, Farg HM, Kolokythas O, El-Diasty T. Cysts ofthe lower male genitourinary tract: embryologic and
anatomic considerations and differential diagnosis.
Radiographics 2013 Jul- Aug;33(4):1125-43.
5. K
rieger JN, Lee SWH, Jeon J, Cheah PY, Liong ML, et al.Epidemiology of prostatitis. Int J Antimicrob Agents
2008:31 (Suppl 1): 85-90
6. N
agel NNA, Schouten MG, Hambrock T, Litjens GJS, HoeksCMA, et al. Differentiation of prostatitis and prostate
cancer by using diffusion-weighted MR imaging and MR-
guided biopsy at 3T. Radiology 2013;267:164-172
7. E
ngelhard K, Hollenback HP, Deimiing M, Kerckel M,Riedi C. Combination of signal intensity measurements of
lesions in the peripheral zone of prostate with MRI and
serum PSA level for differentiating benign disease from
prostate cancer. Eur Radiol 2000;10(12);1947-1953
Section III: Assessment and Reporting
1. Epstein JI, Walsh PC, Carmichael M, Brendler CB.
Pathologic and clinical findings to predict tumor extent
of nonpalpable (stage T1c) prostate cancer. JAMA
1994 Feb 2;271(5):368-74.
2. G
oto Y, Ohori M, Arakawa A, Kattan MW, Wheeler TM,Scardino PT. Distinguishing clinically important
from unimportant prostate cancers before treatment:
value of systematic biopsies. J Urol 1996 Sep;156(3):
1059-63.
3. H
arnden P, Naylor B, Shelley MD, Clements H, Coles B,Mason MD. The clinical management of patients with a
small volume of prostatic cancer on biopsy: what are
the risks of progression? A systematic review and meta-
analysis. Cancer 2008 Mar 1;112(5):971-81.
4. W
olters T, Roobol MJ, van Leeuwen PJ, van den Bergh RC,Hoedemaeker RF, van Leenders GJ, et al. A critical
analysis of the tumor volume threshold for clinically
insignificant prostate cancer using a data set of a
randomized screening trial. J Urol 2011 Jan;185(1):
121-5.
5. V
argas HA, Akin O, Shukla-Dave A, Zhang J, Zakian KL,et al. Performance characteristics of MR imaging in the
evaluation of clinically low-risk prostate cancer: a
prospective study. Radiology 2012;265:478-487
6. R
en J, Yang Y, Zhang J, Xu J, Liu Y, Wei M, et al. T(2)-weighted combined with diffusion-weighted images
for evaluating prostatic transition zone tumors at
3 Tesla. Future Oncol 2013 Apr;9(4):585-93.
7. D
elongchamps NB, Rouanne M, Flam T, Beuvon F,Liberatore M, Zerbib M, et al. Multiparametric magnetic
resonance imaging for the detection and localization of
prostate cancer: combination of T2- weighted, dynamic
contrast-enhanced and diffusion-weighted imaging.
BJU international. 2011 May;107(9):1411-8.
8. T
urkbey B, Pinto PA, Mani H, Bernardo M, Pang Y,McKinney YL, et al. Prostate cancer: value of multi-
parametric MR imaging at 3 T for detection–histopath-
ologic correlation. Radiology 2010 Apr;255(1):89-99.
9. R
osenkrantz AB, Mussi TC, Borofsky MS, Scionti SS,Grasso M, Taneja SS. 3.0 T multiparametric prostate MRI
using pelvic phased-array coil: utility for tumor
E U R O P E A N U R O L O G Y 6 9 ( 2 0 1 6 ) 1 6 – 4 0 39
detection prior to biopsy. Urologic Oncology
2013 Nov;31(8):1430-5.
10. H
ambrock T, Somford DM, Huisman HJ, van Oort IM,Witjes JA, Hulsbergen-van de Kaa CA, et al. Relationship
between apparent diffusion coefficients at 3.0-T MR
imaging and Gleason grade in peripheral zone prostate
cancer. Radiology 2011 May;259(2):453-61.
11. T
urkbey B, Shah VP, Pang Y, Bernardo M, Xu S, KrueckerJ, et al. Is apparent diffusion coefficient associated with
clinical risk scores for prostate cancers that are visible
on 3-T MR images? Radiology 2011 Feb;258(2):488-95.
12. T
amada T, Kanomata N, Sone T, Jo Y, Miyaji Y, Higashi H,et al. High b value (2,000 s/mm2) diffusion- weighted
magnetic resonance imaging in prostate cancer at
3 Tesla: comparison with 1,000 s/mm2 for tumor
conspicuity and discrimination of aggressiveness. PLOS
ONE 2014;9(5):e96619.
13. K
itajima K, Takahashi S, Ueno Y, Yoshikawa T, Ohno Y,Obara M, et al. Clinical utility of apparent diffusion
coefficient values obtained using high b-value when
diagnosing prostate cancer using 3 tesla MRI: compari-
son between ultra-high b-value (2000 s/mm(2)) and
standard high b-value (1000 s/mm(2)). J Magn Reson
Imaging 2012 Jul;36(1):198-205.
14. G
rant KB, Agarwal HK, Shih JH, Bernardo M, Pang Y,Daar D, et al. Comparison of calculated and acquired
high b value diffusion-weighted imaging in prostate
cancer. Abdom Imaging 2014 Sep 16.
15. B
ittencourt LK, Attenberger UI, Lima D, Strecker R, deOliveira A, Schoenberg SO, et al. Feasibility study of
computed vs measured high b-value (1400 s/mm(2))
diffusion-weighted MR images of the prostate. World J
Radiol 2014 Jun 28;6(6):374-80.
16. R
osenkrantz AB, Mannelli L, Kong X, Niver BE, BerkmanDS, Babb JS, et al. Prostate cancer: utility of fusion of T2-
weighted and high b-value diffusion-weighted images
for peripheral zone tumor detection and localization. J
Magn Reson Imaging 2011 Jul;34(1):95-100.
17. P
adhani AR, Liu G, Koh DM, Chenevert TL, Thoeny HC,Takahara T, et al. Diffusion-weighted magnetic reso-
nance imaging as a cancer biomarker: consensus and
recommendations. Neoplasia 2009 Feb;11(2):102-25.
18. M
aas MC, Futterer JJ, Scheenen TW. Quantitativeevaluation of computed high B value diffusion-
weighted magnetic resonance imaging of the prostate.
Invest Radiol 2013 Nov;48(11):779-86.
19. M
etens T, Miranda D, Absil J, Matos C. What is theoptimal b value in diffusion-weighted MR imaging to
depict prostate cancer at 3T? European Radiol
2012 Mar;22(3):703-9.
20. R
osenkrantz AB, Hindman N, Lim RP, Das K, Babb JS, et al.Diffusion-weighted imaign of the prostate: comparison
of b1000 and b2000 image sets for index lesion detection.
J Magn Reson Imaging 2013;38:694-700
21. B
ieencourt LK, Attenberger UI, Lima D, Strecker R, deOliveira A, et al. World J Radiol 2014 (6):374-380
22. M
edved M, Soylu-Boy FN, Karademir I, Sthei I, Yousef A,et al. High-resolution diffusion-weighted imaging of
the prostate. AJR 2014:203:85-90
23. Iw
azawa J, Mitani T, Sassa S, Ohue S. Prostate cancerdetection with MRI: is dynamic contrast- enhanced
imaging necessary in addition to diffusion-weighted
imaging? Diagn Interv Radiol 2011 Sep;17(3):243-8.
24. H
oeks CM, Somford DM, van Oort IM, Vergunst H, OddensJR, Smits GA, et al. Value of 3-T multiparametric magnetic
resonance imaging and magnetic resonance-guided
biopsy for early risk restratification in active surveillance
of low-risk prostate cancer: a prospective multicenter
cohort study. Invest Radiol 2014 Mar;49(3):165-72.
25. V
ourganti S, Rastinehad A, Yerram NK, Nix J, Volkin D,Hoang A, et al. Multiparametric magnetic resonance
imaging and ultrasound fusion biopsy detect prostate
cancer in patients with prior negative transracial
ultrasound biopsies. J Urol 2012 Dec;188(6):2152-7.
26. H
egde JV, Chen MH, Mulkern RV, Fennessy FM, D’AmicoAV, Tempany CM. Preoperative 3-Tesla multiparametric
endorectal magnetic resonance imaging findings and the
odds of upgrading and upstaging at radical prostatec-
tomy in men with clinically localized prostate cancer. Int
J Radiat Oncol Biol Phys 2013 Feb 1;85(2):e101-7.
27. C
ornud F, Khoury G, Bouazza N, Beuvon F, PeyromaureM, Flam T, et al. Tumor target volume for focal therapy
of prostate cancer-does multiparametric magnetic
resonance imaging allow for a reliable estimation? J
Urol 2014 May;191(5):1272-9.
28. K
uru TH, Roethke MC, Rieker P, Roth W, Fenchel M,Hohenfellner M, et al. Histology core-specific evalua-
tion of the European Society of Urogenital Radiology
(ESUR) standardized scoring system of multiparametric
magnetic resonance imaging (mpMRI) of the prostate.
BJU international 2013 Dec;112(8):1080-7.
29. S
omford DM, Hamoen EH, Futterer JJ, van Basten JP,Hulsbergen-van de Kaa CA, Vreuls W, et al. The
predictive value of endorectal 3 Tesla multiparametric
magnetic resonance imaging for extraprostatic exten-
sion in patients with low, intermediate and high risk
prostate cancer. J Urol 2013 Nov;190(5):1728-34.
30. T
amada T, Sone T, Higashi H, Jo Y, Yamamoto A, Kanki A,et al. Prostate cancer detection in patients with total
serum prostate-specific antigen levels of 4-10 ng/mL:
diagnostic efficacy of diffusion- weighted imaging,
dynamic contrast-enhanced MRI, and T2-weighted
imaging. Am J Roentgenology 2011 Sep;197(3):664-70.
31. M
iller GJ, Cygan JM. Morphology of prostate cancer: theeffects of multifocality on histological grade, tumor
volume and capsule penetration. JURO 1994 Nov;152(5
Pt 2):1709–13.
32. A
rora R, Koch MO, Eble JN, Ulbright TM, Li L, Cheng L.Heterogeneity of Gleason grade in multifocal adenocar-
cinoma of the prostate. Cancer 2004;100(11):2362–6.
33. K
aravitakis M, Ahmed HU, Abel PD, Hazell S, WinklerMH. Margin status after laparoscopic radical prostatec-
tomy and the index lesion: implications for preopera-
tive evaluation of tumor focality in prostate cancer.
Journal of Endourology 2012 May;26(5):503–8.
34. A
lgaba F, Montironi R. Impact of prostate cancermultifocality on its biology and treatment. Journal of
Endourology 2010 May;24(5):799–804.

E U R O P E A N U R O L O G Y 6 9 ( 2 0 1 6 ) 1 6 – 4 040
35. W
ise AM, Stamey TA, McNeal JE, Clayton JL. Morpho-logic and clinical significance of multifocal prostate
cancers in radical prostatectomy specimens. Urology
2002 Aug;60(2):264–9.
36. E
pstein JI. Prognostic significance of tumor volume inradical prostatectomy and needle biopsy specimens.
The Journal of Urology. 2011 Sep;186(3):790–7.
37. v
an der Kwast TH, Amin MB, Billis A, Epstein JI, GriffithsD, Humphrey PA, et al. International Society of
Urological Pathology (ISUP) Consensus Conference on
Handling and Staging of Radical Prostatectomy Speci-
mens. Working group 2: T2 substaging and prostate
cancer volume. Modern Pathology Nature Publishing
Group; 2010 Sep 3;24(1):16–25.
38. R
ud E, Klotz D, Rennesund K, Baco E, Berge V, Lien D,Svindland A, Lundeby E, Berg RE, Eri LM, Eggesbø HB.
Detection of the Index Tumor and Tumor Volume in
Prostate Cancer using T2w and DW MRI alone. BJU Int
2014 Jan 21. http://dx.doi.org/10.1111/bju.12637. [Epub
ahead of print] PubMed PMID: 24447606.
Section V: Staging
1. Engelbrecht MR, Jager GJ, Laheij RJ, Verbeek AL, van Lier
HJ, Barentsz JO. Local staging of prostate cancer using
magnetic resonance imaging: a meta-analysis. European
Radiol 2002 Sep;12(9):2294-302.
2. Jo
hnston R, Wong LM, Warren A, Shah N, Neal D. The roleof 1.5 Tesla magnetic resonance imaging in staging
prostate cancer. ANZ J Surg 2013 Apr;83(4):234-8.
3. W
ang L, Mullerad M, Chen HN, Eberhardt SC, Kattan MW,Scardino PT, Hricak H. Prostate cancer: incremental value
of endorectal MR imaging findings for prediction of
extracapsular extension. Radiology 2004;232:133-9.
4. R
enard-Penna R, Roupret M, Comperat E, Ayed A, CoudertM, Mozer P, et al. Accuracy of high resolution (1.5 tesla)
pelvic phased array magnetic resonance imaging (MRI)
in staging prostate cancer in candidates for radical
prostatectomy: results from a prospective study. Urologic
Oncology 2013 May;31(4):448-54.
5. T
hoeny HC, Froeliich JM, Triantafyllou M, Huesler J, BainsLJ, et al. Metastases in norma-sized pelvic lymph nodes:
detection with diffusion-weighted MR imaging.
Radiology 2014;273:125-135
6. B
aco E, Rud E, Vlatkovic L, Svindland A, Eggesbø HB, HungAJ, et al. Predictive value of Magnetic Resonance Imaging
Determined Tumor Contact Length for Extra-capsular
Extension of Prostate cancer. J Urol 2014 Aug 20. pii:
S0022-5347(14)04257-8. http://dx.doi.org/10.1016/j.
juro.2014.08.084. [Epub ahead of print] PubMed PMID:
25150643.
7. A
kin O, Sala E, Moskowitz CS, Kuroiwa K, Ishill NM, PucarD, et al. Transition zone prostate cancers: features,
detection, localization, and staging at endorectal MR
imaging. Radiology 2006 Jun;239(3):784-792.
SECTOR MAP CREDIT
The prostate sector map was modified by David A. Rini,
Department of Art as Applied to Medicine, Johns Hopkins
University. It is based on previously published figures by
Villers et al (Curr Opin Urol 2009;19:274-82) and Dickinson
et al (Eur Urol 2011;59:477-94) with anatomical correlation
to the normal histology of the prostate by McNeal JE (Am J
Surg Pathol 1988 Aug;12:619-33).