Phytoplankton nutrient deficiencies vary with season in...
16
PRIMARY RESEARCH PAPER Phytoplankton nutrient deficiencies vary with season in sub- tropical lakes of Nepal Freya E. Rowland . Rebecca L. North . Preston McEachern . Daniel V. Obrecht . Tek Bahadur Gurung . Susan B. Jones . John R. Jones Received: 22 May 2018 / Revised: 20 January 2019 / Accepted: 23 January 2019 Ó Springer Nature Switzerland AG 2019 Abstract This is one of few studies to comprehen- sively examine seasonality and phytoplankton nutrient deficiency in sub-tropical lakes over multiple years, to our knowledge. We tested whether phytoplankton communities in two sub-tropical impoundments in the mid-hills of Nepal were nitrogen (N)-, phosphorus (P)- , or co-deficient in N and P across pre-monsoon, monsoon, and post-monsoon seasons spanning a decade. Nutrient limitation to phytoplankton growth was assessed via in situ stoichiometry of N and P (N:P ratios) and nutrient stimulation experiments (NSEs). The experiments indicated co-deficiency of N and P in 97–100% of NSEs in all seasons. N-deficiency was common ( [ 60% of N:P ratios and * 90% of NSEs) during the rainy monsoon, but P-deficiency occurred twice as often as N-deficiency during drier seasons (pre- and post-monsoon). These findings provide perspective for the ongoing debate over N and P as limiting nutrients in freshwater ecosystems by incor- porating seasonality and corresponding hydrology. We also re-visit long-standing assumptions regarding the nutrient status of sub-tropical lakes. The warm, stratified season does not fully illustrate lake pro- cesses, and more research during dry periods will inform how seasonality affects phytoplankton nutrient deficiencies across aquatic systems. Keywords Limiting nutrient Á Monsoon Á Phytoplankton Á Nutrient stimulation experiments Á Nitrogen Á Phosphorus Handling editor: David Philip Hamilton Electronic supplementary material The online version of this article (https://doi.org/10.1007/s10750-019-3897-8) con- tains supplementary material, which is available to authorized users. F. E. Rowland Division of Biological Sciences, University of Missouri, Columbia, MO 65211, USA R. L. North (&) Á P. McEachern Á D. V. Obrecht Á S. B. Jones Á J. R. Jones School of Natural Resources, University of Missouri, Columbia, MO 65211, USA e-mail: [email protected] P. McEachern Civil and Environmental Engineering, University of Alberta, Edmonton, AB T6G1H9, Canada T. B. Gurung Nepal Agricultural Research Council, Kathmandu, Nepal Present Address: F. E. Rowland Cooperative Institute for Great Lakes Research (CIGLR), University of Michigan, Ann Arbor, MI 48108, USA 123 Hydrobiologia https://doi.org/10.1007/s10750-019-3897-8
Transcript of Phytoplankton nutrient deficiencies vary with season in...

PRIMARY RESEARCH PAPER
Phytoplankton nutrient deficiencies vary with season in sub-tropical lakes of Nepal
Freya E. Rowland . Rebecca L. North . Preston McEachern . Daniel V. Obrecht .
Tek Bahadur Gurung . Susan B. Jones . John R. Jones
Received: 22 May 2018 / Revised: 20 January 2019 / Accepted: 23 January 2019
� Springer Nature Switzerland AG 2019
Abstract This is one of few studies to comprehen-
sively examine seasonality and phytoplankton nutrient
deficiency in sub-tropical lakes over multiple years, to
our knowledge. We tested whether phytoplankton
communities in two sub-tropical impoundments in the
mid-hills of Nepal were nitrogen (N)-, phosphorus (P)-
, or co-deficient in N and P across pre-monsoon,
monsoon, and post-monsoon seasons spanning a
decade. Nutrient limitation to phytoplankton growth
was assessed via in situ stoichiometry of N and P (N:P
ratios) and nutrient stimulation experiments (NSEs).
The experiments indicated co-deficiency of N and P in
97–100% of NSEs in all seasons. N-deficiency was
common ([ 60% of N:P ratios and * 90% of NSEs)
during the rainy monsoon, but P-deficiency occurred
twice as often as N-deficiency during drier seasons
(pre- and post-monsoon). These findings provide
perspective for the ongoing debate over N and P as
limiting nutrients in freshwater ecosystems by incor-
porating seasonality and corresponding hydrology.
We also re-visit long-standing assumptions regarding
the nutrient status of sub-tropical lakes. The warm,
stratified season does not fully illustrate lake pro-
cesses, and more research during dry periods will
inform how seasonality affects phytoplankton nutrient
deficiencies across aquatic systems.
Keywords Limiting nutrient � Monsoon �Phytoplankton � Nutrient stimulation experiments �Nitrogen � Phosphorus
Handling editor: David Philip Hamilton
Electronic supplementary material The online version ofthis article (https://doi.org/10.1007/s10750-019-3897-8) con-tains supplementary material, which is available to authorizedusers.
F. E. Rowland
Division of Biological Sciences, University of Missouri,
Columbia, MO 65211, USA
R. L. North (&) � P. McEachern �D. V. Obrecht � S. B. Jones � J. R. JonesSchool of Natural Resources, University of Missouri,
Columbia, MO 65211, USA
e-mail: [email protected]
P. McEachern
Civil and Environmental Engineering, University of
Alberta, Edmonton, AB T6G1H9, Canada
T. B. Gurung
Nepal Agricultural Research Council, Kathmandu, Nepal
Present Address:
F. E. Rowland
Cooperative Institute for Great Lakes Research (CIGLR),
University of Michigan, Ann Arbor, MI 48108, USA
123
Hydrobiologia
https://doi.org/10.1007/s10750-019-3897-8(0123456789().,-volV)(0123456789().,-volV)

Introduction
Nutrient limitation is a fundamental control on
primary production, algal biomass, and community
composition (Tilman, 1976). A key aspect of lake
science is to understand nutrient regulation of aquatic
communities to minimize the negative consequences
of eutrophication. There is debate in the literature
whether phosphorus (P), or both nitrogen (N) and P
ultimately limit freshwater phytoplankton (Lewis &
Wurtsbaugh, 2008; Paerl et al., 2016; Higgins et al.,
2017). The traditional paradigm suggests primary
production in temperate lakes is most strongly
controlled by P (Schindler, 1976; Guildford & Hecky,
2000; Schindler et al., 2016), while primary produc-
tion in tropical lakes is generally considered under
N-control (Dussart, 1974; Huszar et al., 2006; Abell
et al., 2010; Corman et al., 2015) related to terrestrial
processes (Downing et al., 1999). Empirical support
for this distinction comes from Huszar et al. (2006)
who found the Chlorophyll a (Chl a)-P relationship
weaker among tropical and sub-tropical lakes than the
temperate pattern, and from Jones et al. (1989) who
reported a strong Chl a-N relationship in productive,
sub-tropical lakes with low N:P ratios. Numerous
studies, however, show N and P co-deficiencies in
phytoplankton communities (Elser et al., 2007; North
et al., 2007; Sterner, 2008; Lewis & Wurtsbaugh,
2008; Harpole et al., 2011), N-deficiency in temperate
lakes (Morris & Lewis, 1988; Abell et al., 2010), and
P-deficiency in sub-tropical and tropical lakes (Rai,
2000; Guildford & Hecky, 2000; North et al., 2008).
Both N- and P-deficiencies have been measured in
tropical Thai reservoirs (Jones et al., 2000), sub-
tropical Australian reservoirs (Muhid & Burford,
2012), and the African Great Lakes (Guildford et al.,
2003; North et al., 2008).
Sub-tropical and tropical lakes are influenced by
seasonal trends (Li et al., 2014), especially in areas
affected by monsoons where intense rains result in
extreme hydrological events, which contrast sharply
with conditions during dry seasons (Lohman et al.,
1988; Jones et al., 1989; Jones & Jones, 2002; Corman
et al., 2015). Complex interactions of atmospheric
deposition, internal nutrient loading, surface runoff,
advective mixing, and light limitation make general-
izing patterns challenging in monsoon-influenced
lakes (Jones et al., 2009). Monsoon rains affect
approximately 60% of the world’s population (Jones
et al., 2009) where both increased drought and
intensity of tropical storms are expected with a
changing climate (Park & Schubert, 1997; Overpeck
& Cole, 2007). Given the extreme variability in global
precipitation patterns (Dore, 2005), additional under-
standing of how seasonality affects nutrient deficien-
cies to phytoplankton growth in monsoon-influenced
lakes is needed.
Seasonal variability in total N (TN) to total P (TP)
and particulate nutrient (carbon [C], N, P) ratios in the
Nepali lakes Phewa and Begnas Tal have been
observed historically in 1985 (Lohman et al., 1988),
1993–1997 (Rai, 2000), and 1997, 1998, and 2000
(Jones & Jones, 2002). In 1985, TN:TP ratios, applied
as indicators of potential phytoplankton nutrient
deficiencies, indicated N-deficiency [TN:TP\ 9 by
mass; thresholds from Guildford & Hecky (2000)] in
the pre-monsoon months (April–May; Lohman et al.,
1988). In the post-monsoon months (September–
October), the TN:TP ratios varied between 9 and 23
(Lohman et al., 1988) indicating deficiency in both N
and P or another limiting resource. Indicators of
N-deficiency were also reported in both the pre- and
post-monsoon seasons from 1997 to 2000 (Jones &
Jones, 2002). The particulate stoichiometric ratio of
year-round (i.e., monthly) samples indicated moderate
P- and N-deficiency of the phytoplankton communi-
ties (Rai, 2000) using the criteria of Healey & Hendzel
(1980). Nutrient ratios were not reported by month or
season by Rai (2000), however, preventing detailed
evaluation of seasonal nutrient deficiencies to phyto-
plankton growth.
Here we address how seasonality may affect
nutrient deficiencies to phytoplankton growth by
presenting 86 in situ NSEs in Phewa and Begnas Tal
conducted on a year-round, seasonal basis across a
decade. We assessed whether the phytoplankton
communities in these Nepali lakes, with strong
monsoon influence, experienced single nutrient defi-
ciency of either N or P, or co-deficiency of both using
year-round water column stoichiometry and in situ
nutrient stimulation experiments. We are interested in
whether the lakes exhibit different nutrient deficien-
cies during the monsoon and dry seasons and re-visit
long-standing assumptions regarding the nutrient
status of sub-tropical lakes.
123
Hydrobiologia

Materials and methods
Study area
The study lakes, Phewa and Begnas Tal, are warm
monomictic sub-tropical lakes located in the mid-hill
region of Nepal (Fig. 1). Phewa Tal is a mesotrophic
(Table 1; criteria from Jones et al., 2008) natural lake
that was formed by gravels and other materials
transported from the Annapurna range (Ross &
Gilbert, 1999), which has been impounded for hydro-
power, resulting in a maximum depth of * 22 m. It
has an area of 4.33 9 106 m2 and a rapid flushing rate,
particularly during the monsoon season (Table 2;
Sthapit & Leminen, 1992). Begnas Tal, in contrast, has
half the volume, a max depth of 11 m (Table 2), and is
also mesotrophic (Table 1; criteria from Jones et al.,
2008). Begnas, contained by a large dam along the
eastern shore, has a flushing rate less than 25% of
Phewa (12 vs. 53 times per year, respectively).
We defined seasonality based on precipitation and
temperature data from nearby Pokhara airport and
further supported by surface water temperatures in
both lakes (from 1987 to 2000 in Phewa Tal and from
1989 to 2000 in Begnas Tal), which we use as a proxy
for stratification (Fig. 2). Mean annual rainfall from
1984 to 2000 was approximately 4000 mm year-1.
Rainfall was strongly related to season (F2, 48 = 277.8,
P\ 0.001; Fig. 2a). Post-hoc Tukey tests indicated
the monsoon season (May–September) had signifi-
cantly (P\ 0.0001) higher rainfall than the other
seasons. More than 80% of annual precipitation occurs
during monsoon season, with the most intense rains in
July and August (Fig. 2a). Pre-monsoon (February–
April) and post-monsoon (October–January) seasons
were not significantly different in rainfall (Tukey test
Fig. 1 Map of Nepal with included lakes Phewa Tal and Begnas Tal
123
Hydrobiologia

P = 0.95), however, air temperature was different
(Fig. 2b). Pre- and post-monsoon seasons were
defined by periods of warming before (February–
April) and cooling after (October–January) the mon-
soon season (Fig. 2b, c). Both lakes begin to stratify
during the pre-monsoon and are typically stratified
during the monsoon with periodic disruption by direct
rainfall, wind, and inflow during intense storms
(occasionally[ 100 mm). The post-monsoon season
is a period of cooling temperatures and turnover (Rai,
2000). Air temperatures corresponded with surface
lake water temperatures; maximum temperatures
occurred during the monsoon (Fig. 2b, c). Surface
water temperatures in Begnas Tal were consis-
tently * 1.5�C higher than the larger lake, Phewa
Tal, on a year-round basis (Fig. 2c). We used these
seasonal divisions in precipitation and temperature to
examine how seasonality may affect nutrient deficien-
cies to phytoplankton communities in our study lakes.
Experimental set-up
Fifty-four nutrient stimulation experiments (NSEs)
were conducted in Phewa Tal during January–De-
cember across multiple years (1987, 1990, 1991,
1993–1998, and 2000). The experiments spanned the
seasons; 10 were during the pre-monsoon, 30 during
the monsoon, and 14 in post-monsoon months. We
conducted 32 experiments in Begnas Tal during
January–November across multiple years
(1989–1991, 1993–1998). In Begnas Tal, we had 6
pre-monsoon NSEs, 21 monsoon season NSEs, and 5
Table 1 Mean values of
limnological parameters in
Phewa Tal (1987–1998 and
2000) and Begnas Tal
(1989–1998 and 2000)
All samples were collected
from surface waters. For
each parameter, we show
the number of samples
collected (n), arithmetic
mean, and standard
deviation (SD). Monsoon
season is italicised for
clarity
Parameter Pre-monsoon Monsoon Post-monsoon
n Mean SD n Mean SD n Mean SD
Phewa Tal
Secchi (m) 24 4.2 1.1 86 2.7 0.7 31 3.0 0.5
TN (lg l-1) 34 248 83 88 209 72 59 239 74
TDN (lg l-1) 15 129 47 52 160 81 22 164 71
TP (lg l-1) 38 11 3 93 17 5 58 13 3
TDP (lg l-1) 15 5 1 51 8 2 21 5 2
TN:TP (mass) 34 25 10 83 14 6 58 19 8
TDN:TDP (mass) 14 29 14 50 23 14 21 38 19
Chl a (lg l-1) 32 6.2 2.3 72 6.4 3.6 55 13.7 4.5
NVSS (mg l-1) 15 0.8 1.3 49 3.0 5.2 33 1.5 1.2
Begnas Tal
Secchi (m) 11 2.8 0.9 24 3.3 0.9 9 2.2 0.7
TN (lg l-1) 13 404 129 39 219 75 17 458 210
TDN (lg l-1) 8 280 114 27 145 54 11 400 187
TP (lg l-1) 13 14 2 38 11 2 17 15 4
TDP (lg l-1) 8 6 2 27 5 1 12 6 1
TN:TP (mass) 13 31 8 38 21 7 17 31 12
TDN:TDP (mass) 8 52 24 27 31 16 11 69 34
Chl a (lg l-1) 11 7.9 3.0 34 3.8 1.3 17 12.0 6.6
NVSS (mg l-1) 8 1.1 0.7 20 0.9 0.8 13 1.0 0.5
Table 2 Physical descriptions of Phewa Tal and Begnas Tal
Phewa Begnas
Altitude (m) 750 650
Surface area (m2) 4.33 9 106 3.15 9 106
Watershed area (m2) 1.10 9 108 1.89 9 107
Volume (km3) 0.039 0.0023
Maximum depth (m) 23.0 11.0
Mean depth (m) 9.0 6.1
Flushing rate (times year-1) 53 12
Siltation rate (m3 year-1) 105,000 18,032
123
Hydrobiologia

post-monsoon NSEs. Our goal was to assess response
of Chl a (a proxy for phytoplankton) to the addition of
N, P, or both, relative to controls.
For each experiment, we used twelve 10 l cubitain-
ers filled with unfiltered surface water. In 1987, we
added nutrients at * 29 ambient levels, which were
225 lg l-1 N as KNO3 to N-only treatments, and
15 lg l-1 P as K2HPO4 to P-only treatments, and both
to N ? P treatments. After 1987, we continued adding
nutrients in excess, though at lower concentrations.
We added 150 lg l-1 N as NH4NO3 to N-only
treatments, 10 lg l-1 of P as K2HPO4 to P-only
treatments, and both to N ? P treatments to test
N ? P co-deficiency. Control treatments did not
receive nutrient additions. Each treatment was repli-
cated 3 times. Three experimental sets, each contain-
ing a replicate from each treatment were suspended
from anchor lines at half of the Secchi disk depth for
3–7 d in an open area of the lake. At the end of the
experiment, we collected the cubitainers and filtered
triplicate samples for Chl a from each replicate.
We measured Secchi disk depth, N, P, Chl a, and
non-volatile suspended solids (NVSS) in the surface
waters of both lakes at the same time as the NSEs
(Table 1; Jones et al., 1989). For N and P analyses, we
collected triplicate 10 ml sub-samples of lake water in
glass tubes of unfiltered water for total nutrients (TN
and TP), and filtrate (1 lm nominal pore size) for the
dissolved fraction [total dissolved N (TDN) and total
dissolved P (TDP)].
Lab analyses
We filtered the experimental water onto Gelman A/E
(1.0 lmnominal pore size) filters in triplicate to assess
phaeophytin corrected Chl a concentrations as proxies
for phytoplankton biomass. Samples were stored in
desiccant until they could be transported back to the
University of Missouri, Missouri, USA for analysis.
We processed Chl a filters using the fluorometry
methods of Knowlton (1984) and Sartory & Grobbe-
laar (1986). The N samples were preserved with
H2SO4 to a pH of 2 or below, and P samples were
stored and analyzed in sealed glass tubes.We analyzed
N using second derivative analysis of persulfate
oxidized samples (Crumpton et al., 1992) and P was
analyzed as in Prepas & Rigler (1982). NVSS were
measured by filtering a known quantity of water onto a
pre-ashed and weighed filter (Whatman 934-AH,
1.5 lm nominal pore size). After drying at 105�C for
1 h, filters were weighed to measure total suspended
solids, then ashed at 550�C for 20 min and re-weighed
to determine the organic fraction.
Fig. 2 Climate data from the Pokhara Airport (located in mid-
hill region of Nepal) between 1984 and 2000 and lake surface
temperatures collected on Phewa between 1987 and 2000 and on
Begnas between 1989 and 2000. a Bars are monthly precipi-
tation mean ± SE, and b boxplots of the mean maximum
temperature, and c symbols are monthly mean surface water
temperature ± SE. Open symbols represent Phewa Tal, and
closed symbols are Begnas Tal. Season is denoted by shading
and labeling. Note the pre-monsoon season starts in February
123
Hydrobiologia

Data analysis
We used multiple indicators of nutrient deficiency to
phytoplankton growth including in situ total nutrient
concentrations and NSEs as recommended by Hecky
& Kilham (1988). Ecological stoichiometric theory
states that organisms need to obtain elements from the
environment in a similar proportion to their own body
(Sterner & Elser, 2002). Thus, we considered mass
ratios of TN:TP[ 23 to be high N:P systems where
phytoplankton populations were likely P deficient, and
TN:TP\ 9 (by mass) were considered N-deficient.
Ratios between 9 and 23 indicate neither nutrient nor
both could be deficient, or another nutrient or
resource- such as light- could be limiting growth
(Guildford &Hecky, 2000). For NSEs, we assume that
a significant response to the addition of nutrients
relative to control indicates deficiency in the nutrient
added. We diagnose the nutrient status of phytoplank-
ton communities as the limitation on growth rates (i.e.,
Blackman limitation; Blackman, 1905). Use of the
term nutrient limitation, however, implies ultimate
control and cannot be assessed with short-term NSE
experiments. Thus, we define nutrient deficiency as
the proximate control on instantaneous growth of
phytoplankton, and co-deficiency as the simultaneous
limitation of phytoplankton growth rates by two or
more factors (in this case, N and P). When two or more
nutrients are below optimal concentrations, the addi-
tion of both will result in an increase in phytoplankton
biomass (Arrigo, 2005). Within a phytoplankton
community, this type of co-deficiency can be the
result of sub-optimal concentrations of one nutrient for
one species, and a different deficiency in another algal
species (Tilman, 1976).
Most statistical analyses were performed in R (R
Core Team 2018). Two-way analysis of variance
(ANOVA) on log-transformed Chl a concentrations
from each experiment allowed us to test how season
(pre-monsoon, monsoon, post-monsoon) and nutrient
treatment (?P, ?N, ?N?P) affected Chl a relative to
controls using the ‘lm’ function in base R. One-way
analysis of variance (ANOVA) tests were applied to
log-transformed (Chl a) values to assess how nutrient
treatment may affect algal response relative to controls
for each experiment followed by post-hoc Tukey HSD
tests to detect significant differences between nutrient
treatments using the ‘glht’ function in the ‘multcomp’
package (Hothorn et al., 2008). Initial Chl
a concentrations were not reported because a paired
t test indicated initials and controls were not signif-
icantly different (Phewa Tal: t = 1.67, df = 48,
P = 0.10; Begnas Tal: t = - 1.15, df = 28,
P = 0.26). Residual plots were examined to check
the assumptions of normality and heteroscedasticity,
and in rare instances, points identified as outliers in
Bonferroni outlier tests using ‘outlierTest’ in the ‘car’
package (Fox & Weisberg, 2011) were removed.
Pearson correlations calculated in SAS are presented
to illustrate cross-seasonal patterns among water
quality metrics and water temperature (all probability
levels are\ 0.01).
Results
Nepali lakes—nutrient inputs
Direct rainfall is the main source of water to both lake
basins (Rai, 2000). Water chemistry measured in
precipitation samples collected on 4 occasions in 1994
and 1998 contained 1200–7840 lg l-1 TN and
35–212 lg l-1 TP, resulting in TN:TP ratios between
18 and 42. A single sample of surface flow from a rice
paddy in the watershed had 110 lg l-1 TN and
12 lg l-1 TP (TN:TP of 9). Water samples collected
from the main inflowing stream to Phewa Tal, the
Harpan Khohla (n = 19 samples, not flow weighted),
averaged 220 lg l-1 TN and 47 lg l-1 TP, with an
average TN:TP of around 5 (data not shown). Nutrient
concentrations in the smaller tributaries to Phewa Tal
(n = 55 samples, not flow weighted) averaged
260 lg l-1 TN and 42 lg l-1 TP, with a TN:TP ratio
of 9. Inflow streams to Begnas Tal (n = 18 samples,
not flow weighted) averaged 160 lg l-1 TN and
27 lg l-1 TP, with a TN:TP ratio of 6.
Water samples collected from a sub-surface spring
located * 500 m to the east of the boat landing on the
north shore of Phewa Tal averaged 1880 lg l-1 TN
(n = 41) and 6 lg l-1 TP (n = 46); with a TN:TP ratio
averaging 483 and a TDN:TN ratio of unity (n = 24).
The spring flowwas oxic, with an average temperature
of 23�C. Conductivity of the spring averaged 324 lS(n = 24) compared with 46 lS in lake samples
(n = 60).
123
Hydrobiologia

Phewa Tal—lake water samples
In Phewa Tal TN averaged 230 lg l-1 (Table 1), but
varied with season (F2, 178 = 4.59, P = 0.0114).
Values were significantly lower during the monsoon
and higher pre- and post-monsoon (Fig. 3a) such that,
across seasons, TN showed a weak negative correla-
tion with water temperature (n = 224, r = - 0.29).
Some 10% of TN samples were\ 100
or[ 360 lg l-1, with these extremes generally mea-
sured during the monsoon and post-monsoon. TDN
averaged 150 lg l-1 (Table 1) and did not vary
significantly with season (F2, 86 = 1.21, P = 0.3023),
although values peaked during the monsoon and post-
monsoon (Fig. 4a). TDN averaged about two-thirds of
TN, but values at half this average were common in
each season. Mean TP was 14 lg l-1 (Table 1); 90%
of the values were B 20 lg l-1 with little seasonal
fluctuation except during the monsoon
(F2, 186 = 13.24, P\ 0.0001; Fig. 3a). Across sea-
sons, TP was strongly correlated with NVSS (n = 162,
r = 0.89) but not with TN. About 45% of TP was in
dissolved form (Table 1), with monsoon values higher
than other seasons (F2, 84 = 22.85, P\ 0.0001).
TN:TP ratios averaged 20 (Table 1), with about
two-thirds of the values between 9 and 23, indicating
Phewa was frequently co-deficient in N and P or was
Fig. 3 In-lake nutrient TN:TP (by mass) ratios and nutrient
concentrations for a Phewa Tal and b Begnas Tal. TN:TP[ 23
suggests P-deficiency and\ 9 suggests N-deficiency (Guildford
&Hecky, 2000), indicated on figure with horizontal lines. Ratios
between these thresholds indicate either nutrient or both could
be deficient. Left hand axes are logged scale. Each point
represents the mean and standard deviation for each month from
surface water samples. Monsoon season is shaded for clarity
Fig. 4 In-lake dissolved nutrient concentrations for a Phewa
Tal and b Begnas Tal. Left hand axes is logged scale and
represents both total dissolved phosphorus (TDP) and total
dissolved nitrogen (TDN) concentrations. Each point represents
the mean and standard deviation for each month from surface
water samples. Monsoon season is shaded for clarity
123
Hydrobiologia
limited by another nutrient or resource (Fig. 3a).
TN:TP ratios significantly varied among seasons
(F2, 177 = 23.05, P\ 0.0001), and averaged 25, 15,
and 19 in pre-, monsoon, and post-monsoon samples,
respectively (Table 1). Ratios potentially indicated
N-deficiency (\ 9) in 6% of pre-monsoon, 25% of
monsoon, and 3% of post-monsoon samples. P-defi-
ciency ([ 23) was potentially indicated in 52%, 10%,
and 20% of pre, monsoon, and post-monsoon, respec-
tively (Fig. 3a).
Chl a averaged 8.8 lg 1-1 (Table 1), and was
significantly higher post-monsoon, with averages of
6.2, 6.4, and 13.7 lg 1-1 during the pre-, monsoon,
and post–monsoon, respectively (F2, 156 = 62.03,
P\ 0.0001; Table 1). Phewa Tal had a mean Secchi
disk depth of 3.3 m, with seasonal variability
(F2, 138 = 35.21, P\ 0.0001). During pre-monsoon,
values averaged * 4 m, but monsoon and post-mon-
soon Secchi disk depths were closer to 3 m (Table 1),
with individual values from 0.5 to 6 m. Secchi disk
transparency was negatively correlated with NVSS
(n = 82) and TP (n = 174) with r values of * - 0.70.
Phewa Tal—nutrient stimulation experiments
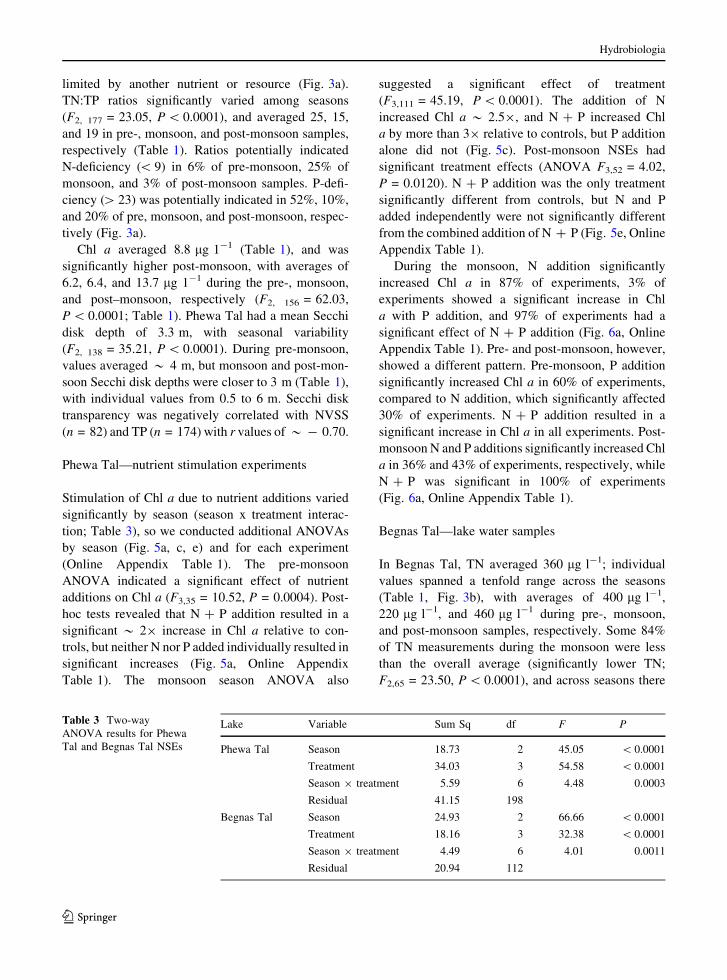
Stimulation of Chl a due to nutrient additions varied
significantly by season (season x treatment interac-
tion; Table 3), so we conducted additional ANOVAs
by season (Fig. 5a, c, e) and for each experiment
(Online Appendix Table 1). The pre-monsoon
ANOVA indicated a significant effect of nutrient
additions on Chl a (F3,35 = 10.52, P = 0.0004). Post-
hoc tests revealed that N ? P addition resulted in a
significant * 29 increase in Chl a relative to con-
trols, but neither N nor P added individually resulted in
significant increases (Fig. 5a, Online Appendix
Table 1). The monsoon season ANOVA also
suggested a significant effect of treatment
(F3,111 = 45.19, P\ 0.0001). The addition of N
increased Chl a * 2.59, and N ? P increased Chl
a by more than 39 relative to controls, but P addition
alone did not (Fig. 5c). Post-monsoon NSEs had
significant treatment effects (ANOVA F3,52 = 4.02,
P = 0.0120). N ? P addition was the only treatment
significantly different from controls, but N and P
added independently were not significantly different
from the combined addition of N ? P (Fig. 5e, Online
Appendix Table 1).
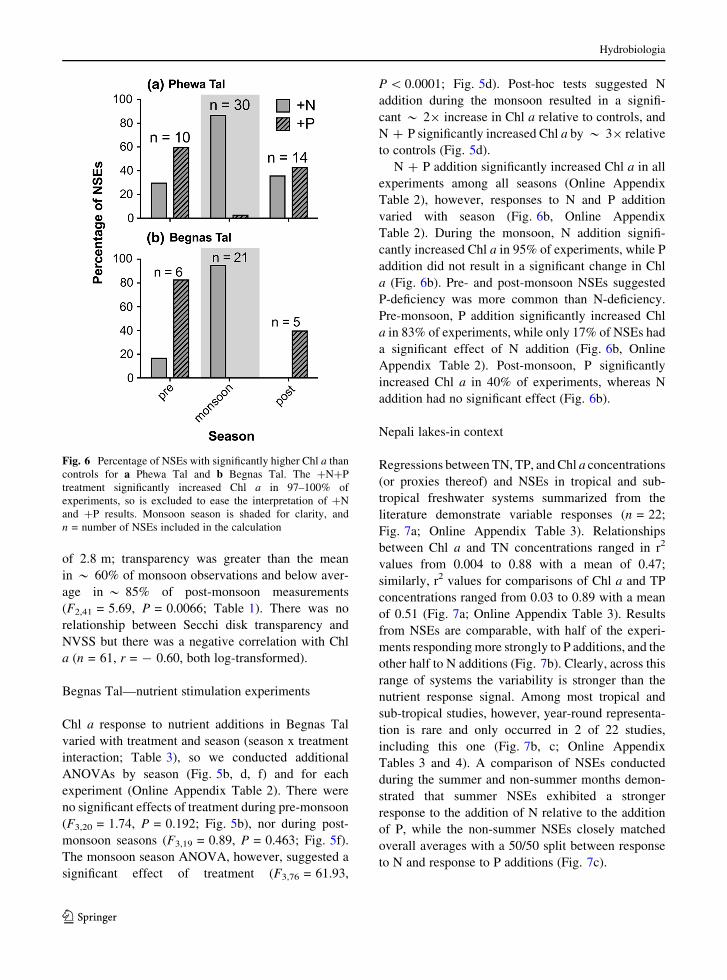
During the monsoon, N addition significantly
increased Chl a in 87% of experiments, 3% of
experiments showed a significant increase in Chl
a with P addition, and 97% of experiments had a
significant effect of N ? P addition (Fig. 6a, Online
Appendix Table 1). Pre- and post-monsoon, however,
showed a different pattern. Pre-monsoon, P addition
significantly increased Chl a in 60% of experiments,
compared to N addition, which significantly affected
30% of experiments. N ? P addition resulted in a
significant increase in Chl a in all experiments. Post-
monsoon N and P additions significantly increased Chl
a in 36% and 43% of experiments, respectively, while
N ? P was significant in 100% of experiments
(Fig. 6a, Online Appendix Table 1).
Begnas Tal—lake water samples
In Begnas Tal, TN averaged 360 lg l-1; individual
values spanned a tenfold range across the seasons
(Table 1, Fig. 3b), with averages of 400 lg l-1,
220 lg l-1, and 460 lg l-1 during pre-, monsoon,
and post-monsoon samples, respectively. Some 84%
of TN measurements during the monsoon were less
than the overall average (significantly lower TN;
F2,65 = 23.50, P\ 0.0001), and across seasons there
Table 3 Two-way
ANOVA results for Phewa
Tal and Begnas Tal NSEs
Lake Variable Sum Sq df F P
Phewa Tal Season 18.73 2 45.05 \ 0.0001
Treatment 34.03 3 54.58 \ 0.0001
Season 9 treatment 5.59 6 4.48 0.0003
Residual 41.15 198
Begnas Tal Season 24.93 2 66.66 \ 0.0001
Treatment 18.16 3 32.38 \ 0.0001
Season 9 treatment 4.49 6 4.01 0.0011
Residual 20.94 112
123
Hydrobiologia

was a strong negative correlation with water temper-
ature (n = 98, r = -0.76). TDN averaged 275 lg l-1,
with values peaking above average during post-
monsoon (Fig. 4b) and significantly lower TDN
during the monsoon (F2,43 = 22.06, P\ 0.0001;
Table 1). TDN averaged about two-thirds of TN; the
2 forms of N were strongly correlated (n = 116,
r = 0.89). Mean TP was 13 lg l-1 with values lower
in the monsoon relative to other seasons
(F2,65 = 10.84, P = 0.0009; Fig. 3b). Across all sam-
ples, TP was negatively correlated with water tem-
perature (n = 98, r = - 0.60) and positively
correlated with TN (n = 212, r = 0.63) and NVSS
(n = 82, r = 0.43). About 47% of TP was in the
dissolved form (Table 1), with lowest values during
the monsoon period, although none of the seasons
were significantly different (F2,44 = 2.30, P = 0.1124;
Table 1). TN:TP ratios averaged 28, with some 55%
of the ratios[ 23, suggesting Begnas was frequently
P limited (Fig. 3b) and\ 5% of the values indicated
N-deficiency. During the monsoon, however, 60% of
the samples indicated co-deficiency in N and P or
control by another resource (between 9 and 23), and
TN:TP was significantly lower than in the other two
seasons (F2,65 = 11.96, P = 0.0004).
Chl a concentrations averaged 7.9 lg l-1 (Table 1)
with significantly lower values during the monsoon
(F2,59 = 42.90, P\ 0.0001; seasonal mean
3.8 lg l-1) relative to the pre- and post-monsoon
(means 7.9 lg l-1 and 12 lg l-1; Table 1). Chl a was
negatively correlated with water temperature (n = 93,
r = - 0.64). Begnas Tal had a mean Secchi disk depth
Fig. 5 Summary of NSEs
from Phewa Tal (a, c, e) andBegnas Tal (b, d,f) separated by season.
Horizontal line represents
the mean, and error bars
are ± standard deviation.
Different letters indicate
significant differences in
Tukey HSD tests. Note:
y-axis changes with season
and lake
123
Hydrobiologia
of 2.8 m; transparency was greater than the mean
in * 60% of monsoon observations and below aver-
age in * 85% of post-monsoon measurements
(F2,41 = 5.69, P = 0.0066; Table 1). There was no
relationship between Secchi disk transparency and
NVSS but there was a negative correlation with Chl
a (n = 61, r = - 0.60, both log-transformed).
Begnas Tal—nutrient stimulation experiments
Chl a response to nutrient additions in Begnas Tal
varied with treatment and season (season x treatment
interaction; Table 3), so we conducted additional
ANOVAs by season (Fig. 5b, d, f) and for each
experiment (Online Appendix Table 2). There were
no significant effects of treatment during pre-monsoon
(F3,20 = 1.74, P = 0.192; Fig. 5b), nor during post-
monsoon seasons (F3,19 = 0.89, P = 0.463; Fig. 5f).
The monsoon season ANOVA, however, suggested a
significant effect of treatment (F3,76 = 61.93,
P\ 0.0001; Fig. 5d). Post-hoc tests suggested N
addition during the monsoon resulted in a signifi-
cant * 29 increase in Chl a relative to controls, and
N ? P significantly increased Chl a by * 39 relative
to controls (Fig. 5d).
N ? P addition significantly increased Chl a in all
experiments among all seasons (Online Appendix
Table 2), however, responses to N and P addition
varied with season (Fig. 6b, Online Appendix
Table 2). During the monsoon, N addition signifi-
cantly increased Chl a in 95% of experiments, while P
addition did not result in a significant change in Chl
a (Fig. 6b). Pre- and post-monsoon NSEs suggested
P-deficiency was more common than N-deficiency.
Pre-monsoon, P addition significantly increased Chl
a in 83% of experiments, while only 17% of NSEs had
a significant effect of N addition (Fig. 6b, Online
Appendix Table 2). Post-monsoon, P significantly
increased Chl a in 40% of experiments, whereas N
addition had no significant effect (Fig. 6b).
Nepali lakes-in context
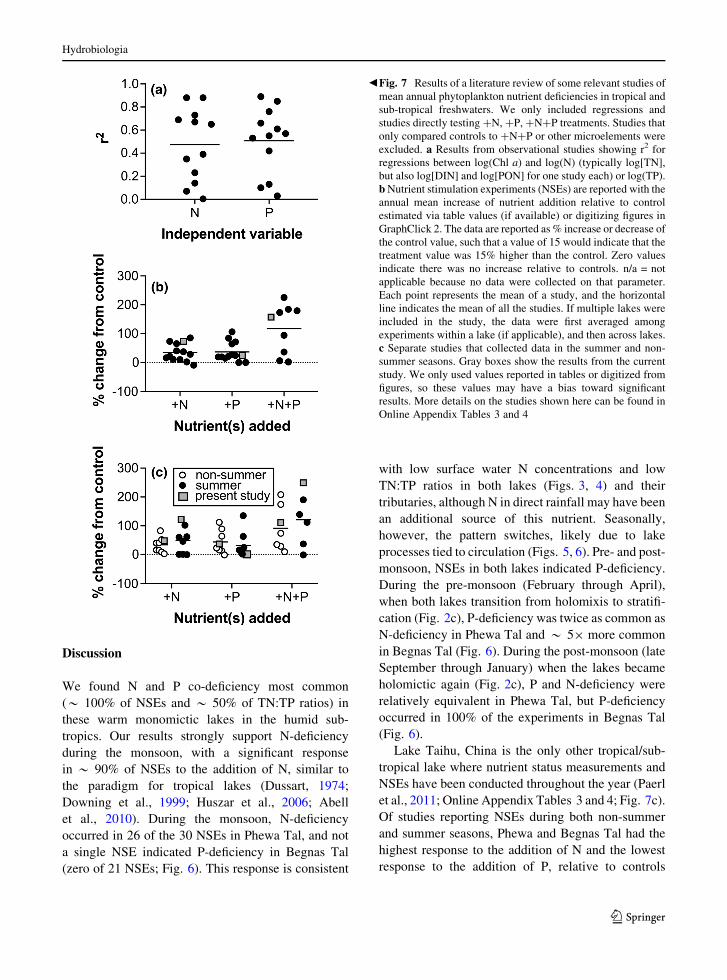
Regressions between TN, TP, andChl a concentrations
(or proxies thereof) and NSEs in tropical and sub-
tropical freshwater systems summarized from the
literature demonstrate variable responses (n = 22;
Fig. 7a; Online Appendix Table 3). Relationships
between Chl a and TN concentrations ranged in r2
values from 0.004 to 0.88 with a mean of 0.47;
similarly, r2 values for comparisons of Chl a and TP
concentrations ranged from 0.03 to 0.89 with a mean
of 0.51 (Fig. 7a; Online Appendix Table 3). Results
from NSEs are comparable, with half of the experi-
ments respondingmore strongly to P additions, and the
other half to N additions (Fig. 7b). Clearly, across this
range of systems the variability is stronger than the
nutrient response signal. Among most tropical and
sub-tropical studies, however, year-round representa-
tion is rare and only occurred in 2 of 22 studies,
including this one (Fig. 7b, c; Online Appendix
Tables 3 and 4). A comparison of NSEs conducted
during the summer and non-summer months demon-
strated that summer NSEs exhibited a stronger
response to the addition of N relative to the addition
of P, while the non-summer NSEs closely matched
overall averages with a 50/50 split between response
to N and response to P additions (Fig. 7c).
Fig. 6 Percentage of NSEs with significantly higher Chl a than
controls for a Phewa Tal and b Begnas Tal. The ?N?P
treatment significantly increased Chl a in 97–100% of
experiments, so is excluded to ease the interpretation of ?N
and ?P results. Monsoon season is shaded for clarity, and
n = number of NSEs included in the calculation
123
Hydrobiologia
Discussion
We found N and P co-deficiency most common
(* 100% of NSEs and * 50% of TN:TP ratios) in
these warm monomictic lakes in the humid sub-
tropics. Our results strongly support N-deficiency
during the monsoon, with a significant response
in * 90% of NSEs to the addition of N, similar to
the paradigm for tropical lakes (Dussart, 1974;
Downing et al., 1999; Huszar et al., 2006; Abell
et al., 2010). During the monsoon, N-deficiency
occurred in 26 of the 30 NSEs in Phewa Tal, and not
a single NSE indicated P-deficiency in Begnas Tal
(zero of 21 NSEs; Fig. 6). This response is consistent
with low surface water N concentrations and low
TN:TP ratios in both lakes (Figs. 3, 4) and their
tributaries, although N in direct rainfall may have been
an additional source of this nutrient. Seasonally,
however, the pattern switches, likely due to lake
processes tied to circulation (Figs. 5, 6). Pre- and post-
monsoon, NSEs in both lakes indicated P-deficiency.
During the pre-monsoon (February through April),
when both lakes transition from holomixis to stratifi-
cation (Fig. 2c), P-deficiency was twice as common as
N-deficiency in Phewa Tal and * 59 more common
in Begnas Tal (Fig. 6). During the post-monsoon (late
September through January) when the lakes became
holomictic again (Fig. 2c), P and N-deficiency were
relatively equivalent in Phewa Tal, but P-deficiency
occurred in 100% of the experiments in Begnas Tal
(Fig. 6).
Lake Taihu, China is the only other tropical/sub-
tropical lake where nutrient status measurements and
NSEs have been conducted throughout the year (Paerl
et al., 2011; Online Appendix Tables 3 and 4; Fig. 7c).
Of studies reporting NSEs during both non-summer
and summer seasons, Phewa and Begnas Tal had the
highest response to the addition of N and the lowest
response to the addition of P, relative to controls
bFig. 7 Results of a literature review of some relevant studies of
mean annual phytoplankton nutrient deficiencies in tropical and
sub-tropical freshwaters. We only included regressions and
studies directly testing ?N, ?P, ?N?P treatments. Studies that
only compared controls to ?N?P or other microelements were
excluded. a Results from observational studies showing r2 for
regressions between log(Chl a) and log(N) (typically log[TN],
but also log[DIN] and log[PON] for one study each) or log(TP).
bNutrient stimulation experiments (NSEs) are reported with the
annual mean increase of nutrient addition relative to control
estimated via table values (if available) or digitizing figures in
GraphClick 2. The data are reported as % increase or decrease of
the control value, such that a value of 15 would indicate that the
treatment value was 15% higher than the control. Zero values
indicate there was no increase relative to controls. n/a = not
applicable because no data were collected on that parameter.
Each point represents the mean of a study, and the horizontal
line indicates the mean of all the studies. If multiple lakes were
included in the study, the data were first averaged among
experiments within a lake (if applicable), and then across lakes.
c Separate studies that collected data in the summer and non-
summer seasons. Gray boxes show the results from the current
study. We only used values reported in tables or digitized from
figures, so these values may have a bias toward significant
results. More details on the studies shown here can be found in
Online Appendix Tables 3 and 4
123
Hydrobiologia

during summer (Online Appendix Table 4). Our
results match other findings in non-summer months;
Phewa and Begnas Tal had the 2nd and 3rd highest
response to the addition of N and P, respectively,
relative to controls (Online Appendix Table 4).
In Lake Titicaca, a high-altitude tropical lake in
Peru and Bolivia, N-deficiency was common until
winter, when turnover brought such large quantities of
N and P to the surface that neither were deficient
(Vincent et al., 1984). N-deficiency was predominant
during dry weather in Lake Atitlan, Guatemala, but
tropical storms switched the phytoplankton to P-defi-
ciency (Corman et al., 2015). Even alpine lakes show
highly temporal patterns of phytoplankton nutrient
deficiency during ice-free months from May to
November (Morris & Lewis, 1988). Collectively,
these results underscore the importance of incorporat-
ing year-round measurements into the N vs. P debate
(Lewis & Wurtsbaugh, 2008; Paerl et al., 2016;
Higgins et al., 2017).
The role of monsoons in thermal stratification
Monsoon rains impact thermal stratification in sub-
tropical lakes (Davis et al., 1998; An & Jones, 2002;
Jones et al., 2006), often expanding the mixed layer,
while extreme rain events create density-dependent
interflows, which have little direct influence on the
epilimnion (Jones et al., 2009). Historically, interflows
have been measured intermittently in Phewa Tal
(Lohman et al., 1988; Davis et al., 1998; Jones et al.,
2009) and their impact captured during isolated
sampling events such as August 1998. During that
inflow event, lake TP declined by half in 6 days (from
60 to 30 lg l-1, no NSE experiments were set at this
time) concurrent with a doubling of Secchi disk
transparency (from 0.5 to 1 m) and a 75% decline in
NVSS (from 26 to 6 mg l-1, data not shown).
A sub-surface spring is a source of N to Phewa Tal
with an influence that varies across seasons. In warmer
months, the cool spring water descends to the metal-
imnion and affiliated nutrients are largely unavailable
to pelagic phytoplankton, but support the sub-surface
algal layer (Lohman et al., 1988; Davis et al., 1998).
During winter mixis, however, N-rich spring inflow
and lake temperatures are similar (* 23�C; Fig. 2c),thereby serving as a source of N to algal communities
in the photic zone.
Why does N-deficiency not dominate
during the pre- and post-monsoon seasons?
Identification of P-deficiency during the holomictic
pre- and post-monsoon seasons indicates that either
external or internal (or both) P loading is reduced
relative to during the monsoon. It could also indicate
an increased supply of N during these seasons- either
from external or internal sources.
Another potential component of the lake nutrient
budget is internal loading (Beutel, 2006; Taylor &
Nurnberg, 2009; Orihel et al., 2017). Based on
seasonal patterns, we hypothesize that seasonal P-de-
ficiency, measured during pre- and post-monsoon, was
under internal rather than external nutrient control.
The flux of N from lake sediments serves as an internal
source of N; dissolved N forms such as ammonium
accumulate in anoxic hypolimnia (Beutel, 2006; Wu
et al., 2017) until circulated throughout the water
column during mixis. Rai (2000) documented this
pattern in both lakes during 1993–1997 (concurrent
with this study). Our data showed dissolved N formed
the majority of TN (80–100%) in lake water samples
during post-monsoon, with minimums during the
monsoon, which is consistent with internal loading.
Further support by Gurung et al. (2006) shows
dissolved inorganic N (DIN) in bottom water
increased from June to October in Phewa Tal and
was higher in surface samples. Total and dissolved N
values in both lakes showed a seasonal increase during
dry-season, concurrent with turnover and holomixis
(Figs. 2c, 3, 4). This pattern suggests internal N
loading (Presing et al., 2001; Beutel, 2006; Wu et al.,
2017), and supports that internal loading of hypolim-
netic ammonium contributed to the switch from
N-deficiency to P-deficiency in both lakes.
Sediment release and the warm monomictic ther-
mal pattern would likewise govern internal P loading,
an important feature of the P budget in many lakes, but
is also linked to iron (Fe) biogeochemistry (Orihel
et al., 2017). TP concentrations were similar between
surface and bottom waters during the monsoon
(Gurung et al., 2006), and our data showed TP
increased in Begnas during mixis (Fig. 3b), but not
in Phewa (Fig. 3a). Ferric hydroxides readily formed
when hypolimnetic samples from Phewa were
exposed to oxygen, a phenomenon that was not
similarly noticeable in Begnas samples. Greater
precipitation of Fe-phosphate during mixis (Mortimer,
123
Hydrobiologia
1941) in Phewa Tal likely accounts for this observed
difference. TN and TP were correlated in Begnas but
not in Phewa. In both lakes, however, TN:TP ratios
increased to[ 23 during turnover and subsequently
declined during the pre-monsoon season (Fig. 3). In
sub-tropical Australian reservoirs, high DIN:DIP
(dissolved inorganic P) ratios were also observed in
bottom waters during stratification providing further
evidence for increased release of DIN relative to DIP
from sediments (Burford et al., 2012). In our study, the
proportion of TP that was dissolved did not vary
among seasons regardless of stratification, suggesting
that sediments were not a significant source of
dissolved P to Phewa and Begnas Tal. In addition,
the ratio of TN:TP reflects changing N concentrations,
with P concentrations remaining relatively consistent
in both total and dissolved forms across seasons.
Maximum Chl a concentrations occurred in post-
monsoon samples, presumably in response to internal
N. Our data suggest N limitation dominates in Phewa
and Begnas Tal during the monsoon when nutrient
loading is primarily terrestrially-derived (Downing
et al., 1999; Gal et al., 2016). In the mid-hills of Nepal,
agriculture plays a dominant role (Ross & Gilbert,
1999) and has intensified because of a switch from
subsistence- to market-based crops (Dahal et al.,
2009). This increase in agriculture increases both N
and P fluxes to aquatic systems (Dahal et al., 2007),
which would be diluted during the wet monsoon
season (Collins & Jenkins, 1996). Both lakes are
heavily influenced by siltation from agricultural
practices within their watersheds (Collins & Jenkins,
1996; Ross & Gilbert, 1999; Rai, 2000). Internal
processes play a more prominent role in the pre- and
post-monsoon seasons, which is why they exhibit P
limitation and not the hypothesized N limitation. We
provide evidence that nutrient deficiencies to phyto-
plankton growth can switch with season, and this may
be especially important to consider in monsoon-
influenced sub-tropical lakes surrounded by areas of
intense agriculture.
The role of light in monsoon-influenced lakes
Light plays a key role in regulating phytoplankton
biomass and nutrient uptake (Falkowski & Raven,
2007; Jones et al., 2009; Dubourg et al., 2015).
Chlorophyll a, our proxy for phytoplankton response
in NSEs, is influenced by changing light conditions
(Falkowski & Raven, 2007). Phytoplankton can
photoacclimate to higher/lower light conditions by
reducing/increasing light harvesting pigments such as
Chl a (Arrigo et al., 2010). In our NSEs, there were no
significant differences between initial Chl a concen-
trations and control values post-incubation, suggesting
phytoplankton, exposed at half the Secchi depth, did
not experience an appreciable change in their light
environment during the experiments, nor did they
exhibit indicators of light deficiency under initial
conditions. We interpret the NSEs as responses to
nutrient addition, independent of the complications of
light limitation.
The importance of multiple scales of assessment
and year-round studies
Experiments such as NSEs cannot entirely represent
lake conditions, and have been criticized for limited
realism (Hecky & Kilham, 1988; Carpenter, 1996).
Our NSEs were supported using TN:TP as an
additional indicator of nutrient deficiency to phyto-
plankton growth and both approaches suggested a
strong seasonal component. The TN:TP ratios broadly
agreed with NSE results, with two main differences.
P-deficiency as determined by TN:TP ratios occurred
more often than indicated by our NSEs, especially in
Begnas Tal (Fig. 3). Additionally, TN:TP ratios failed
to capture the N-deficiency during the monsoon,
which was strongly supported by NSEs. This lack of
agreement may be because seston N:P is considered
more reliable to assess algal nutritional status (Healey
& Hendzel, 1980), as total fractions include N and P in
all forms, some of which are not readily accessible to
algae. This concern may be particularly relevant to our
study where the majority of total nutrients were in
dissolved form (Table 1).
Conclusions
To our knowledge, this is one of few studies to
comprehensively examine seasonality and nutrient
deficiencies to phytoplankton growth in sub-tropical
lakes over multiple years. Our data suggest we cannot
apply understanding of phytoplankton nutrient defi-
ciencies in temperate lakes to sub-tropical lakes that
often experience different temperature and precipita-
tion and thus, nutrient regimes. Flooding due to
climate change is increasing globally (Doll & Zhang,
123
Hydrobiologia
2010), which mobilizes nutrients from the watershed
and increases nutrient loading to downstream water
bodies, particularly when agricultural lands flood
(McCullough et al., 2012). Thus, the seasonal changes
in hydrology and physical lake mixing patterns could
strongly influence the nutrient status of phytoplankton
communities. Furthermore, light deficiencies may
play an important, interacting role with the presence
and type of nutrient deficiencies to phytoplankton
growth (Dubourg et al., 2015). Our data underscore the
complexities of lakes and emphasize the need for more
research on how seasonality may influence lentic
nutrient dynamics on a global scale.
Previous work suggests sub-tropical and tropical
lakes tend to be N-deficient (Dussart, 1974; Jones
et al., 1989; Downing et al., 1999; Abell et al., 2010).
This paradigm applies during most of the year in our
study lakes. We measured N-deficiency during the
monsoon season, but both lakes switched to P-defi-
ciency during holomixis. Most global lake studies are
conducted during a 4–6 month period, ignoring nutri-
ent dynamics during other seasons—especially in the
sub-tropics and tropics where much of the precipita-
tion occurs seasonally. Year-round sampling will
further illustrate how seasonality affects nutrient
deficiencies and thus response to nutrient management
strategies in aquatic systems. We emphasize the
importance of this perspective when considering the
application of nutrient management strategies on a
global basis.
Acknowledgements We thank Erin Petty for making
Figure. 1. We also thank Jennifer Parris, Jennifer Graham,
John MacEachern, Robert Bacon, Bruce Perkins, Glenn Wylie,
Lance Dorsey, Prem Nepali, and IUCN Nepal for their
assistance during the study. We thank Gertrud Nurnberg for
advice on internal nutrient loading. This work was supported by
the National Science Foundation (INT-9602105).
References
Abell, J. M., D. Ozkundakci & D. P. Hamilton, 2010. Nitrogen
and phosphorus limitation of phytoplankton growth in New
Zealand lakes: implications for eutrophication control.
Ecosystems 13: 966–977.
Abell, J. M., D. Ozkundakci, D. P. Hamilton & J. R. Jones, 2012.
Latitudinal variation in nutrient stoichiometry and
chlorophyll-nutrient relationships in lakes: A global study.
Fundamental & Applied Limnology 181: 1–14.
An, K. G. & J. R. Jones, 2002. Reservoir response to the Asian
monsoon with emphasis on longitudinal gradients. Journal
of Freshwater Ecology 17: 151–160.
Arrigo, K. R., 2005. Marine microorganisms and global nutrient
cycles. Nature 437: 349–355.
Arrigo, K. R., M. M. Mills, L. R. Kropuenske, G. L. van Dijken,
A.-C. Alderkamp & D. H. Robinson, 2010. Photophysiol-
ogy in two major Southern Ocean phytoplankton taxa:
photosynthesis and growth of Phaeocystis antarctica and
Fragilariopsis cylindrus under different irradiance levels.
Integr Comp Biol 50: 950–966.
Bayer, T. K., M. Schallenberg & C. E. Martin, 2008. Investi-
gation of nutrient limitation status and nutrient pathways in
Lake Hayes, Otago, New Zealand: a case study for inte-
grated lake assessment. New Zealand Journal of Marine
and Freshwater Research 42: 285–295.
Blackman, F. F., 1905. Optima and limiting factors. Ann Bot 19:
281–295.
Beutel, M.W., 2006. Inhibition of ammonia release from anoxic
profundal sediments in lakes using hypolimnetic oxy-
genation. Ecological Engineering 28: 271–279.
Burford, M. A., S. A. Green, A. J. Cook, S. A. Johnson, J.
G. Kerr & K. R. O’Brien, 2012. Sources and fate of
nutrients in a subtropical reservoir. Aquatic Sciences 74:
179–190.
Carpenter, S. R., 1996. Microcosm experiments have limited
relevance for community and ecosystem ecology. Ecology
77: 677–680.
Collins, R. & A. Jenkins, 1996. The impact of agricultural land
use on stream chemistry in the Middle Hills of the Hima-
layas. Nepal. Journal of Hydrology 185: 71–86.
Corman, J. R., E. Carlson, M. Dix, N. Giron, A. Roegner, J.
Vesela, S. Chandra, J. J. Elser & E. Rejmankova, 2015.
Nutrient dynamics and phytoplankton resource limitation
in a deep tropical mountain lake. Inland Waters 5:
371–386.
Crumpton, W. G., T. M. Isenhart & P. D. Mitchell, 1992. Nitrate
and organic N analyses with second-derivative spec-
troscopy. Limnology & Oceanography 37: 907.
Dahal, B. M., I. Nyborg, B. K. Sitaula & R. M. Bajracharya,
2009. Agricultural intensification: food insecurity to
income security in a mid-hill watershed of Nepal. Inter-
national Journal of Agricultural Sustainability 7: 249–260.
Dahal, B. M., B. K. Sitaula, S. Sharma & R. M. Bajracharya,
2007. Effects of agricultural intensification on the quality
of rivers in rural watersheds of Nepal. J Food Agric
Environ 5: 341.
Davis, M. F., T. B. Gurung, B. Shrestha, S. B. Jones, G.
D. Wylie, B. D. Perkins & J. R. Jones, 1998. Use of a
subsurface plankton layer to benefit a cage-culture fishery
in Lake Phewa. Nepal. Internationale Vereinigung fur
Theoretische und Angewandte Limnologie Verhandlungen
26: 2220–2227.
Doll, P. & J. Zhang, 2010. Impact of climate change on fresh-
water ecosystems: a global-scale analysis of ecologically
relevant river flow alterations. Hydrology and Earth Sys-
tem Sciences 14: 783–799.
Dore, M. H., 2005. Climate change and changes in global pre-
cipitation patterns: what do we know? Environ Int 31:
1167–1181.
123
Hydrobiologia
Downing, J., M. McClain, R. Twilley, J. Melack, J. Elser, N.
Rabalais, W. Lewis, R. Turner, J. Corredor & D. Soto,
1999. The impact of accelerating land-use change on the
N-cycle of tropical aquatic ecosystems: current conditions
and projected changes. Biogeochemistry 46: 109–148.
Downs, T., M. Schallenberg & C. Burns, 2008. Responses of
lake phytoplankton to micronutrient enrichment: a study of
two New Zealand lakes and an analysis of published data.
Aquatic Sciences 70: 347–360.
Dubourg, P., R. L. North, K. Hunter, D. M. Vandergucht, O.
Abirhire, G. M. Silsbe, S. J. Guildford & J. J. Hudson,
2015. Light and nutrient co-limitation of phytoplankton
communities in a large reservoir: Lake Diefenbaker, Sas-
katchewan, Canada. Journal of Great Lakes Research 41:
129–143.
Dussart, B., 1974. Biology of inland waters in humid tropical
Asia. UNESCONatural Resources of Humid Tropical Asia
Nat Resour Res 12: 331–353.
Elser, J. J., M. E. Bracken, E. E. Cleland, D. S. Gruner, W.
S. Harpole, H. Hillebrand, J. T. Ngai, E. W. Seabloom, J.
B. Shurin & J. E. Smith, 2007. Global analysis of nitrogen
and phosphorus limitation of primary producers in fresh-
water, marine and terrestrial ecosystems. Ecology Letters
10: 1135–1142.
Falkowski, P. G. & J. A. Raven, 2007. Aquatic Photosynthesis.
Princeton University Press, Princeton, New Jersey.
Fox, J. & S. Weisberg. 2011. An R Companion to Applied
Regression, Second Edition. Thousand Oaks CA: Sage.
http://socserv.socsci.mcmaster.ca/jfox/Books/Companion.
Gal, J.-K., G. Ock, H.-K. Park & K.-H Shin, 2016. The effect of
summer monsoon on pelagic and littoral food webs in a
large regulated reservoir (Lake Paldang, Korea): A
stable isotope approach. Journal of Freshwater Ecology 31
(3): 327–340.
Guildford, S. J. & R. E. Hecky, 2000. Total nitrogen, total
phosphorus, and nutrient limitation in lakes and oceans: Is
there a common relationship? Limnology &Oceanography
45: 1213–1223.
Guildford, S. J., R. E. Hecky, W. D. Taylor, R. Mugidde & H.
A. Bootsma, 2003. Nutrient enrichment experiments in
tropical great lakes Malawi/Nyasa and Victoria. Journal of
Great Lakes Research 29: 89–106.
Gurung, T. B., R. P. Dhakal & J. D. Bista, 2006. Phytoplankton
primary production, chlorophyll-a and nutrient concentra-
tions in the water column of mountainous Lake Phewa,
Nepal. Lakes and Reservoirs: Research and Management
11 (3): 141–148.
Gurung, T. B., R. P. Dhakal, M. Husen & J. R. Jones, 2010.
Abundance and nutrient limiting growth rate of hetero-
trophic bacterio-plankton in Himalayan foot hill Lake
Phewa, Nepal. Lakes & Reservoirs: Research & Manage-
ment 15: 53–61.
Harpole, W. S., J. T. Ngai, E. E. Cleland, E. W. Seabloom, E.
T. Borer, M. E. Bracken, J. J. Elser, D. S. Gruner, H.
Hillebrand & J. B. Shurin, 2011. Nutrient co-limitation of
primary producer communities. Ecology Letters 14:
852–862.
Healey, F. P. & L. L. Hendzel, 1980. Physiological Indicators of
Nutrient Deficiency in Lake Phytoplankton. Canadian
Journal of Fisheries & Aquatic Sciences 37: 442–453.
Hecky, R. & P. Kilham, 1988. Nutrient limitation of phyto-
plankton in freshwater and marine environments: a review
of recent evidence on the effects of enrichment. Limnology
& Oceanography 33: 796–822.
Higgins, S. N., M. J. Paterson, R. E. Hecky, D. W. Schindler, J.
J. Venkiteswaran & D. L. Findlay, 2017. Biological
Nitrogen fixation prevents the response of a eutrophic lake
to reduced loading of nitrogen: evidence from a 46-year
whole-lake experiment. Ecosystems 21: 1–13. https://doi.
org/10.1007/s10021-017-0204-2.
Hothorn, T., F. Bretz & P. Westfall, 2008. Simultaneous infer-
ence in general parametric models. Biometrical Journal 50:
346–363.
Huszar, V. L., N. F. Caraco, F. Roland& J. Cole, 2006. Nutrient-
chlorophyll relationships in tropical-subtropical lakes: do
temperate models fit? Nitrogen Cycling in the Americas:
Natural and Anthropogenic Influences and Controls.
Springer, New York: 239–250.
Jones, S. B. & J. R. Jones, 2002. Seasonal variation in
cyanobacterial toxin production in two Nepalese lakes.
Internationale Vereinigung fur Theoretische und Ange-
wandte Limnologie Verhandlungen 8: 1017–1022.
Jones, J. R., M. F. Knowlton & D. B. Swar, 1989. Limnological
reconnaissance of waterbodies in central and southern
Nepal. Hydrobiologia 184: 171–189.
Jones, J. R., B. D. Perkins, A. Witt Jr., M. S. Kaiser, S. Tha-
masara, M. Siriworakul & P. Benyasut, 2000. Limnologi-
cal characteristics of some reservoirs in Thailand.
Internationale Vereinigung fur Theoretische und Ange-
wandte Limnologie Verhandlungen 27: 2158–2166.
Jones, J. R., A. Thompson, C. N. Seong, J. S. Jung & H. Yang,
2006. Monsoon influences on the limnology of Juam Lake,
South Korea. Internationale Vereinigung fur Theoretische
und Angewandte Limnologie Verhandlungen 29:
1215–1222.
Jones, J. R., D. V. Obrecht, B. D. Perkins, M. F. Knowlton, A.
P. Thorpe, S. Watanabe & R. R. Bacon, 2008. Nutrients,
seston, and transparency of Missouri reservoirs and oxbow
lakes: An analysis of regional limnology. Lake and
Reservoir Management 24: 155–180.
Jones, J., P. McEachern & D. Seo, 2009. Empirical evidence of
monsoon influences on Asian Lakes. Aquatic Ecosystem
Health & Management 12: 129–137.
Knowlton, M. F., 1984. Flow-through microcuvette for fluoro-
metric determination of chlorophyll. Water Research
Bulletin 20: 795–799.
Lacoul, P. & B. Freedman, 2005. Physical and chemical lim-
nology of 34 lentic waterbodies along a tropical-to-alpine
altitudinal gradient in Nepal. International Review of
Hydrobiologia 90: 254–2460.
Lewis, W. M. &W. A. Wurtsbaugh, 2008. Control of lacustrine
phytoplankton by nutrients: erosion of the phosphorus
paradigm. International Review of Hydrobiology 93:
446–465.
Li, Y., C. Y. Tang, Z. B. Yu & K. Acharya, 2014. Correlations
between algae and water quality: factors driving eutroph-
ication in Lake Taihu, China. International Journal of
Environmental Science and Technology 11: 169–182.
Lohman, K., J. R. Jones, M. F. Knowlton, D. B. Swar, M.
A. Pamperl & B. J. Brazos, 1988. Pre- and postmonsoon
limnological characteristics of lakes in the Pokhara and
123
Hydrobiologia

Kathmandu Valleys, Nepal. Internationale Vereinigung fur
Theoretische und Angewandte Limnologie Verhandlungen
3: 558–565.
McCullough, G. K., S. J. Page, R. H. Hesslein, M. P. Stainton, H.
J. Kling, A. G. Salki & D. G. Barber, 2012. Hydrological
forcing of a recent trophic surge in LakeWinnipeg. Journal
of Great Lakes Research 38: 95–105.
Mitchell, S. F. & C. W. Burns, 1981. Phytoplankton photosyn-
thesis and its relation to standing crop and nutrients in two
warm-monomictic South Island lakes. New Zealand Jour-
nal of Marine and Freshwater Research 15: 51–67.
Morris, D. P. & W. M. Lewis, 1988. Phytoplankton nutrient
limitation in Colorado mountain lakes. Freshwater Biology
20: 315–327.
Mortimer, C. H., 1941. The exchange of dissolved substances
between mud and water in lakes. Journal of Ecology 29:
280–329.
Muhid, P. & M. A. Burford, 2012. Assessing nutrient limitation
in a subtropical reservoir. Inland Waters 2: 185–192.
North, R., S. Guildford, R. Smith, S. Havens & M. Twiss, 2007.
Evidence for phosphorus, nitrogen, and iron colimitation of
phytoplankton communities in Lake Erie. Limnology &
Oceanography 52: 315–328.
North, R., S. Guildford, R. Smith, M. Twiss & H. Kling, 2008.
Nitrogen, phosphorus, and iron colimitation of phyto-
plankton communities in the nearshore and offshore
regions of the African Great Lakes. Internationale Vere-
inigung fur Theoretische und Angewandte Limnologie
Verhandlungen 30: 259–264.
Orihel, D. M., H. M. Baulch, N. J. Casson, R. L. North, C.
T. Parsons, D. C. M. Seckar & J. J. Venkiteswaran, 2017.
Internal phosphorus loading in Canadian fresh waters: A
critical review and data analysis. Canadian Journal of
Fisheries and Aquatic Sciences 74 (12): 2005–2029.
Overpeck, J. T. & J. E. Cole, 2007. Climate change: Lessons
from a distant monsoon. Nature 445: 270–271.
Paerl, H. W., J. T. Scott, M. J. McCarthy, S. E. Newell, W.
S. Gardner, K. E. Havens, D. K. Hoffman, S. W. Wilhelm
&W. A. Wurtsbaugh, 2016. It Takes Two to Tango: When
and Where Dual Nutrient (N & P) Reductions Are Needed
to Protect Lakes and Downstream Ecosystems. Environ-
mental Science & Technology 50: 10805–10813.
Paerl, H.W., H. Xu, M. J. McCarthy, G. Zhu, B. Qin, Y. Li &W.
S. Gardner, 2011. Controlling harmful cyanobacterial
blooms in a hyper-eutrophic lake (Lake Taihu, China): the
need for a dual nutrient (N & P) management strategy.
Water Research 45: 1973–1983.
Park, C.-K. & S. D. Schubert, 1997. On the nature of the 1994
East Asian summer drought. Journal of Climate 10:
1056–1070.
Prepas, E. E. & F. H. Rigler, 1982. Improvements in quantifying
the phosphorus concentration in lake water. Canadian
Journal of Fisheries and Aquatic Sciences 39: 822–829.
Presing, M., S. Herodek, T. Preston & L. Voros, 2001. Nitrogen
uptake and the importance of internal nitrogen loading in
Lake Balaton. Freshwater Biology 46: 125–139.
R Core Team (2018). R: A language and environment for sta-
tistical computing. R Foundation for Statistical Comput-
ing, Vienna, Austria. https://www.R-project.org/.
Rai, A. K., 2000. Limnological characteristics of subtropical
Lakes Phewa, Begnas, and Rupa in Pokhara Valley, Nepal.
Limnology 1: 33–46.
Rangel, L. M., L. H. S. Silva, P. Rosa, F. Roland & V. L. M.
Huzar, 2012. Phytoplankton biomass is mainly controlled
by hydrology and phosphorus concentrations in trophic
hydroelectric reservoirs. Hydrobiologia 693: 13–28.
Ross, J. & R. Gilbert, 1999. Lacustrine sedimentation in a
monsoon environment: the record from Phewa Tal, middle
mountain region of Nepal. Geomorphology 27: 307–323.
Sartory, D. P. & J. U. Grobbelaar, 1986. Extraction of chloro-
phyll a from freshwater phytoplankton for spectrophoto-
metric analysis. Hydrobiologia 114: 177–187.
Schindler, D., 1976. Biogeochemical evolution of phosphorus
limitation in nutrient-enriched lakes of the Precambrian
Shield. Ann Arbor Science Publishers, Ann Arbor.
Schindler, D. W., S. R. Carpenter, S. C. Chapra, R. E. Hecky &
D. M. Orihel, 2016. Reducing Phosphorus to Curb Lake
Eutrophication is a Success. Environmental Science &
Technology 50: 8923–8929.
Sterner, R.W., 2008. On the phosphorus limitation paradigm for
lakes. International Review of Hydrobiology 93: 433–445.
Sterner, R. W. & J. J. Elser, 2002. Ecological stoichiometry: the
biology of elements from molecules to the biosphere.
Princeton University Press, Princeton, N.J.
Sthapit, K. M. & K. Leminen, 1992. Siltation Survey of Phewa
Lake—Annual report of 1992. Integrated Watershed
Management. Project Technical Paper No. 3r1992, pp: 24.
Tilman, D., 1976. Ecological competition between algae:
experimental confirmation of resource-based competition
theory. Science 192: 463–465.
Vincent, W. F., W. Wurtsbaugh, C. L. Vincent & P. Richerson,
1984. Seasonal dynamics of nutrient limitation in a tropical
high-altitude lake (Lake Titicaca, Peru-Bolivia): Applica-
tion of physiological bioassays. Limnology & Oceanog-
raphy 29: 540–552.
White, E., K. Law, G. Payne & S. Pickmere, 1985. Nutrient
demand and availability among planktonic communities-
an attempt to assess nutrient limitation to plant growth in
12 central volcanic plateau lakes. New Zealand Journal of
Marine and Freshwater Research 19: 49–62.
White, E., G. Payne, S. Pickmere & P. Woods, 1991. Seasonal
variation in nutrient limitation of the algal community in
Lake Horowhenua, New Zealand. New Zealand Journal of
Marine and Freshwater Research 25: 311–316.
Wu, Z., Y. Liu, Z. Liang, S. Wu & H. Guo, 2017. Internal
cycling, not external loading, decides the nutrient limita-
tion in eutrophic lake: A dynamic model with temporal
Bayesian hierarchical inference. Water Research 116:
231–240.
Yan, Z., W. Han, J. Penuelas, J. Sardans, J. J. Elser, E. Du, P.
B. Reich & J. Fang, 2016. Phosphorus accumulates faster
than nitrogen globally in freshwater ecosystems under
anthropogenic impacts. Ecology Letters 19: 1237–1246.
Publisher’s Note Springer Nature remains neutral with
regard to jurisdictional claims in published maps and
institutional affiliations.
123
Hydrobiologia