Physiological Probes & Assay Kits - INTERCHIM: Home Probes & Assay Kits AAT Bioquest ® Advancing...
47
iFluor™ Fluorescent Labeling Dyes Calcium Indicators Membrane Potential Assays pH Probes AAT Bioquest ® Advancing Assay & Test Technologies
Transcript of Physiological Probes & Assay Kits - INTERCHIM: Home Probes & Assay Kits AAT Bioquest ® Advancing...
iFlu
or™
Flu
ore
sce
nt
La
be
ling
Dye
s
Calcium Indicators Membrane Potential Assays pH Probes
Physiological Probes & Assay Kits
AAT Bioquest®
Advancing Assay & Test Technologies
2013-2014

Our Mission
AAT Bioquest® is committed to constantly meet or exceed its customer’s requirements by
providing consistently high quality products and services, and by encouraging continuous
improvements in its long-term and daily operations. Our core value is Innovation and Customer
Satisfaction.
Our Story
AAT Bioquest®, Inc. (formerly ABD Bioquest, Inc.) develops, manufactures and markets bioanalytical research reagents and kits to
life sciences research, diagnostic R&D and drug discovery. We specialize in photometric detections including absorption (color),
luorescence and luminescence technologies. The Company's superior products enable life science researchers to better under-
stand biochemistry, immunology, cell biology and molecular biology. AAT Bioquest ofers a rapidly expanding list of enabling
products. Besides the standard catalog products, we also ofer custom services to meet the distinct needs of each customer. Our
current services include custom synthesis of biological detection probes, custom development of biochemical, cell-based and
diagnostic assays and custom high throughput screening of drug discovery targets.
It is my greatest pleasure to welcome you to AAT Bioquest. We greatly appreciate the constant support of our valuable
customers. While we continue to rapidly expand, our core value remains the same: Innovation and Customer Satisfaction. We
are committed to being the leading provider of novel biological detection solutions. We promise to extend these values to you
during the course of our service and to continue to support you with our new products and services. It is our greatest honor to
receive valuable feedbacks and suggestions from you so that we can better serve your projects.
Very truly yours,
Zhenjun Diwu, Ph.D.
President

Table of Contents
1
Section 1 General Information 2
Chloride Detection............................................................... ....................... 29
Phosphate (Pi) Detection ............................................................................ 30
Pyrophosphate (PPi) Assay ......................................................................... 32
Section 6 Membrane Potential Measurement 33
Fast Response Membrane Potential Probes ................................................. 35
Slow Response Membrane Potential Probes ............................................... 36
Mitochondrial Membrane Potential Probes ................................................ 37
FLIPR® Membrane Potential Assay Kits ....................................................... 38
Section 2 Calcium Ion Detection 5
Section 3 Zinc Ion Detection 17
BCECF & BCFL pH Indicators.............................................................. ......... 23
PDMPO & Protonex™ Green Probes .............................................................24
Protonex™ Probes and pH Dye Conjugates ..................................................25
References for Intracellular pH Probes ........................................................26
Section 5 Anion Detection 27
Section 4 Intracellular pH Probes 21
Section 7 Index 39
Alphabetical Index .................................................................................. 40
Catalog Number Index .............................................................................. 42
Fluo-8® Calcium Ion Indicators............................................................... ...... 8
Cal-520™ Calcium Ion Indicators .................................................................10
Rhod-4™ Calcium Ion Indicator ...................................................................11
BTC Calcium Ion Indicator ...........................................................................12
Fura-2 Calcium Ion Indicator .......................................................................12
Fura-6™ Calcium Ion Indicator ....................................................................12
Indo-1 Calcium Ion Indicator.......................................................................13
FLIPR® Calcium Ion Assays ..........................................................................14
Luminescent Calcium Ion Detection ............................................................15
Calcium Ion Detection In Vitro .....................................................................16
Amplite™ Colorimetric Zinc Ion Assay .........................................................19
Amplite™ Fluorimetric Zinc Ion Assay .........................................................19
Metal Fluor™ Zn 520 ...................................................................................20
TSQ Zinc Ion Indicator .................................................................................20
Zinquin Zinc Ion Indicator ...........................................................................20
References for Zinc Ion Detection ................................................................20
Section 8 Notes 43

1
Ge
ne
ral I
nfo
rma
tio
nGeneral Information www.aatbio.com
Trademarks of AAT Bioquest
AAT Bioquest®
Amplite™
Cal-520™
Cal-520FF™
Cal Green™
Calcium Blue™
Cell Meter™
Fluo-8®
Fluo-8FF™
Fluo-8H™
Fluo-8L™
Fura-6™
Iodide Blue™
JC-10TM
Metal FluorTM
MitoLiteTM
PhosphoWorksTM
ProtonexTM
RatioWorksTM
Rhod-4TM
Screen QuestTM
Zin-620™
Trademarks of Other Companies
Calcium Green™ (Invitrogen)
FACSCalibur™ (Becton Dickinson Biosciences)
FDSS® (Hamamatsu Photonics K.K.)
FlexStation® (Molecular Devices)
FLIPR® (Molecular Devices)
pHrodo™ (Invitrogen)
Pluronic® (Wyandotte Chemicals)
Texas Red®(Invitrogen)
2 Tel: 800-990-8053 • Fax: [email protected] • [email protected]
Tel: 800-990-8053 • Fax: [email protected] • [email protected]
Unless otherwise speciied, all products are for Research Use Only.
Not for use in diagnostic or therapeutic procedures.

Tel: 800-990-8053 • Fax: [email protected] • [email protected]
3Unless otherwise speciied, all products are for Research Use Only.
Not for use in diagnostic or therapeutic procedures.
CUSTOMER SERVICE & ORDERING INFORMATION
AAT Bioquest Corporate Headquarter:
520 Mercury Drive
Sunnyvale, CA 94085, USA
Phone: 800-990-8053 (US and Canada)
408-733-1055 (International)
Fax: 408-733-1304
Website: www.aatbio.com
E-mails: [email protected] (inquire)
[email protected] (quote request)
[email protected] (technical support)
International Distributors:
See Back Cover
www.aatbio.com General InformationG
en
era
l Info
rma
tion
1
TERMS AND CONDITIONS OF SALE
1. Prices, Orders and Changes: Prices shown are in US currency. Please call us for current
prices if you require this information prior to placing your order. We guarantee our written
quotations for 60 days. You may not cancel purchase orders unless such cancellation is
expressly agreed by us. In such event, you will be advised of the total charge for such
cancellation. You agree to pay such charges, including, but not limited to, storage and
shipment costs, costs of producing non-standard materials, costs of purchasing non-
returnable materials, cancellation costs imposed on us by our suppliers, and any other cost
resulting from cancellation of this order.
2. Delivery: In most cases, we use standard overnight or two-day Federal Express delivery
(or equivalent). All shipping charges billed are the responsibility of the customer and are
normally prepaid by AAT Bioquest, Inc. and added to the invoice. We reserve the right to
make delivery in installments, all such installments to be separately invoiced and paid for
when due per invoice, without regard to subsequent deliveries. Partial shipments of
available items are made when another item is backordered. Please inspect your packages
upon receipt. If the goods have been damaged in transit, we can assist you in iling a claim
with the carrier. You shall notify us in writing of any claims for shortages, defects or
damages and shall hold the goods for our written instructions concerning disposition. Any
claims for such errors must be made within 10 business days. If it is our error, we will do
whatever is necessary to ship the correct products as soon as possible. If you shall fail to
notify us any defects within 10 days after the goods have been received, such goods shall
conclusively be deemed to conform to the terms and conditions and to have been
irrevocably accepted by the buyer.
3. Payment: Terms of sale are net 30 days of date of invoice that is sent to you within 24
hours of shipping the order. The amount received must be suicient to cover both the
invoiced amount and any bank charges that may be incurred. Late charges may be added
to invoices not paid within the 30-day time period. Late charges must be paid before
subsequent orders can be shipped.
4. Warranties: The products shipped by AAT Bioquest are warranted to conform to the
chemical or biological descriptions provided in our publications. This warranty is exclusive,
and we makes no other warranty, express or implied, including any implied warranty of
merchantability or itness for any particular purpose. Our sole and exclusive liability and
your exclusive remedy with respect to products proved to our satisfaction to be defective
or nonconforming shall be replacement of such products without charge or refund of the
purchase price, in our sole discretion, upon the return of such products in accordance with
our instructions. We will not be liable for any incidental, consequential or contingent
damages involving their use.
5. Returns: We must authorize any returns. We will not accept return shipments unless we
have given prior written permission and shipping instructions. Goods may not be returned
for credit except with our permission, and then only in strict compliance with our return
shipment instructions. Any returned items may be subject to a 20% restocking fee. In many
cases, items ordered in error cannot be returned because of the sensitive nature of many of
our products and the diiculty and expense of requalifying returned items. If items are
accepted for return, they must be in new, unopened, unused and undamaged condition,
and you will be charged a per-unit 20% restocking charge.
6. Use of Our Products: Our products are used ONLY for laboratory research and develop-
ment purposes. We realize that, since our products are, unless otherwise stated, intended
primarily for research purposes, they may not be on the Toxic Substances Control Act
(TSCA) inventory. You assume responsibility to assure that the products purchased from
us are approved for use under TSCA, if applicable. You have the responsibility to verify the
hazards and to conduct any further research necessary to learn the hazards involved in
using products purchased from us. You also have the duty to warn your customers and any
auxiliary personnel (such as freight handlers, etc.) of any risks involved in using or handling
the products.
7. Patent Disclaimer: We do not warrant that the use or sale of our products will not
infringe the claims of any United States or other patents covering the product itself or the
use thereof in combination with other products or in the operation of any process.
8. Miscellaneous: We reserve the right to discontinue our products or change
speciications or prices of our products and to correct any errors or omissions at any time
without incurring obligations.

General Information www.aatbio.com
1
Ge
ne
ral I
nfo
rma
tio
n
Custom Products and Services
Our Technologies
Amplite™ enzyme-based detection platform is optimized for
measuring horseradish peroxidase (HRP), alkaline phosphates,
luciferase, beta-galactosidase, lactamase, oxidase, protein
kinases, protein phosphatases, phosphodiesterases, proteases,
cytochrome P450, histone deacetylase (HDAC) and cell
signaling molecules such as NAD/NADH, NADP/NADPH, IP3,
cAMP and cGMP etc.
Cell Explorer™ cell labeling platform is a complete set of tools
for tracking live cells. This platform is also widely used for
sorting mixed populations of cells.
Cell Navigator™ cell staining platform is a complete set of
tools for selective labeling subcellular structures of live, ixed
and dead cells.
Cell Meter™ cellular functional assay platform is a complete set
of tools for functional analysis of cellular events and real time-
monitoring of cell functions.
iFluor™ superior luorescent labeling dyes are optimized for
labeling proteins and nucleic acids. This group of dyes span
from UV to infrared wavelength with good photostability and
brightness.
mFluor™ superior luorescent labeling dyes are optimized for
low cytometry applications.
PhosphoWorks™ detection platform is a set of tools for
detection of ATP, ADP, AMP, phosphate, pyrophosphate,
phosphoproteins and phosphopeptides.
Quest View™ colorimetric protease platform is a sensitive and
robust tool for rapid detection of protease and glycosidase
biomarkers. This technology platform has been licensed by
a few diagnostic companies for developing rapid diagnostic
tests.
RatioWorks™ superior cellular dyes are a sensitive and robust
tool set for ratio imaging and real time monitoring of cellular
functions (such as pH and ions) in live cells.
Screen Quest™ assay kits are a set of HTS-ready tools for high
throughput screening of biochemical and cellular targets such
as protein kinases, proteases, HDAC, cell apoptosis and
cytotoxicity, GPCR, ion channels, ADME and transporters.
Tide Fluor™ and Tide Quencher™ superior labeling dyes are
specially optimized for labeling nucleotides and peptides.
This platform ofers the best value in the industry. It is second
to none in terms of performance and cost. This technology
platform has been licensed by a few diagnostic companies for
developing IVD diagnostic tests.
trFluor™ superior luorescent labeling dyes are optimized for
developing time-resolved luorescence-based assays. It has
been used for developing HTS assay technologies for many
drug discovery targets.
Our Services
Besides the catalog products we also ofer custom services to
meet the distinct needs of each customer. Our current services
include custom synthesis of biological detection probes,
custom development of biochemical, cell-based and diagnostic
assays, custom bioconjugation and custom high throughput
screening of drug discovery targets.
Custom Assay Design and Development
At AAT Bioquest we not only make probes and assay kits, but
also use them extensively ourselves. Scientists at AAT Bioquest
are experts on assay design and have developed a wide variety
of tests that range from biochemical detection to cellular
functions. Our assay options include:
• Enzyme activities
• Binding assays
• Cell-based assays
• Microplate assays
• Flow cytometric analysis
• Fluorescence imaging
Custom Conjugation
AAT Bioquest ofers the best and the most rapid bioconjuga-
tion service in the industry.
• Biotinylation
• Fluorescence labeling (iFluorTM, mFluor™, APC, RPE and PerCP)
• Enzyme labeling (AP and HRP)
• Small molecule conjugation
Custom Screening
AAT Bioquest ofers on-demand high-throughput screening
and pharmacology proiling assays with multiple
methodologies. Functional assays are designed, validated and
customized to the needs of our pharmaceutical and
biotechnology industry clients. These assays are aimed at
assessing and monitoring the eicacy, tolerability and safety
parameters of candidate compounds for treating and/or
diagnosing cancer, infectious disease, autoimmunity and
transplantation. Our screening options include:
• Full assay development for a target of your choice
• Optimization of your assay protocol for HTS
• Multiple assay platforms and detection methods
• Custom data analysis
Custom Synthesis of Fluorophores and Luminophores
AAT Bioquest is recognized by the top pharmaceutical
companies and diagnostic companies as a key provider of
novel luorescent dyes and luminescent probes. Over the years
we have developed and synthesized many enabling
luorescent and luminescent probes for running a variety of
challenging biological detection tasks.
4 Tel: 800-990-8053 • Fax: [email protected] • [email protected]
Tel: 800-990-8053 • Fax: [email protected] • [email protected]
Unless otherwise speciied, all products are for Research Use Only.
Not for use in diagnostic or therapeutic procedures.

Ca
lcium
De
tectio
n
Calcium Detection 2
Tel: 800-990-8053 • Fax: [email protected] • [email protected]
5Unless otherwise speciied, all products are for Research Use Only.
Not for use in diagnostic or therapeutic procedures.

www.aatbio.com
2
Ca
lciu
m D
ete
ctio
n
Detection Mode Single Wavelength Detection Ratiometric Detection (Dual Wavelength)
Absorption Amplite™ Colorimetric Calcium Assay Kit
Blue Fluorescence BTC
Fura-2
Fura-6™
Indo-1
Quin-2
FLIPR® Assay Screen Quest™ Fluo-8® No Wash Caclium Assay Kit
Screen Quest™ Rhod-4™ No Wash Calcium Assay Kit
Screen Quest™ Luminometric Calcium Assay Kit
Screen Quest™ Fura-2 No Wash Calcium Assay Kit
Green Fluorescence Cal-520™
Cal Green™-1
Fluo-3
Fluo-8®
Orange Fluorescence Amplite™ Fluorimetric Calcium Assay Kit
Rhod-2
Rhod-4™
Rhod-5N
Luminescence Coelenterazines
Screen Quest™ Luminometric Calcium Assay Kit
calcium detection at-a-glance
6 Tel: 800-990-8053 • Fax: [email protected] • [email protected]
Tel: 800-990-8053 • Fax: [email protected] • [email protected]
Unless otherwise speciied, all products are for Research Use Only.
Not for use in diagnostic or therapeutic procedures.

Overview of Calcium Detectionwww.aatbio.com
2
Ca
lcium
De
tectio
n
Calcium Detection
Calcium acts as a universal second messenger in a variety of cells.
Numerous functions of all types of cells are regulated by Ca2+, thus
calcium measurement is critical for various biological investiga-
tions. Since the 1920s, scientists have attempted to measure Ca2+,
but few were successful due to the limited availability of Ca2+
probes. The irst reliable measurement of Ca2+ was performed by
Ridgway and Ashley by injecting the photoprotein aequorin into
the giant muscle iber of the barnacle. Subsequently, in the 1980s,
Tsien and colleagues produced a variety of luorescent indicators.
Among them Indo-1, Fura-2, Fluo-3 and Rhod-2 have been
the most valuable dyes for measuring Ca2+ with a luorescence
instrument. In recent years, AAT Bioquest has introduced the most
robust calcium probes: Fluo-8® and Cal-520™, both of which enable
the high throughput screening of GPCR and calcium channel drug
discovery targets through the convenient calcium detection. FLIPR®
and FlexStation® instruments of Molecular Devices, FDSS®/μCell
of Hamamatsu and NOVOstar of BMG Technologies have further
accelerated the high throughput measurement of calcium for GPCR
and ion channel research.
Fluorescent probes that show spectral responses upon binding Ca2+
have enabled researchers to investigate changes in intracellular
free Ca2+ concentrations by using luorescence microscopy, low
cytometry, luorescence spectroscopy and luorescence microplate
readers. Most of these luorescent indicators are derivatives of
BAPTA chelators that incorporate a PET system responsive to
calcium. There are quite a few factors that need be considered
when selecting a luorescent Ca2+ indicator. These include:
• Spectral Properties: For UV excitation, Indo-1 and Fura-2 are
widely used. Fura-6™ is a newly developed excitation-ratioable
calcium dye. Its AM is superior to Fura-2 AM with higher signal/
background ratio in cells. Fluo-8® and Cal-520™ are preferred for
488 nm excitation while Rhod-4™ and Rhod-2 are used for red
emissions.
• Measurement Mode: Ion indicators that exhibit spectral shifts
upon ion binding can be used for ratiometric measurements of
Ca2+ concentration, which are essentially independent of uneven
dye loading, cell thickness, photobleaching efects and dye
leakage. Excitation and emission wavelength preferences depend
on the type of instrumentation being used, as well as on sample
autoluorescence and on the presence of other luorescent or
photoactivatable probes in the experiment. Indo-1, Fura-2 and
our newly developed Fura-6™ are primary choices for ratiometric
measurements while Fluo-3, Fluo-4, Fluo-8®, Cal-520™, Rhod-2
and Rhod-4 are predominantly used for single wavelength
measurements.
• Permeability of Ca2+ Indicators (salt or AM ester): The salt forms
are typically loaded into cells by microinjection, microprojectile
bombardment or electroporation, or used for extracellular assays.
In contrast, the cell-permeant acetoxymethyl (AM) esters can
be passively loaded into cells, where they are cleaved to cell-
impermeant products by intracellular esterases.
• Dissociation Constant (Kd): The desired indicators must have
a proper Kd compatible with the Ca2+ concentration range of
interest. The Kd values of Ca2+ indicators are dependent on many
factors, including pH, temperature, ionic strength, viscosity, protein
binding, the presence of Mg2+ and other ions. Consequently, Kd
values for intracellular indicators are usually signiicantly higher
than the corresponding values measured in cell-free solutions.
Among the visible light-excitable calcium indicators, Fluo-8®,
Fluo-4, Fluo-3, Rhod-2 and Rhod-4™ are most commonly used.
Fluo-8® indicators are widely used in low cytometry and confocal
laser-scanning microscopy. More recently, Fluo-8® AM has been
extensively used for high throughput screening GPCR targets.
Fluo-8® is essentially nonluorescent unless bound to Ca2+ and
exhibits a quantum yield of ~0.15 in the presence of saturating
Ca2+ and a Kd of 390 nM for Ca2+. Cal-520™ is by far the best
488 nm-excitable green luorescent calcium indicator with a
signiicantly improved signal/background ratio and intracellular
retention.
The long-wavelength Rhod-4™ is a valuable alternative Ca2+
indicator to the green luorescent Fluo-8®, Fluo-4 and Fluo-3 for
experiments in cells and tissues that have high levels of autoluo-
rescence. Rhod-5N has a lower binding ainity for Ca2+ than any
other BAPTA-based indicator (Kd = ~320 µM) and is suitable for
Ca2+ measurements from 10 µM to 1 mM. Like the parent Rhod-2
indicator, Rhod-5N is essentially nonluorescent in the absence of
divalent cations and exhibits strong luorescence enhancement
with no spectral shift upon binding Ca2+. Both Fluo and Rhod
indicators are available as cell-impermeant potassium salts or as
cell-permeant AM esters.
Cat # Product Name SizeEx
(nm)
Em
(nm)
Kd
(nM)
20500Cal Green™-1 (equivalent to
Calcium Green™-1)10x50 µg 506 531 190
20501Cal Green™-1 AM (equivalent to
Calcium Green™-1 AM) 10x50 µg 506 531 190
21011 Fluo-3 AM *UltraPure grade* 1 mg 506 526 390
21018 Fluo-3, pentaammonium salt 1 mg 506 526 390
21017 Fluo-3, pentapotassium salt 1 mg 506 526 390
21016 Fluo-3, pentasodium salt 1 mg 506 526 390
21064 Rhod-2 AM *UltraPure grade* 20x50 µg 549 578 570
21067 Rhod-2, tripotassium salt 1 mg 549 578 570
21068 Rhod-2, trisodium salt 1 mg 549 578 570
21070 Rhod-5N AM 1 mg 551 577 0.3 mM
21072 Rhod-5N, tripotassium salt 1 mg 551 577 0.3 mM
Table 2.1 Classic Single Wavelength Fluorescent Calcium Indicators
Tel: 800-990-8053 • Fax: [email protected] • [email protected]
Unless otherwise speciied, all products are for Research Use Only.
Not for use in diagnostic or therapeutic procedures.
2.1 Selection of a Calcium Indicator
2.2 Single Wavelength Calcium Indicators
7

2
Ca
lciu
m D
ete
ctio
nFluo-8® Calcium Indicators www.aatbio.com
Fluo-8® Calcium IndicatorsThe Brightest 488 nm-Excitable Green Fluorescent Calcium Indicators
Fluo-3 and Fluo-4 were the most commonly used visible light-
excitable calcium indicators. However, Fluo-3 AM and Fluo-4 AM
are only moderately luorescent in live cells upon esterase hydro-
lysis, and require harsh cell loading conditions to maximize their
cellular calcium responses. Fluo-8® dyes have been developed to
improve cell loading and calcium response while maintaining the
convenient Fluo-3 and Fluo-4 spectral wavelengths of maximum
excitation @ ~490 nm and maximum emission @ ~520 nm. For cell
loading, Fluo-8® AM only requires incubation at room temperature
while Fluo-3 AM and Fluo-4 AM require incubation at 37 oC. In ad-
dition, Fluo-8® AM is 2 times brighter than Fluo-4 AM, and 4 times
brighter than Fluo-3 AM in cells. AAT Bioquest ofers a set of out-
standing Fluo-8® reagents with diferent calcium binding ainities.
Key Features of Fluo-8® AM
• Faster, more readily loaded into cells than Fluo-3 AM and
Fluo-4 AM. Only room temperature is required.
• Brighter, much brighter than Fluo-3 AM and Fluo-4 AM in cells.
• Convenient, almost identical spectra to those of Fluo-4 AM.
Cat # Product Name Size Ex (nm) Em (nm) Kd
(nM)
21080 Fluo-8® AM 1 mg 494 517 389
21081 Fluo-8® AM 5x50 µg 494 517 389
21088 Fluo-8®, sodium salt 10x50 µg 494 517 389
21104 Fluo-8FF™ AM 10x50 µg 494 517 10,000
21102 Fluo-8FF™, potassium salt 10x50 µg 494 517 10,000
21090 Fluo-8H™ AM 1 mg 494 517 232
21095 Fluo-8H™, sodium salt 10x50 µg 494 517 232
21096 Fluo-8L™ AM 1 mg 494 517 1,860
21098 Fluo-8L™, sodium salt 10x50 µg 494 517 1,860
Table 2.2 Fluo-8® Calcium Indicators
8 Tel: 800-990-8053 • Fax: [email protected] • [email protected]
Tel: 800-990-8053 • Fax: [email protected] • [email protected]
Unless otherwise speciied, all products are for Research Use Only.
Not for use in diagnostic or therapeutic procedures.
Figure 2.2. U2OS cells were seeded overnight at 40,000 cells per 100 µL per well in a Costar black wall/clear bottom 96-well plate. The growth medium was removed, and the cells
were incubated with 100 µL of 4 µM Fluo-3 AM, Fluo-4 AM and Fluo-8® AM in HHBS at 37 °C for 1 hour. The cells were washed twice with 200 µL HHBS, then imaged with a luores-
cence microscope using FITC channel.
Fluo-3 AM Fluo-4 AM Fluo-8® AM
Figure 2.1. Carbachol dose responses were measured in HEK-293 cells with Fluo-8®
AM and Fluo-4 AM. HEK-293 cells were seeded overnight at 40,000 cells/100 µL/well
in a 96-well black wall/clear bottom Costar plate. The growth medium was removed,
and the cells were incubated with 100 µL of dye-loading solution containing Fluo-8®
AM or Fluo-4 AM for 1 hour at room temperature. Carbachol (25µL/well) was added by
NOVOstar to achieve the inal indicated concentrations. The luorescence signals were
measured at Ex/Em = 490/525 nm. The EC50
of Fluo-8® AM is about 1.2 µM.
Carbachol Dose (μM)
Fluo-8® AM
Fluo-4 AM

Recent Citations of Fluo-8® Calcium Indicators
André M. Deslauriers, Amir Afkhami-Goli, Amber M. Paul, Rakesh K.
Bhat, Shaona Acharjee, Kristofor K. Ellestad, Farshid Noorbakhsh,
Marek Michalak, and Christopher Power. Neuroinlammation
and Endoplasmic Reticulum Stress Are Coregulated by Crocin To
Prevent Demyelination and Neurodegeneration. J. Immunol. 2011;
187: 4788 -4799.
Christopher A. Del Negro, John A. Hayes, and Jens C. Rekling. Den-
dritic Calcium Activity Precedes Inspiratory Bursts in preBötzinger
Complex Neurons. J. Neurosci. 2011; 31: 1017 - 1022.
Ferdinand Maingat, Brendan Halloran, Shaona Acharjee, Guido
van Marle, Deirdre Church, M. John Gill, Richard R. E. Uwiera, Eric
A. Cohen, Jon Meddings, Karen Madsen, and Christopher Power.
Inlammation and epithelial cell injury in AIDS enteropathy:
involvement of endoplasmic reticulum stress. FASEB J. 2011; 25:
2211 - 2220.
Jens C. Rekling, Kristian H. R. Jensen, and Henrik Jahnsen.
Spontaneous cluster activity in the inferior olivary nucleus in
brainstem slices from postnatal mice. J. Physiol. 2012; 590: 1547
- 1562.
Karin Persson and Jens C. Rekling. Population calcium imaging
of spontaneous respiratory and novel motor activity in the facial
nucleus and ventral brainstem in newborn mice. J. Physiol. 2011;
589: 2543 - 2558.
Mako Kurogi, Megumi Miyashita, Yuri Emoto, Yoshihiro Kubo, and
Osamu Saitoh. Green Tea Polyphenol Epigallocatechin Gallate Acti-
vates TRPA1 in an Intestinal Enteroendocrine Cell Line, STC-1. Chem
Senses 2012; 37: 167 - 177.
Man Hagiyama, Tadahide Furuno, Yoichiroh Hosokawa, Takanori
Iino, Takeshi Ito, Takao Inoue, Mamoru Nakanishi, Yoshinori Mu-
rakami, and Akihiko Ito. Enhanced Nerve–Mast Cell Interaction by
a Neuronal Short Isoform of Cell Adhesion Molecule-1. J. Immunol.
2011; 186: 5983 - 5992.
Marc Aurel Busche, Xiaowei Chen, Horst A. Henning, Julia Reich-
wald, Matthias Staufenbiel, Bert Sakmann, and Arthur Konnerth.
Critical role of soluble amyloid-β for early hippocampal hyperactiv-
ity in a mouse model of Alzheimer’s disease. PNAS 2012; 109: 8740
- 8745.
Md. Shahidul Islam, Calcium Signaling, in Advances in Experimental
Medicine and Biology, Vol. 740, Springer, New York, 2012, pp 44-83.
Michael J. Corey, Coupled Bioluminescence Assays, Methods, Evalu-
ations and Applications. Wiley, New York. 2009, PP160-190.
Nicholas B. Last, Elizabeth Rhoades, and Andrew D. Miranker. Islet
amyloid polypeptide demonstrates a persistent capacity to disrupt
membrane integrity. PNAS 2011; 108: 9460 - 9465.
Nicholas M. Mellen and Deepak Mishra. Functional Anatomical
Evidence for Respiratory Rhythmogenic Function of Endogenous
Bursters in Rat Medulla. J. Neurosci. 2010; 30: 8383 - 8392.
Fluo-8® Calcium Indicatorswww.aatbio.com
2
Ca
lcium
De
tectio
n
Satoru Torii, Kentaro Kobayashi, Masayuki Takahashi, Kasumi
Katahira, Kenji Goryo, Natsuki Matsushita, Ken-ichi Yasumoto,
Yoshiaki Fujii-Kuriyama, and Kazuhiro Sogawa. Magnesium
Deiciency Causes Loss of Response to Intermittent Hypoxia in
Paraganglion Cells. J. Biol. Chem. 2009; 284: 19077 - 19089.
Shaona Acharjee, Yu Zhu, Ferdinand Maingat, Carlos Pardo, Klaus
Ballanyi, Morley D. Hollenberg, and Christopher Power. Proteinase-
activated receptor-1 mediates dorsal root ganglion neuronal
degeneration in HIV/AIDS. Brain 2011; 134: 3209 - 3221.
Soichi Watanabe, Andre P. Seale, E. Gordon Grau, and Toyoji Kaneko.
Stretch-activated cation channel TRPV4 mediates hyposmotically
induced prolactin release from prolactin cells of mozambique tila-
piaOreochromis mossambicus. Am J Physiol Regulatory Integrative
Comp Physiol. 2012; 302: R1004 - R1011.
Takako Saito, Kogiku Shiba, Kazuo Inaba, Lixy Yamada, and Hitoshi
Sawada. Self-incompatibility response induced by calcium increase
in sperm of the ascidian Ciona intestinalis. PNAS 2012; 109: 4158 -
4162.
Wei-Wei Shen, Maud Frieden, and Nicolas Demaurex. Local Cyto-
solic Ca2+Elevations Are Required for Stromal Interaction Molecule 1
(STIM1) De-oligomerization and Termination of Store-operated Ca2+
Entry. J. Biol. Chem.2011; 286: 36448 - 36459.
Wen Fu, Araya Ruangkittisakul, David MacTavish, Jenny Y. Shi, Klaus
Ballanyi, and Jack H. Jhamandas. Amyloid β (Aβ) Peptide Directly
Activates Amylin-3 Receptor Subtype by Triggering Multiple
Intracellular Signaling Pathways. J. Biol. Chem. 2012; 287: 18820
- 18830.
Yasuto Yamaguchi, Xiao-Yan Du, Lei Zhao, John Morser, and
Lawrence L. K. Leung. Proteolytic Cleavage of Chemerin Protein
Is Necessary for Activation to the Active Form, Chem157S, Which
Functions as a Signaling Molecule in Glioblastoma. J. Biol. Chem.
2011; 286: 39510 - 39519.
Yohei Okubo, Hiroshi Sekiya, Shigeyuki Namiki, Hirokazu Sakamoto,
Sho Iinuma, Miwako Yamasaki, Masahiko Watanabe, Kenzo Hirose,
and Masamitsu Iino. Imaging extrasynaptic glutamate dynamics in
the brain. PNAS 2010; 107: 6526 - 6531.
†Prices are based on the websites of Sigma-Aldrich and Invitrogen as of April 2013
respectively, which may vary for diferent customers.
Ca2+ Indicator AAT Bioquest Sigma† Invitrogen†
Cal-520™ AM $195/10x50 µg not available not available
Fluo-8® AM $175/10x50 µg not available not available
Fluo-4 AM not available not available $218/10x50 µg
Fluo-3 AM $145/mg $390/mg $242/mg
Compare to Save
Pay Less. Perform Better.
Tel: 800-990-8053 • Fax: [email protected] • [email protected]
Unless otherwise speciied, all products are for Research Use Only.
Not for use in diagnostic or therapeutic procedures.9

2
Ca
lciu
m D
ete
ctio
nCal-520™ Calcium Indicators www.aatbio.com
Cal-520™ Calcium IndicatorsThe Best 488 nm-Excitable Green Fluorescent Calcium Indicators with The Highest Signal to Background Ratio
Cal-520™ provides the most robust homogeneous luorescence-
based assay tool for detecting intracellular calcium mobilization.
Cal-520™ AM is a new luorogenic calcium-sensitive dye with a
signiicantly improved signal to background ratio and intracellular
retention compared to the existing green calcium indicators (such
as Fluo-3 AM and Fluo-4 AM). The higher signal/background ratio
and better intracellular retention make the Cal-520™ calcium assay
a robust tool for evaluating GPCR and calcium channel targets as
well as for screening their agonists and antagonists.
Our preliminary in-house research indicated that Cal-520™ AM
can be readily loaded to a guinea pig heart and stays there for a
few hours in the absence of probenecid. The calcium signal can be
readily monitored with Cal-520™ AM while it is diicult to observe
Key Features of Cal-520™ AM
• Better Intracellular Retention, Cal-520™ AM is better retained in live cells than Fluo-3 AM and Fluo-4 AM.
• Higher Sensitivity, Cal-520™ AM has much higher signal/background ratio than Fluo-3 AM and Fluo-4 AM in cells.
• Convenient, Cal-520™ AM has almost identical spectra to those of Fluo-4 AM.
Table 2.4 Fluorescent Cal Calcium Indicators
Cat # Product Name Size Ex (nm) Em (nm) Kd
(nM)
21131 Cal-520™ AM 1 mg 492 514 320
21141 Cal-520™, potassium salt 1 mg 492 514 320
21136 Cal-520™, sodium salt 1 mg 492 514 320
21142 Cal-520FF™ AM 1 mg 492 514 9,800
21144 Cal-520FF™, potassium salt 10 x 50 µg 492 514 9,800
20501 Cal Green™-1 AM (equivalent to Calcium Green™-1 AM) 10 x 50 µg 506 531 190
20500 Cal Green™-1, hexapotassium salt (equivalent to Calcium Green™-1) 10 x 50 µg 506 531 190
Dye Ex (nm) Em (nm) QY*
Cal-520™ 492 514 0.75
Fluo-3 506 525 0.15
Fluo-4 493 515 0.16
Fluo-8® 490 514 0.16
Table 2.3 Spectral Comparison of Fluo-3, Fluo-4, Fluor-8® and Cal-520™
*QY = Fluorescence Quantum Yield in the presence of 5 mM calcium citrate.
10 Tel: 800-990-8053 • Fax: [email protected] • [email protected]
Unless otherwise speciied, all products are for Research Use Only.
Not for use in diagnostic or therapeutic procedures.
Figure 2.3. ATP-stimulated calcium responses of endogenous P2Y receptor in CHO-K1
cells incubated with Cal-520™ AM (red curve), or Fluo-4 AM (blue curve) respectively
with probenecid under the same conditions. CHO-K1 cells were seeded overnight at
50,000 cells/100 µL/well in a Costar black wall/clear bottom 96-well plate. 100 µL of 5
µM Fluo-4 AM or Cal-520™ AM in HHBS with 2.5 mm probenecid was added into the
cells, and the cells were incubated at 37 °C for 2 hours. ATP (50 µL/well) was added
using FlexSation® to achieve the inal indicated concentrations.
ATP (μM)
the calcium signal under the same conditions with other green
calcium dyes such as Fluo-3 AM and Fluo-4 AM.
Figure 2.4. ATP-stimulated calcium responses of endogenous P2Y receptors in CHO-K1
cells incubated with Cal-520™ AM (red curve), or Fluo-4 AM (blue curve) respectively,
without probenecid under the same conditions. CHO-K1 cells were seeded overnight
at 50,000 cells/100 µL/well in a Costar black wall/clear bottom 96-well plate. 100 µL of
5 µM Fluo-4 AM or Cal-520™ AM in HHBS was added into the cells, and the cells were
incubated at 37 °C for 2 hours. ATP (50 µL/well) was added using FlexSation® to achieve
the inal indicated concentrations.
ATP (μM)

Rhod-4™ Calcium IndicatorThe Superior Replacement to Rhod-2, Localized in Cytoplasm
Rhod-2 is the most commonly used red luorescent calcium
indicators. However, Rhod-2 AM is only moderately luorescent
in live cells upon esterase hydrolysis, and has very small cellular
calcium responses. Rhod-4™ has been developed to improve the
cell loading and calcium response while maintaining the spectral
wavelength of Rhod-2. In CHO and HEK cells, the cellular calcium
response of Rhod-4™ AM is 10 times more sensitive than that of
Rhod-2 AM. Our in-house research indicated that Rhod-4™ AM can
detect calcium transients in stem cell cardiomyocytes that was not
detected with Rhod-2 AM under the same conditions. The higher
sensitivity of Rhod-4™ AM might be due to its higher cell loading
eiciency than that of Rhod-2 AM.
Table 2.5 Visible Light-Excitable Orange Fluorescent Calcium Indicators
Cat # Product Name Size Ex (nm) Em (nm) Kd
(nM)
21064 Rhod-2 AM *UltraPure grade" 20 x 50 µg 549 578 570
21067 Rhod-2, tripotassium salt 1 mg 549 578 570
21068 Rhod-2, trisodium salt 1 mg 549 578 570
21120 Rhod-4™ AM 1 mg 524 551 451
21128 Rhod-4™, sodium salt 5 x 50 µg 524 551 451
21070 Rhod-5N, AM 1 mg 551 577 0.3 mM
21072 Rhod-5N, tripotassium salt 1 mg 551 577 0.3 mM
Figure 2.5. The excitation and emission spectra of Rhod-4™ in PBS buffer (pH 7.2) in
the presence of 5 mM calcium chloride.
Figure 2.6. ATP-stimulated calcium responses of endogenous P2Y receptors were
measured in CHO-K1 cells with Rhod-4™ AM and Rhod-2 AM. CHO-K1 cells were
seeded overnight at 50,000 cells/100 μL/well in a 96-well black wall/clear bottom
Costar plate. The growth medium was removed, and the cells were incubated with 100
μL of dye loading solution using Rhod-4™ AM (4 µM, A and B) or Rhod-2 AM (4 µM, C
and D) for 1 hour in a 37 °C, 5% CO2 incubator. The cells were washed twice with 200 μL
HHBS, then images before (A and C) and after (B and D) ATP treatment were taken with
a luorescence microscope (Olympus IX71) using TRITC channel.
Figure 2.7. Carbachol dose responses were measured in HEK-293 cells with Rhod-4™
AM and Rhod-2 AM. HEK-293 cells were seeded overnight at 40,000 cells/100 μL/well
in a Costar black wall/clear bottom 96-well plate. The growth medium was removed,
and the cells were incubated with 100 μL Rhod-4™ AM dye loading solution, or 100 μL
Rhod-2 AM dye loading solution (5 μM) for 1 hour at room temperature. Carbachol (25
μL/well) was added by NOVOstar (BMG Labtech) to achieve the inal indicated concen-
trations. The EC50
of carbachol with Rhod-4™ AM is about 0.8 μM.
Recent Citations of Rhod-4™ Calcium Indicator
Alice P. Liou, Yoshitatsu Sei, Xilin Zhao, Jianying Feng, Xinping Lu,
Craig Thomas, Susanne Pechhold, Helen E. Raybould, and Stephen
A. Wank. The extracellular calcium-sensing receptor is required for
cholecystokinin secretion in response to L-phenylalanine in acutely
isolated intestinal I cells. Am J Physiol Gastrointest Liver Physiol.
2011, 300, G538 - G546.
Zhiheng Jia, Virginijus Valiunas, Zongju Lu, Harold Bien, Huilin
Liu, Hong-Zhang Wang, Barbara Rosati, Peter R. Brink, Ira S. Cohen
and Emilia Entcheva, Stimulating. Cardiac Muscle by Light, Cardiac
Optogenetics by Cell Delivery. Circ Arrhythm Electrophysiol, 2011,
4, 753 - 760.
Rhod-4™ AM
Rhod-2 AM
Rhod-4™
Rhod-2
A B
C D
Carbachol Dose (μM)
2
Ca
lcium
De
tectio
n Rhod-4™ Calcium Indicatorwww.aatbio.com
Tel: 800-990-8053 • Fax: [email protected] • [email protected]
Unless otherwise speciied, all products are for Research Use Only.
Not for use in diagnostic or therapeutic procedures.11

Fura-2
Fura-2 is a ratiometric luorescent dye which binds free intracel-
lular calcium. It was the irst widely-used dye for calcium imaging,
and remains very popular. Fura-2 is excited at 340 nm and 380
nm, and the ratio of the emissions at those wavelengths is directly
correlated to the amount of intracellular calcium. Regardless of
the presence of calcium, Fura-2 emits at 510 nm. The use of the
ratio automatically cancels out confounding variables, such as
variable dye concentration and cell numbers, making Fura-2 one
of the most appreciated tools to quantify calcium levels. Fura-2 is
preferred for ratio-imaging microscopy, in which it is more practical
to change excitation wavelengths than emission wavelengths.
Figure 2.9. Fluorescence excitation spectra of Fura-2 in solutions containing 0 to
39 µM free Ca2+
2.3 Ratiometric Calcium Indicators
2
Ca
lciu
m D
ete
ctio
nRatiometric Calcium Indicators www.aatbio.com
12 Tel: 800-990-8053 • Fax: [email protected] • [email protected]
Unless otherwise speciied, all products are for Research Use Only.
Not for use in diagnostic or therapeutic procedures.
Fura-6™
Although Fura-2 has been widely used as the preferred excitation-
ratioable calcium indicator, it has certain limitations, e.g., lower
sensitivity compared to the single wavelength calcium dyes such as
Fluo-8® and Cal-520™. AAT Bioquest has recently developed Fura-
6™ to improve the calcium response of Fura-2. As demonstrated in
Figures 2.10 and 2.11, Fura-6™ AM is more sensitive to calcium than
Fura-2 AM. In addition, Fura-6™ has its emission shifted to longer
wavelength (Em = 525 nm). Fura-6™ might be also used for the low
cytometric analysis of calcium in cells due to its excellent excitation
at 405 nm of violet laser.
Figure 2.10. Fluorescence excitation spectra of Fura-6™ in solutions containing 0 to
39 µM free Ca2+
Figure 2.11. ATP dose responses in CHO-K1 cells measured with Fura-2 AM and Fura-6™
AM respectively. CHO-K1 cells were seeded overnight at 40,000 cells/100 μL/well in a
Costar black wall/clear bottom 96-well plate. The cells were incubated with Fura-2 AM
or Fura-6™ AM calcium assay dye-loading solution for 1 hour at room temperature. ATP
(50 μL/well) was added by FlexStation®.
Key Features of Fura-6™
• Fura-6™ responses to calcium the same way as Fura-2 does
• Red-shifted dual excitation wavelengths (354 nm/415 nm)
• Better excited at 405 nm for low cytometric applications
• Compatible with common ilter sets.
• Higher signal/background ratio than that of Fura-2
BTC
Among the ratiometric calcium indicators, Fura-2 and Indo-1 are
most commonly used. BTC is another excitation-ratioable calcium
indicator. However, BTC can only be used for high calcium level
detection due to its low ainity to calcium. In recent years, BTC
has been increasingly used for monitoring potassium channels
since BTC demonstrated an excellent luorescence enhancement
response upon binding thallium ion that selectively passes through
potassium channels.
Figure 2.8. The chemical structure of BTC AM
Fura-6™ AM
Fura-2 AM

Table 2.6 Ratiometric Fluorescent Calcium Indicators
Cat # Product Name SizeZero Calcium High Calcium
Kd
(nM)Ex (nm) Em (nm) Ex (nm) Em (nm)
21054 BTC AM 1 mg 464 533 401 529 7,000
21053 BTC, tetrapotassium salt 1 mg 464 533 401 529 7,000
21021 Fura-2 AM *UltraPure grade* 1 mg 363 512 335 505 145
21025 Fura-2, pentapotassium salt 1 mg 363 512 335 505 145
21026 Fura-2, pentasodium salt 1 mg 363 512 335 505 145
21055 Fura-6™ AM 1 mg 386 532 354 524 260
21056 Fura-6™ AM 10x50 μg 386 532 354 524 260
21057 Fura-6™, potassium salt 1 mg 386 532 354 524 260
21058 Fura-6™, sodium salt 1 mg 386 532 354 524 260
21032 Indo-1 AM *UltraPure grade* 1 mg 346 475 330 401 230
21040 Indo-1, pentapotassium salt 1 mg 346 475 330 401 230
21044 Indo-1, pentasodium salt 1 mg 346 475 330 401 230
21050 Quin-2 AM 1 mg 353 495 333 495 60
21052 Quin-2, tetrapotassium salt 5 mg 353 495 333 495 60
Figure 2.12. Fluorescence emission spectra of Indo-1 in solutions containing 0 to
39 μM free Ca2+.
Ratio Imaging: Research activities are increasingly
focusing on the identiication and the spatial and temporal
distribution of e.g. local “hot spots” for dynamic changes
in ion concentration, voltage or pH in a cell or a cellular
network. Such “hot spots” are often localized in specialized
parts of a cell or in certain cells in a cellular network.
Additionally, these areas often have diferent properties
compared to the rest of the specimen in terms of cell
metabolism or structure. Conventional luorophores used
to investigate dynamic physiological states change their
emission intensity upon ion binding, pH change or voltage
change (e.g. luo-8® has increased emission upon calcium
binding). However, these markers do not take into account
that diferences in structure, diameter or marker uptake/
expression can cause changes in the quantity of emitted
light that are not in correlation with the actual ion concen-
tration, voltage or pH. To quantitatively and comparably
detect the changes in cellular structures or diferent cells, a
method insensitive to structure diameter and luorophore
concentration is needed. Ratiometric imaging ofers the
opportunity to reproducibly measure absolute intracellular
ion, voltage and pH levels/changes with respect to cell
diameter, luorophore concentration and optical properties
of the imaging setup. However, ratiometric imaging
depends on a fast change of excitation wavelength or
the detected wavelength, a strong light source, excellent
transmission of optical components and fast signal
detection. The recent development of ultrafast ilter wheels,
UV-light optimized objectives, highly sensitive luorophores
and new CCD cameras allows afordable quantitative high
speed live cell imaging in high spatial resolution.
Ratiometric Calcium Indicatorswww.aatbio.com
2
Ca
lcium
De
tectio
n
Tel: 800-990-8053 • Fax: [email protected] • [email protected]
Unless otherwise speciied, all products are for Research Use Only.
Not for use in diagnostic or therapeutic procedures.13
Indo-1
In contrast to Fura-2, Fura-6™ and BTC, Indo-1 is the preferred
emission-ratioable dye for low cytometry, where it is more practical
to use a single laser for excitation (usually the 351–364 nm spectral
lines of the argon-ion laser). The emission maximum of Indo-1
shifts from ~475 nm in Ca2+-free medium to ~400 nm when the
dye is saturated with Ca2+ (see Figure 2.12). While Indo-1 is not cell
permeant, its pentaacetoxymethyl ester, Indo-1 AM, enters the cell
where it is cleaved by intracellular esterases to give Indo-1.

Table 2.7 Screen Quest™ FLIPR® Calcium Assay Kits
Cat # Product Name Size Ex (nm) Em (nm)
36315 Screen Quest™ Fluo-8® No Wash Calcium Assay Kit 10 plates 490 525
36316 Screen Quest™ Fluo-8® No Wash Calcium Assay Kit 100 plates 490 525
36308 Screen Quest™ Fluo-8® No Wash Calcium Assay Kit *Medium Removal* 10 plates 490 525
36309 Screen Quest™ Fluo-8® No Wash Calcium Assay Kit *Medium Removal* 100 plates 490 525
36320 Screen Quest™ Fura-2 No Wash Calcium Assay Kit 10 plates 340/380 510
36321 Screen Quest™ Fura-2 No Wash Calcium Assay Kit 100 plates 340/380 510
36334 Screen Quest™ Rhod-4™ No Wash Calcium Assay Kit 10 plates 530 590
36335 Screen Quest™ Rhod-4™ No Wash Calcium Assay Kit 100 plates 530 590
36331 Screen Quest™ Rhod-4™ No Wash Calcium Assay Kit *Medium Removal* 10 plates 530 590
36332 Screen Quest™ Rhod-4™ No Wash Calcium Assay Kit *Medium Removal* 100 plates 530 590
2
Ca
lciu
m D
ete
ctio
n
14 Tel: 800-990-8053 • Fax: [email protected] • [email protected]
Tel: 800-990-8053 • Fax: [email protected] • [email protected]
Unless otherwise speciied, all products are for Research Use Only.
Not for use in diagnostic or therapeutic procedures.
FLIPR® Calcium Assays www.aatbio.com
Calcium lux assays are preferred methods in drug discovery for
screening G protein coupled receptors (GPCRs). Cells expressing a
GPCR of interest that signals through calcium are pre-loaded with
our proprietary Fluo-8® AM or Rhod-4™ AM which can cross cell
membrane. Screen Quest™ Calcium Assay Kits provide an opti-
mized assay method for monitoring GPCRs and calcium channels.
The assay can be performed in a convenient 96-well or 384-well
microtiter-plate format and easily adapted to automation.
Fluo-8® AM is the brightest calcium indicator available for HTS
screening. The characteristics of the convenient 488 nm excitation,
high sensitivity, and 100-250 times luorescence increases (when it
forms complexes with calcium) make Fluo-8® AM an ideal indicator
for the measurement of intracellular calcium.
Rhod-4™ AM is the brightest red calcium indicator available for HTS
screening. Once inside the cell, the lipophilic blocking groups of
Rhod-4™ AM are cleaved by non-speciic cell esterase, resulting in
a negatively charged luorescent dye that stays inside cells, and its
luorescence is greatly enhanced upon binding to calcium. When
cells stimulated with screening compounds, the receptor signals
the release of intracellular calcium, which greatly increases the
luorescence of Rhod-4™. The characteristics of its long wavelength,
high sensitivity, and >250 times luorescence increases (when it
forms complexes with calcium) make Rhod-4™ AM an ideal indica-
tor for the measurement of intracellular calcium.
Our Fura-2 calcium kit provides the only ratiometric FLIPR® calcium
assay commercially available for screening GPCRs and calcium
channel targets. The Fura-2 kit uses excitation ratio of 340/380 nm,
monitoring emission at 510 nm.
Figure 2.13. Carbachol dose responses were measured in HEK-293 cells with Screen
Quest™ Fluo-8® No Wash Calcium Assay Kit and Fluo-4 No Wash Calcium Assay Kit.
HEK-293 cells were seeded overnight at 40,000 cells/100 μL/well in a Costar black
wall/clear bottom 96-well plate. The cells were incubated with 100 μL of dye-loading
solution using Screen Quest™ Fluo-8® No Wash Calcium Assay Kit or Fluo-4 No Wash
Kit (according to the manufacturer’s instructions) for 1 hour at room temperature.
Carbachol (50 μL/well) was added by NOVOstar (BMG Labtech) to achieve the inal
indicated concentrations.
Figure 2.14. ATP dose responses were measured in CHO cells with Screen Quest™
Fura-2 No Wash Calcium Assay Kit. CHO-K1 cells were seeded overnight at 40,000
cells/100 μL/well in a Costar black wall/clear bottom 96-well plate. The cells were
incubated with 100 μL of Screen Quest™ Fura-2 No Wash Calcium Assay Kit for 1 hour
at room temperature. ATP (50 μL/well) was added by FlexStation® (Molecular Devices)
to achieve the inal indicated concentrations.
2.4 FLIPR® Calcium Assays
Carbachol Dose (μM)
Fluo-8® No Wash
Fluo-4 No Wash
ATP (μM)

Table 2.8 Luminescent Calcium Indicators*
Cat # Product Name Size Em (nm) RL HRT (ms)
21150 Coelenterazine *UltraPure grade* 250 µg 466 1 6-30
21151 Coelenterazine cp *UltraPure grade* 250 µg 442 28 2-5
21152 Coelenterazine f *UltraPure grade* 250 µg 472 20 6-30
21153 Coelenterazine h *UltraPure grade* 250 µg 466 16 6-30
21154 Coelenterazine hcp *UltraPure grade* 250 µg 445 500 2-5
21155 Coelenterazine n *UltraPure grade* 250 µg 468 0.15 6-30
36305 Screen Quest™ Luminometric Calcium Assay Kit 10 plates 466 16 6-30
* Notes: a). RL = relative luminescence; HRT = half rise time in milli seconds; b). Data from O. Shimomura, et al. (1993). The relative rate of aequorin regeneration from apoaequorin
and coelenterazine analogues. Biochem J 296 (Pt 3), 549-51.
15
2
Ca
lcium
De
tectio
n
Tel: 800-990-8053 • Fax: [email protected] • [email protected]
Unless otherwise speciied, all products are for Research Use Only.
Not for use in diagnostic or therapeutic procedures.
Luminescent Calcium Detectionwww.aatbio.com
Figure 2.15. The aequorin-based calcium assay principle. Coelenterazine h is the
preferred luminophore used in the luminescence-based calcium assays.
The aequorin complex comprises a 22,000-dalton apoaequorin
protein, molecular oxygen and the luminophore coelenterazine.
When three Ca2+ ions bind to this complex, coelenterazine is
oxidized to coelenteramide, with a concomitant release of carbon
dioxide and blue light. The approximately third-power dependence
of aequorin's bioluminescence on Ca2+ concentration allows the
measurement of Ca2+ concentrations with a broad detection range
from ~ 0.1 µM to >100 µM. Unlike luorescent Ca2+ indicators,
Ca2+-bound aequorin can be detected without illuminating the
sample, thereby eliminating the interference from autoluores-
cence.
AAT Bioquest ofers coelenterazine and several synthetic coelen-
terazine analogs for reconstituting aequorin in cells that have
been transfected with apoaequorin cDNA. In addition to native
coelenterazine, we also ofer a few derivatives of coelenterazine
that confer diferent Ca2+ ainities and spectral properties on the
aequorin complex. Recombinant apoaequorin reconstituted with
coelenterazine hcp is reported to have the best luminescence
overall, with both a high quantum yield and a fast response time.
However, intracellular reconstitution of aequorin from coelen-
terazine analogs can be relatively slow. Aequorins containing
the cp, f or h form of coelenterazine exhibit 10–20 times stronger
luminescence than that of apoaequorin reconstituted with native
coelenterazine. Coelenterazine h has been predominantly used in
HTS screening assay for GPCRs.
Besides the standalone coelenterazine products, AAT Bioquest
ofers a luminescent calcium assay kit. The kit uses a highly calcium-
sensitive and membrane-permeable coelenterazine analog as
a calcium indicator for the cells transfected with apoaequorin
gene. Our coelenterazine–based kit is much more sensitive than
the luorescence-based calcium assay kits (such as Fluo-4, Fluo-3,
Calcium-3 and Calcium-4). This kit provides an optimized assay
method for monitoring GPCRs and calcium channels. The assay can
be performed in a convenient 96-well or 384-well microtiter-plate
format and easily adapted to automation.
2.5 Luminescent Calcium Detection: Coelenterazine and Its
Synthetic Analogs
Figure 2.16. ATP dose responses on CHO-aeq cells. CHO cells stably transfected with
apoaequorin were seeded overnight at 50,000 cells/100 μL/well in a Costar white
wall/clear bottom 96-well plate. The growth medium was removed and the cells were
incubated with 100 μL of dye-loading solution using the Screen Quest™ Luminometric
Calcium Assay Kit for 3 hours at room temperature and protected from light. ATP (25
μL/well) was added by NOVOstar (BMG Labtech) to achieve the inal indicated concen-
trations. The EC50
of ATP is about 0.8 μM.
ATP (μM)

Calcium is essential for all living organisms, particularly in cell
physiology, where the movement of calcium ion into and out of
the cytoplasm functions as a signal for many cellular processes.
Calcium also plays an important role in mediating the constriction
and relaxation of blood vessels, nerve impulse transmission, muscle
contraction, and hormone secretion. The serum level of calcium
is closely regulated (9 to 10.5 mg/dL) in the human body. Both
hypocalcemia and hypercalcemia are serious medical disorders.
Amplite™ Colorimetric Calcium Assay
Amplite™ Colorimetric Calcium Quantitation Kit provides a simple
method for detecting calcium in physiology solutions. The kit uses
Calcium Blue™ as the chromogenic calcium indicator. Its absor-
bance changes in response to calcium binding. The absorbance
signal can be easily read by an absorbance microplate reader at
600 or 650 nm. The kit can be performed in a convenient 96-well
or 384-well microtiter-plate format within 5 minutes and easily
adapted to automation without a separation step. With Amplite™
Colorimetric Calcium Quantitation Kit, the calcium detection linear
range is from 0.1 to 7.5 nmoles in 100 μL inal test volume (2.5 to
150 μM calcium).
2
Ca
lciu
m D
ete
ctio
nCalcium Detection In Vitro www.aatbio.com
16 Tel: 800-990-8053 • Fax: [email protected] • [email protected]
Unless otherwise speciied, all products are for Research Use Only.
Not for use in diagnostic or therapeutic procedures.
Cat # Product Name Size
21001 BAPTA AM 25 mg
21002 BAPTA AM *UltraPure grade* 25 mg
21003 BAPTA, tetrapotassium salt 100 mg
21004 BAPTA, tetrasodium salt 100 mg
21005 EGTA AM 10 mg
21006 EGTA AM *10 mM DMSO solution* 1 mL
21008 EGTA, tetrasodium salt *10 mM aqueous solution* 10 mL
21007 EGTA, tetrasodium salt *UltraPure grade* 1 g
20053 Pluronic® F-127 *10% solution in water* 10 mL
20052 Pluronic® F-127 *20% solution in DMSO* 10 mL
20050 Pluronic® F-127 *Cell culture tested* 10 g
20060 Probenecid *Cell culture tested* 10x72 mg
20061 Probenecid *Water-soluble* 10x77 mg
Table 2.10 Non-Fluorescent Calcium Detection Reagents
Intracellular calibration of Ca2+ indicators may be achieved either
by manipulating Ca2+ levels inside cells using an ionophore or by
releasing the indicator into the surrounding medium of known
Ca2+ concentration via detergent lysis of the cells. Besides the
luorescent and luminescent calcium detection reagents, we
also ofer several non-luorescent compounds for measuring and
manipulating intracellular and extracellular Ca2+.
2.7 Non-Fluorescent Reagents for Calcium Detection
2.6 Measurement of Calcium In Vitro
Figure 2.18. Calcium dose responses were measured in a 96-well black solid plate with Amplite™ Fluorimetric Calcium Quantitation Kit. As low as 0.03 mM calcium can be detected with 5 minutes incubation (n=3).
Amplite™ Fluorimetric Calcium Assay
Amplite™ Fluorimetric Calcium Quantitation Kit provides a simple
method for detecting calcium in physiology solutions by using our
proprietary red luorescence probe. The luorescence signal can
be easily read with a luorescence microplate reader at Ex/Em =
540/590 nm. The kit can be performed in a convenient 96-well or
384-well microtiter-plate format and easily adapted to automation.
The assay can be completed within 30 minutes. With Amplite™
Fluorimetric Calcium Quantitation Kit, we have detected as little as
0.03 mM calcium. The kit has a broad dynamic range (30 µM to 10
mM). If more sensitive calcium detection is required, we recom-
mend that Fluo-8® or Fluo-3 be used instead. Both Fluo-8® and
Fluo-3 can be used for determining calcium in nM range.
Figure 2.17. Calcium dose responses were measured in a 96-well white wall/clear bottom plate with Amplite™ Colorimetric Calcium Quantitation Kit. As low as ~ 2.5 μM Ca2+ was detected with 5 minutes incubation (n=3).
Cat # Product Name Size
36361 Amplite™ Colorimetric Calcium Quantitation Kit 1 kit
36360 Amplite™ Fluorimetric Calcium Quantitation Kit 1 kit
Table 2.9 In Vitro Calcium Assay Kits
Calcium Concentration (μM)

17
Zin
c Ion
De
tectio
n
Zinc Ion Detection 3
17Unless otherwise speciied, all products are for Research Use Only.
Not for use in diagnostic or therapeutic procedures.
Tel: 800-990-8053 • Fax: [email protected] • [email protected]

3
Zin
c Io
n D
ete
ctio
n www.aatbio.com
zinc ion detection at-a-glance
Detection Mode Cell-Impermeant Cell-Permeant
Absorption Amplite™ Colorimetric Zinc Assay Kit
Blue Fluorescence Zinquin TSQ
Zinquin AM Ester
Zinquin Ethyl Ester
Green Fluorescence Amplite™ Fluorimetric Zinc Assay Kit
Metal Fluor™ Zn 520
Metal Fluor™ Zn 520 AM
18 Tel: 800-990-8053 • Fax: [email protected] • [email protected]
Unless otherwise speciied, all products are for Research Use Only.
Not for use in diagnostic or therapeutic procedures.

Zinc Ion Detectionwww.aatbio.com
3
Zin
c Ion
De
tectio
n
Zinc Ion Detection
Zinc is the second most abundant transition metal in living
organisms after iron. While most Zn2+ in the brain is tightly bound,
such that free Zn2+ levels extracellularly and intracellularly are likely
to be picomolar, a subset of glutamatergic neurons possess weakly
bound zinc in presynaptic boutons which is released at micromolar
levels in response to a variety of stimuli. The intracellular concen-
tration of free Zn2+ is extremely low in most cells (<1 nM), with the
remainder being bound to proteins or nucleic acids.
Mounting evidence indicates that zinc has multiple roles in cell
biology, as a part of metalloenzyme catalytic sites, as a structural
component of gene regulatory proteins, and as a free signal ion,
particularly in the cortex of the brain. It is of particular importance
in the regulation of gene expression, as Zn2+ binding proteins
account for nearly 50% of the transcription regulatory proteins in
the human genome. Zn2+ is also functionally active in pancreatic
insulin secretion and is a contributory factor in neurological
disorders including epilepsy and Alzheimer's disease. Free Zn2+ is
released from metalloprotein complexes during oxidative stress.
The key to the further progress in understanding the multiple roles
of zinc is the availability of luorescent Zn2+ indicator systems that
permits quantitative determination and imaging of zinc luxes and
levels over a broad concentration range both intracellularly and
extracellularly using luorescence microscopy and low cytometry.
AAT Bioquest ofers the classic TSQ, zinquin, as well as our newly
developed sensitive Metal Fluor™ Zn 520 to help elucidate the role
of Zn2+ release and the localization of free or chelatable Zn2+ in
cells.
1919Unless otherwise speciied, all products are for Research Use Only.
Not for use in diagnostic or therapeutic procedures.
Tel: 800-990-8053 • Fax: [email protected] • [email protected]
Figure 3.1. Zinc dose responses were measured in a 96-well clear bottom plate with
Amplite™ Colorimetric Zinc Ion Quantitation Kit. As low as 2 µM Zn2+ can be detected
with 30 minutes incubation (n=3).
Zinc is an essential trace mineral element that plays an important
role in a number of biological processes. It is an essential factor
required for many enzymes, protein structures, and control of
genetic expression. Zinc status also afects basic processes of cell
division, growth, diferentiation, development and aging. Clinical
signs of zinc deiciency include acrodermatitis, low immunity,
diarrhea, poor healing, stunting, hypogonadism, fetal growth
failure, teratology and abortion. Simple, direct and automation-
ready procedures for measuring are highly desirable in research
and drug discovery.
AAT Bioquest’s Amplite™ Colorimetric Zinc Ion Quantitation Kit
provides a simple method for detecting zinc concentration in
biological samples using our proprietary Zin-620™, in which zinc
binds to the probe with the enhanced absorption around 620 nm.
The zinc probe exhibits a large increase in 620 nm absorption in
response to Zn2+ (>100 folds). Our kit formulation has enhanced
Zn2+-speciicity with little responses to other metals, e.g., Ca2+ and
Mg2+. The assay can be used with biological samples such as serum,
plasma, and urine with detection sensitivity at 1 µM.
3.1 Amplite™ Colorimetric Zinc Ion Assay
Figure 3.2. The absorption spectra of Zin-620™ in the absence of zinc ion (A) and in
the presence of zinc ion (B, 1 mM).
AAT Bioquest’s Amplite™ Fluorimetric Zinc Ion Quantitation Kit
provides a simple method for detecting zinc concentration in
biological samples using our proprietary Metal Fluor™ Zn 520,
in which zinc binds to the probe with enhanced luorescence at
Ex/Em= 485/525 nm. The zinc probe exhibits a large increase in
luorescence in response to Zn2+ (greater than 200~300 folds). It has
high Zn2+-speciicity with little responses to other metals, including
Ca2+, Mg2+, Mn2+, and Cu2+. The assay can be used with biological
samples such as serum, plasma, and urine with detection sensitivity
at 0.2 μM (13 ng/mL).
3.2 Amplite™ Fluorimetric Zinc Ion Assay
A B
Zn2+ Dose (μM)

20 Tel: 800-990-8053 • Fax: [email protected] • [email protected]
Unless otherwise speciied, all products are for Research Use Only.
Not for use in diagnostic or therapeutic procedures.
3
Zin
c Io
n D
ete
ctio
nZinc Ion Detection www.aatbio.com
Jang BG, Won SJ, Kim JH, Choi BY, Lee MW, Sohn M, Song HK, Suh
SW. (2012) EAAC1 gene deletion alters zinc homeostasis and en-
hances cortical neuronal injury after transient cerebral ischemia in
mice. J Trace Elem Med Biol, 26, 85.
Lee JY, Kim JS, Byun HR, Palmiter RD, Koh JY. (2011) Dependence
of the histoluorescently reactive zinc pool on zinc transporter-3 in
the normal brain. Brain Res, 1418, 12.
Meeusen JW, Nowakowski A, Petering DH. (2012) Reaction of metal-
binding ligands with the zinc proteome: zinc sensors and N,N,N',N'-
tetrakis(2-pyridylmethyl)ethylenediamine. Inorg Chem, 51, 3625.
Nowakowski AB, Petering DH. (2011) Reactions of the luorescent
sensor, Zinquin, with the zinc-proteome: adduct formation and
ligand substitution. Inorg Chem, 50, 10124.
Wang T, Zheng W, Xu H, Zhou JM, Wang ZY. (2010) Clioquinol
inhibits zinc-triggered caspase activation in the hippocampal CA1
region of a global ischemic gerbil model. PLoS One, 5, e11888.
3.6 References
Cat # Product Name Size Ex (nm) Em (nm)
19001Amplite™ Colorimetric Zinc Ion
Quantitation Kit200 tests 620 N/A
19000Amplite™ Fluorimetric Zinc Ion
Quantitation Kit200 tests 492 514
21263 Metal Fluor™ Zn 520 AM 1 mg 490 514
21262 Metal Fluor™ Zn 520, potassium salt 1 mg 490 514
21254 TSQ 5 mg 344 385
21260 Zinquin "UltraPure grade" 5 mg 360 480
21261 Zinquin AM "UltraPure grade" 5 mg 360 480
21253 Zinquin Ethyl Ester "UltraPure grade" 5 mg 360 480
Table 3.1 Zinc Ion Indicators and Assay Kits
TSQ is selective for Zn2+ in the presence of physiological concentra-
tions of Ca2+ and Mg2+ ions. TSQ-based assays for Zn2+ in seawater
and other biological systems exhibit a detection limit of ~0.1 nM.
The complex of TSQ with free Zn2+ apparently has a stoichiometry
of 2:1/TSQ-Zn. TSQ can be used to localize Zn2+ pools in the central
nervous system, and to identify a broad distribution of Zn2+ in neo-
natal mice, particularly associated with rapidly proliferating tissues,
such as skin and gastrointestinal epithelium. TSQ has also been
used to detect Zn2+ translocation from presynaptic nerve terminals
into postsynaptic nerve terminals when blood low is constricted in
the brain during ischemic events. TSQ is a selective nontoxic stain
3.4 TSQ
Metal Fluor™ Zn 520 indicator is designed for the detection of
Zn2+ at higher concentrations that are present in synaptic vesicles
and released in response to electrical stimulation or excitotoxic
agonists. It is designed for the detection of Zn2+ in the 0.1 - 100
μM range with minimal Ca2+ interference. Metal Fluor™ Zn 520 is
suitable for the detection of Zn2+ concentrations in the 0.2 - 100
µM range. Its cell permeant AM-ester is useful for detecting high
intracellular Zn2+ levels and small Zn2+ concentration changes.
3.3 Metal Fluor™ Zn 520
Zinquin ethyl ester and AM ester are lipophilic, zinc-sensitive and
cell-permeant luorescent probes. They are retained in living cells
because the AM and ethyl ester are cleaved by cytosolic esterase
to give zinquin that carries a negative charge, preventing its elux
across the plasma membrane. Zinquin luorescent probes may be
loaded into cells using the culture medium containing 5-40 µM
zinquin AM or ethyl ester in PBS with calcium and magnesium
(or in culture medium). Cells are normally incubated with the
zinquin AM or ethyl ester for 15-30 minutes at 37 ºC. Exact loading
concentration, time and temperature depend on the purpose of
the experiment and cell type, and so will need to be optimized
experimentally. Cells are washed in PBS with culture medium
to remove the extracellular remaining dye and observed under
microscope, FACS or luorescence spectrophotometer.
3.5 Zinquin
Figure 3.3. Zinc dose responses were measured in a 96-well black plate with the Am-
plite™ Fluorimetric Zinc Ion Quantitation Kit. As low as ~ 0.2 µM Zn2+ can be detected
with 5 minutes incubation (n=3).
Figure 3.4. Fluorescence excitation and emission spectra of Metal FluorTM Zn 520 in
the presence of 1 mM Zn2+.
for pancreatic islet cells, which have a high content of Zn2+, and
may be useful for their low cytometric isolation.
Zn2+ Dose (μM)

21
Intra
cellu
lar p
H P
rob
es
Intracellular pH Probes 4
Unless otherwise speciied, all products are for Research Use Only.
Not for use in diagnostic or therapeutic procedures.
Tel: 800-990-8053 • Fax: [email protected] • [email protected]

Detection Mode Single Wavelength Detection Ratiometric Detection (Dual Wavelength)
Blue Fluorescence PDMPO
Green Fluorescence Protonex™ Green BCECF
BCFL
Red Fluorescence Protonex™ Red
22
www.aatbio.com
4
Intr
ace
llu
lar
pH
Pro
be
s
Tel: 800-990-8053 • Fax: [email protected] • [email protected]
Unless otherwise speciied, all products are for Research Use Only.
Not for use in diagnostic or therapeutic procedures.
intracellular pH probes at-a-glance

23
www.aatbio.co BCECF & BCFL
Intracellular pH Probes
Fluorescent dyes provide the increased sensitivity required for
optical pH measurements inside live cells. They also ofer much
greater spatial sampling capability when compared with microelec-
trode techniques. These advantages have spurred the development
of improved luorescent dyes that can sense pH changes within
physiological ranges. To quantitatively measure pH, it is essential
to match the indicator’s pKa to the pH of the experimental system.
Intracellular pH is generally between ~6.8 and 7.4 in the cytosol
and ~4.5 and 6.0 in acidic organelles such as lysosomes. AAT
Bioquest ofers a variety of luorescent pH indicators, pH indicator
conjugates and other reagents for pH measurements in biological
systems. RationWorks™ are optimized for measuring intracellular
pH accurately by the ratio of two emissions or two excitations.
Protonex™ pH dyes are developed to monitor acidic organelles and
endocytosis.
Intra
cellu
lar p
H P
rob
es
4
4.1 Near Neutral pH Measurement
BCECF
Intracellular pH plays an important modulating role in many cel-
lular events, including cell growth, calcium regulation, enzymatic
activity, receptor-mediated signal transduction, ion transport, en-
docytosis, chemotaxis, cell adhesion, and other cellular processes.
pH-sensitive luorescent dyes have been widely applied to monitor
changes in intracellular pH in recent years. Imaging techniques that
use luorescent pH indicators also allow researchers to investigate
these processes with much greater spatial resolution and sampling
density that can be achieved using other technologies such as
microelectrode. Among them, 2’,7’-bis-(2-carboxyethyl)-5-(and-6)-
carboxyluorescein (BCECF) is the most popular pH probe since
it can be used to monitor cellular pH ratiometrically. However, all
the commercial BCECF AM is a complex mixture of six isomers
with diferent ratios from batch to batch, complicating the BCECF
applications.
Figure 4.1. Structures of BCECF AM (the complicated mixture of six components).
BCFL AM, a superior replacement to BCECF AM
BCFL AM is developed to overcome the isomer diiculty associated
with BCECF AM. As BCECF AM, BCFL AM exhibits pH-dependent
dual excitations, essentially identical to those of BCECF AM. It has a
pKa of ~7.0, identical to BCECF AM too. As with BCECF AM, the dual
excitation spectrum of BCFL AM with an isosbestic point at 454 nm
should make BCFL AM a good excitation-ratiometric pH indicator.
BCFL ratiometric imaging makes intracellular pH determination
essentially independent of several variable factors, including dye
concentration, path length, cellular leakage and photobleaching
rate. BCFL AM is a single isomer, making the pH measurement
much more reproducible than BCECF AM, which is consisted of
quite a few diferent isomers.
Figure 4.2. The luorescence excitation ratios of BCFL at 488 nm and 440 nm were
measured with 530 nm emission at pH 4.5, 6, 7, 9, 11, 12 and 13 using standard bufer
solutions. The higher the pH, the higher the luorescence signal with longer excitation
wavelength (488 nm), and the lower the luorescence signal with shorter excitation
wavelength (440 nm).
Cat # Product Name Size pKa
Ex
(nm)
Em
(nm)
21201 BCECF Acid 1 mg 7.0 503 528
21202 BCECF AM 1 mg 7.0 503 528
21203 BCECF AM *UltraPure grade* 20x50 µg 7.0 505 520
21180Cell Meter™ Fluorimetric Intracellular
pH Assay Kit500 tests N/A 503 528
21189RatioWorks™ BCFL Acid *Superior
Replacement to BCECF*1 mg 7.0 503 528
21190RatioWorks™ BCFL AM *Superior
Replacement to BCECF AM*1 mg 7.0 503 528
21191RatioWorks™ BCFL SE *Superior
Replacement to BCECF SE*1 mg 7.0 503 528
Table 4.1 Fluorescent pH Probes for Near -Neutral pH Environments
Unless otherwise speciied, all products are for Research Use Only.
Not for use in diagnostic or therapeutic procedures.
Tel: 800-990-8053 • Fax: [email protected] • [email protected]

24
PDMPO & Protonex™ Green www.aatbio.com
4.2 Acidic pH Measurement and Endocytosis
PDMPO, an unique dual excitation and dual-emission ratio-
metric pH indicator
The existing pH probes are unsuitable to study acidic organelles
such as lysosomes, endosomes, spermatozoa and acrosomes
because their luorescence is signiicantly reduced at lower pH.
In addition, most of the existing pH probes (such as BCECF and
SNARF) are not selectively localized in acidic organelles. The grow-
ing potential of ratio imaging is signiicantly limited by the lack of
appropriate luorescent probes for acidic organelles although ratio
imaging has received intensive attention in the past few decades.
PDMPO [2-(4-pyridyl)-5-((4-(2-dimethylaminoethylaminocarba-
moyl)methoxy)phenyl)oxazole] is characterized as an acidotropic
dual-excitation and dual-emission pH probe. It emits intense yellow
luorescence at lower pH and gives intense blue luorescence at
higher pH. This unique pH-dependent luorescence makes PDMPO
an ideal pH probe for acidic organelles with pKa = 4.47. PDMPO
selectively labels acidic organelles (such as lysosomes) of live cells
and the two distinct emission peaks can be used to monitor the pH
luctuations of live cells in ratio measurements. Additionally, the
very large Stokes shift and excellent photostability of PDMPO make
it an excellent luorescent acidotropic reagent for luorescence
imaging. The unique luorescence properties of PDMPO might give
researchers a new tool with which to study the acidic organelles of
live cells. PDMPO can be well excited by the violet laser at 405 nm
for low cytometric applications.
Figure 4.3. pH titration of PDMPO. Top: Excitation; Bottom: Emission.
Protonex™ Green, an unique pH probe for monitoring acidic
organelles
Protonex™ Green dye demonstrates pH-dependent luorescence.
Unlike most of the existing luorescent dyes that are more luo-
rescent at higher pH, acidic conditions enhance the luorescence
of Protonex™ Green dye. The luorescence of Protonex™ Green
dye increases as pH decreases from neutral to acidic. The lack of
luorescence outside the cell eliminates the wash steps. Protonex™
Green dye provides a powerful tool to monitor acidic cell compart-
ments such as endosomes and lysosomes. Protonex™ Green dye
is non-luorescent outside the cells, but luoresces brightly green
in acidic compartments (such as phagosomes, lysosomes and
endosomes). It enables the speciic detection of cellular acidic
compartments with reduced signal variability and improved
accuracy for imaging or low applications. Protonex™ Green has the
spectral properties similar to those of FITC, making the common
ilter set of FITC readily available to the assays of Protonex™ Green.
Figure 4.4. Excitation and emission spectra of ProtonexTM Green at pH 4.0.
Figure 4.5. pH titration of Protonex™ Green (excited at 450 nm).
Tel: 800-990-8053 • Fax: [email protected] • [email protected]
Unless otherwise speciied, all products are for Research Use Only.
Not for use in diagnostic or therapeutic procedures.
4
Intr
ace
llu
lar
pH
Pro
be
s

25
Intra
cellu
lar p
H P
rob
es
4
Unless otherwise speciied, all products are for Research Use Only.
Not for use in diagnostic or therapeutic procedures.
Tel: 800-990-8053 • Fax: [email protected] • [email protected]
www.aatbio.com Protonex™ Probes and pH Dye Conjugates
Protonex™ Red, an excellent replacement to pHrodo™
Protonex™ Red dye provides a powerful tool to monitor acidic cell
compartments such as endosomes and lysosomes. Protonex™ Red
dye is non-luorescent outside the cells, but luoresces brightly
red in acidic compartments (such as phagosomes, lysosomes and
endosomes). The luorescence of Protonex™ Red dye dramatically
increases as pH decreases from neutral to acidic. The lack of
luorescence outside the cell eliminates the wash steps. Protonex™
Red enables the speciic detection of cellular acidic compartments
with reduced signal variability and improved accuracy for imaging
or low cytometry applications. It can be also used for multiplexing
cellular functional analysis with green luorescent dyes such as GFP,
Fluo-8®, calcein, or FITC-labeled antibodies. Protonex™ Red has
the spectral properties similar to those of Texas Red®, making the
common ilter set of Texas Red® readily available to the assays of
Protonex™ Red.
Figure 4.6. Excitation and emission spectra of Protonex™ Red at pH 4.0.
Cat # Product Name Size Ex (nm) Em (nm)
21215 Protonex™ Green 500 1 mg 443 505
21207 Protonex™ Red 600 1 mg 575 597
21204 RatioWorks™ PDMPO 1 mg 405 550
Table 4.2 Fluorescent pH Probes for Acidic pH Environments
4.3 Reactive pH Indicators and Their Dextran Conjugates
The dextran conjugates of pH probes have high water solubility,
therefore must be loaded into cells by microinjection, whole-cell
patch-clamping, endocytosis or liposome fusion. Once loaded,
dextrans are retained in viable cells for long periods and will not
pass through gap junctions. Compared to the cell-permeant
acetoxymethyl (AM) ester derivatives, the pH dye dextran conju-
gates are less likely compartmentalized in cells.
BCECF and BCFL Dextran Conjugates for Measuring Near-
Neutral pH
AAT Bioquest’s BCECF and BCFL dextrans are important dual-
excitation pH indicator conjugates for pH measurements near
pH 7.0. BCECF and BCFL dextran–labeled cells have been shown
to produce much more stable luorescent signals, reduced probe
compartmentalization and greater resistance to light-induced
damage when compared with BCECF and BCFL AM–labeled
cells. The BCECF and BCFL dextran conjugates have been used to
monitor intracellular pH increases during developmental processes
and to measure pH in submucosal gland secretions from human
lung tissues. Compared to BCECF dextran conjugates, BCFL dextran
conjugates give much more reproducible results due to the
minimal quality variation from batch to batch. BCECF is a mixed
population of diferent isomers that have varied isomer ratio from
lot to lot while BCFL is a single isomer although their pH proiles
are almost identical. We recommend you to use BCFL for the assays
that require low deviation.
Protonex™ Dextran Conjugates for Monitoring Endocytosis
Our Protonex™ dextran conjugates are excellent alternatives to
other luorescent dextran conjugates (e.g., BCECF and pHrodo™)
for live-cell imaging of endocytosis. Protonex™ dextrans possess a
pH-sensitive luorescence emission that increases in intensity with
increasing acidity. Protonex™ dextran is essentially nonluorescent
in the extracellular environment; however, upon internalization, the
acidic environment of the endosomes generates a bright luores-
cent signal from the Protonex™ dextran conjugates. The minimal
luorescent signal from the Protonex™ dextran conjugate at neutral
pH prevents the detection of noninternalized and nonspeciically
bound conjugates and eliminates the extra wash steps, thus
providing a simple luorescent assay for endocytic activity. AAT
Bioquest ofers a few Protonex™ dextran conjugates with diferent
wavelengths for multicolor cell analysis (e.g., with GFP cell lines).
They can be used to study or monitor endocytosis on a variety of
platforms including luorescence microscopy, low cytometry and
high-content imaging.
RatioWorks™ PDMPO Dextran Conjugates
Although BCECF and BCFL dextrans are useful for detecting
translocation into compartments that have an acidic pH; their
relative insensitivity to luorescence change below pH ~6 limits
quantitative pH estimation. The lower pKa values of the PDMPO
dextran conjugate make it a more suitable indicator for estimating
the pH of relatively acidic lysosomal environments. Moreover, the
shift in its excitation and emission spectra in acidic media permits
ratiometric pH measurements.
Our PDMPO dextran conjugates can be used to quickly and
accurately estimate the pH of lysosomes. As the labeled dextran is
taken up by the cells and moves through the endocytic pathway,
the PDMPO luorescence changes from blue luorescent in the
near-neutral endosomes to yellow luorescent in the acidic
lysosomes. The greatest change in luorescence emission occurs
near the pKa of the dye at pH ~4.2. The pH in lysosomes can be
measured with PDMPO dextrans using luorescence microscopy or
low cytometry.
Reactive pH Probes for Preparing pH-Sensitive Bioconjugates
The amine-reactive succinimidyl ester form of BCFL, Protonex™ and
PDMPO pH probes provide access to a wide variety of user-deined

26
bioconjugates. Protonex™ dyes are extremely sensitive to its local
environment, therefore the pH response of each bioconjugate
must be individually determined. Protonex™ succinimidyl esters
have been used to label dexamethansone-treated thymocytes for
low cytometric analysis of phagocytosis by splenic or peritoneal
macrophages and for live-cell confocal imaging of antigen transfer
from human B lymphocytes to macrophages.
4
Intr
ace
llu
lar
pH
Pro
be
s
Tel: 800-990-8053 • Fax: [email protected] • [email protected]
Unless otherwise speciied, all products are for Research Use Only.
Not for use in diagnostic or therapeutic procedures.
References for Intracellular pH Probes www.aatbio.com
Cat # Product Name Size Ex (nm) Em (nm)
21211 RatioWorks™ PDMPO Dextran 1 mg 405 540
21210 RatioWorks™ PDMPO, SE 1 mg 405 550
21217 Protonex™ Green 500 Dextran 1 mg 443 505
21216 Protonex™ Green 500, SE 1 mg 443 505
21209 Protonex™ Red 600-Latex Bead Conjugate 1 mL 575 597
21208 Protonex™ Red 600, SE 1 mg 575 597
Table 4.3 Reactive Fluorescent pH Probes and Their Dextran Conjugate
Aon, J. C. and S. Cortassa (1997). "Fluorescent measurement of the
intracellular pH during sporulation of Saccharomyces cerevisiae."
FEMS Microbiol Lett 153(1): 17-23.
Arruda, J. A., R. P. Wheeler, et al. (1987). "Intracellular pH of the turtle
bladder assessed with luorescent probes." Miner Electrolyte Metab
13(2): 104-111.
Breeuwer, P. and T. Abee (2000). "Assessment of the intracellular pH
of immobilized and continuously perfused yeast cells employing
luorescence ratio imaging analysis." J Microbiol Methods 39(3):
253-264.
Chitarra, L. G., P. Breeuwer, et al. (2000). "Rapid luorescence assess-
ment of intracellular pH as a viability indicator of Clavibacter michi-
ganensis subsp. michiganensis." J Appl Microbiol 88(5): 809-816.
Cimprich, P. and J. Slavik (1996). "Fluorescence measurement of
intracellular pH of the yeast Saccharomyces cerevisiae." Folia Micro-
biol (Praha) 41(1): 84.
de Poorter, L. M. and J. T. Keltjens (2001). "Convenient luorescence-
based methods to measure membrane potential and intracellular
pH in the Archaeon Methanobacterium thermoautotrophicum." J
Microbiol Methods 47(2): 233-241.
Dennis, A. M., W. J. Rhee, et al. (2012). "Quantum dot-luorescent
protein FRET probes for sensing intracellular pH." ACS Nano 6(4):
2917-2924.
Fang, W., H. Siegumfeldt, et al. (2004). "Osmotic stress leads to de-
creased intracellular pH of Listeria monocytogenes as determined
by luorescence ratio-imaging microscopy." Appl Environ Microbiol
70(5): 3176-3179.
Grant, R. L. and D. Acosta (1997). "Ratiometric measurement of
intracellular pH of cultured cells with BCECF in a luorescence multi-
4.4 References
well plate reader." In Vitro Cell Dev Biol Anim 33(4): 256-260.
Guldfeldt, L. U. and N. Arneborg (1998). "Measurement of the
efects of acetic acid and extracellular pH on intracellular pH of
nonfermenting, individual Saccharomyces cerevisiae cells by luo-
rescence microscopy." Appl Environ Microbiol 64(2): 530-534.
Han, J. and K. Burgess (2010). "Fluorescent indicators for intracellu-
lar pH." Chem Rev 110(5): 2709-2728.
Hanakam, F. and G. Gerisch (1999). "Monitoring intracellular shut-
ting of histidine-rich pH sensor proteins tagged with green luores-
cent protein." Methods Enzymol 302: 51-58.
Hegyi, P., Z. Rakonczay, Jr., et al. (2004). "Measurement of intracel-
lular pH in pancreatic duct cells: a new method for calibrating the
luorescence data." Pancreas 28(4): 427-434.
Hille, C., M. Berg, et al. (2008). "Time-domain luorescence lifetime
imaging for intracellular pH sensing in living tissues." Anal Bioanal
Chem 391(5): 1871-1879.
Iwami, Y., K. Kawarada, et al. (2002). "Intracellular and extracellular
pHs of Streptococcus mutans after addition of acids: loading and
elux of a luorescent pH indicator in streptococcal cells." Oral
Microbiol Immunol 17(4): 239-244.
Lanz, E., J. Slavik, et al. (1999). "2',7'-bis-(2-carboxyethyl)-5(6)-
carboxyluorescein as a dual-emission luorescent indicator of
intracellular pH suitable for argon laser confocal microscopy." Folia
Microbiol (Praha) 44(4): 429-434.
Liang, E., P. Liu, et al. (2007). "Use of a pH-sensitive luorescent
probe for measuring intracellular pH of Caco-2 cells." Int J Pharm
338(1-2): 104-109.
Liimatta, E., A. M. Kantola, et al. (2007). "Dual probe luorescence
monitoring of intracellular free calcium during ischemia in mouse
heart by using continuous compensation for pH dependence of the
dissociation constant of Fura-2, and the interference of myoglobin."
J Biochem Biophys Methods 70(4): 547-554.
Manning, T. J., Jr. and H. Sontheimer (1999). "Recording of intracel-
lular Ca2+, Cl-, pH and membrane potential in cultured astrocytes
using a luorescence plate reader." J Neurosci Methods 91(1-2):
73-81.
McNamara, K. P., T. Nguyen, et al. (2001). "Synthesis, characteriza-
tion, and application of luorescence sensing lipobeads for intracel-
lular pH measurements." Anal Chem 73(14): 3240-3246.
Rechinger, K. B. and H. Siegumfeldt (2002). "Rapid assessment of
cell viability of Lactobacillus delbrueckii subsp. bulgaricus by mea-
surement of intracellular pH in individual cells using luorescence
ratio imaging microscopy." Int J Food Microbiol 75(1-2): 53-60.
Sun, X., Y. Wang, et al. (2011). "Simultaneous monitoring of intra-
cellular pH changes and hemodynamic response during cortical
spreading depression by luorescence-corrected multimodal opti-
cal imaging." Neuroimage 57(3): 873-884.

27
Anion Detection 5
An
ion
De
tectio
n
Unless otherwise speciied, all products are for Research Use Only.
Not for use in diagnostic or therapeutic procedures.
Tel: 800-990-8053 • Fax: [email protected] • [email protected]

Tel: 800-990-8053 • Fax: [email protected] • [email protected]
Unless otherwise speciied, all products are for Research Use Only.
Not for use in diagnostic or therapeutic procedures.28
www.aatbio.com
anion detection at-a-glance*
Anion Colorimetric Detection Fluorimetric Detection
Chloride 36350 21250, 21252, 21255, 21259
Phosphate 21600, 21659, 21665 21660
Pyrophosphate 21611
* products listed by catalog number
An
ion
De
tect
ion
5

www.aatbio.com Chloride DetectionA
nio
n D
ete
ction
29
Anion Detection
5
Cystic ibrosis transmembrane conductance regulator (CFTR)
functions as a cAMP-activated ATP-gated anion channel, increas-
ing the conductance for certain anions (e.g. Cl–) to low down their
electrochemical gradient. ATP-driven conformational changes
in CFTR open and close a gate to allow transmembrane low of
anions down their electrochemical gradient. The measurement
of intracellular chloride concentrations and the study of chloride
channels have been stimulated by the discovery that cystic ibrosis
is caused by mutations in a gene encoding CFTR. Chloride perme-
ability assays are used to detect the activities of the CFTR and other
anion transporters. A number of chronic disease states such as
cystic ibrosis and Bartter's syndrome are due to defects in chloride
channel functions.
5.1 Chloride Detection
Quinolinium-Based Fluorescent Chloride Indicators
Most of the existing luorescent chloride indicators are derived
from quinolinium, including MEQ, MQAE and SPQ. All of these
indicators detect chloride via difusion-limited collisional quench-
ing. This detection mechanism is diferent from that of luorescent
indicators for Ca2+ and Zn2+. It involves a transient interaction
Unless otherwise speciied, all products are for Research Use Only.
Not for use in diagnostic or therapeutic procedures.
Tel: 800-990-8053 • Fax: [email protected] • [email protected]
Figure 5.1. Cystic ibrosis transmembrane conductance regulator (CFTR) is a protein
that is encoded by the CFTR gene. CFTR is an ABC transporter-class ion channel
that transports chloride and thiocyanate ions across epithelial cell membranes.
Mutations of the CFTR gene afect functioning of the chloride ion channels in these
cell membranes, leading to cystic ibrosis and congenital absence of the vas deferens.
The gene that encodes the CFTR protein is found on the human chromosome 7, on the
long arm at position q31.2 from base pair 116,907,253 to base pair 117,095,955. CFTR
orthologs have also been identiied in all mammals for which complete genome data
are available. The CFTR gene has been used in animals as a nuclear DNA phylogenetic
marker. Large genomic sequences of this gene have been used to explore the
phylogeny of the major groups of mammals, and conirmed the grouping of placental
orders into four major clades: Xenarthra, Afrotheria, Laurasiatheria, and Euarchonta
plus Glires.
Fluorescence of the quinolinium dyes is quite sensitive to solution
viscosity and volume since the chloride-dependent luorescence
quenching is a difusional process. The eiciency of collisional
quenching is characterized by the Stern–Volmer constant (KSV
)
— the reciprocal of the ion concentration that produces 50% of
maximum quenching. In these assays, SPQ- or MQAE-loaded cells
are successively perfused with chloride-containing extracellular
medium followed by medium in which the chloride content is
replaced by nitrate.
SPQ is currently in widespread use for detecting CFTR activity using
the chloride/nitrate exchange technique. SPQ has also been em-
ployed to investigate chloride luxes through several other trans-
porters such as the GABA receptor. MQAE has greater sensitivity to
chloride and a higher luorescence quantum yield than SPQ, and
consequently MQAE is currently the more widely used of the two
indicators. The ester group of MQAE may slowly hydrolyze inside
cells, resulting in a change in its luorescence response. MQAE has
been used in a luorescence microplate assay that has potential for
screening compounds that modify chloride channel activity.
Figure 5.2. The chemical structures of luorescent chloride indicators: lucigenin (top
left), MEQ (top right), MQAE (bottom left) and SPQ (bottom right).
Iodide Blue™-Based Chloride Channel Assay
Chloride channels have a variety of important physiological and
cellular functions that include regulation of pH, volume homeosta-
sis, organic solute transport, cell migration, cell proliferation and
between the excited state of the luorophore and a halide ion – no
ground-state complex is formed. Quenching of quinolinium dyes
by other halides, such as bromide and iodide, and other anions,
such as thiocyanate, is more eicient than chloride quenching.
Fortunately, physiological concentrations of non-chloride ions
do not signiicantly afect the luorescence of SPQ and other
methoxyquinolinium-based chloride indicators.

Phosphate (Pi) Detection www.aatbio.com
Tel: 800-990-8053 • Fax: [email protected] • [email protected]
Unless otherwise speciied, all products are for Research Use Only.
Not for use in diagnostic or therapeutic procedures.30
An
ion
De
tect
ion
5
Phosphate (Pi) is one of the most important inorganic ions in
biological systems. It functions in a variety of roles. One of the
most important roles is as a molecular switch, turning enzyme
activity on and of through the mediation of the various pro-
tein kinases and phosphatases in biological systems. Numerous
enzymes of therapeutic relevance produce phosphate directly or
through coupled reactions. These potential drug development
targets include lipid and protein phosphatases, ATPases, GTPases,
prenyltransferases and phosphodiesterases. Phosphate is also
of great importance in mineralization processes and is a primary
stimulus of algal blooms frequently found in bodies of fresh water,
due to run-of from areas of high fertilizer use. The importance of
phosphate in drug discovery and other ields makes high quality
phosphate assays indispensable.
MESG-Based Colorimetric Phosphate Assay
In the presence of inorganic phosphate, MESG is converted
to 2-amino-6-mercapto-7-methlpurine by purine nucleoside
phosphorylase (PNP) with a red shift of absorption wavelength.
This feature has been used to quantify phosphate spectrophoto-
metrically. The enzymatic removal of the ribose moiety from MESG
results in a shift in the wavelength of maximum absorbance (lmax)
from 330 nm to 360 nm. Because conversion of MESG requires
inorganic phosphate, the increase in absorbance at 360 nm can
be used to measure phosphate concentration. When the PNP
5.2 Phosphate (Pi) Detection
diferentiation. Chloride channels represent valuable drug targets.
However, the existing technologies for screening chloride channel
modulators are a compromise between throughput, sensitivity and
physiological relevance. Screen Quest™ Chloride Channel Assay
Kit provides an optimized assay method for monitoring chloride
channels. The assay uses our proprietary iodide indicator (Iodide
Blue™) for measuring iodide concentration, and as low as 30 nM of
iodide was detected. The assay can be performed in a convenient
96-well or 384-well microtiter-plate format and easily adapted to
automation.
Figure 5.3. NaI dose responses were measured with Screen Quest™ Colorimetric Chloride Channel Assay Kit in a 96-well black wall/clear bottom plate. As low as 100 nM of NaI was detected with 10 minutes incubation (n=3).
Cat # Product Name SizeK
sv(M-1)
(in solution)
Ksv
(M-1)(in cell)
Ex
(nm)
Em
(nm)
21259 Lucigenin10
mg390 455 505
21250 MEQ100
mg145 19 344 442
21255 MQAE100
mg200 25-28 350 460
36350Screen Quest™ Colorimetric
Chloride Channel Assay Kit
10
platesN/A N/A 630 N/A
21252 SPQ25
mg118 12 344 433
Table 5.1 Chloride Detection Reagents and Assay Kit
References for Chloride Detection
Andersson C, Servetnyk Z, Roomans GM. (2003) Activation of CFTR
by genistein in human airway epithelial cell lines. Biochem Biophys
Res Commun, 308, 518.
Bachmann O, Wuchner K, Rossmann H, Leipziger J, Osikowska B,
Colledge WH, Ratclif R, Evans MJ, Gregor M, Seidler U. (2003) Ex-
pression and regulation of the Na+-K+-2Cl- cotransporter NKCC1 in
the normal and CFTR-deicient murine colon. J Physiol, 549, 525.
Bossard F, Robay A, Toumaniantz G, Dahimene S, Becq F, Merot J,
Gauthier C. (2007) NHE-RF1 protein rescues DeltaF508-CFTR func-
tion. Am J Physiol Lung Cell Mol Physiol, 292, L1085.
Braunstein GM, Zsembery A, Tucker TA, Schwiebert EM. (2004) Puri-
nergic signaling underlies CFTR control of human airway epithelial
cell volume. J Cyst Fibros, 3, 99.
Dupuit F, Chinet T, Zahm JM, Pierrot D, Hinnrasky J, Kaplan H, Bon-
net N, Puchelle E. (1997) Induction of a cAMP-stimulated chloride
secretion in regenerating poorly diferentiated airway epithelial
cells by adenovirus-mediated CFTR gene transfer. Hum Gene Ther,
8, 1439.
Jayaraman S, Teitler L, Skalski B, Verkman AS. (1999) Long-wave-
length iodide-sensitive luorescent indicators for measurement of
functional CFTR expression in cells. Am J Physiol, 277, C1008.
Lumpaopong A, Thirakhupt P, Srisuwan K, Chulamokha Y. (2009)
Rare F311L CFTR gene mutation in a child presented with recurrent
electrolyte abnormalities and metabolic alkalosis: case report. J
Med Assoc Thai, 92, 694.
Valle EP, Burgos RI, Valle JR, Egas Bejar D, Ruiz-Cabezas JC. (2007)
Analysis of CFTR gene mutations and cystic ibrosis incidence in the
Ecuadorian population. Invest Clin, 48, 91.
Zegarra-Moran O, Porcelli AM, Rugolo M. (2001) The phorbol ester
PMA and cyclic AMP activate diferent Cl- and HCO3
- luxes in C127
cells expressing CFTR. Biochim Biophys Acta, 1535, 120.

Malachite Green-Based Colorimetric Phosphate Assay
Our PhosphoWorks™ Phosphate Assay Kit has been developed for
measuring the activity of any Pi-generating enzyme through the
complexation of malachite green with phosphate under acidic
conditions. The measurement of Pi is based on the change in
absorbance of the malachite green derivative in the presence of
molybdate. This assay kit is formulated to give sensitive detection
of Pi, providing an alternative to hazardous radioactive methods
and other less sensitive colorimetric assays. Unlike other malachite
dye formulations, this kit gives a completely stable end-point
signal.
Figure 5.5. Phosphate dose responses were measured with the PhosphoWorks™
Colorimetric Phosphate Assay Kit in a 96-well clear plate. As low as 0.1 µM phosphate
can be detected with 10 minutes incubation.
Fluorimetric Phosphate Assay
Detection of many phosphoester–metabolizing enzymes is diicult
because suitable substrates are not available. It usually has been
Figure 5.6. Phosphate dose responses were measured with PhosphoWorks™
Fluorimetric Phosphate Assay Kit in a 96-well black plate. As low as 0.1 µM phosphate
can be detected with 1 hour incubation.
www.aatbio.com phosphate (Pi) Assay
31
An
ion
De
tectio
n
5
Unless otherwise speciied, all products are for Research Use Only.
Not for use in diagnostic or therapeutic procedures.
Tel: 800-990-8053 • Fax: [email protected] • [email protected]
enzyme and MESG substrate are in excess relative to phosphate,
the increase in absorbance at 360 nm is quantitative for inorganic
phosphate. Assuming there is no preexisting phosphate, any
increase in the absorbance at 360 nm must be the result of Pi
liberation from ATP hydrolysis.
necessary to determine inorganic phosphate release using tedious
colorimetric assays or radioisotope-based methods. We have de-
veloped the PhosphoWorks™ Fluorimetric Phosphate Assay Kit for
measuring the activity of any Pi-generating enzyme using our red
luorescent phosphate sensor. The measurement of Pi is based on
the change in the absorbance and luorescence of the phosphate
sensor. The assay is shown to quantitate phosphate in solution at
concentrations as low as 0.1 µM. It can be used to measure the
kinetics of phosphate release from phosphatases (such as GTPases
and ATPases) by coupling the two enzymatic reactions. The kit
provides sensitive detection of Pi, an alternative to hazardous
radioactive methods and other less sensitive colorimetric assays. It
comes with all the essential reagents including phosphate sensor,
phosphate standards and assay bufer. The assay can be performed
in a convenient 96-well or 384-well microtiter-plate format and
easily adapted to automation with no separation steps required.
References for Phosphate Detection
Cowan CM, Zhang X, James AW, Kim TM, Sun N, Wu B, Ting K, Soo C.
(2012) NELL-1 increases pre-osteoblast mineralization using both
phosphate transporter Pit1 and Pit2. Biochem Biophys Res Com-
mun, 422, 351.
Kassai M, Teopipithaporn R, Grant KB. (2011) Hydrolysis of phospha-
tidylcholine by cerium(IV) releases signiicant amounts of choline
and inorganic phosphate at lysosomal pH. J Inorg Biochem, 105,
215.
Microassay of phosphate provides a general method for measuring
Cat # Product Name SizeEx
(nm)
Em
(nm)
21600 MESG *Phosphate assay reagent* 5 mg 330 N/A
21659PhosphoWorks™ Colorimetric MESG Phosphate
Assay Kit *UV absorption*1 kit 360 N/A
21665 PhosphoWorks™ Colorimetric Phosphate Assay
Kit *Blue Color*1 kit 650 N/A
21660PhosphoWorks™ Fluorimetric Phosphate Assay
Kit *Red Fluorescence*1 kit 571 585
Table 5.2 Phosphate Detection Reagent and Assay Kits
Figure 5.4. Phosphate dose responses were measured with the PhosphoWorks™
Colorimetric MESG Phosphate Assay Kit in a 96-well UV plate. As low as 0.2 µM
phosphate can be detected with 30 minutes incubation.
(μM)
Pi Dose (μM)
(μM)

32
Pyrophosphate (PPi) Assay www.aatbio.comA
nio
n D
ete
ctio
n
5
Tel: 800-990-8053 • Fax: [email protected] • [email protected]
Unless otherwise speciied, all products are for Research Use Only.
Not for use in diagnostic or therapeutic procedures.
Cat # Product Name SizeEx
(nm)
Em
(nm)
21611PhosphoWorks™ Fluorimetric Pyrophosphate
Assay Kit *Blue Fluorescence*1 kit 316 456
Table 5.3 Pyrophosphate Detection Assay Kit
Pyrophosphate (PPi) is produced by a number of biochemical
reactions, such as ATP hydrolysis, DNA and RNA polymerizations,
cyclic AMP formation by the enzyme adenylate cyclase and the
enzymatic activation of fatty acids to form the coenzyme A esters.
Our PhosphoWorks™ Pyrophosphate Assay Kit provides the most
robust spectrophotometric method for measuring pyrophosphate.
It uses our proprietary luorogenic pyrophosphate sensor that has
the luorescence intensity proportionally dependent upon the
concentration of pyrophosphate. The assay is much easier than the
enzyme-coupling pyrophosphate methods that require at least
two enzymes for the pyrophosphate detections. PhosphoWorks™
Pyrophosphate Assay Kit provides all the essential components
for assaying pyrophosphate. It has been successfully used in high
throughput screening (HTS). Please inquire special HTS bulk pack-
age discount for the screening of >10,000 assays.
5.3 Pyrophosphate (PPi) Assay
Figure 5.7. Pyrophosphate and phosphate dose responses were measured with the
PhosphoWorksTM Fluorimetric Pyrophosphate Assay Kit in a 96-well black solid plate.
As low as 1 µM (100 picmoles/well) pyrophosphate can be detected with 10 minutes
incubation.
Pegan SD, Tian Y, Sershon V, Mesecar AD. (2010) A universal, fully
automated high throughput screening assay for pyrophosphate
and phosphate release from enzymatic reactions. Comb Chem
High Throughput Screen, 13, 27.
Pena-Pereira F, Cabaleiro N, de la Calle I, Costas M, Gil S, Lavilla I,
Bendicho C. (2011) Directly suspended droplet microextraction
in combination with microvolume UV-vis spectrophotometry for
determination of phosphate. Talanta, 85, 1100.
Rejman D, Panova N, Klener P, Maswabi B, Pohl R, Rosenberg I.
(2012) N-phosphonocarbonylpyrrolidine derivatives of guanine:
a new class of bi-substrate inhibitors of human purine nucleoside
phosphorylase. J Med Chem, 55, 1612.
Uemura T, Ogusu T, Takeuchi M, Tanaka H. (2010) Spectrophotomet-
ric determination of trace phosphate ions by amplitude-modulated
low analysis coupled with malachite green method. Anal Sci, 26,
797.
References for Pyrophosphate (PPi) Detection
Bruzzese FJ, Tsu CA, Ma J, Loke HK, Wu D, Li Z, Tayber O, Dick
LR. (2009) Development of a charcoal paper adenosine
triphosphate:pyrophosphate exchange assay: kinetic characteriza-
tion of NEDD8 activating enzyme. Anal Biochem, 394, 24.
Inokoshi J, Nakamura Y, Hongbin Z, Uchida R, Nonaka K, Masuma
R, Tomoda H. (2013) Spirohexalines, new inhibitors of bacterial
undecaprenyl pyrophosphate synthase, produced by Penicillium
brasilianum FKI-3368. J Antibiot (Tokyo), 66, 37.
Lee HJ, Ho MR, Tseng CS, Hsu CY, Huang MS, Peng HL, Chang HY.
(2011) Exponential ATP ampliication through simultaneous regen-
eration from AMP and pyrophosphate for luminescence detection
of bacteria. Anal Biochem, 418, 19.
Liu Y, Schanze KS. (2008) Conjugated polyelectrolyte-based real-
time luorescence assay for alkaline phosphatase with pyrophos-
phate as substrate. Anal Chem, 80, 8605.
Munch-Petersen B. (2009) Reversible tetramerization of human TK1
to the high catalytic eicient form is induced by pyrophosphate, in
addition to tripolyphosphates, or high enzyme concentration. FEBS
J, 276, 571.
Phelan VV, Du Y, McLean JA, Bachmann BO. (2009) Adenylation en-
zyme characterization using gamma -(18)O(4)-ATP pyrophosphate
exchange. Chem Biol, 16, 473.
Suarez AS, Stefan A, Lemma S, Conte E, Hochkoeppler A. (2012)
Continuous enzyme-coupled assay of phosphate- or pyrophos-
phate-releasing enzymes. Biotechniques, 53, 99.
Ueno A, Terkawi MA, Yokoyama M, Cao S, Aboge G, Aboulaila
M, Nishikawa Y, Xuan X, Yokoyama N, Igarashi I. (2013) Farsenyl
pyrophosphate synthase is a potential molecular drug target of
risedronate in Babesia bovis. Parasitol Int, 62, 189.
Zaka R, Stokes D, Dion AS, Kusnierz A, Han F, Williams CJ. (2006) P5L
mutation in Ank results in an increase in extracellular inorganic py-
rophosphate during proliferation and nonmineralizing hypertrophy
in stably transduced ATDC5 cells. Arthritis Res Ther, 8, R164.
(μM)

33
Me
mb
ran
e P
ote
ntia
l Me
asu
rem
en
t
Membrane Potential Measurement 6
Unless otherwise speciied, all products are for Research Use Only.
Not for use in diagnostic or therapeutic procedures.
Tel: 800-990-8053 • Fax: [email protected] • [email protected]

Tel: 800-990-8053 • Fax: [email protected] • [email protected]
Unless otherwise speciied, all products are for Research Use Only.
Not for use in diagnostic or therapeutic procedures.34
www.aatbio.com
Class Probe Assay Kit
Fast Response 21480, 21482, 21483, 21485, 21487, 21489, 21492,
21493, 21495, 21496, 21497
Slow Response: Cyanines 22030, 22033, 22034, 22035, 22038, 22039, 22040,
22042, 22044, 22045, 22046, 22050, 22051, 22052,
22054, 22056, 22066, 22070, 22073, 22076, 22077,
22101, 22102, 22103
Slow Response: Oxonols 22410, 22411, 22412, 22414, 22416, 22417 36000, 36005
Mitochondrial Membrane
Potential Dyes
22200, 22204, 22205, 22210, 22211, 22220, 22221,
22225
22800, 22801, 22802,
22803, 22804, 22805
membrane potential measurement at-a-glance*
* products listed by catalog number
Me
mb
ran
e P
ote
nti
al M
ea
sure
me
nt
6

www.aatbio.com Fast Response Membrane Potential Probes
Membrane Potential Measurement
Me
mb
ran
e P
ote
ntia
l Me
asu
rem
en
t
6
Membrane potential is the diference in voltage between the
interior and exterior of a cell. The membrane potential allows a
cell to function as a battery, providing power to operate a variety
of molecular devices embedded in the membrane. In electrically
excitable cells such as neurons, membrane potential is used for
transmitting signals between diferent parts of a cell. Opening or
closing of ion channels at one point in the membrane produces a
local change in the membrane potential, which causes electric cur-
rent to low rapidly to other points in the membrane. Ion channels
have been identiied as important drug discovery targets.
The plasma membrane of a cell typically has a transmembrane
potential of approximately –70 mV (negative inside) as a
consequence of K+, Na+ and Cl– concentration gradients that are
maintained by active transport processes. Potentiometric probes
ofer an indirect convenient method of detecting the translocation
of these ions although the luorescent ion indicators can be used to
directly measure changes in speciic ion concentrations. Potentio-
metric optical probes enable researchers to perform membrane
potential measurements in organelles and in cells that are too
small for microelectrodes. Moreover, in conjunction with imaging
techniques, these probes can be employed to map variations in
membrane potential across excitable cells, in perfused organs and
ultimately in the brain in vivo with spatial resolution and sampling
frequency that cannot be obtained using microelectrodes.
Increases and decreases in membrane potential play a central role
in many physiological processes, including nerve-impulse propa-
gation, muscle contraction, cell signaling and ion-channel gating.
Potentiometric probes are important tools for studying these
processes, as well as for visualizing mitochondria (which exhibit
transmembrane potentials of approximately –150 mV, negative
inside matrix), for assessing cell viability and for high-throughput
screening of new drug candidates.
Potentiometric probes include the cationic or zwitterionic
styryl dyes, the cationic carbocyanines and rhodamines, and
the anionic oxonols. The class of dye determines factors such as
accumulation in cells, response mechanism and toxicity. Selecting
the best potentiometric probe for a particular application can be
complicated by the substantial variations in their optical responses,
phototoxicity and interactions with other molecules. There are two
classes of membrane potential probes based on their response
mechanisms: fast response and slow response membrane potential
dyes.
6.1 Selection of a Potentiometric Probebrains. However, the magnitude of their potential-dependent luo-
rescence change is often small, typically 0.02–0.1% luorescence
intensity change per mV.
Di-8-ANEPPS
The ANEP dyes are among the most sensitive of the fast-response
probes. They are essentially nonluorescent in aqueous solutions
and exhibit spectral properties that are strongly dependent
on their environment. When bound to phospholipid vesicles,
di-8-ANEPPS has absorption/emission maxima of ~467/631 nm as
compared with ~498/713 nm in methanol. Di-8-ANEPPS responds
to increases in membrane potential (hyperpolarization) with a
decrease in luorescence excited at approximately 440 nm and an
increase in luorescence excited at >530 nm. These spectral shifts
permit the use of ratiometric methods to correlate the change
in luorescence signal with membrane potential. Zwitterionic
di-8-ANEPPS exhibits fairly uniform 10% per 100 mV changes
in luorescence intensity in a variety of tissue, cell and model
membrane systems. The millisecond-range temporal characteristics
of the ANEP dyes compensate for this modest response amplitude.
RH Dyes
RH dyes are predominately used for functional imaging of neurons.
There is no a single dye that can provide the optimal response
under all experimental conditions. Currently, the most widely
used RH dyes are RH 237, RH 421 and RH 795. Like the ANEP dyes,
the RH dyes exhibit varying degrees of luorescence excitation
and emission spectral shifts in response to membrane potential
changes. Their absorption and luorescence spectra are also
strongly dependent on the environment. Spectra of RH 414 bound
to phospholipid vesicles are similar to those obtained on neuronal
plasma membranes. The RH dyes (e.g., RH 237) might be used in
conjunction with luorescent Ca2+ indicators (e.g., Rhod-2 AM and
Rhod-4™ AM) for the simultaneous optical mapping of membrane
potential and intracellular calcium in cardiomyocyte monolayers.
Fast-response probes have their luorescence in response to a
change in the surrounding electric ield. Their optical response is
suiciently fast to detect transient (millisecond) potential changes
in excitable cells, including single neurons, cardiac cells and intact
6.2 Fast Response Membrane Potential Probes
Cat # Product Name Size Ex (nm) Em (nm)
21496 Di-2-ANEPEQ 5 mg 517 721
21497 Di-8-ANEPPS 5 mg 498 713
21483 MM 1-43 1 mg 510 626
21489 MM 2-10 1 mg 506 620
21487 MM 4-64 1 mg 558 734
21493 RH 155 25 mg 650 N/A
21480 RH 237 5 mg 528 782
21485 RH 414 5 mg 532 716
21482 RH 421 5 mg 515 704
21495 RH 795 1 mg 530 712
21492 TMA-DPH 5 mg 355 430
Table 6.1 Fast Response Membrane Potential Probes
35 Unless otherwise speciied, all products are for Research Use Only.
Not for use in diagnostic or therapeutic procedures.
Tel: 800-990-8053 • Fax: [email protected] • [email protected]

Tel: 800-990-8053 • Fax: [email protected] • [email protected]
Unless otherwise speciied, all products are for Research Use Only.
Not for use in diagnostic or therapeutic procedures.36
Slow Response Membrane Potential Probes www.aatbio.com M
em
bra
ne
Po
ten
tia
l Me
asu
rem
en
t
6
Slow-response probes exhibit potential-dependent changes in
their transmembrane distribution that are accompanied by a
luorescence change. The magnitude of their optical responses
is much larger than that of fast-response probes, typically a 1%
luorescence change per mV. Slow-response probes, which include
cationic carbocyanines and rhodamines and anionic oxonols, are
suitable for detecting changes in average membrane potentials
of nonexcitable cells caused by respiratory activity, ion-channel
permeability, drug binding and other factors.
DiI, DiS and DiO Derivatives
The cationic carbocyanine dyes accumulate on hyperpolarized
membranes and are translocated into the lipid bilayer. Aggregation
within the conined membrane interior usually results in decreased
luorescence, although the magnitude and even the direction of
the luorescence response are strongly dependent on the concen-
tration of the dye and its structural characteristics. DiOC6(3) and
DiOC5(3) have been the most widely used carbocyanine dye for
membrane potential measurements. In low cytometry measure-
ments, the detected intensity of carbocyanine luorescence is de-
pendent not only on the membrane potential, but also on cell size.
In some cases, measurements of forward light scatter have been
used to normalize the optical changes for cell size variability.
6.3 Slow Response Membrane Potential Probes
Cat # Product Name Size Ex (nm) Em (nm)
22030 DiA 25 mg 491 613
22033 DiD 10 mL 644 663
22101 DiI iodide 100 mg 549 565
22102 DiI perchlorate 100 mg 549 565
22103 DiI trilate 100 mg 549 565
22056 DiIC1(5) iodide 25 mg 638 658
22050 DiIC12
(3)-DS 5 mg 555 570
22035 DiIC12
(3) perchlorate 25 mg 549 565
22051 DiIC12
(5)-DS 5 mg 650 670
22044 DiIC16
(3) perchlorate 25 mg 549 565
22052 DiIC18
(3)-DS 5 mg 555 570
22054 DiIC18
(5)-DS 5 mg 650 670
22066 DiO perchlorate 25 mg 484 501
22038 DiOC2(3) iodide 25 mg 482 497
22039 DiOC3(3) iodide 25 mg 482 497
22045 DiOC5(3) iodide 25 mg 482 504
22046 DiOC6(3) iodide 25 mg 482 504
22040 DiOC7(3) iodide 25 mg 482 504
22042 DiOC16
(3) perchlorate 25 mg 484 501
22070 DiR iodide 25 mg 748 780
22073 DiSC2(3) 25 mg 560 571
22077 DiSC2(7) 25 mg 770 790
22076 DiSC3(5) 25 mg 660 675
Table 6.2 Slow Response Membrane Potential Probes
Oxonol V and Oxonol VI
The anionic bis-isoxazolone oxonols accumulate in the cytoplasm
of depolarized cells by a Nernst equilibrium–dependent uptake
from the extracellular solution. Their voltage-dependent partition-
ing between water and membranes is often measured by absorp-
tion rather than luorescence. Oxonol VI gives the largest spectral
shifts, with an isosbestic point at 603 nm. In addition, oxonol VI
responds to changes in potential more rapidly than oxonol V.
DiBAC and DiSBAC Dyes
DiBAC and DiSBAC dyes are usually ionized, hydrophobic and cell-
permeable. When incubated with cells, these hydrophobic probes
are intended to move from the aqueous phase (culture medium) to
the lipid phase (plasma membrane). The negatively charged inner
side of a resting cell membrane prevents the further movement
of these ionized dyes. Upon the depolarization of the membrane
potential, they translocate to the interior of the cells where they
bind to intracellular proteins or lipids that enhance DiBAC and
DiSBAC luorescence. Typically, the time constant for the redistribu-
tion of the luorescent anion is from millisecond to second, which is
in the time scale for measuring the rapid cellular electrical events.
Increased depolarization results in more inlux of the anionic dye
and thus an increase in luorescence. Conversely, hyperpolarization
is indicated by a decrease in luorescence. In contrast to cationic
carbocyanines, anionic DiBAC and DiSBAC2(3) dyes are largely
excluded from mitochondria and are primarily sensitive to plasma
membrane potential. Potential-dependent luorescence changes
generated by DiBAC4(3) are typically ~1% per mV.
Cat # Product Name Size Ex (nm) Em (nm)
21411 DiBAC4(3) 25 mg 493 516
21410 DiBAC4(5) 25 mg 590 616
21414 DiSBAC2(3) 25 mg 535 560
21416 Oxonol V 25 mg 610 639
21417 Oxonol VI 25 mg 599 634
Table 6.3 Slow Response Oxonol Membrane Potential Probes
Rhodamine 123, TMRM and TMRE
Highly selective, potential-dependent staining of mitochondria
is obtained by setting the extracellular K+ concentration close to
intracellular values (~137 mM), thereby depolarizing the plasma
membrane. Rhodamine 123 is widely used as a structural marker
for mitochondria and as an indicator of mitochondrial activity.
TMRM and TMRE are closely related to rhodamine 123. They are
primarily mitochondrial membrane potential sensors. TMRM and
TMRE cross the plasma membrane more rapidly than rhodamine
123, and their strong luorescence allows the use of low probe
concentrations, thus avoiding aggregation. Because their luores-
cence is relatively insensitive to the environment, spatially resolved
6.4 Mitochondrial Membrane Potential Probes
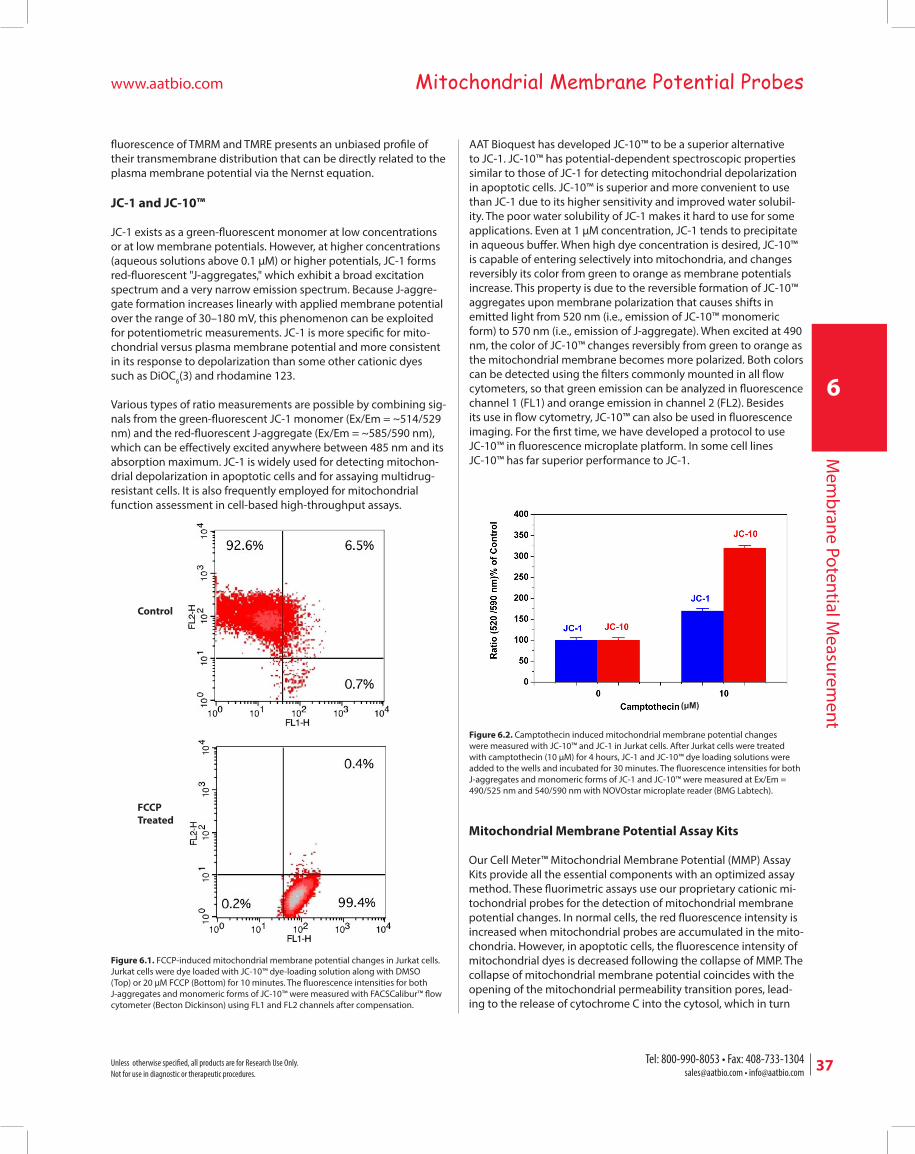
www.aatbio.com Mitochondrial Membrane Potential ProbesM
em
bra
ne
Po
ten
tial M
ea
sure
me
nt
6
37 Unless otherwise speciied, all products are for Research Use Only.
Not for use in diagnostic or therapeutic procedures.
Tel: 800-990-8053 • Fax: [email protected] • [email protected]
luorescence of TMRM and TMRE presents an unbiased proile of
their transmembrane distribution that can be directly related to the
plasma membrane potential via the Nernst equation.
JC-1 and JC-10™
JC-1 exists as a green-luorescent monomer at low concentrations
or at low membrane potentials. However, at higher concentrations
(aqueous solutions above 0.1 µM) or higher potentials, JC-1 forms
red-luorescent "J-aggregates," which exhibit a broad excitation
spectrum and a very narrow emission spectrum. Because J-aggre-
gate formation increases linearly with applied membrane potential
over the range of 30–180 mV, this phenomenon can be exploited
for potentiometric measurements. JC-1 is more speciic for mito-
chondrial versus plasma membrane potential and more consistent
in its response to depolarization than some other cationic dyes
such as DiOC6(3) and rhodamine 123.
Various types of ratio measurements are possible by combining sig-
nals from the green-luorescent JC-1 monomer (Ex/Em = ~514/529
nm) and the red-luorescent J-aggregate (Ex/Em = ~585/590 nm),
which can be efectively excited anywhere between 485 nm and its
absorption maximum. JC-1 is widely used for detecting mitochon-
drial depolarization in apoptotic cells and for assaying multidrug-
resistant cells. It is also frequently employed for mitochondrial
function assessment in cell-based high-throughput assays.
AAT Bioquest has developed JC-10™ to be a superior alternative
to JC-1. JC-10™ has potential-dependent spectroscopic properties
similar to those of JC-1 for detecting mitochondrial depolarization
in apoptotic cells. JC-10™ is superior and more convenient to use
than JC-1 due to its higher sensitivity and improved water solubil-
ity. The poor water solubility of JC-1 makes it hard to use for some
applications. Even at 1 µM concentration, JC-1 tends to precipitate
in aqueous bufer. When high dye concentration is desired, JC-10™
is capable of entering selectively into mitochondria, and changes
reversibly its color from green to orange as membrane potentials
increase. This property is due to the reversible formation of JC-10™
aggregates upon membrane polarization that causes shifts in
emitted light from 520 nm (i.e., emission of JC-10™ monomeric
form) to 570 nm (i.e., emission of J-aggregate). When excited at 490
nm, the color of JC-10™ changes reversibly from green to orange as
the mitochondrial membrane becomes more polarized. Both colors
can be detected using the ilters commonly mounted in all low
cytometers, so that green emission can be analyzed in luorescence
channel 1 (FL1) and orange emission in channel 2 (FL2). Besides
its use in low cytometry, JC-10™ can also be used in luorescence
imaging. For the irst time, we have developed a protocol to use
JC-10™ in luorescence microplate platform. In some cell lines
JC-10™ has far superior performance to JC-1.
Figure 6.1. FCCP-induced mitochondrial membrane potential changes in Jurkat cells.
Jurkat cells were dye loaded with JC-10™ dye-loading solution along with DMSO
(Top) or 20 μM FCCP (Bottom) for 10 minutes. The luorescence intensities for both
J-aggregates and monomeric forms of JC-10™ were measured with FACSCalibur™ low
cytometer (Becton Dickinson) using FL1 and FL2 channels after compensation.
Mitochondrial Membrane Potential Assay Kits
Our Cell Meter™ Mitochondrial Membrane Potential (MMP) Assay
Kits provide all the essential components with an optimized assay
method. These luorimetric assays use our proprietary cationic mi-
tochondrial probes for the detection of mitochondrial membrane
potential changes. In normal cells, the red luorescence intensity is
increased when mitochondrial probes are accumulated in the mito-
chondria. However, in apoptotic cells, the luorescence intensity of
mitochondrial dyes is decreased following the collapse of MMP. The
collapse of mitochondrial membrane potential coincides with the
opening of the mitochondrial permeability transition pores, lead-
ing to the release of cytochrome C into the cytosol, which in turn
Figure 6.2. Camptothecin induced mitochondrial membrane potential changes
were measured with JC-10™ and JC-1 in Jurkat cells. After Jurkat cells were treated
with camptothecin (10 µM) for 4 hours, JC-1 and JC-10™ dye loading solutions were
added to the wells and incubated for 30 minutes. The luorescence intensities for both
J-aggregates and monomeric forms of JC-1 and JC-10™ were measured at Ex/Em =
490/525 nm and 540/590 nm with NOVOstar microplate reader (BMG Labtech).
(μM)
Control
FCCP
Treated

Tel: 800-990-8053 • Fax: [email protected] • [email protected]
Unless otherwise speciied, all products are for Research Use Only.
Not for use in diagnostic or therapeutic procedures.38
Me
mb
ran
e P
ote
nti
al M
ea
sure
me
nt
6
FLIPR® Membrane Potential Assay Kits www.aatbio.com
AAT Bioquest Screen Quest™ Membrane Potential Assay Kits are a
homogeneous assay with fast read time. They use our proprietary
long wavelength membrane potential indicators to detect the
membrane potential change that is caused by the opening and
closing of the ion channels. The orange or red luorescent mem-
brane potential indicators used in the kits have enhanced luores-
cence upon entering cells and minimizes the interferences resulted
from the screening compounds and/or cellular autoluorescence.
These kits have been successfully used for screening chloride, po-
tassium and sodium channel targets in new drug development.
6.5 FLIPR® Membrane Potential Assay Kits
Cat # Product Name Size Ex (nm) Em (nm)
36000 Screen Quest™ Membrane Potential Assay Kit *Orange Fluorescence*
1 kit 535 560
36005 Screen Quest™ Membrane Potential Assay Kit *Red Fluorescence*
1 kit 635 660
Table 6.5 FLIPR® Membrane Potential Assay Kits
Cat # Product Name SizeEx
(nm)
Em
(nm)
22801 Cell Meter™ JC-10™ Mitochondrial Membrane Potential Assay Kit *Optimized for Flow Cytometry Assays*
1 kit 510 525
22800 Cell Meter™ JC-10™ Mitochondrial Membrane Potential Assay Kit *Optimized for Microplate Assays*
1 kit 510 525
22804 Cell Meter™ Mitochondrial Membrane Potential Assay Kit *Orange Fluorescence Optimized for Flow Cytometry*
1 kit 546 575
22805 Cell Meter™ Mitochondrial Membrane Potential Assay Kit *Orange Fluorescence Optimized for Microplate Reader*
1 kit 546 575
22802 Cell Meter™ NIR Mitochondrial Membrane Potential Assay Kit *Optimized for Flow Cytometry*
1 kit 646 659
22803 Cell Meter™ NIR Mitochondrial Membrane Potential Assay Kit *Optimized for Microplate Reader*
1 kit 646 659
22225 DASPEI (2-(4-(dimethylamino)styryl)-N-
ethylpyridinium iodide)100 mg 461 589
22200 JC-1 5 mg 515 529
22204 JC-10™ 5x100 µL 510 525
22205 Nonyl acridine orange 25 mg 495 519
22210 Rhodamine 123 25 mg 507 529
22211 Rhodamine B, hexyl ester, perchlorate 10 mg 556 578
22220 TMRE 25 mg 549 574
22221 TMRM 25 mg 549 573
Table 6.4 Mitochondrial Membrane Potential Probes and Assay Kits
Figure 6.4. GABA dose responses in WSS-1 cells measured with Screen Quest™
Membrane Potential Assay Kit. WSS-1 cells were seeded overnight in 50,000 cells
per 100 μL per well in a 96-well black wall/clear bottom Costar plate. The cells were
incubated with 100 μL of Screen Quest™ Membrane Potential Assay kit for 30 minutes
at room temperature. GABA (50 μL/well) was added by FlexStation® (Molecular
Devices) to achieve the inal indicated concentrations.
Figure 6.3. The decrease in luorescence intensity of MitoLite™ Orange with the addition of FCCP in Jurkat cells. Jurkat cells were loaded with MitoLite™ Orange alone (Blue) or in the presence of 30 μM FCCP (Red) for 15 minutes. The luorescence intensity of MitoLite™ Orange was measured with a FACSCalibur™ (Becton Dickinson) low cytometer using FL2 channel.
triggers other downstream events in the apoptotic cascade. These
kits are individually optimized for screening apoptosis activators
and inhibitors with a low cytometer, a luorescence microscope or
a luorescence microplate reader.
GABA (μM)
References for FLIPR® Membrane Potential Assays
Benjamin ER, Skelton J, Hanway D, Olanrewaju S, Pruthi F, Ilyin VI,
Lavery D, Victory SF, Valenzano KJ. (2005) Validation of a luorescent
imaging plate reader membrane potential assay for high-through-
put screening of glycine transporter modulators. J Biomol Screen,
10, 365.
Vasilyev DV, Shan QJ, Lee YT, Soloveva V, Nawoschik SP, Kaftan EJ,
Dunlop J, Mayer SC, Bowlby MR. (2009) A novel high-throughput
screening assay for HCN channel blocker using membrane poten-
tial-sensitive dye and FLIPR. J Biomol Screen, 14, 1119.
FL2-H
Counts

Unless otherwise speciied, all products are for Research Use Only.
Not for use in diagnostic or therapeutic procedures.
Tel: 800-990-8053 • Fax: [email protected] • [email protected]
39
7
Index
Ind
ex

40 Tel: 800-990-8053 • Fax: [email protected] • [email protected]
Unless otherwise speciied, all products are for Research Use Only.
Not for use in diagnostic or therapeutic procedures.
Index www.aatbio.com In
de
x
7
Alphabetical Index
Amplite™ Colorimetric Calcium Quantitation Kit 16
Amplite™ Colorimetric Zinc Ion Quantitation Kit 20
Amplite™ Fluorimetric Calcium Quantitation Kit 16
Amplite™ Fluorimetric Zinc Ion Quantitation Kit 20
BAPTA AM 16
BAPTA AM *UltraPure grade* 16
BAPTA, tetrapotassium salt 16
BAPTA, tetrasodium salt 16
BCECF acid 23
BCECF AM 23
BTC AM 13
BTC, tetrapotassium salt 13
Cal-520™ AM 10
Cal-520™, potassium salt 10
Cal-520™, sodium salt 10
Cal-520FF™ AM 10
Cal-520FF™, potassium salt 10
Cal Green™-1 AM (equivalent to Calcium Green™-1 AM) 7, 10
Cal Green™-1, hexapotassium salt (equivalent to Calcium Green™-1) 7, 10
Cell Meter™ Fluorimetric Intracellular pH Assay Kit 23
Cell Meter™ JC-10™ Mitochondrial Membrane Potential Assay Kit 38
Cell Meter™ Mitochondrial Membrane Potential Assay Kit 38
Cell Meter™ NIR Mitochondrial Membrane Potential Assay Kit 38
Coelenterazine *UltraPure grade* 15
Coelenterazine cp *UltraPure grade* 15
Coelenterazine f *UltraPure grade* 15
Coelenterazine h *UltraPure grade* 15
Coelenterazine hcp *UltraPure grade* 15
Coelenterazine n *UltraPure grade* 15
DASPEI (2-(4-(dimethylamino)styryl)-N-ethylpyridinium iodide) 38
Di-2-ANEPEQ 35
Di-8-ANEPPS 35
DiA 36
DiBAC4(3) 37
DiBAC4(5) 37
DiD 36
DiI iodide 36
DiI perchlorate 36
DiI trilate 36
DiIC1(5) iodide 36
DiIC12
(3)-DS 36
DiIC12
(3) perchlorate 36
DiIC12
(5)-DS 36
DiIC16
(3) perchlorate 36
DiIC18
(3)-DS 36
DiIC18
(5)-DS 36
DiO perchlorate 36
DiOC2(3) iodide 36
DiOC3(3) iodide 36
DiOC5(3) iodide 36
DiOC6(3) iodide 36
DiOC7(3) iodide 36
DiOC16
(3) perchlorate 36
DiR iodide 36
DiSBAC2(3) 37
DiSC2(3) 36
DiSC2(7) 36
DiSC3(5) 36
EGTA AM 16
EGTA AM *10 mM DMSO solution* 16
EGTA, tetrasodium salt *10 mM aqueous solution* 16
EGTA, tetrasodium salt *UltraPure grade* 16
Fluo-3 AM *UltraPure grade* 7
Fluo-3, pentaammonium salt 7
Fluo-3, pentapotassium salt 7
Fluo-3, pentasodium salt 7
Fluo-8® AM 8
Fluo-8®, sodium salt 8
Fluo-8FF™ AM 8
Fluo-8FF™, potassium salt 8
Fluo-8H™ AM 8
Fluo-8H™, sodium salt 8
Fluo-8L™ AM 8
Fluo-8L™, sodium salt 8
PRODUCT NAME PAGE PRODUCT NAME PAGE

Tel: 800-990-8053 • Fax: [email protected] • [email protected]
Unless otherwise speciied, all products are for Research Use Only.
Not for use in diagnostic or therapeutic procedures.41
www.aatbio.com IndexIn
de
x
7
Fura-2 AM *UltraPure grade* 13
Fura-2, potassium salt 13
Fura-2, sodium salt 13
Fura-6™ AM 13
Fura-6™, potassium salt 13
Fura-6™, sodium salt 13
Indo-1 AM *UltraPure grade* 13
Indo-1, pentapotassium salt 13
Indo-1, pentasodium salt 13
JC-1 38
JC-10™ 38
Lucigenin 30
MEQ 30
MESG *Phosphate assay reagent* 31
Metal Fluor™ Zn 520 AM 19
Metal Fluor™ Zn 520, potassium salt 19
MM 1-43 35
MM 2-10 35
MM 4-64 35
MQAE 30
Nonyl acridine orange 38
Oxonol V 37
Oxonol VI 37
PhosphoWorks™ Colorimetric MESG Phosphate Assay Kit *UV absorption* 31
PhosphoWorks™ Colorimetric Phosphate Assay Kit 31
PhosphoWorks™ Fluorimetric Phosphate Assay Kit 31
PhosphoWorks™ Fluorimetric Pyrophosphate Assay Kit 32
Pluronic® F-127 *10% solution in water* 16
Pluronic® F-127 *20% solution in DMSO* 16
Pluronic® F-127 *Cell culture tested* 16
Probenecid *Cell culture tested* 16
Probenecid *Water soluble* 16
Protonex™ Green 500 Dextran 26
Protonex™ Green 500, SE 26
Protonex™ Red 600-Latex Bead Conjugate 26
Protonex™ Red 600, SE 26
Quin-2 AM 13
Quin-2, tetrapotassium salt 13
RatioWorks™ BCFL Acid *Superior Replacement to BCECF* 23
RatioWorks™ BCFL AM *Superior Replacement to BCECF AM* 23
RatioWorks™ BCFL SE *Superior Replacement to BCECF SE* 23
RatioWorks™ PDMPO Dextran 26
RatioWorks™ PDMPO, SE 26
RH 155 35
RH 237 35
RH 414 35
RH 421 35
RH 795 35
Rhod-2 AM *UltraPure grade" 7, 12
Rhod-2, tripotassium salt 7, 12
Rhod-2, trisodium salt 7, 12
Rhod-4™ AM 12
Rhod-4™, sodium salt 12
Rhod-5N, AM 7, 12
Rhod-5N, tripotassium salt 7, 12.
Rhodamine 123 38
Rhodamine B, hexyl ester, perchlorate 38
Screen Quest™ Colorimetric Chloride Channel Assay Kit 30
Screen Quest™ Fluo-8® No Wash Calcium Assay Kit 14
Screen Quest™ Fluo-8® No Wash Calcium Assay Kit *Medium Removal* 14
Screen Quest™ Fura-2 No Wash Calcium Assay Kit 14
Screen Quest™ Luminometric Calcium Assay Kit 15
Screen Quest™ Membrane Potential Assay Kit 38
Screen Quest™ Rhod-4™ No Wash Calcium Assay Kit 14
Screen Quest™ Rhod-4™ No Wash Calcium Assay Kit *Medium Removal* 14
TMRE 38
TMRM 38
TSQ 19
Zinquin "UltraPure grade" 19
Zinquin AM "UltraPure grade" 19
Zinquin Ethyl Ester "UltraPure grade" 19
PRODUCT NAME PAGE PRODUCT NAME PAGE

42 Tel: 800-990-8053 • Fax: [email protected] • [email protected]
Unless otherwise speciied, all products are for Research Use Only.
Not for use in diagnostic or therapeutic procedures.
Ind
ex
7
Index www.aatbio.com
Catalog Number Index
CAT # PAGE CAT # PAGE CAT # PAGE
19000 20
19001 20
20050 16
20052 16
20053 16
20060 16
20061 16
20500 10
20501 10
21001 16
21002 16
21003 16
21004 16
21005 16
21006 16
21007 16
21008 16
21011 7
21016 7
21018 7
21021 13
21025 13
21026 13
21032 13
21040 13
21044 13
21050 13
21052 27
21053 13
21054 13
21055 13
21057 13
21058 13
21064 12
21067 12
21068 12
21070 12
21072 12
21080 8
21088 8
21090 8
21095 8
21096 8
21098 8
21102 8
21104 8
21120 12
21128 12
21131 10
21136 10
21141 10
21142 10
21144 10
21150 15
21151 15
21152 15
21153 15
21154 15
21155 15
21170 11
21180 23
21189 23
21190 23
21191 23
21201 23
21202 23
21203 23
21208 26
21209 26
21210 26
21211 26
21216 26
21217 26
21131 10
21136 10
21141 10
21142 10
21144 10
21250 30
21252 30
21253 19
21254 19
21255 30
21259 30
21260 19
21261 19
21262 19
21263 19
21410 37
21411 37
21414 37
21416 37
21417 37
21480 35
21482 35
21483 35
21485 35
21487 35
21489 35
21492 35
21493 35
21495 35
21496 35
21497 35
21600 31
21611 32
21659 31
21660 31
21665 31
22033 36
22035 36
22038 36
22039 36
22040 36
22042 36
22045 36
22046 36
22050 36
22051 36
22052 36
22054 36
22056 36
22066 36
22070 36
22073 36
22077 36
22076 36
22200 38
22204 38
22205 38
22210 38
22211 38
22220 38
22221 38
22225 38
22801 38
22802 38
22805 38
36000 38
36308 14
36315 14
36320 14
36331 14
36334 14
36360 16
36361 16

Tel: 800-990-8053 • Fax: [email protected] • [email protected]
Unless otherwise speciied, all products are for Research Use Only.
Not for use in diagnostic or therapeutic procedures.43
8
Notes
No
tes

44 Tel: 800-990-8053 • Fax: [email protected] • [email protected]
Unless otherwise speciied, all products are for Research Use Only.
Not for use in diagnostic or therapeutic procedures.
NOTES
No
tes
8
Notes www.aatbio.com

AAT Bioquest®, Inc. (Formerly ABD Bioquest, Inc.)
520 Mercury Drive
Sunnyvale, CA 94085, USA
Tel.: 800-990-8053/408-733-1055
Fax: 408-733-1304
Email: [email protected]
© 2013 by AAT Bioquest®, Inc.