Physics studies of the improved H-mode scenario in … · Physics studies of the improved H-mode...
8
1 EX/P1-7 Physics studies of the improved H-mode scenario in ASDEX Upgrade J. Stober 1 , A.C.C. Sips 1 , C. Angioni 1 , C. Forest 2 , O. Gruber 1 , J. Hobirk 1 , L.D. Horton 1 , C.F. Maggi 1 , M. Maraschek 1 , P. Martin 3 , P. McCarthy 4 , V. Mertens 1 , Y.-S. Na 5 , M. Reich 1 , A. St¨ abler 1 , G. Tardini 1 , H. Zohm 1 , and the ASDEX Upgrade Team 1 Max-Planck-Institut f¨ ur Plasmaphysik, EURATOM-Association, Garching, Germany 2 Dept. of Physics, University of Wisconsin, Madison, USA 3 Consorzio RFX, Associazione Euratom-ENEA sulla Fusione, Corso Stati Uniti 4, I-35127 Padova, Italy 4 Dept. of Physics, University College Cork, Assosiation EURATOM-DCU, Cork, Ireland 5 National Fusion Research Center, 52 Yeoeun-Dong, Yusung-Gu, Daejeon, 305-333, Korea e-mail: [email protected] Abstract Recent studies at ASDEX Upgrade aim to further characterise and understand the physics of the im- proved H-mode. The main focus is on the influence of the ramp-up scenario for plasma current and heating on energy confinement and MHD-activity during the subsequent steady state phase. Depending on the ramp-up scenario two different stationary plasmas can be generated, which show different equili- brated current profiles. The difference of the current profiles seems to be due to different MHD modes, which set in during the current profile evolution. Also the stored energy is different in the two cases as well as the peaking of the temperature profiles. This may be due either to increased transport by MHD modes themselves or to the variation of the ratio of magnetic shear s to safety factor q, which modifies the critical temperature gradient-length for the onset of ITGs. These core profile variations make up for part of the difference of the stored energy, but also the pedestal pressures are remarkably different as analysed on the basis of high-resolution Thomson-Scattering measurements at the plasma edge. 1. Introduction The ’improved H-mode’ regime of ASDEX Upgrade [1], a candidate for the ITER hybrid sce- nario, has been confirmed on several other devices [2–4]. Hybrid operation in ITER aims at re- duced plasma current to extend the duration of the plasma, but maintaining dominant α-particle heating (Q 10). Alternatively, at full plasma current, the base line performance of ITER could be significantly exceeded if improved H-mode parameters can be achieved [5]. However, significant debate remains on which ingredients are essential for improved H-mode operation and what the differences are compared to ’standard’ H-modes. Moderate additional heating during the plasma current ramp-up is thought to be a key ingredient to form an adequate cur- rent profile for stronger heating in the flat-top phase. This stronger heating phase itself usually starts with a power level well above the threshold for type-I ELMy H-mode aiming at a value of 2 0 β N 2 5, and is then kept for a significant part of a current diffusion time before the power is ramped up further to obtain the highest β N -value, limited by the onset of (2,1)-NTMs for β N 3. The latter high-β phase is envisaged for the ITER hybrid scenario. The phase with constant intermediate power turns out to be important to prevent an early onset of strong NTMs in the final high power phase. The phenomenological dependence of the plasma state on time scales in the order of the current diffusion time indicates that the current profile is an important ingredient in the process. So far, the underlying physics is not really understood. A central element in the discussion is the suppression of sawteeth allowing higher beta-values by elimi- nation of seed-islands for detrimental NTMs. Still small NTMs as well as small sawteeth are found in some of the high-β phase without detrimental effects. Results from DIII-D [2] show an inverse relation between the size of an (3,2)-NTM and the size of the sawteeth, indicating that a small (3,2)-NTM can indeed limit the sawteeth size making it less effective as a seed for an (2,1)-NTM or even eliminates the sawteeth. These findings indicate that the central q-profile
-
Upload
vuongkhanh -
Category
Documents
-
view
214 -
download
0
Transcript of Physics studies of the improved H-mode scenario in … · Physics studies of the improved H-mode...

1 EX/P1-7
Physics studies of the improved H-mode scenario in ASDEX UpgradeJ. Stober1, A.C.C. Sips1, C. Angioni1, C. Forest2, O. Gruber1, J. Hobirk1, L.D. Horton1,C.F. Maggi1, M. Maraschek1, P. Martin3, P. McCarthy4, V. Mertens1, Y.-S. Na5, M. Reich1,A. Stabler1, G. Tardini1, H. Zohm1, and the ASDEX Upgrade Team1 Max-Planck-Institut fur Plasmaphysik, EURATOM-Association, Garching, Germany2 Dept. of Physics, University of Wisconsin, Madison, USA3 Consorzio RFX, Associazione Euratom-ENEA sulla Fusione, Corso Stati Uniti 4,
I-35127 Padova, Italy4 Dept. of Physics, University College Cork, Assosiation EURATOM-DCU, Cork, Ireland5 National Fusion Research Center, 52 Yeoeun-Dong, Yusung-Gu, Daejeon, 305-333, Koreae-mail: [email protected]
AbstractRecent studies at ASDEX Upgrade aim to further characterise and understand the physics of the im-proved H-mode. The main focus is on the influence of the ramp-up scenario for plasma current andheating on energy confinement and MHD-activity during the subsequent steady state phase. Dependingon the ramp-up scenario two different stationary plasmas can be generated, which show different equili-brated current profiles. The difference of the current profiles seems to be due to different MHD modes,which set in during the current profile evolution. Also the stored energy is different in the two cases aswell as the peaking of the temperature profiles. This may be due either to increased transport by MHDmodes themselves or to the variation of the ratio of magnetic shear s to safety factor q, which modifiesthe critical temperature gradient-length for the onset of ITGs. These core profile variations make up forpart of the difference of the stored energy, but also the pedestal pressures are remarkably different asanalysed on the basis of high-resolution Thomson-Scattering measurements at the plasma edge.
1. IntroductionThe ’improved H-mode’ regime of ASDEX Upgrade [1], a candidate for the ITER hybrid sce-nario, has been confirmed on several other devices [2–4]. Hybrid operation in ITER aims at re-duced plasma current to extend the duration of the plasma, but maintaining dominant α-particleheating (Q � 10). Alternatively, at full plasma current, the base line performance of ITERcould be significantly exceeded if improved H-mode parameters can be achieved [5]. However,significant debate remains on which ingredients are essential for improved H-mode operationand what the differences are compared to ’standard’ H-modes. Moderate additional heatingduring the plasma current ramp-up is thought to be a key ingredient to form an adequate cur-rent profile for stronger heating in the flat-top phase. This stronger heating phase itself usuallystarts with a power level well above the threshold for type-I ELMy H-mode aiming at a valueof 2 � 0 � βN
� 2 � 5, and is then kept for a significant part of a current diffusion time before thepower is ramped up further to obtain the highest βN-value, limited by the onset of (2,1)-NTMsfor βN � 3. The latter high-β phase is envisaged for the ITER hybrid scenario. The phase withconstant intermediate power turns out to be important to prevent an early onset of strong NTMsin the final high power phase. The phenomenological dependence of the plasma state on timescales in the order of the current diffusion time indicates that the current profile is an importantingredient in the process. So far, the underlying physics is not really understood. A centralelement in the discussion is the suppression of sawteeth allowing higher beta-values by elimi-nation of seed-islands for detrimental NTMs. Still small NTMs as well as small sawteeth arefound in some of the high-β phase without detrimental effects. Results from DIII-D [2] showan inverse relation between the size of an (3,2)-NTM and the size of the sawteeth, indicatingthat a small (3,2)-NTM can indeed limit the sawteeth size making it less effective as a seed foran (2,1)-NTM or even eliminates the sawteeth. These findings indicate that the central q-profile

2 EX/P1-7
is modified in presence of NTMs. Still there are open questions on why the NTM is createdand why it stays small and how this relates to the heating in the ramp-up phase. Another obser-vation still lacking explanation is the small power degradation of the energy confinement timewith increasing heating power, such that the high β-values are achieved with H-factors wellabove unity (referring to the ITER reference scaling IPB-H98(y,2)) [6]. Here core and pedestaleffects still have to be separated.There are several contributions to this conference reporting studies at ASDEX Upgrade on theimproved H-mode/ITER-hybrid-scenario: The performance of the strong heating phase (hybrid-phase) over a wide operational range, its dependence on machine conditions, and its extrapola-tion to ITER is described in [7]. The high resolution pedestal measurements and details of thepedestal evolution with increasing heating power are described in [8]. These are compared tothe findings of other machines on the pedestal behaviour in improved confinement dischargesin [9]. The contribution in hand mainly addresses physics issues in the first two phases of theimproved H-mode scenario. The influence of heating and gas puffing during the phase of cur-rent ramp-up on the current profile as well as MHD and core transport in the subsequent phasewith 2 � 0 � βN
� 2 � 8 are studied systematically. An early-heating and a late-heating scheme arecompared in detail with respect to core and edge profiles.
2. Variation of the ramp-up scenarioThe current ramp-up phase is thought to be crucial for improved H-mode operation in the senseof sawtooth prevention. Early additional heating in the current ramp-up increases the electrontemperature and therefore the current diffusion time, such that the loop voltage applied by thecentral solenoid penetrates less towards the plasma centre and the resulting plasma-current pro-file at the start of the flat-top phase is less peaked or even hollow keeping the central safetyfactor well above unity. On the other hand, too much power in the preheat is known to gen-erate short-lived ion-ITBs in the subsequent main heating phase. Still the optimum shape ofthe q-profile is not obvious and usually it is determined in a trial and error procedure, suchthat the ramp-up scenario varies between machines. In ASDEX Upgrade the ramp-up schemehad to be changed when the inner heat shield was coated with tungsten in 2003. Before, thisheat shield was used as high-field-side limiter during the whole ramp-up phase. Afterwards,
0.0
0.4
0.8
1.2
0
4
8
12
0.0
0.4
0.8
1.2
0
2
4
6
8
Ip [M
A]
Pow
er [M
W]
W [M
J]N
el x
1e19
0.0
0.4
0.8
1.2
0
4
8
12
0.0
0.4
0.8
1.2
0
2
4
6
8
0 2 4 6 8Time (s)
0 2 4 6 8Time (s)
early-heating scenario late-heating scenario
I_p
P_NBIP_ICRP:ECR
W_mhd
n_e
#20433 #20438
Figure 1: Effect of ramp-up scenario on improved H-mode per-formance at different power levels.
the change-over to a diverted shapewas timed as early as the NBI isswitched on. The usual criterion toaccept a ramp-up scenario as rea-sonably optimised is that a type-I ELMy H-mode with no or mod-est sawteeth evolves and that highβ-values are obtained in the high-power hybrid-phase. It was there-fore surprising to observe in AS-DEX Upgrade that an explicit lateheating scheme with a long ohmicphase before adding auxiliary heat-ing resulted in a better performance(higher Wmhd and H-factor) as com-pared to the dedicated early heatingscheme. The corresponding time traces are shown in figure 1. This result obviously questionsthe above mentioned ideas on the effect of the current ramp-up phase.

3 EX/P1-7
0.00.2
0.4
0.6
0.8
1.01.2
1.
0
2
4
6
8
1.
0
2
4
6
8
10
1.e1
9
0 2 4 6 8Time (s)
0.0
0.2
0.4
0.6
0.8
1.0
1.e6
Plasma current: 1 MA, q = 4.8
line-averaged electron density
P_aux: 8 MW
P_ICR MSE
W_mhd
H98(y,2) 1.2 1.5
(4,3) NTM, [(3,2) from 3.2s] versus (1,1) Fishbones
Improved H-Mode: early (#20993) versus late (#20995) heating
95
Figure 2: Time traces for study on current ramp up.
Therefore a systematic study ofthe early heating phase was per-formed varying heating power andgas puff at two different values ofthe toroidal field (2.0 T and 2.4 T,corresponding to q95 values of 4.0and 4.8). The results were com-pared to the late heating scheme,also at both values of q95. Themain heating phase was kept at aconstant level of 8 MW for all dis-charges including 3 MW of centralICRH to prevent central accumula-tion of heavy impurities. This oc-curs with pure NBI-heating in thisscenario since large parts of the firstwall of ASDEX Upgrade have been covered with tungsten [7]. Since stray radiation from theICRH-plant is suspected to disturb the MSE measurement ICRH is switched off 50 ms out of500 ms and is substituted by another NBI source. The choice of NBI sources was the same inall discharges, such that profiles of the NBI driven current and momentum input are similar.Co-injecting NBI sources are used: one beam, which is also used in the current ramp-up, passesthrough the plasma center, whereas another one is off-axis [10]. A third beam similar to the firstone is used to substitute the ICRH during the short intervals for MSE measurements. Due to thevariation of τE and Bt , βN ranges from 2.0 to 2.8 in these discharges. It was deliberately cho-sen not to increase the heating power to the β-limit towards the end of the discharge, but to letthe current profile completely evolve. The objective was to check whether the current profileswhich we observe in the main heating phase are really separate (meta)-stable states or if theyevolve towards a common equilibrium with similar MHD-modes. Figure 2 illustrates the tworamp-up schemes by time traces for an early-heated and a late-heated discharge at q95
� 4 � 8.Figure 3 shows the variation of the q-profiles which has been achieved at the onset of themain heating by the variation of the start-up scenario. All discharges have otherwise identicalcontrol parameters, i.e. 1.0 MA plasma current, same shape, no additional fuelling during the
# Te0(1.0 s)
�ne �
(1.0 s)PNBI(preheat)
q0 q95 H98y � 2 MHD behaviour duringhigh power phase
[keV] 1E19m � 3 [MW]20998 3.0 2.5 2.5 2.0 4.0 - Disrupts after ITB20993 3.4 2.2 2.5 3.2 4.8 1.2 4/3 NTM, 3/2 NTM at 3.2s20991 2.6 3.6 2.5 2.8 4.8 1.2 4/3 NTM, 3/2 NTM at 2.3s20990 2.2 5.5 2.5 2.2 4.8 1.2 4/3 NTM, 3/2 NTM at 1.8s20992 1.5 5.3 1.25 ? 4.8 1.2 4/3 NTM throughout20994 1.6 2.9 0 1.0 4.8 - Fishbones, wall contact20995 1.6 2.9 0 0.95 4.8 1.5 Fishbones throughout20996 1.1 2.9 0 0.8 4.0 1.5 Fishbones20997 1.1 2.9 0 0.8 4.0 1.5 4/3 NTM � Fishbones20999 1.0 5.2 1.25 ? 4.0 1.2 4/3 NTM throughout
Table 1: Parameters of current ramp-up study. All discharges have some sawteeth, partly synchronisedwith ICRH modulation. q0 is given at the onset of the main heating, i.e. at 1.0 s with preheat and at 2.5s without. A level of 1.25 MW of preheat is achieved by on-off modulation of the 2.5 MW beam used forMSE, such that no reasonable measurement is possible. This is indicated by a ’?’ in the ’q0’ column.The H-factor refers to the steady-state phase at 5.5 s in all cases.

4 EX/P1-7
q95 = 4.0
q95 = 4.8
q95 = 4.0q95 = 4.8
}}
at 1.0 s (early heating)
at 2.5 s (late heating)
Figure 3: Variation of q-profiles at the onset ofthe main heating obtained by modification of theramp-up phase. Red: early heating q95=4.8 vary-ing gas puff, magenta: early heating q95=4.0,blue: late heating q95=4.8, cyan: late heatingq95=4.0. For the latter two, dashed lines refer torepeated discharges.
t=1.0s
t=1.5s
t=2.0s
direction of evolution
Figure 4: Evolution of the q-profile during themain heating phase for the most inverted q-profilein figure 3 (early-heating case in figure 2). Evolu-tion is shown in 0.5s steps starting at 1.0 s. Centralq0 evolves towards lower values. The three hori-zontal lines indicate resonant q-values.
main heating phase. Table 1 lists the modifications during current ramp-up, the achieved valuesfor q0 at the onset and H-factors and MHD-modes towards the end of the main heating. The evo-lution of the current profile during the main heating phase is shown in figure 4 for the dischargewith the most strongly inverted q-profile at the onset of the main heating. The major changesare observed for the first half second but a steady state is only reached after 3 seconds of flat top.During this evolution of the current profile, a (4,3)-NTM occurs at 2 seconds followed by the
equilibrated q-profiles
q95=4.8, early heating
q95=4.8q95=4.0
late heating}
Figure 5: Equilibrated current profiles (at 5.5 s),same linestyle/colour-code as in fig. 3. (if MSE isavailable). Errors are discussed in the text on thebasis of figure 6. Only the short dashed red case(#20990, see table 1) shows regular sawteeth notrelated to ICRH modulation.
occurence of a (3,2)-NTM at 3.2 seconds. Fig-ure 5 shows that the equilibrated q-profilesare only marginally different for all q95=4.8case with early heating, essentially indepen-dent from the variations of heating power andgas puff in the preheat phase. The case withstrongest gas puff (#20990) shows small saw-teeth, but no difference with respect to con-finement or other MHD activity is observed.Comparing the blue curves in figures 3 and5 we note, that the current profile obtainedwith the late-heating scheme remains almostunchanged, i.e. it is already close to its equi-librated shape. The first discharge at lowerq95 showed a strong sensitivity to the peri-odic switching of ICRH and NBI, such thatthis switching has been excluded for the otherdischarges at this q-value, such that no MSEvalues are available. As shown in table 1,for q95=4.0 the early heating scenario with thehighest level of early heating did not yield a
5 EX/P1-7
steady state H-mode during the main heating phase, but developed a strong ion ITB followedby a disruption, as it is usually observed for stronger heating during current ramp-up. The rea-son for this different behaviour is an L-H transition (due to the reduced Bt) already in the currentramp-up phase, leading already in this phase to Ti values well above Te. Such a target plasma isespecially prone to develop an ion ITB with additional NBI heating. We refer to [11], in whichthe dilution of the thermal ions by the fast ion population produced by the NBI is identified asa key element to generate an ion ITB on ASDEX Upgrade due to stabilisation of ITG-modes.
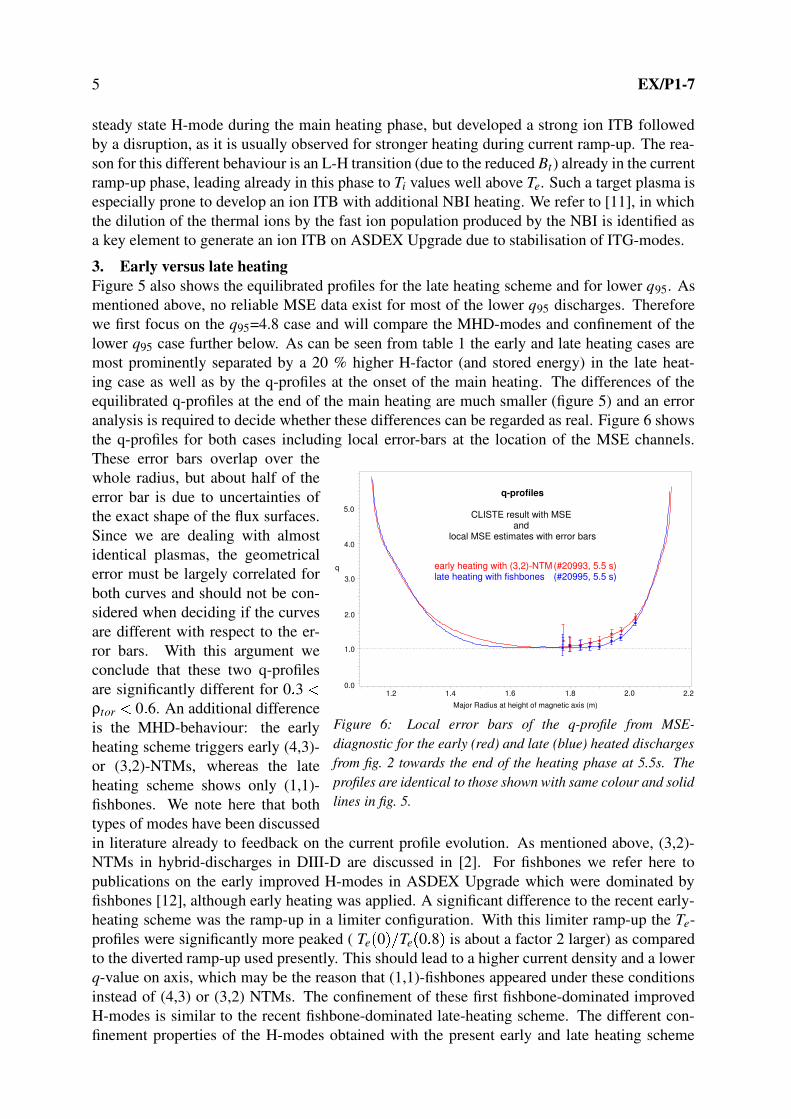
3. Early versus late heatingFigure 5 also shows the equilibrated profiles for the late heating scheme and for lower q95. Asmentioned above, no reliable MSE data exist for most of the lower q95 discharges. Thereforewe first focus on the q95=4.8 case and will compare the MHD-modes and confinement of thelower q95 case further below. As can be seen from table 1 the early and late heating cases aremost prominently separated by a 20 % higher H-factor (and stored energy) in the late heat-ing case as well as by the q-profiles at the onset of the main heating. The differences of theequilibrated q-profiles at the end of the main heating are much smaller (figure 5) and an erroranalysis is required to decide whether these differences can be regarded as real. Figure 6 showsthe q-profiles for both cases including local error-bars at the location of the MSE channels.
q-profiles
CLISTE result with MSE and
local MSE estimates with error bars
early heating with (3,2)-NTM (#20993, 5.5 s)late heating with fishbones (#20995, 5.5 s)
Major Radius at height of magnetic axis (m)
q
0.0
1.0
2.0
3.0
4.0
5.0
1.2 1.4 1.6 1.8 2.0 2.2
Figure 6: Local error bars of the q-profile from MSE-diagnostic for the early (red) and late (blue) heated dischargesfrom fig. 2 towards the end of the heating phase at 5.5s. Theprofiles are identical to those shown with same colour and solidlines in fig. 5.
These error bars overlap over thewhole radius, but about half of theerror bar is due to uncertainties ofthe exact shape of the flux surfaces.Since we are dealing with almostidentical plasmas, the geometricalerror must be largely correlated forboth curves and should not be con-sidered when deciding if the curvesare different with respect to the er-ror bars. With this argument weconclude that these two q-profilesare significantly different for 0 � 3 �ρtor
� 0 � 6. An additional differenceis the MHD-behaviour: the earlyheating scheme triggers early (4,3)-or (3,2)-NTMs, whereas the lateheating scheme shows only (1,1)-fishbones. We note here that bothtypes of modes have been discussedin literature already to feedback on the current profile evolution. As mentioned above, (3,2)-NTMs in hybrid-discharges in DIII-D are discussed in [2]. For fishbones we refer here topublications on the early improved H-modes in ASDEX Upgrade which were dominated byfishbones [12], although early heating was applied. A significant difference to the recent early-heating scheme was the ramp-up in a limiter configuration. With this limiter ramp-up the Te-profiles were significantly more peaked ( Te 0 �� Te 0 � 8 is about a factor 2 larger) as comparedto the diverted ramp-up used presently. This should lead to a higher current density and a lowerq-value on axis, which may be the reason that (1,1)-fishbones appeared under these conditionsinstead of (4,3) or (3,2) NTMs. The confinement of these first fishbone-dominated improvedH-modes is similar to the recent fishbone-dominated late-heating scheme. The different con-finement properties of the H-modes obtained with the present early and late heating scheme

6 EX/P1-7
(fig. 2) may be a direct consequence of the different MHD-modes and the related differencesin the current profile. As possible mechanisms one can either think of the direct influence ofthe NTM by short-cutting magnetic heat insulation across the island width or of effects of themodified current profile on core and/or pedestal transport. For the pair shown in figure 2 allthree effects may play a role. Figure 7 shows temperature and density profiles of the respectivedischarges, fitted to ECE and Thomson scattering (TS) for Te, CXRS for Ti and far-infraredinterferometry plus Lithium-beam-diagnostic for ne. We note that the temperature values closeto the pedestal top are similar in both cases but the gradients in the confinement zone are largerfor the late-heating case. The difference in the density is essentially due to a variation at thepedestal top. The common polynomial fit of the two Te-diagnostics hides the fact that the ECEprofiles are only different inside ρtor � 0 � 5 which is approximately the position of the NTMs inthe early-heated discharge, whereas the CXRS and TS data rather show the wide variation alsoshown by the fits in figure 7. The ECE-data indicate a direct effect of the NTM, whereas thevariation of the gradients over a wider radial range would require a different explanation.
rho_tor
early heating (#20993, 5.5 s)versus
late heating (#20995, 5.5 s)
ne Te
T i
Figure 7: Electron density profiles and electron and ion temperature profiles for the early (red) and late(blue) heated discharges from figs. 2,6 (at 5.5 s).
0.0 0.2 0.4 0.6 0.8 1.0rho_tor
-1.0
-0.5
0.0
0.5
1.0shear / q
early heating (20993)late heating (20995)} at 5.5 s
Figure 8: The inverse gradient length of q, s q forthe early (red) and late (blue) heated dischargesalso shown in figures 2,6,7. From figure 6 it is clearthat the differences are only relevant in the range0 � 3 � ρtor � 0 � 6.
:
0.0 0.2 0.4 0.6 0.8 1.0rho_tor
0
-2
-4
-6
-8R / LTi
Fit to experiment
GS2 results
early heating (20993)late heating (20995)} at 5.5 s
:
Figure 9: solid lines correspond to R LTi calcu-lated from the fits to the experimental Ti-profilesas shown in figure 7. Crosses correspond to criti-cal values of R LTi obtained for the onset of ITGturbulence by the linear gyro-kinetic GS2 code.

7 EX/P1-7
Since we have reliable q-profiles for these cases we calculate the ratio of magnetic shear andsafety factor, i.e. s � q, known to influence the critical temperature gradient length for ITG tur-bulence. Figure 8 compares the profiles of s � q for both cases and the solid lines in figure 9are the R � LTi profiles obtained from the fits to the experimental Ti data. In the same figure,the linear thresholds of R � LTi at mid-radius for the two plasmas are shown. These have beencomputed with GS2 [13] as the values of R � LTi at which the maximum growth rate is equal tothe value of the E � B shearing rate ωE � B [14]. The calculations are made in such a way toquantify exclusively the effect due to the variation of the shear and safety factor profiles in thetwo plasmas. Comparing both discharges we note that the difference of the calculated thresholdvalues is close to that of the measured values. This shows that the theoretically predicted effectson ion heat transport due to the observed changes in the current profile are large enough to causechanges of the Ti profiles which are in the observed range.As mentioned above, also the pedestal pressure is higher in the late-heating case due to in-creased pedestal density. It is well known that the plasma current in the plasma edge has astrong influence on pedestal behaviour and therefore modifications of the current profile couldin principle influence the pedestal. Unfortunately, we do not have good enough edge data forthese discharges to reconstruct the bootstrap current in the edge region properly. Nevertheless,analysis of the plasma edge under these conditions is reported for a pair of discharges from theprevious campaign in [15], showing that the width of the steep density-gradient zone is similarbut steeper density gradients in the H-mode pedestal and a higher separatrix density lead tohigher pedestal densities in the late-heating case. Unfortunately, these discharges with goodedge measurements did not have proper MSE-data, such that also for this pair it is not possibleto link central current profile and edge current profile.
4. Conclusions for current ramp-upIn the previous section it was described that the specific early heating scenario had poorer energyconfinement most likely due to the NTMs or the related q-profile modifications. This correlationcan occasionally be observed also in a single flattop phase during which the (4,3) or (3,2) NTMappears or disappears: In [16] a case is shown, for which the (3,2)-mode does set in well afterthe start of the main heating. Before, the main heating phase showed only a weak (5,4)-NTM.Immediately after the onset of the (3,2)-mode follows a reduction of the stored energy of morethan 10%. Vice versa, the late-heated discharge at q95
� 4 � 0 (#20997) of our series comes upwith a (4,3)-NTM and some seldom fishbones. As time evolves the fishbone bursts becomelonger and more frequent. Finally fishbones dominate and the NTM changes to (5,4) as shownin figure 10. The figure also shows the increase of the H-factor correlated with this change inMHD-behaviour. From this discharge it is clear that (3,2) or (4,3) NTMs are not necessary toreach high values of β (here βN
� 2 � 8, examples in [7] reach βN� 3 � 0 with fishbones but no
NTM). In terms of energy confinement it is even beneficial if these NTMs can be avoided. Fromthe q-profile evolution shown in figure 4 it seems that in the early-heated discharges the NTMsets in as the q-profile drops to the corresponding q-values. As the central q-profile is very flatat that time point, the shear in the region around q � 1 � 5 is close to zero which facilitates theformation of an NTM. For the late heating the central current profile is already flat when theheating sets in and the central value is close to unity, favouring the occurrence of fishbones. Inthis case the shear at q � 3 � 2 is strong, possibly stabilising the mode, although β is higher. Interms of a start-up recipe these results suggest that for the onset of the main heating a flat centralq-profile with q � 1 should be aimed at. In ASDEX Upgrade this was possible with an ohmicplasma ramped-up in a divertor configuration, but most likely also with early heating of a plasmaramped-up in a limiter configuration. There may be other ways, especially with dedicatedtools such as LHCD [4] or ECCD to modify the current profile before the onset of the main

8 EX/P1-7
heating or during the main heating. Still the use of these tools may require subtle adjustments:
0 2 4 6 8 10 Time (seconds)
0
20
40
60
80
100
Fre
quen
cy (k
Hz)
0
1
2
3
4
5
6
7
-7
-6
-5
-4
-3
-2
-1
0
AB:20997 /AUGD/TTH (1)/H/L-facs;8
0 2 4 6 8 10Time (s)
AD:20997 /AUGD/TOT (1)/PNBI_TOT AF:20997 /AUGD/TOT (1)/PICR_TOT
0 MW
10 MW1
2H98(y,2)
P_NBIP_ICR
(4,3)
fishbones
(5,4)
Figure 10: Late heating at q95 � 4 � 0 (#20997): time traces andMHD activity. From 2.5 to 4.5 s fishbone activity increases.Finally the NTM changes from (4,3) to (5,4).
DIII-D experiments on stabilisationof the (3,2)-mode with ECCD [2]resulted in larger sawteeth and nofishbones were reported. Seem-ingly, the q-profile on axis droppedwell below unity, indicating thatit may be necessary to counter-act the full relaxation of the q-profile when stabilising the NTM.On ASDEX Upgrade it was possibleto achieve sawtooth-free fishbone-dominated high βN operation atq95 � 3 after stabilising a (3,2)-NTM [7]. As mentioned above, theNBI driven current may be impor-tant as well for the q-profile evolu-tion, therefore it was kept constantin this study. Still it was differ-ent in the first fishbone-dominatedimproved H-modes in ASDEX Up-grade [1]. An extension of thisstudy including variation of thebeam sources is planned, althoughprevious experiments showed thatthe q-profile is hardly modified byoff-axis NBCD in strongly heatedH-modes [17].
References[1] GRUBER, O. et al., Phys. Rev. Lett. 83 (1999) 1787.[2] WADE, M. R. et al., Nucl. Fusion 45 (2005) 407.[3] IDE, S. et al., Nucl. Fusion 45 (2005) S48.[4] JOFFRIN, E. et al., Nucl. Fusion 45 (2005) 626.[5] GRUBER, O. et al., Plasma Phys. Controlled Fusion 47 (2005) B135.[6] ITER Physics Basis, Nucl. Fusion 39 (1999) 2137.[7] SIPS, A. C. C. et al., in this Conference, pages EX/1–1, 2006.[8] SUTTROP, W. et al., in this Conference, pages EX/8–5, 2006.[9] MAGGI, C. F. et al., in this Conference, pages IT/P1–6, 2006.
[10] SIPS, A. C. C. et al., Plasma Phys. Controlled Fusion 44 (2002) B69.[11] TARDINI, G. et al., in Europhysics Conference Abstracts (CD-ROM, Proc. of the 32nd EPS Con-
ference on Plasma Physics, Tarragona, 2005), volume 29C, pages P–2.028, Geneva, 2005, EPS.[12] GUNTER, S. et al., Nucl. Fusion 39 (1999) 1535.[13] KOTSCHENREUTHER, M. et al., Comput. Phys. Commun. 88 (1995) 128.[14] WALTZ, R. et al., Plasma Phys. 1 (1994) 2229.[15] HORTON, L. D. et al., in Europhysics Conference Abstracts (CD-ROM, Proc. of the 33th EPS
Conference on Plasma Physics, Rome, 2006), pages P–2.140, Geneva, 2006, EPS.[16] NA, Y.-S. et al., Nucl. Fusion 46 (2006) 232.[17] GUNTER, S. et al., in Europhysics Conference Abstracts (CD-ROM, Proc. of the 32nd EPS Con-
ference on Plasma Physics, Tarragona, 2005), volume 29C, pages P–4.075, Geneva, 2005, EPS.