Physics, Instrumentation and New Trends in … Instrumentation and New Trends in Techniques of...
46
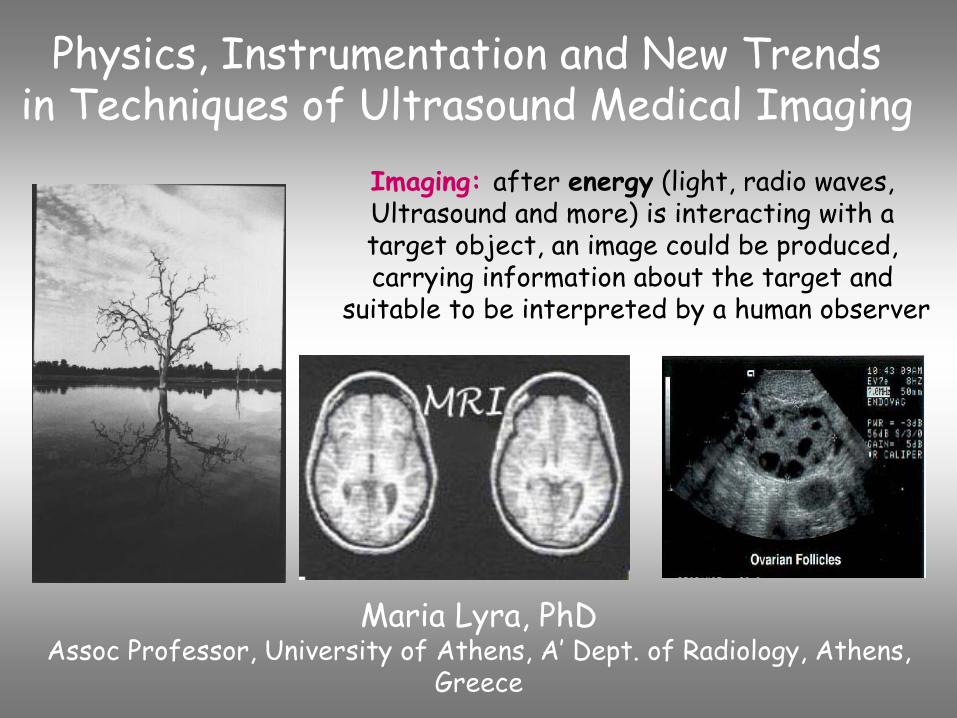
Physics, Instrumentation and New Trends in Techniques of Ultrasound Medical Imaging Maria Lyra, PhD Assoc Professor, University of Athens, A’ Dept. of Radiology, Athens, Greece Imaging: after energy (light, radio waves, Ultrasound and more) is interacting with a target object, an image could be produced, carrying information about the target and suitable to be interpreted by a human observer
Transcript of Physics, Instrumentation and New Trends in … Instrumentation and New Trends in Techniques of...
Physics, Instrumentation and New Trends in Techniques of Ultrasound Medical Imaging
Maria Lyra, PhD Assoc Professor, University of Athens, A’
Dept. of Radiology, Athens,
Greece
Imaging:
after energy
(light, radio waves, Ultrasound and more) is interacting with a target object, an image could be
produced,
carrying information about the target andsuitable to be interpreted by a human observer
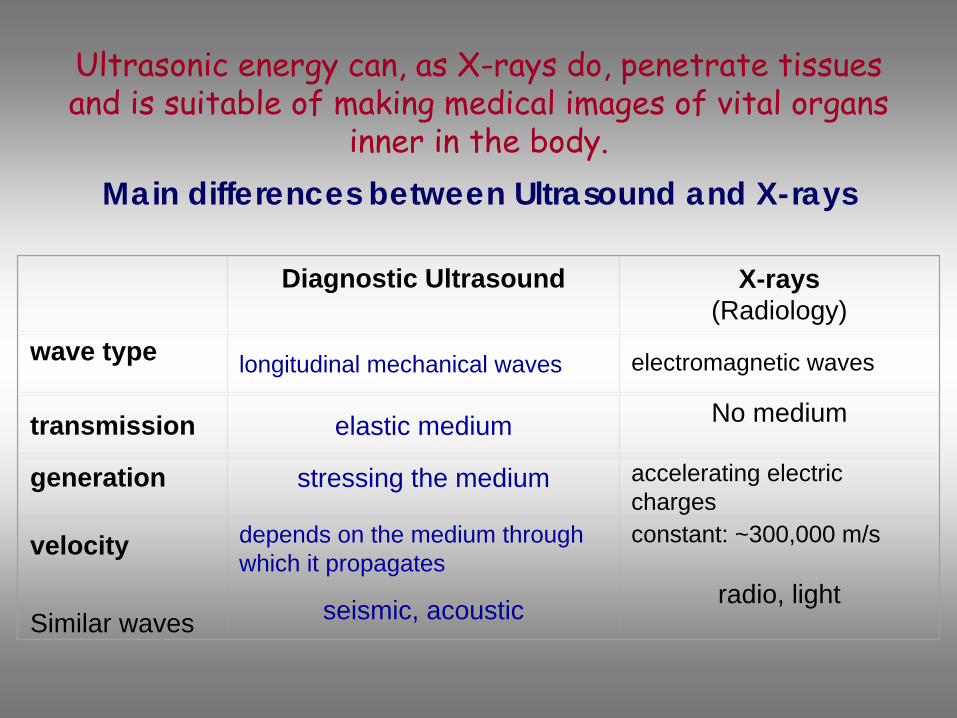
Main differences between Ultrasound and X-rays
Diagnostic Ultrasound X-rays (Radiology)
wave type longitudinal mechanical waves electromagnetic waves
transmission elastic medium No medium
generation stressing the medium accelerating electric charges
velocity depends on the medium through which it propagates
constant: ~300,000 m/s
Similar waves seismic, acoustic radio, light
Ultrasonic energy can, as X-rays do, penetrate tissues and is suitable of making medical images of vital organs
inner in the body.
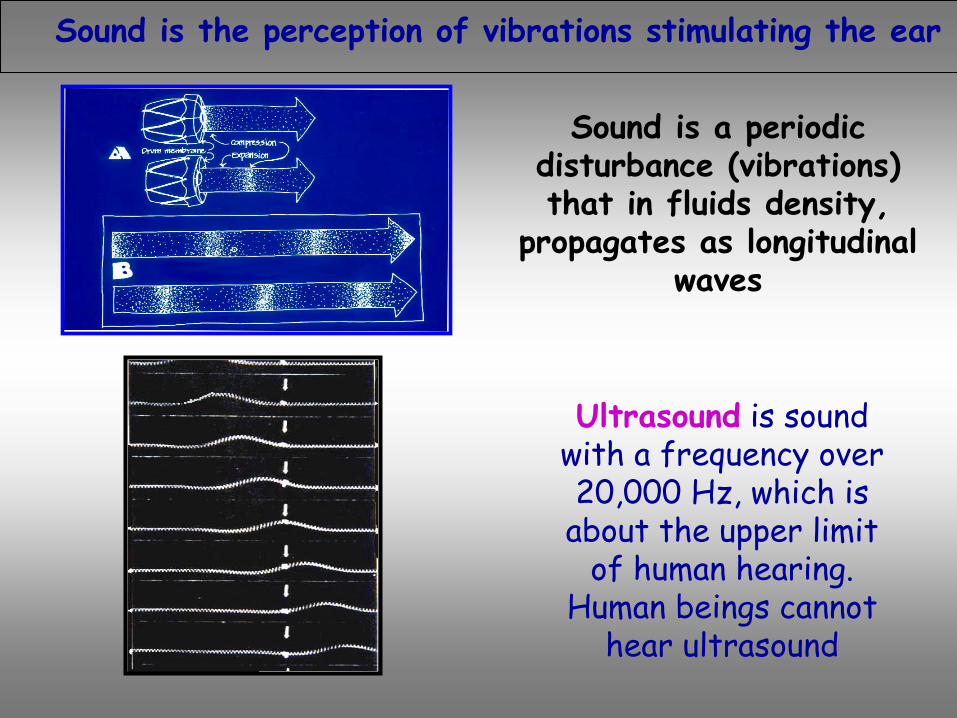
Sound
is a periodic disturbance
(vibrations)
that in fluids density, propagates
as
longitudinal
waves
Sound is the perception of vibrations stimulating the ear
Ultrasound
is sound with a frequency over 20,000 Hz, which is
about the upper limit of human hearing.
Human beings cannot hear ultrasound
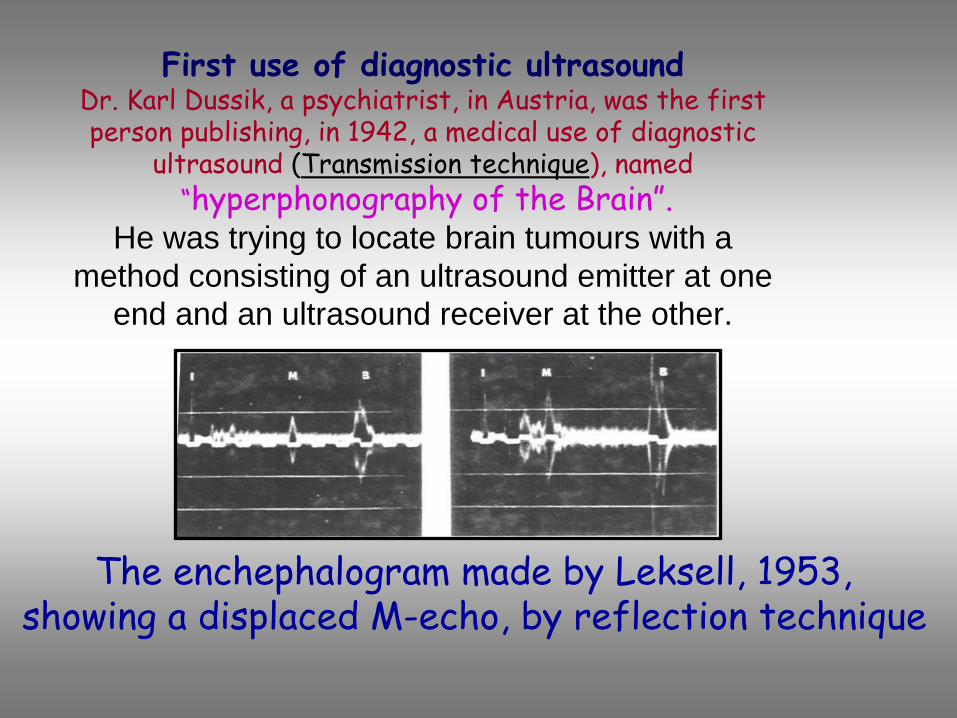
First use of diagnostic ultrasoundDr. Karl Dussik, a psychiatrist, in Austria,
was the first
person publishing, in 1942,
a medical use of diagnostic ultrasound
(Transmission technique), named
“hyperphonography
of the Brain”.He was trying to locate brain tumours with a
method consisting of an ultrasound emitter at one end and an ultrasound receiver at the other.
The enchephalogram
made by Leksell, 1953, showing a displaced M-echo, by reflection technique
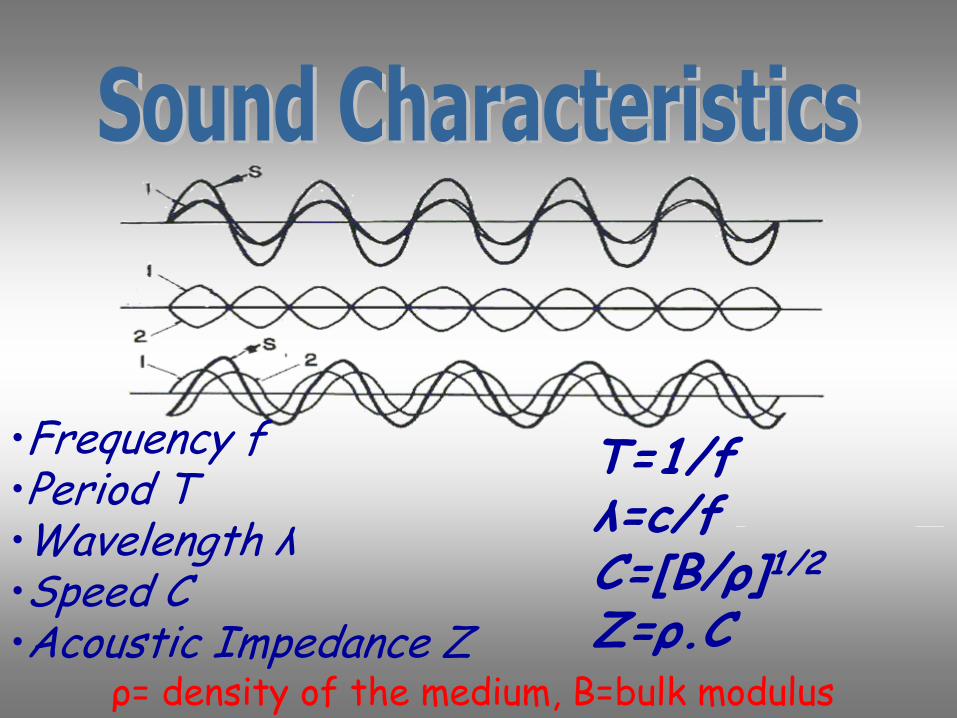
•Frequency f•Period T•Wavelength λ•Speed C •Acoustic Impedance Z
T=1/fλ=c/fC=[B/ρ]1/2Z=ρ.C
ρ= density of the medium, Β=bulk modulus
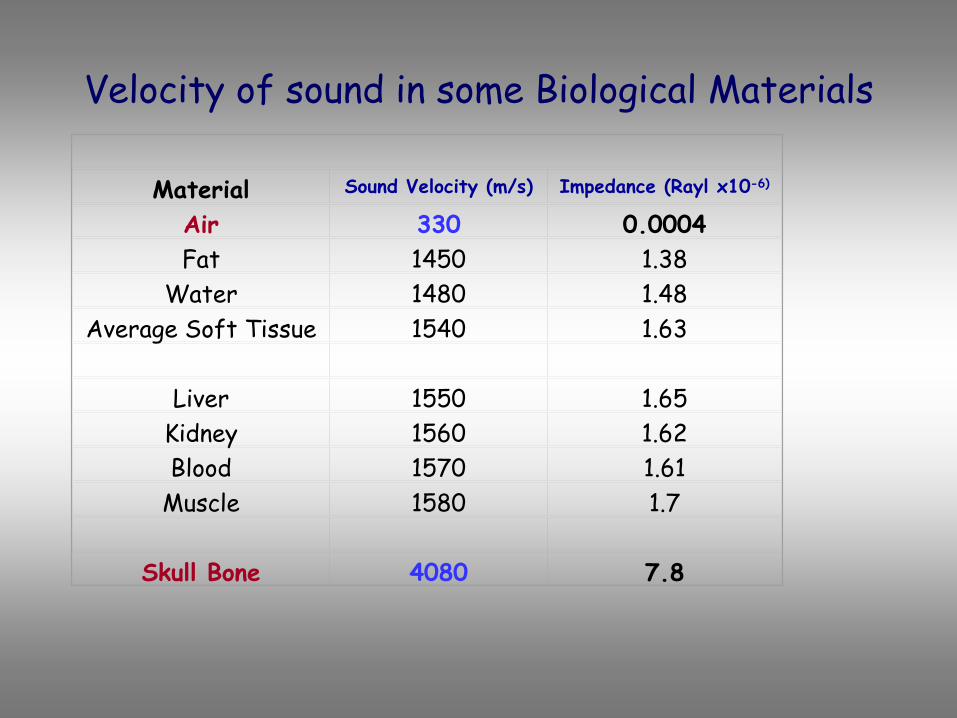
Velocity of sound in some Biological Materials
Material Sound Velocity (m/s) Impedance (Rayl
x10-6)
Air 330 0.0004Fat 1450 1.38
Water 1480 1.48Average Soft Tissue 1540 1.63
Liver 1550 1.65Kidney 1560 1.62Blood 1570 1.61
Muscle 1580 1.7
Skull Bone 4080 7.8
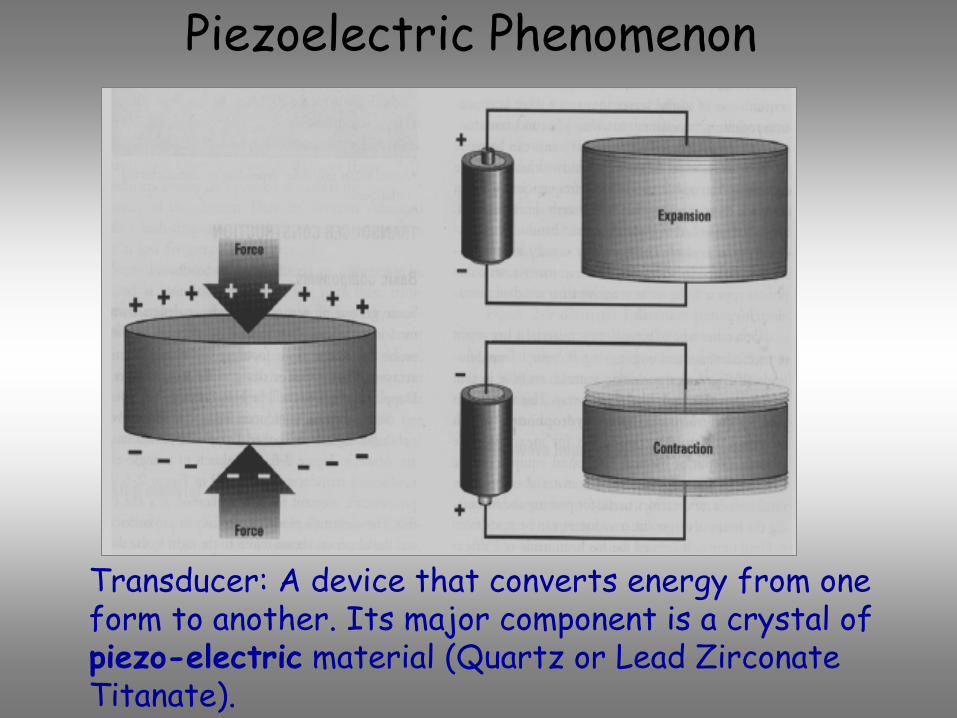
Piezoelectric Phenomenon
Transducer: A device that converts energy from one form to another. Its major component is a crystal of piezo-electric
material (Quartz or Lead Zirconate
Titanate).
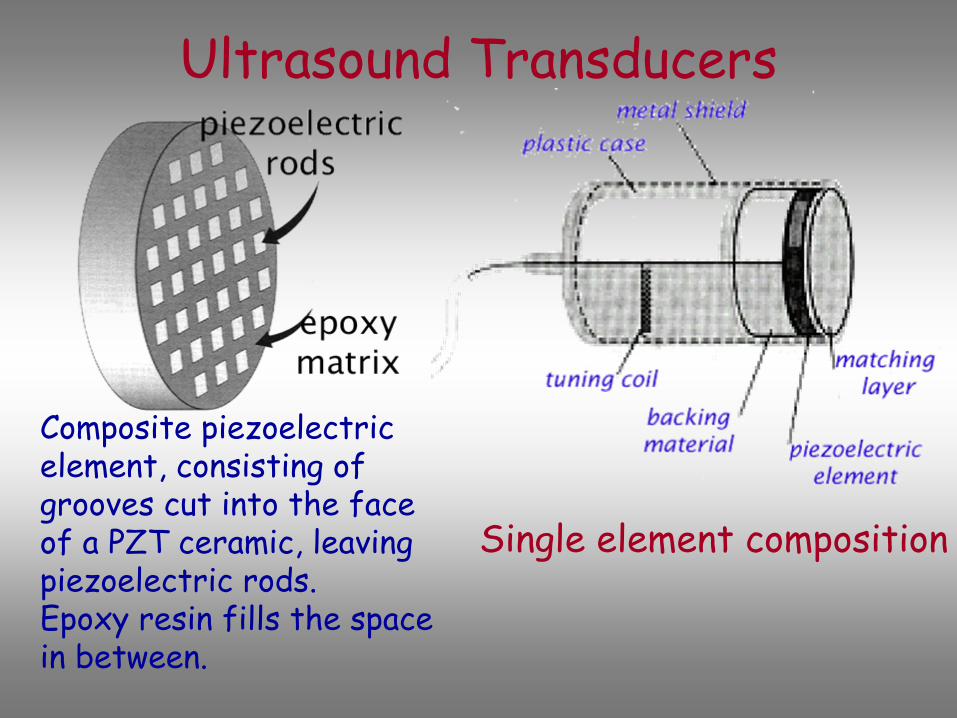
Ultrasound Transducers
Composite piezoelectric element, consisting of grooves cut into the face of a PZT ceramic, leaving piezoelectric rods.Epoxy resin fills the spacein between.
Single element composition
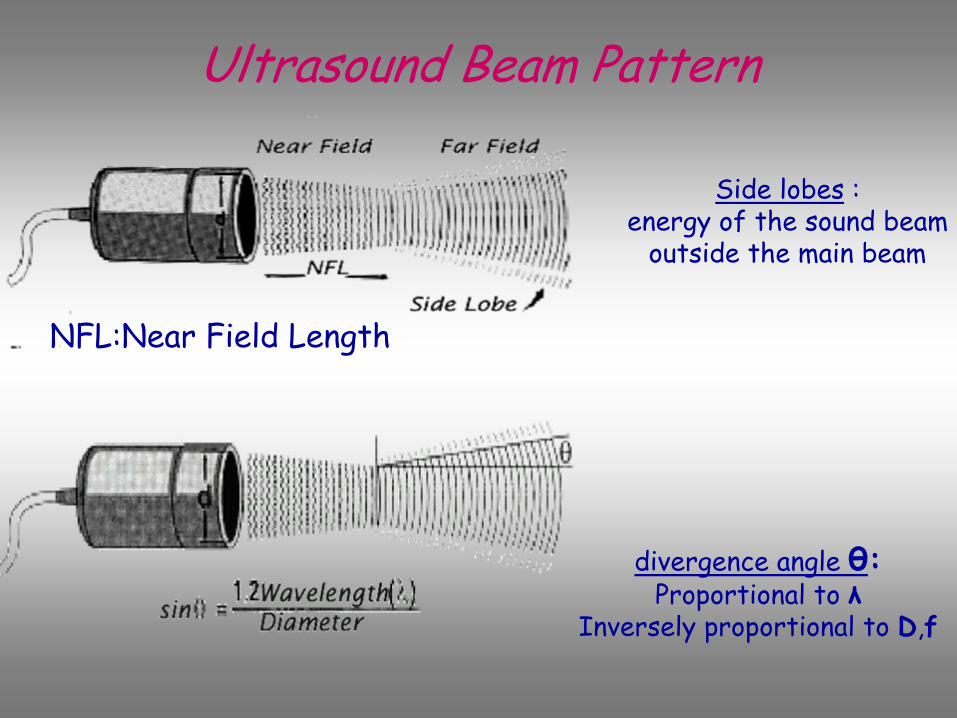
Ultrasound Beam Pattern
NFL:Near Field Length
Side lobes
:energy of the sound beam
outside the main beam
divergence angle θ:Proportional to λ
Inversely proportional to D,f
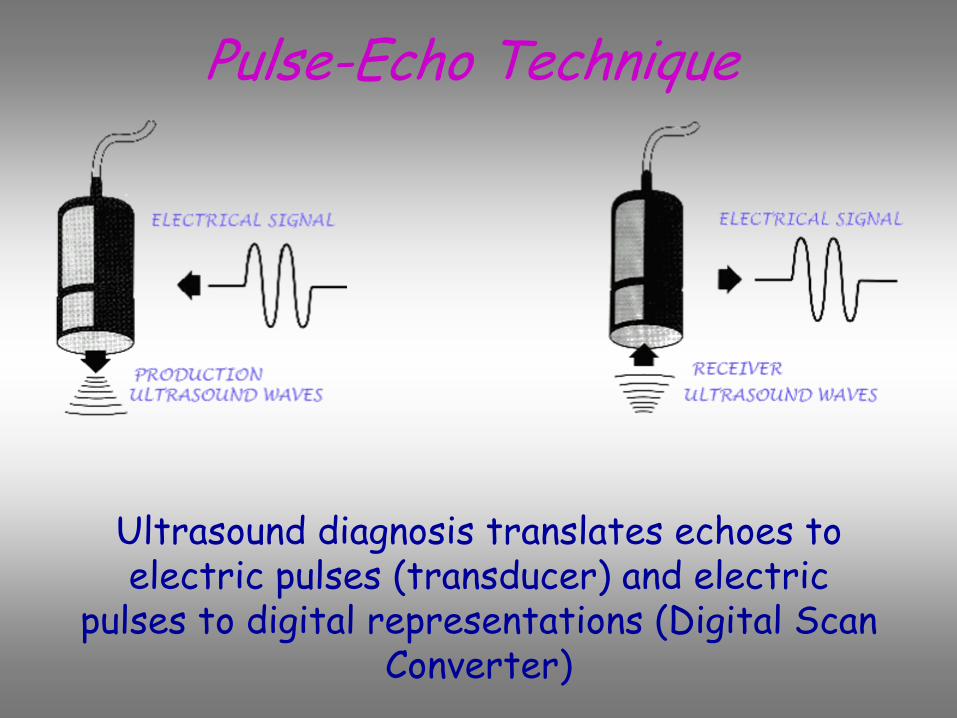
Pulse-Echo Technique
Ultrasound
diagnosis
translates
echoes
to electric
pulses
(transducer) and
electric
pulses
to
digital
representations
(Digital
Scan Converter)
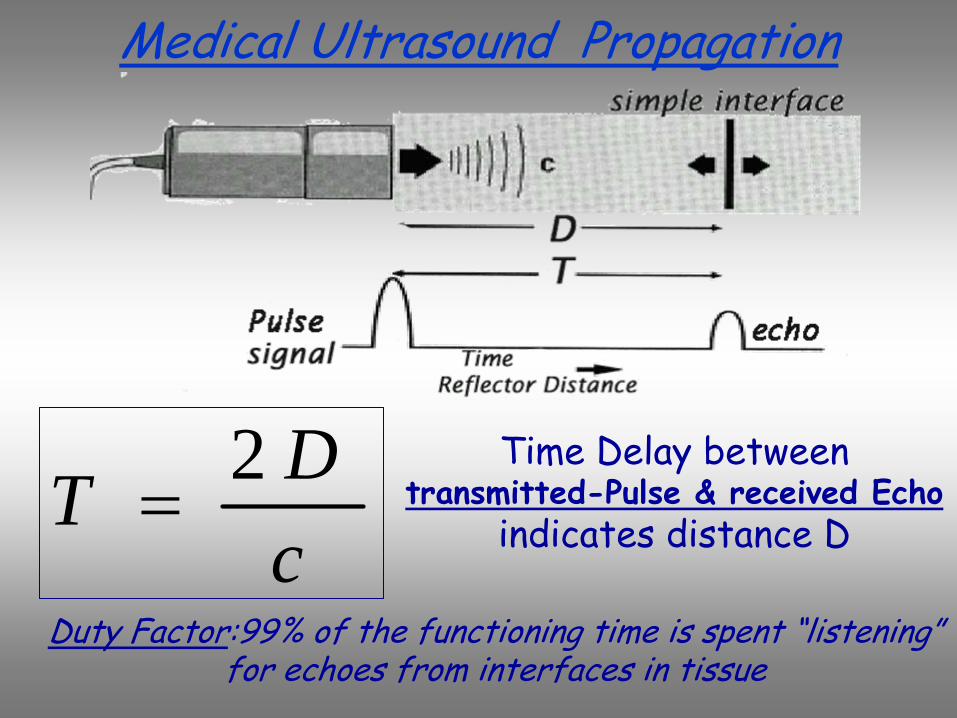
Medical Ultrasound Propagation
cDT 2
=Time Delay between
transmitted-Pulse & received Echoindicates distance D
Duty Factor:99% of the functioning time is spent “listening”for echoes from interfaces in tissue
2
12
12⎟⎟⎠
⎞⎜⎜⎝
⎛+−
=ZZZZ
II
i
r
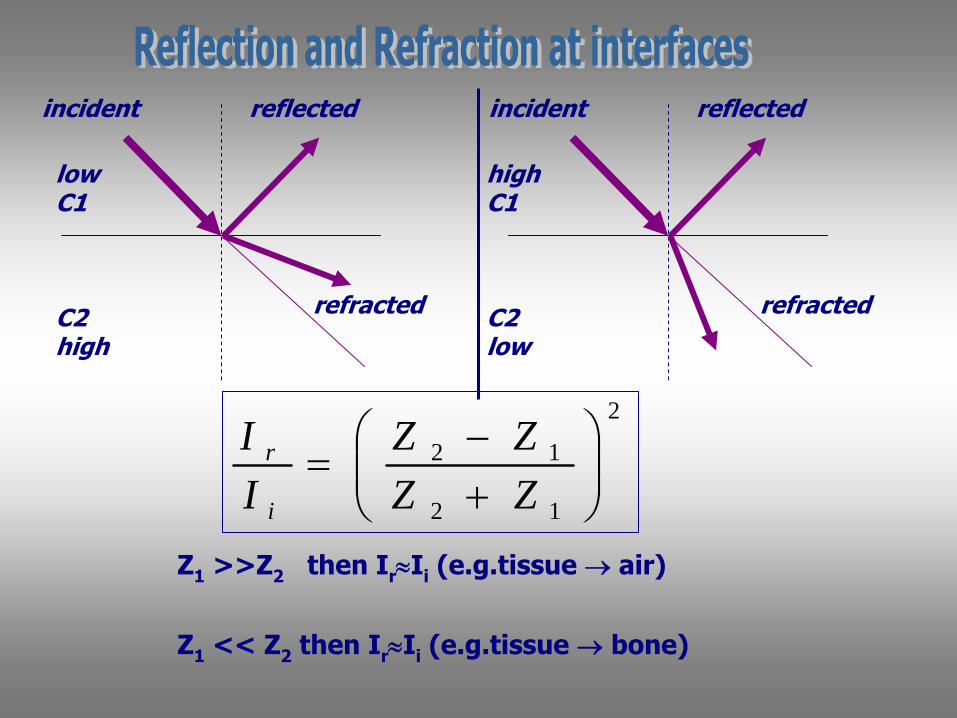
Ζ1
>>Ζ2
then
Ιr
≈Ii
(e.g.tissue
→ air)
Ζ1
<<
Ζ2
then
Ιr
≈Ii
(e.g.tissue
→ bone)
incident
highC1
C2low
refracted
incident
lowC1
C2high
refracted
reflected reflected

Reflection and ScatteringBackscattering of the beamdepends on the scattererssize
diffraction
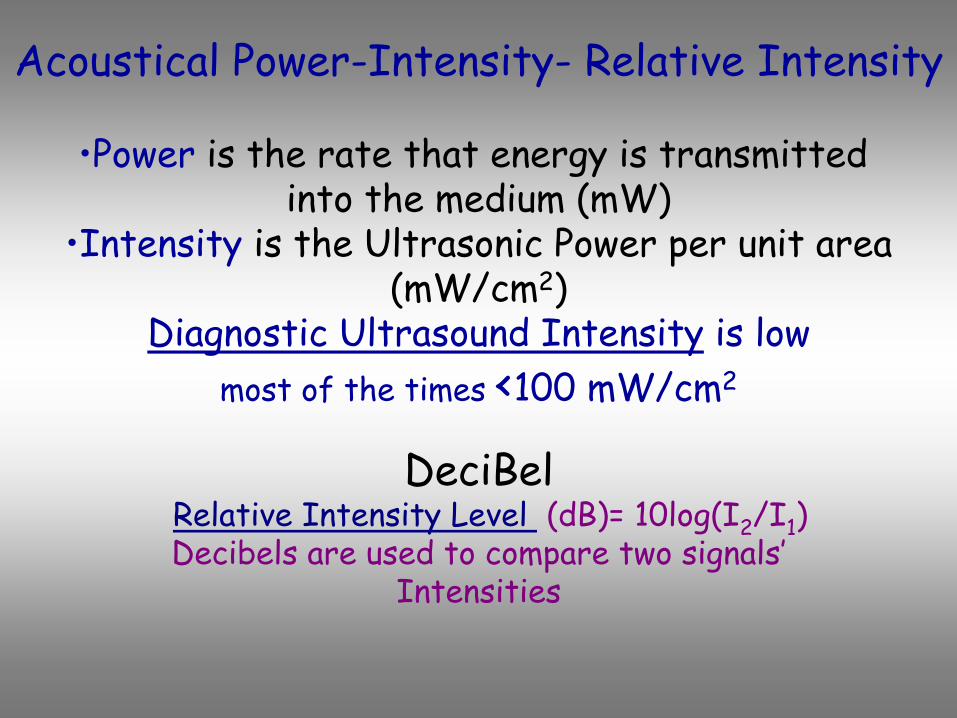
DeciBelRelative Intensity Level
(dB)= 10log(I2
/I1
)Decibels are used to compare two signals’
Intensities
Acoustical Power-Intensity-
Relative Intensity
•Power is the rate that energy is transmitted into the medium (mW)
•Intensity is the Ultrasonic Power per unit area(mW/cm2)
Diagnostic Ultrasound Intensity
is lowmost of the times <100 mW/cm2

Attenuation
Water 0.0002
Blood 0.18
Liver 0.50
1.20
Tissue Attenuation
at
1MHz (dB/cm)
Muscles
Reflection & scatteringAbsorption (ultrasound energy is converted to heat energy)
Attenuation coefficient in tissuein DB/cm /MHz
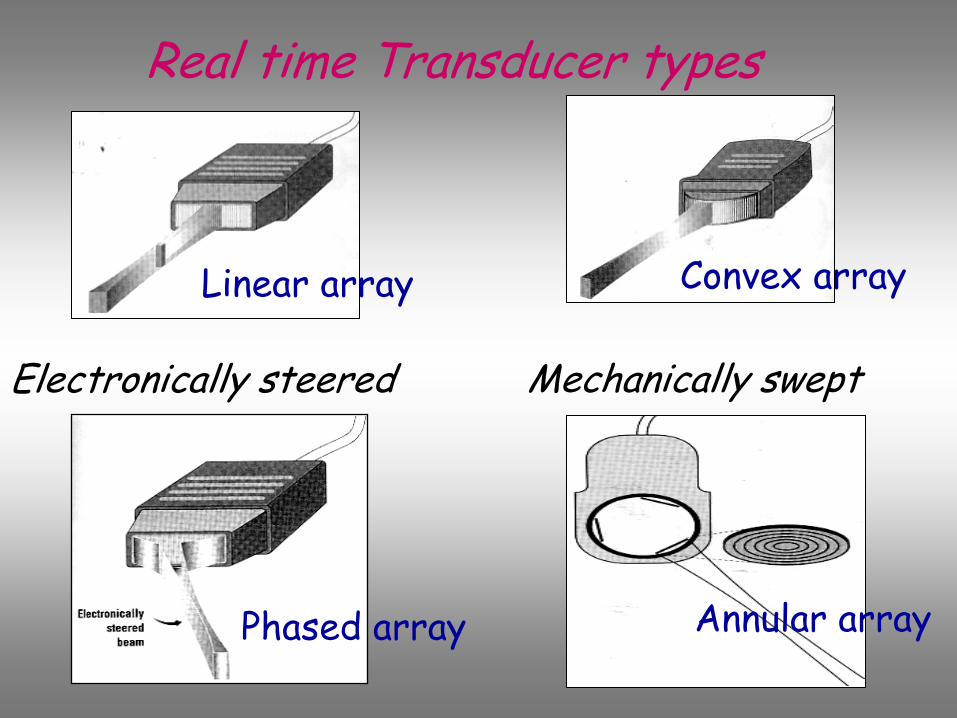
Real time Transducer types
Electronically steered
Linear array Convex array
Phased array Annular array
Mechanically swept
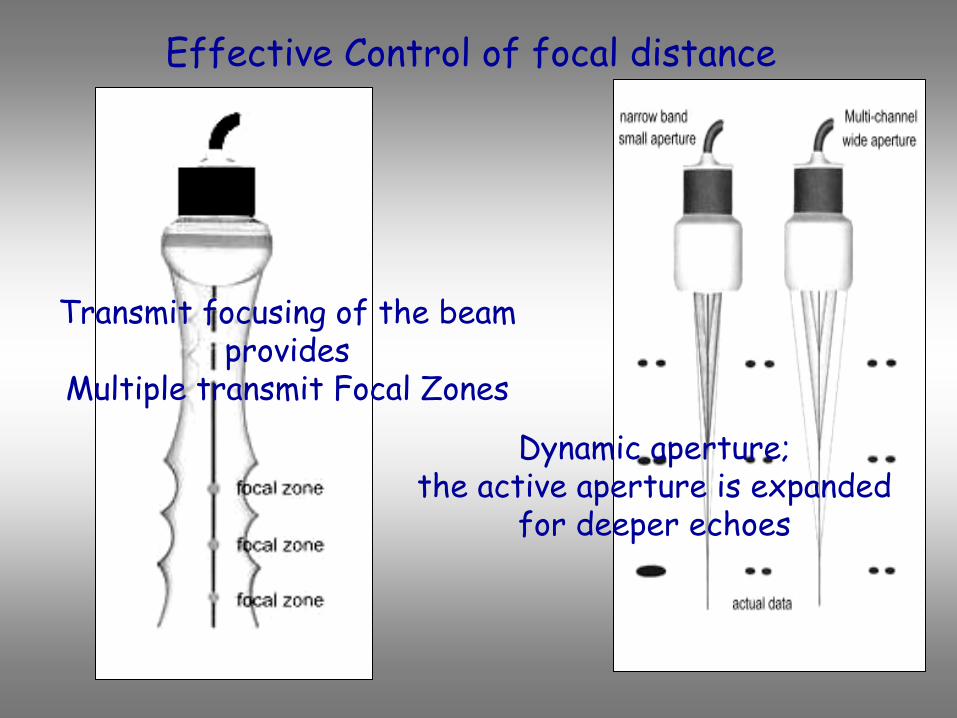
Effective Control of focal distance
Transmit focusing of the beam provides
Multiple transmit Focal Zones
Dynamic aperture; the active aperture is expanded
for deeper echoes

Doppler Effect- Doppler shiftDoppler shift
Doppler equation
:Df
= 2 f v cosϑ/C
Doppler effect in medical Ultrasound quantify & image
blood flow
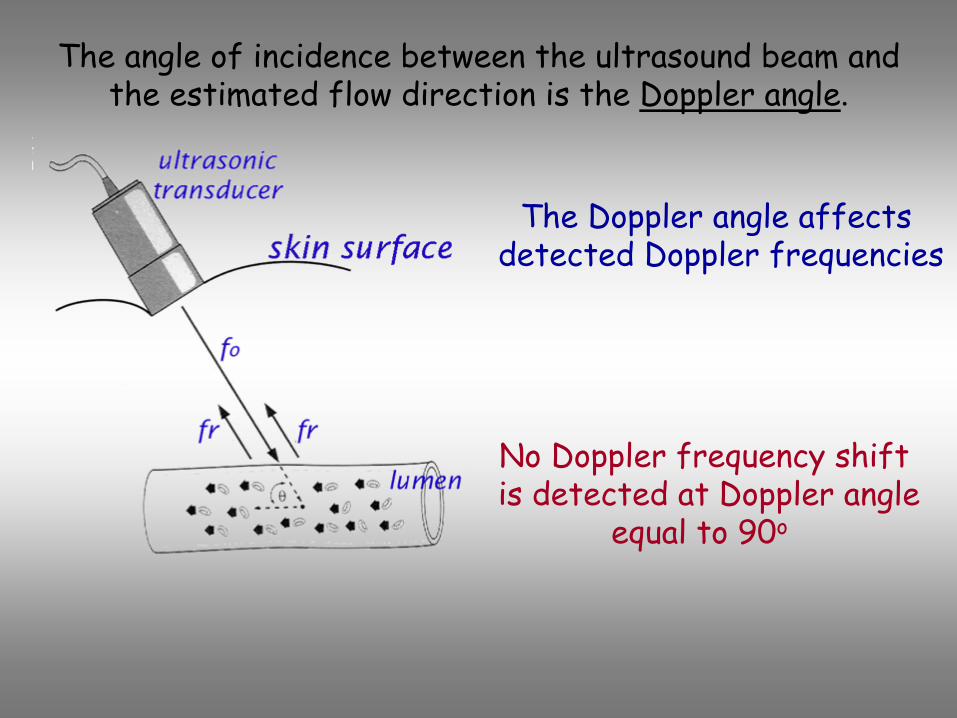
The angle of incidence between the ultrasound beam and the
estimated
flow
direction
is
the
Doppler
angle.
The Doppler angle affectsdetected Doppler frequencies
No Doppler frequency shiftis detected at Doppler angle
equal to 90o

Haemodynamics
In constant
flow, as the cross-sectional area (A) decreases, the velocity (v) increases.
Parabolic flow
Blood Flow occurs as laminar or parabolic,
with the fastest
velocity in the center, and a progressive decrease in velocity toward the vessel wall.
Constant flow

Disturbed flowDisruption
of the orderly
laminae
within the region of narrowing (mild flow disturbance),
and disorganized, multi- directional flow vectors distal
to the stenosis(turbulent flow).
The presence of obstructions
may be detected from the Spectrum

Doppler Spectrum Analysis
Spectral Doppler
is useful when detailed quantitative information about flow velocities is important
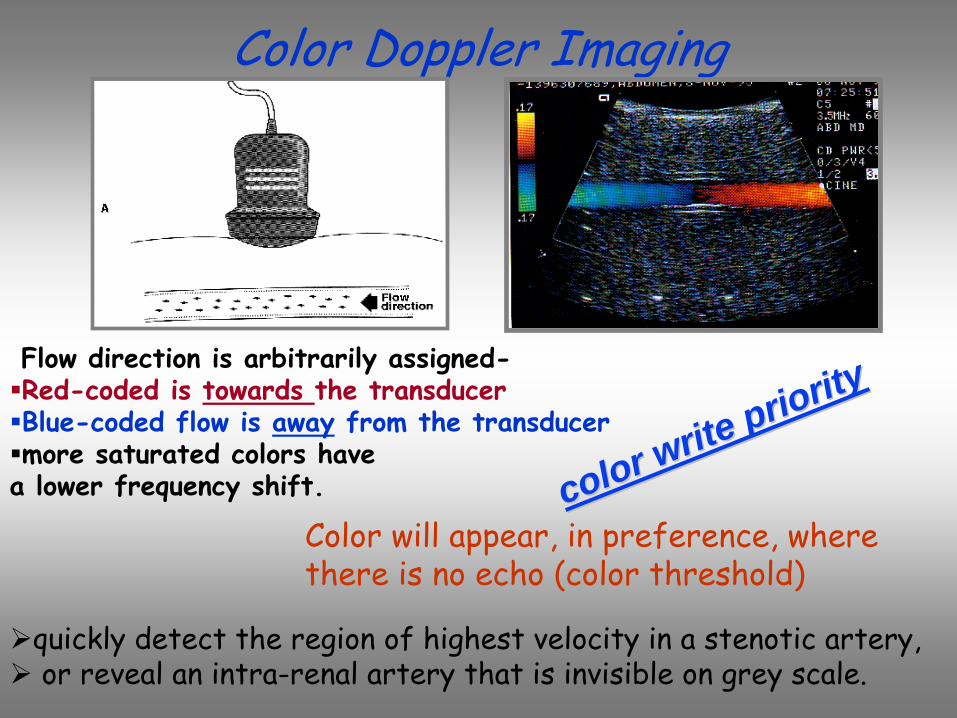
Color Doppler Imaging
color write priority
color write priorityFlow
direction
is
arbitrarily
assigned-
Red-coded is towards the transducerBlue-coded flow is away from the transducermore saturated colors have
a lower
frequency
shift.
quickly detect the region of highest velocity in a stenotic artery,or reveal an intra-renal artery that is invisible on grey scale.
Color will appear, in preference, where there is no echo (color threshold)
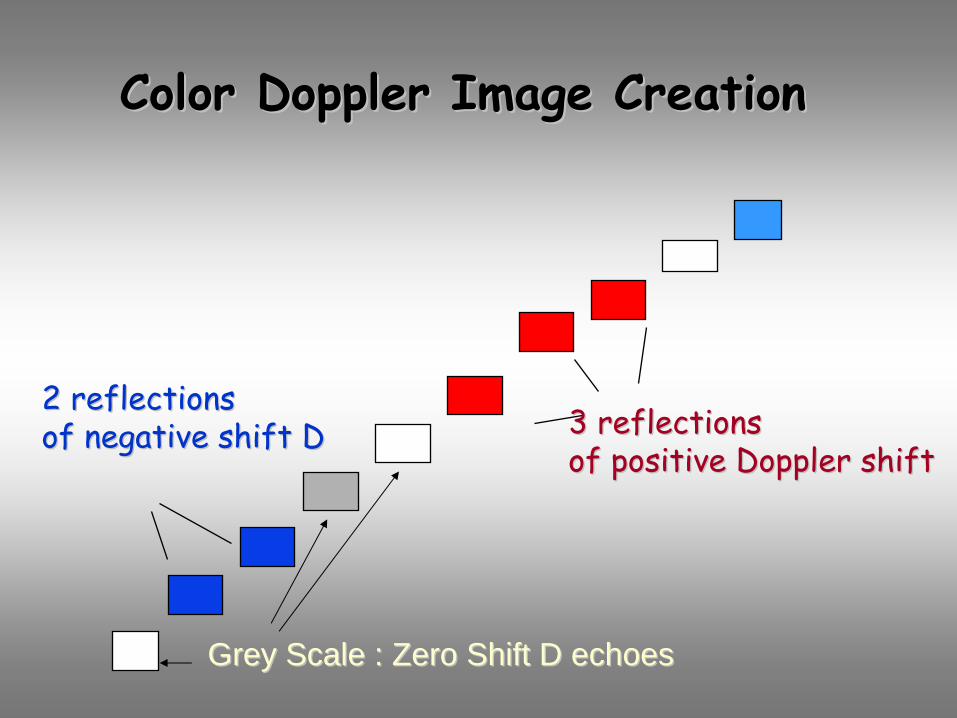
Color Doppler Image CreationColor Doppler Image Creation
3 3 reflectionsreflectionsof positive of positive DopplerDoppler
shiftshift
2 2 reflectionsreflectionsof negative shift of negative shift DD
Grey Scale : Grey Scale : Zero Shift Zero Shift DD echoesechoes
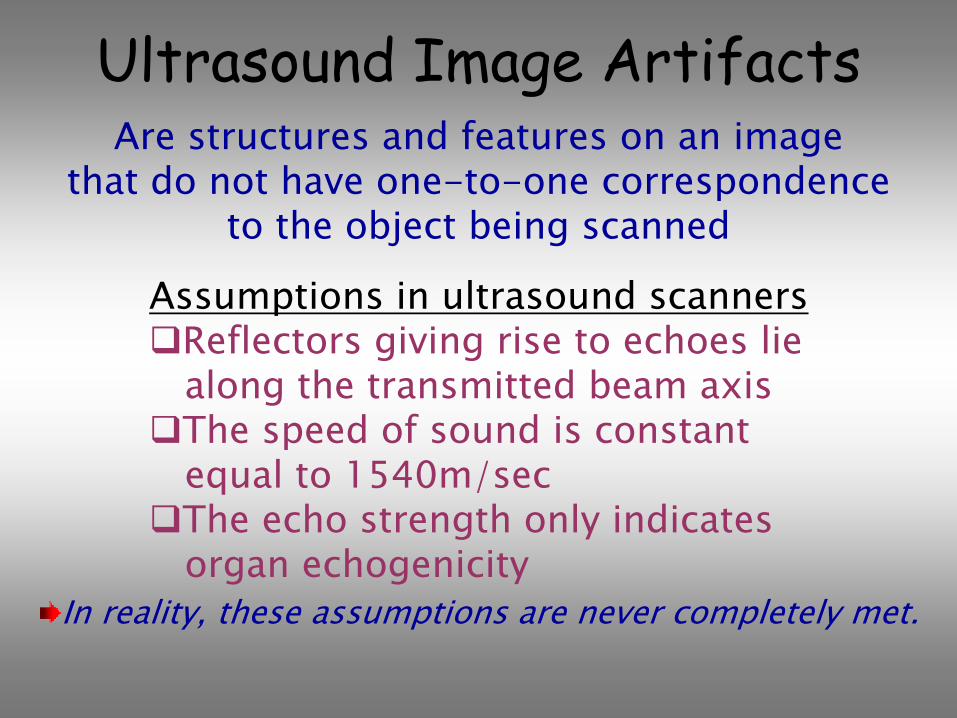
Ultrasound Image ArtifactsAre structures and features on an image
that do not have one-to-one correspondence to the object being scanned
Assumptions in ultrasound scannersReflectors giving rise to echoes liealong the transmitted beam axisThe speed of sound is constant equal to 1540m/secThe echo strength only indicatesorgan echogenicity
In reality, these assumptions are never completely met.
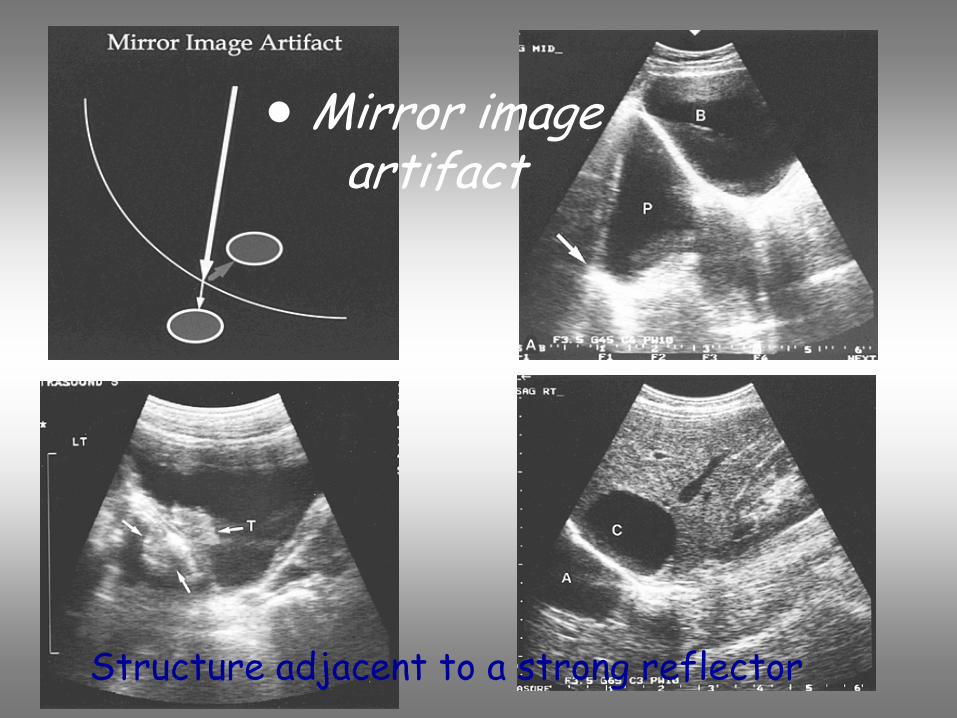
• Mirror image artifact
Structure adjacent to a strong reflector
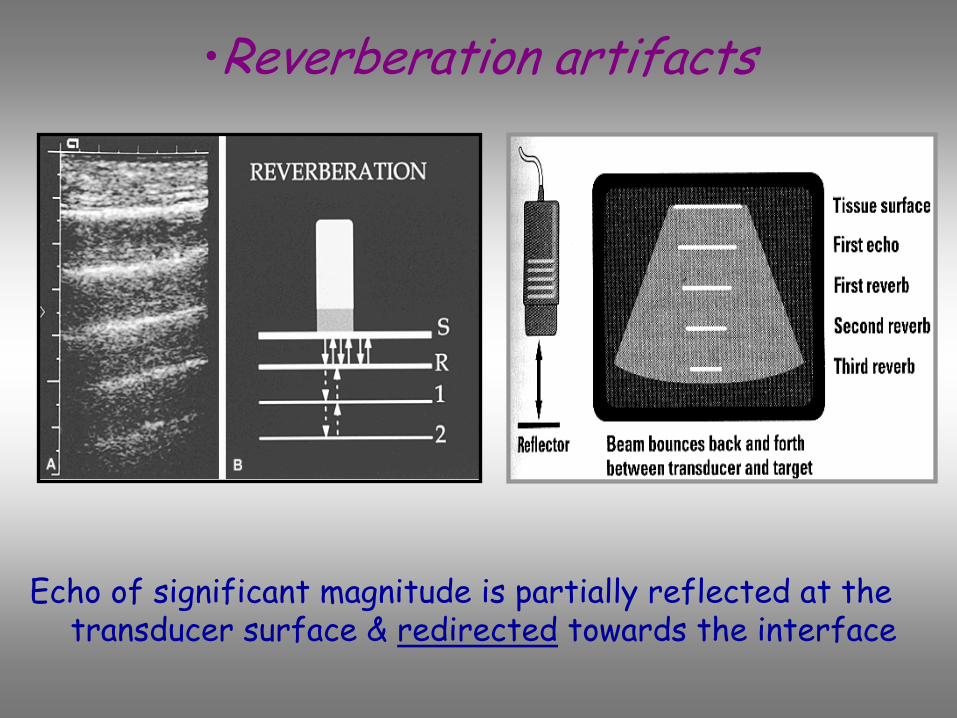
•Reverberation artifacts
Echo of significant magnitude is partially reflected at thetransducer surface & redirected
towards the interface
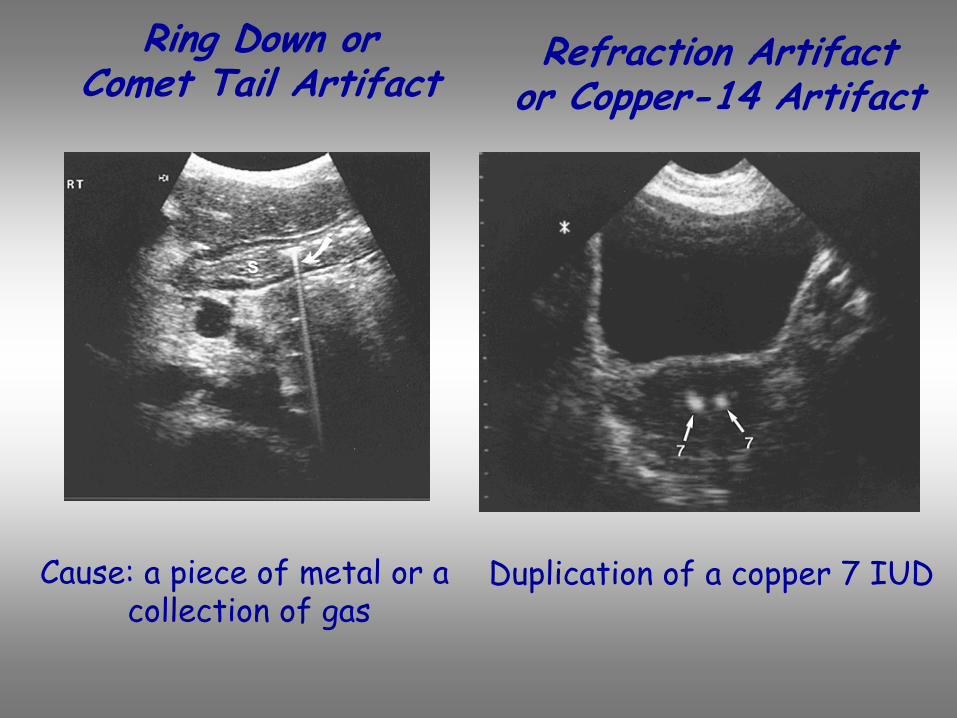
Ring Down or Comet Tail Artifact
Refraction Artifactor Copper-14 Artifact
Duplication of a copper 7 IUDCause: a piece of metal or a collection of gas

Enhancement - Shadowing
Reflective & Refractive Shadowing
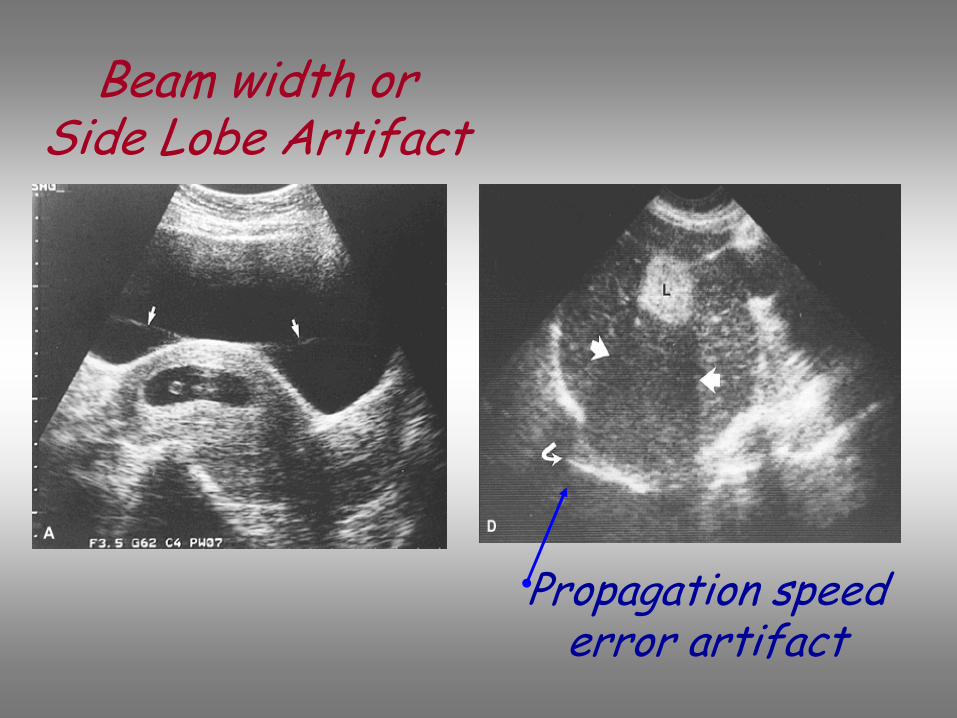
Beam width or Side Lobe Artifact
Propagation speed error artifact
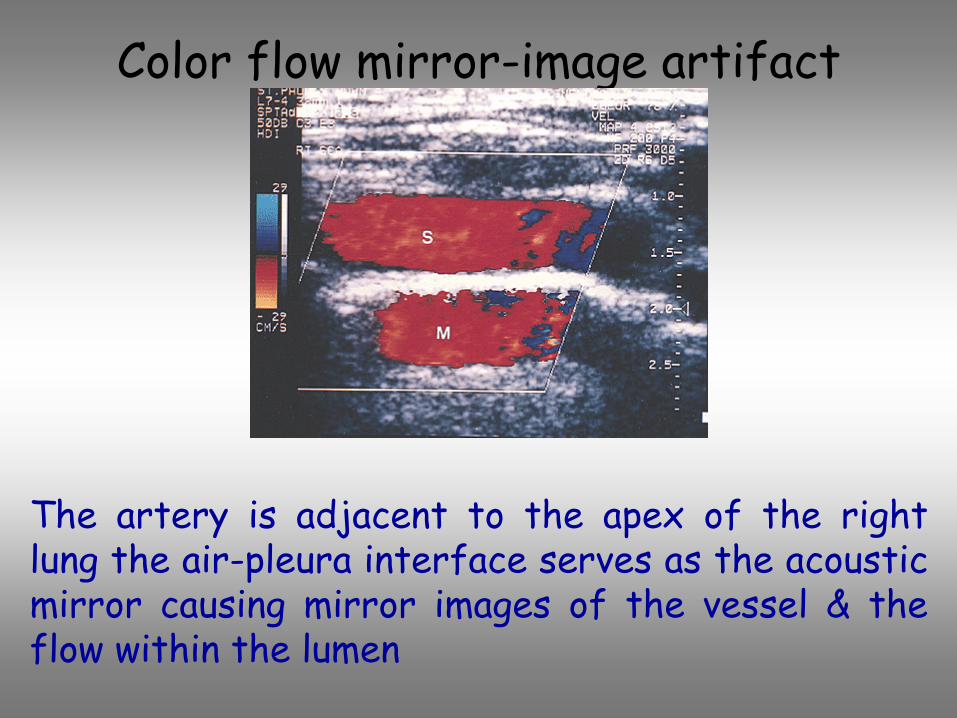
Color flow mirror-image artifact
The artery is adjacent to the apex of the right lung the air-pleura interface serves as the acoustic mirror causing mirror images of the vessel & the flow within the lumen
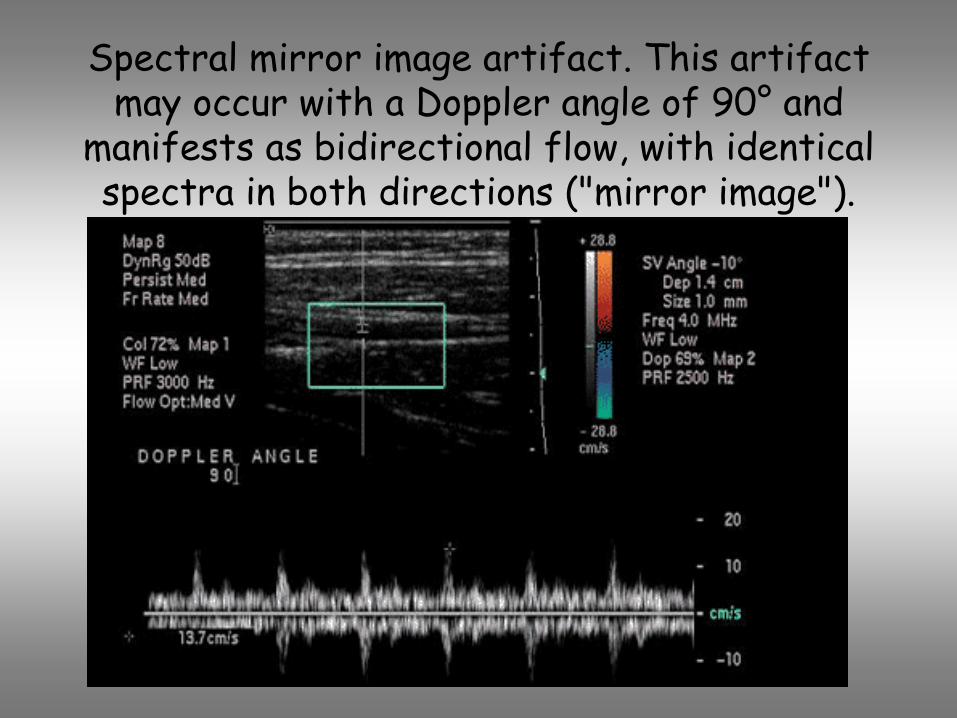
Spectral
mirror
image
artifact. This
artifact may
occur
with
a Doppler
angle
of
90°
and
manifests
as
bidirectional
flow, with
identical spectra
in
both
directions
("mirror
image").

Color where no flow (color noise)
•Cyst in left lobe of liver simulating left ventricular aneurysm•Color flow doppler
showing artifactual
flow due to
transmitted pulsations from the left ventricle

Aliasing, pulsed
Doppler. There
is
folding
over
of
forward flow
in
the
reverse
direction, below
the
baseline.
To eliminate aliasing:adjust
the velocity or frequency scaleon the Doppler spectral display
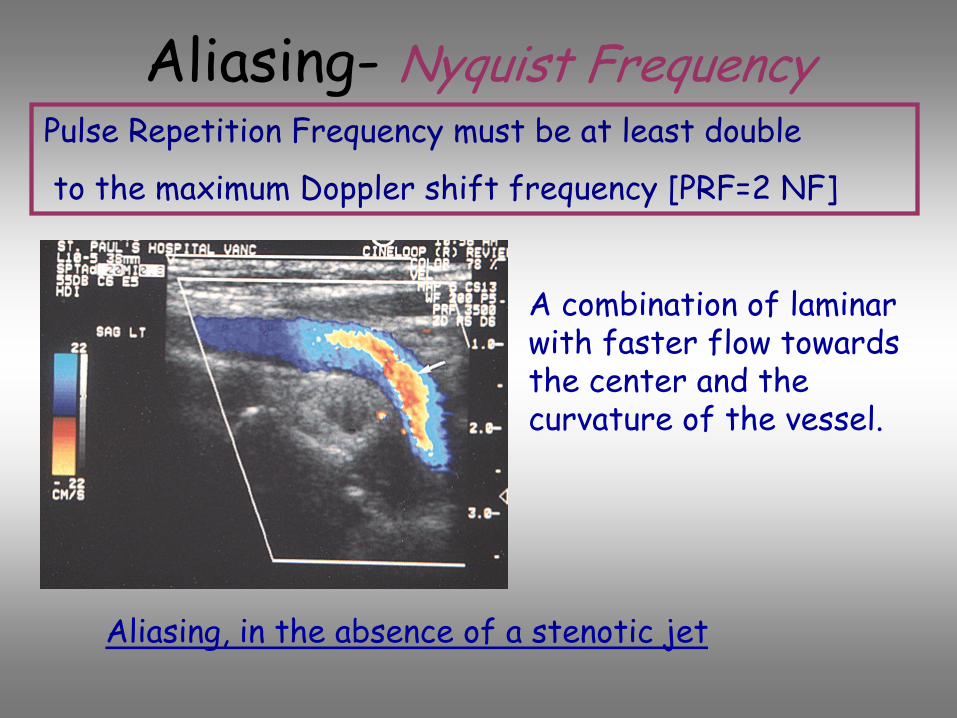
Aliasing- Nyquist FrequencyPulse Repetition Frequency must be at least double
to the maximum Doppler shift frequency [PRF=2 NF]
A combination of laminar with faster flow towards the center and the curvature of the vessel.
Aliasing, in the absence of a stenotic
jet
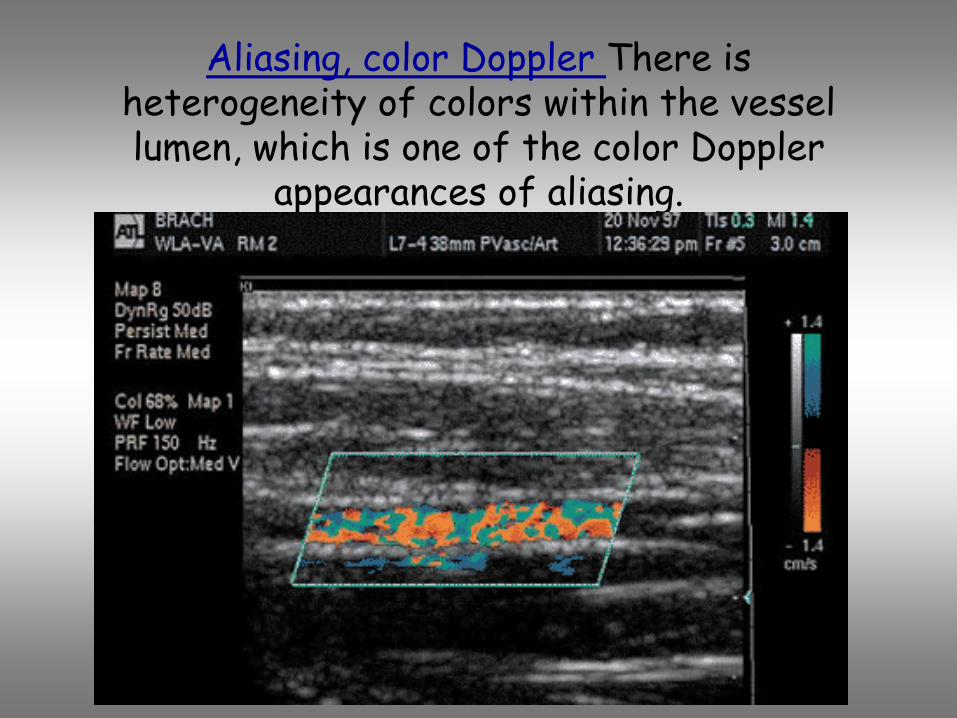
Aliasing, color
Doppler
There
is heterogeneity
of
colors
within
the
vessel
lumen, which
is
one
of
the
color
Doppler appearances
of
aliasing.
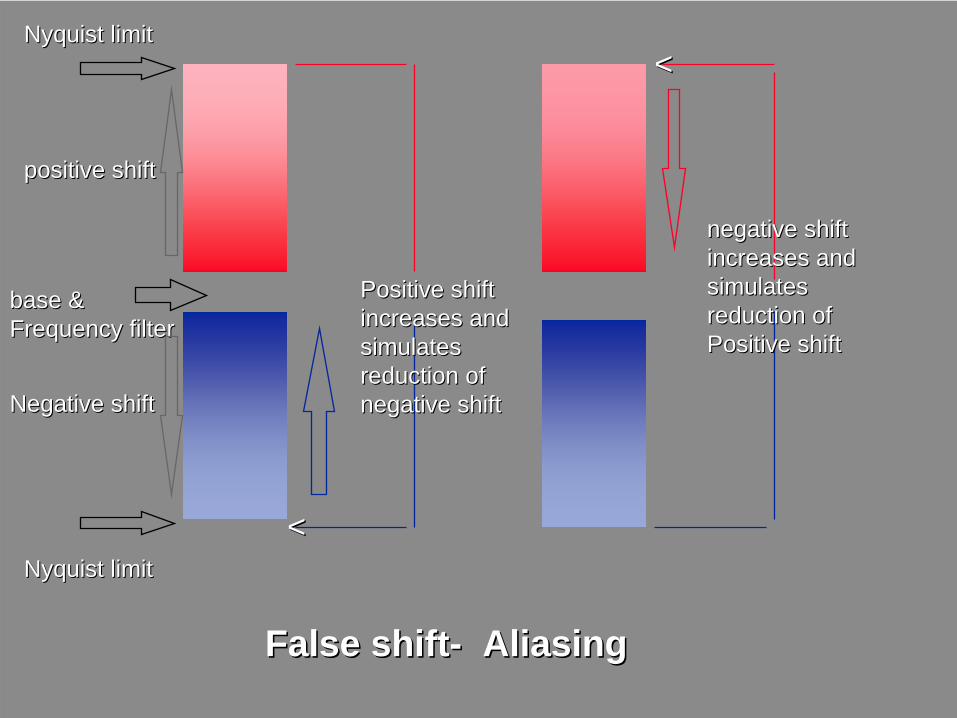
Nyquist Nyquist limitlimit
Nyquist Nyquist limitlimit
basebase &&Frequency filterFrequency filter
positivepositive shiftshift
Negative Negative shiftshift
<<
<<
Positive Positive shiftshiftincreases andincreases andsimulatessimulatesreduction of reduction of negative negative shiftshift
negativenegative shiftshiftincreases andincreases andsimulates simulates reduction ofreduction ofPositive Positive shiftshift
False shiftFalse shift-- AliasingAliasing
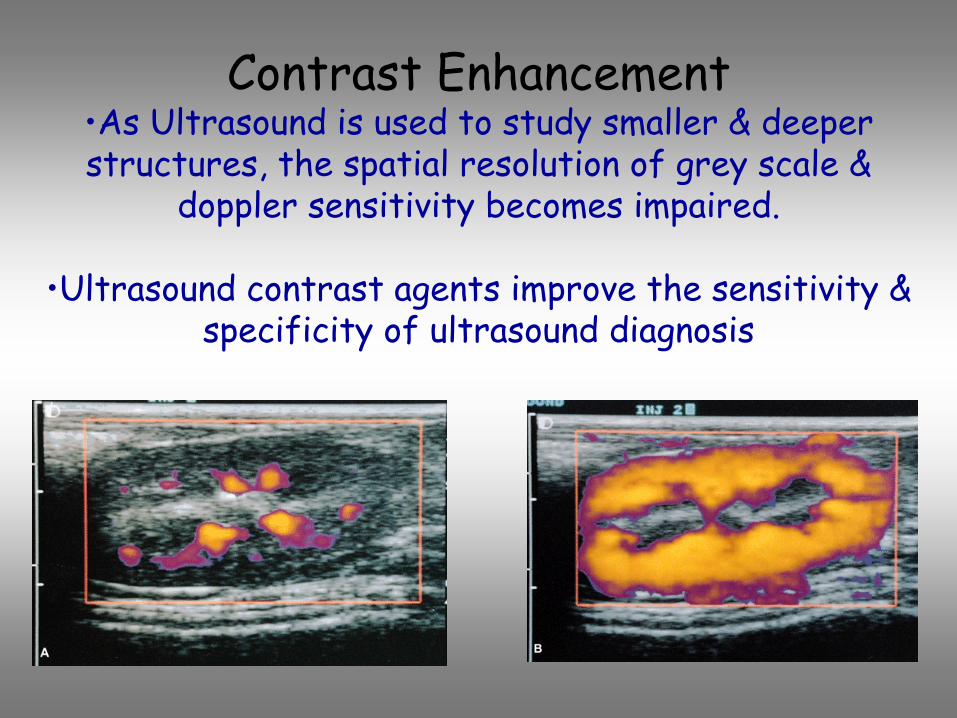
Contrast Enhancement•As Ultrasound is used to study smaller & deeper structures, the spatial resolution of grey scale &
doppler
sensitivity becomes impaired.
•Ultrasound contrast agents improve the sensitivity & specificity of ultrasound diagnosis
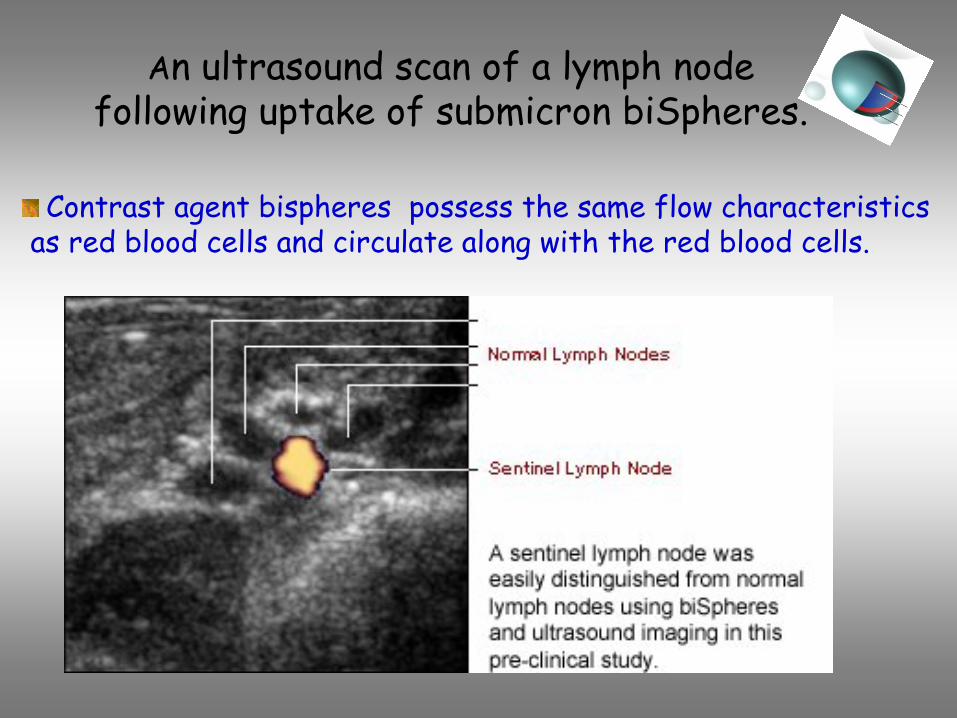
An ultrasound scan of a lymph node following uptake of submicron biSpheres.
Contrast agent bispheres
possess the same flow characteristicsas red blood cells and circulate along with the red blood cells.
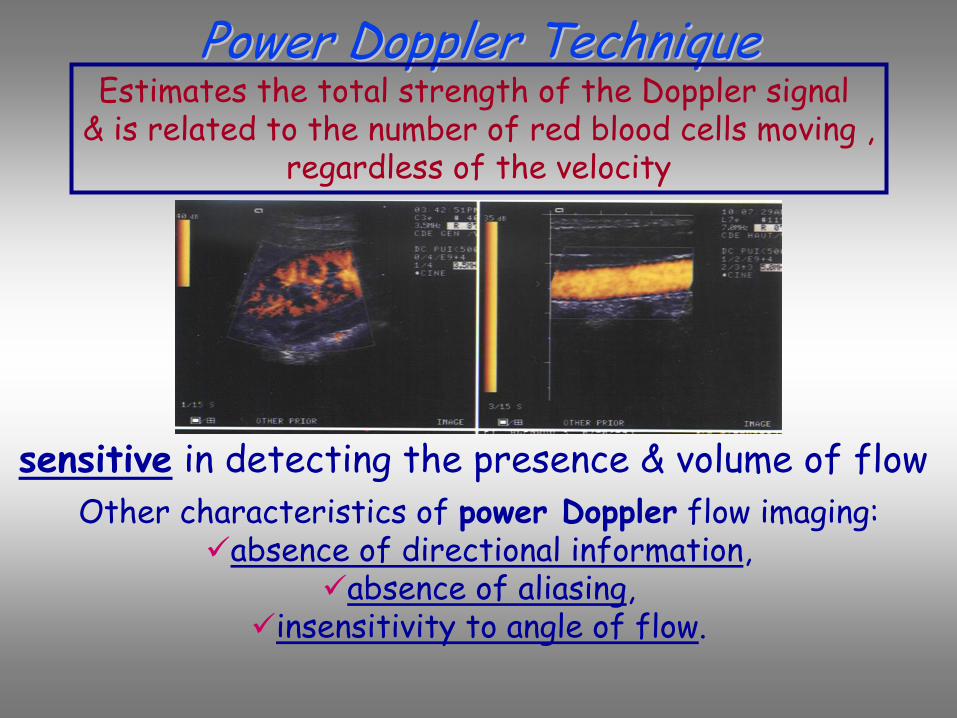
Power Doppler TechniquePower Doppler TechniquePower Doppler Technique
Other characteristics of power Doppler
flow imaging:absence of directional information,
absence of aliasing, insensitivity to angle of flow.
sensitive
in detecting the presence & volume of flow
Estimates the total strength of the Doppler signal & is related to the number of red blood cells moving ,
regardless of the velocity

Imaging of arterial walls degeneration by Imaging of arterial walls degeneration by iintrantravascularvascular transducertransducer
Tissue Characterization Information Tissue Characterization Information appears as different colours` appears as different colours`
ddistributionistribution
vascular wall and atherosclerotic plaques
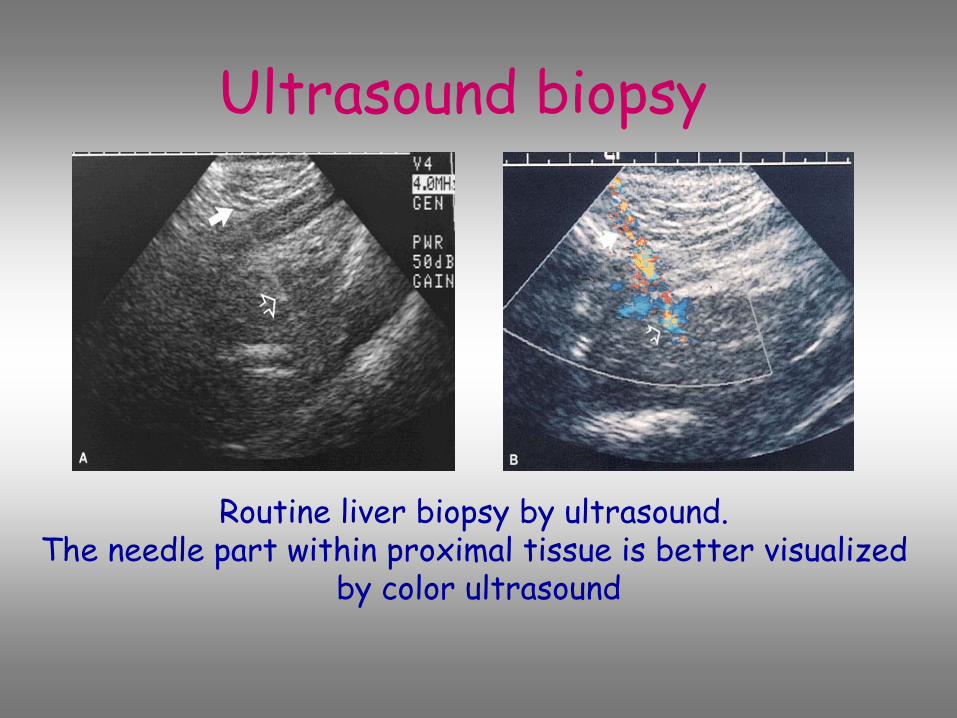
Ultrasound biopsy
Routine liver biopsy by ultrasound. The needle part within proximal tissue is better visualized
by color ultrasound
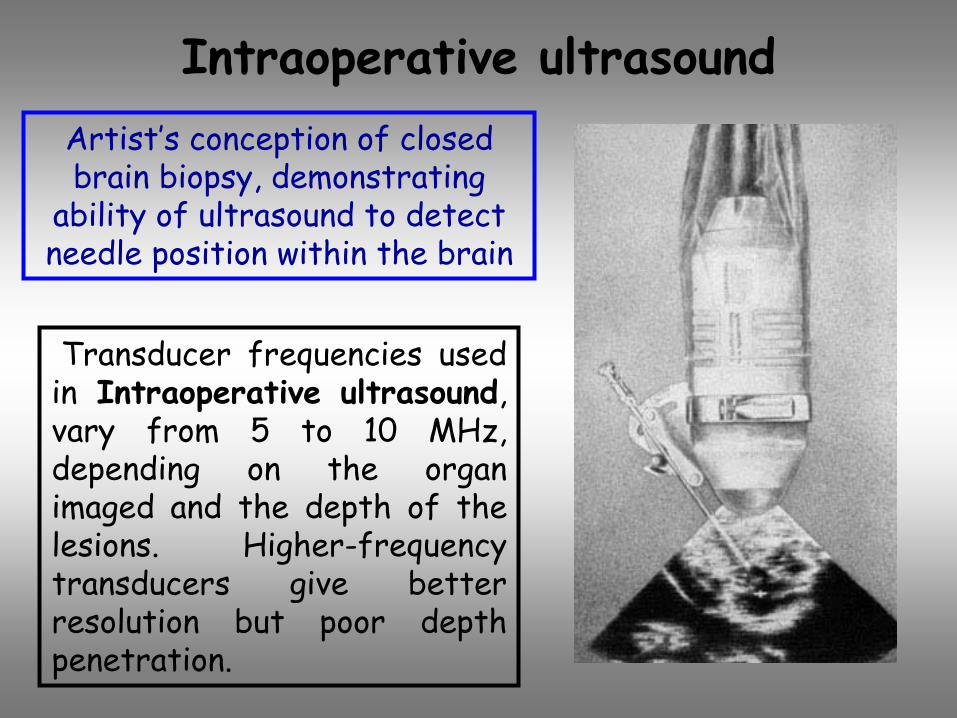
Intraoperative ultrasound
Transducer frequencies used in Intraoperative ultrasound,
vary from 5 to 10 MHz, depending on the organ imaged and the depth of the lesions. Higher-frequency transducers give better resolution but poor depth penetration.
Artist’s conception of closed brain biopsy, demonstrating
ability of ultrasound to detect needle position within the brain
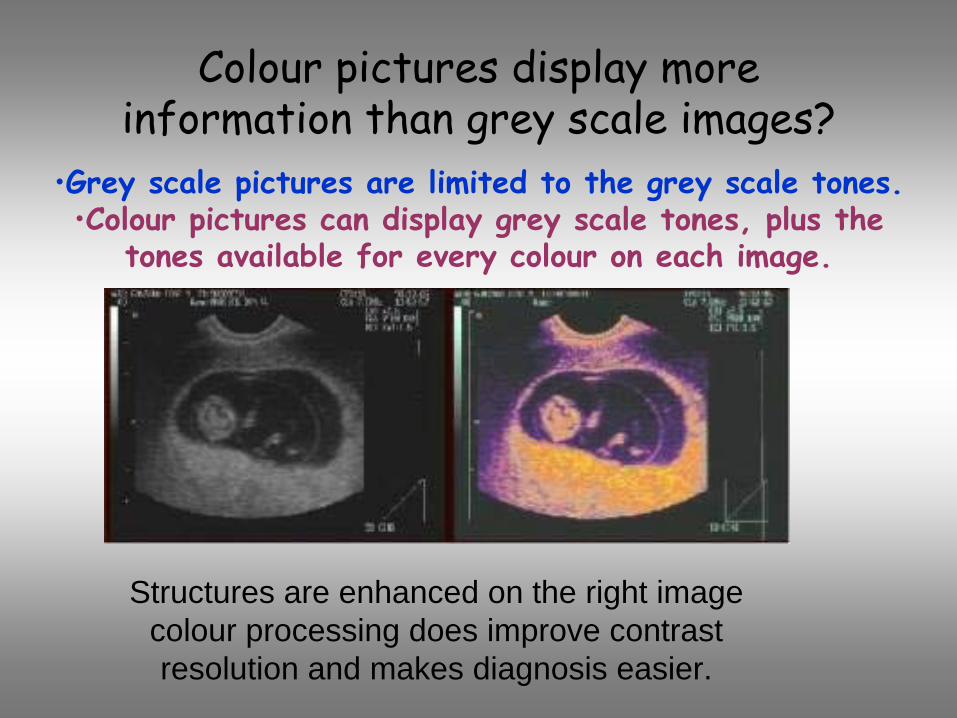
Colour pictures display more information than grey scale images?
•Grey scale pictures are limited to the grey scale tones. •Colour pictures can display grey
scale tones, plus the
tones available for every colour on each
image.
Structures are enhanced on the right imagecolour processing does improve contrast resolution and makes diagnosis easier.
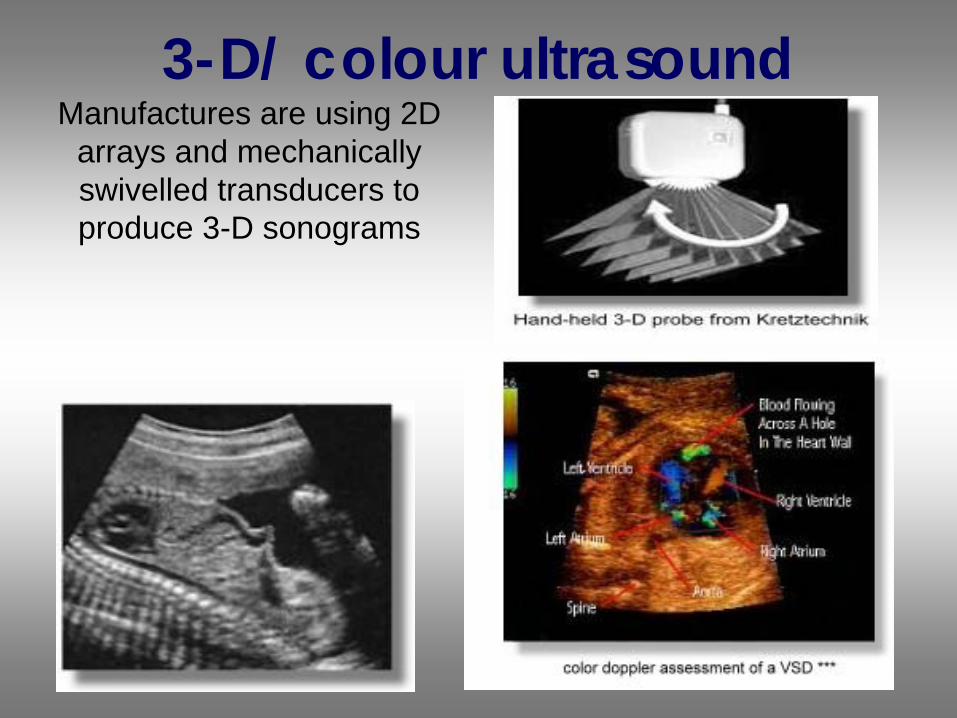
3-D/ colour ultrasoundManufactures are using 2D
arrays and mechanically swivelled transducers to produce 3-D sonograms

Official Statement of theAmerican Institute of Ultrasound in Medicine
SAFETY IN TRAINING AND RESEARCH
Diagnostic ultrasound has been in use since the late 1950's No confirmed adverse biological effects on patients resulting
from this usage have ever been reported.
Maria Lyra