Physics Class XII Practical
42
EXPT NO-01 AIM -To determine resistance per unit length of a given wire by plotting a graph of potential difference versus current. APPARATUS REQUIRED 1. A wire of unknown resistance 2.Battery eliminator 3. Voltmeter , 4.Ammeter , 5. Rheostat, 6.Plug key 7. Connecting wires 8. A piece of sand paper. PRINCIPLE- Ohm's law states that the electric current flowing through a conductoris directly proportional to the potential difference across its ends provided the physical state of the conductor remains unchanged. If I be the current flowing through the conductor and V the potential difference across its ends, then according to Ohm's law V α I and hence V = RI……….(1). where R is the constant of proportionality and is termed as the electrical resistance of the conductor. If V is expressed in volts and I in amperes, then R is expressed in ohms. The resistance R, depends upon the material and dimensions of the conductor. For a wire of uniform cross-section, the resistance depends on the length l and the area of cross-section A. It also depends on the temperature of the conductor. At a given temperature the resistance R = ……… (2) Where ρ is the specific resistance or resistivity and is characteristic of the material of wire. Combining Eqs. (1) and (2) we haveV = I A linear relationship is obtained between V and I, i.e. the graph between V and I will be a straight line passing through the origin as shown in Fig. 1. The slope of the graph is . or R= If l is the length of wire then the resistance per unit length of the wire = . Fig -1 Circuit to find the relation between current (I )and potential difference(v) PROCEDURE 1. The ends of the connecting wires with the help of sand paper are cleaned in order to remove any insulating coating on them. 2. Various components - resistance, rheostat, battery, key, voltmeter ammeter is connected according to the circuit diagram 3. Whether pointers in ammeter and voltmeter coincide with the zero mark on the measuring scale is noted. If it is not so, the pointer is adjusted to coincide with the zero mark by adjusting the screw provided near the base of the needle using a screw driver. 4. The range and least count of the given voltmeter and ammeter is noted. 5. The key K is inserted and the rheostat contact is slided to one of its extreme ends, so thatcurrent passing through the resistance wire is minimum. 6. The ammeter and voltmeter readings are noted. 7. The key K is removed and the wire is allowed to cool, if heated. Again the key is inserted .The rheostat contact is shifted slightly to increase theapplied voltage. The ammeter and voltmeter reading are noted. 8. Step 7 is repeated for four different settings of the rheostat and observations are recorded in a tabular form. OBSERVATIONS 1. Range of ammeter = … 2. Least count of ammeter = ….. 3. Range of voltmeter = …. 4. Least count of voltmeter = …….. 5. Least count of metre scale =……… 6. Length of the given wire, l = … TABULATION FOR RESISTANCE (R) OF THE GIVEN WIRE
-
Upload
trinhkhuong -
Category
Documents
-
view
296 -
download
13
Transcript of Physics Class XII Practical

EXPT NO-01 AIM -To determine resistance per unit length of a given wire by plotting a graph of potential difference versus current. APPARATUS REQUIRED 1. A wire of unknown resistance 2.Battery eliminator 3. Voltmeter , 4.Ammeter , 5. Rheostat, 6.Plug key 7. Connecting wires 8. A piece of sand paper. PRINCIPLE- Ohm's law states that the electric current flowing through a conductoris directly proportional to the potential difference across its ends provided the physical state of the conductor remains unchanged. If I be the current flowing through the conductor and V the potential difference across its ends, then according to Ohm's law V α I and hence V = RI……….(1). where R is the constant of proportionality and is termed as the electrical resistance of the conductor. If V is expressed in volts and I in amperes, then R is expressed in ohms. The resistance R, depends upon the material and dimensions of the conductor. For a wire of uniform cross-section, the resistance depends on the length l and the area of cross-section A. It also depends on the temperature of the conductor. At a
given temperature the resistance R =
……… (2) Where ρ is the specific resistance or resistivity and
is characteristic of the material of wire.
Combining Eqs. (1) and (2) we haveV =
I
A linear relationship is obtained between V and I, i.e. the graph between V and I will be a straight line passing through the origin as shown in Fig. 1.
The slope of the graph is
. or R=
If l is the length of wire then the resistance per unit
length of the wire =
.
Fig -1 Circuit to find the relation between current (I )and potential difference(v) PROCEDURE 1. The ends of the connecting wires with the help of sand paper are cleaned in order to remove any insulating coating on them. 2. Various components - resistance, rheostat, battery, key, voltmeter ammeter is connected according to the circuit diagram 3. Whether pointers in ammeter and voltmeter coincide with the zero mark on the measuring scale is noted. If it is not so, the pointer is adjusted to coincide with the zero mark by adjusting the screw provided near the base of the needle using a screw driver. 4. The range and least count of the given voltmeter and ammeter is noted. 5. The key K is inserted and the rheostat contact is slided to one of its extreme ends, so thatcurrent passing through the resistance wire is minimum. 6. The ammeter and voltmeter readings are noted. 7. The key K is removed and the wire is allowed to cool, if heated. Again the key is inserted .The rheostat contact is shifted slightly to increase theapplied voltage. The ammeter and voltmeter reading are noted. 8. Step 7 is repeated for four different settings of the rheostat and observations are recorded in a tabular form. OBSERVATIONS 1. Range of ammeter = … 2. Least count of ammeter = ….. 3. Range of voltmeter = …. 4. Least count of voltmeter = …….. 5. Least count of metre scale =……… 6. Length of the given wire, l = … TABULATION FOR RESISTANCE (R) OF THE GIVEN WIRE

SL.NO
Applied potential difference
[voltmeter reading V (V)]
Current flowing through the wire
Increasing
1
2
3
4
5
6
CALCULATIONS 1.A graph is ploted between the potential difference across the wire (V) and the current (I) flowing through it as shown in Fig. 2. The slope of the graph is determined. Given wire is then equal to the reciprocal of the slope.
From the graph R =
3. Resistance per unit length of given wire =R/l = ....... RESULT 1. The potential difference across the given wire varies linearly with2. The resistance per unit length of the wire is = (... ... PRECAUTIONS 1. The voltmeter should be connected in parallel and the ammeterbe ensured that current enters at the positive terminal and leaves at the2. The key should be inserted only while taking observations, asunnecessary heating of the wire. 3. Zero error in measuring instruments (voltmeter, ammeter, metreof and should be eliminated in case of ammeter and voltmeter by adjusting the pointer withthe screw provided at the base of the needle, using aSOURCES OF ERROR 1. The wire used may not be of uniform area of cross2. The length of the resistance wire measured should be betweenother. The lengths of ends wound around the terminals of voltmeter, if included, would give errormeasured length. DISCUSSION A resistor obeys Ohm’s law. However, not aetc. These are called non ohmic resistances.
……………………………………..
Current flowing through the wire [ammeter reading I (A)]
Resistane (R)=V/I Increasing (V) Decreasing (V)
Mean (I)
A graph is ploted between the potential difference across flowing through it as shown in Fig.
determined. The resistance of the wire is then equal to the reciprocal of the slope.
. Resistance per unit length of given wire =R/l = ....... Ω cm-1
Graph between current I and potential difference, V
1. The potential difference across the given wire varies linearly with the current. . The resistance per unit length of the wire is = (... ... Ω cm-1).
1. The voltmeter should be connected in parallel and the ammeter in series with the circuit. It should at the positive terminal and leaves at the negative terminal.
2. The key should be inserted only while taking observations, as excessive flow of current causes
3. Zero error in measuring instruments (voltmeter, ammeter, metre scale) must be taken cognizance case of ammeter and voltmeter by adjusting the pointer with
the screw provided at the base of the needle, using a screw driver.
1. The wire used may not be of uniform area of cross-section. of the resistance wire measured should be between one terminal of voltmeter and the
around the terminals of voltmeter, if included, would give error
A resistor obeys Ohm’s law. However, not all conducting devices obey Ohm's law e.g. diode, thyristor resistances.
……………………………………..
Resistane (R)=V/I
(Ω)
Mean resistance
(Ω )
Graph between current I and potential difference, V
in series with the circuit. It should negative terminal.
excessive flow of current causes
scale) must be taken cognizance case of ammeter and voltmeter by adjusting the pointer with the help of
one terminal of voltmeter and the around the terminals of voltmeter, if included, would give error in
obey Ohm's law e.g. diode, thyristor

D.A.V. PUBLIC SCHOOL MCL,KA
AIM-To determine the resistance of a given wire using a metre bridge andresistivity of the material of the wire. APPARATUS REQUIRED (1) Metre bridge, (2) Un known resistance wire determined), (3) a resistance box, (4) (8) a cell or battery eliminator,(9) thick connecting wires,THEORY---
Fig-1 A Metre bridgeA metre bridge works on the principle of Wheatstone’s bridge. As shownresistors P, Q, R and S connected in theformconnected to two terminals of a cell through a key Kto a sensitive galvanometer G through a key K
balance condition for Wheatstone’s bridge is
null point. In this condition;
=
, OR
Because for a wire of uniform cross-sectional area, resistance isknowing and R, and using the working formula,
The specific resistance or resistivity ρ
Where S is the resistance of the wire of length PROCEDURE 1. The average diameter and hence the radius 2. The insulation at the ends of connecting wires the resistance box (R ) is tightened3. The circuit is set up as shown in Fig.4. Next, some resistance R is introduceJ is brought in contact with terminal the galvanometer gets deflected in each the wire for a fraction of a second. If the galvanometer shows deflectionmark for these two points of contactnot so, resistance R is adjusted so that the null pointsay, between 30 cm and 70 cm. 5. If there is one-sided deflection, the circuit 6. Step 4 is repeated five different values of resistance 7. The position of the resistances S and five values of R with same length of wire of resistance offered by terminals.
R
R
P
A
G
D
D.A.V. PUBLIC SCHOOL MCL,KA
EXPT NO--02 the resistance of a given wire using a metre bridge and hence determine the
Un known resistance wire (of material whose specific resistance is to be (4) a rheostat,(5) galvanometer, (6) a jockey, thick connecting wires,(10) sand paper, (11) screw gauge.
Metre bridge Fig.2 The Wheatstone’s bridgeA metre bridge works on the principle of Wheatstone’s bridge. As shown in Fig.2, it consists of four
connected in theform of a network ABCD. The terminals A and C are terminals of a cell through a key K1. Terminals B and D are connected
to a sensitive galvanometer G through a key K2.If there is no deflection in the galvanometer
Wheatstone’s bridge is
=
, when the jockey is kept at a point B
! "
! "# =
, OR
/
%&''( )/ =
, OR
sectional area, resistance is proportional to length. Thus, working formula, unknown resistance S can be determined.
ρof the material of the given wire is ρ= S
is the resistance of the wire of length L & r being the radius.
and hence the radius of the wire is found with a screw gauge. he insulation at the ends of connecting wires is cleaned with a piece of sand paper. A
) is tightened by pressing each plug. is set up as shown in Fig.1 with unknown resistance wire of known length in right gap
introduced in the circuit from the resistance box in left gap. T A first and then with terminal C. The direction in
galvanometer gets deflected in each case is noted. Provided the jockey remains in contact with wire for a fraction of a second. If the galvanometer shows deflection on both sides of its zero
these two points of contact of the jockey, null point will be somewhere on the wire AC. Ifso that the null point is somewhere in the middle of the wire AC,
sided deflection, the circuit is checked again, especially junctions, for their continuity.different values of resistance R.
and R are interchanged and steps 4 to 6 is repeatsame length of wire of resistance S is now in the left gap to avoid the
Q
C B
D
K
s
hence determine the
resistance is to be (7) one-way key,
screw gauge.
The Wheatstone’s bridge .2, it consists of four
of a network ABCD. The terminals A and C are . Terminals B and D are connected
.If there is no deflection in the galvanometer G, then
jockey is kept at a point B called the
OR
proportional to length. Thus, can be determined.
= S
* OR
with a screw gauge. sand paper. All plugs of
nce wire of known length in right gap . resistance box in left gap. The jockey
he direction in which pointer of is noted. Provided the jockey remains in contact with
on both sides of its zero of the jockey, null point will be somewhere on the wire AC. If it is
the middle of the wire AC,
junctions, for their continuity.
repeated for the same in the left gap to avoid the resistance
S = %&''()
R
+=S ,-
.

OBSERVATIONS 1. Length of the wire of unknown resistance, L = ……….cm 2. Measurement of diameter of wire of unknown resistance (a)Least count of the screw gauge (L.C.) = …….cm (b)Zero error of the screw gauge(e) =………cm (c )Zero correction of the screw gauge(c ) = ………….cm Tabulation for Diameter of Wire
Sl. No.
Reading along one direction Reading along mutually perpendicular direction Mean
Diameter in cm
d= /&0/-
-
Linear scale reading (N) in
cm
Coinciding circular scale
division (n)
Diameter (d1) in cm
d1 =N + (n x L.C.)
Linear scale reading (N’)
in cm
Coinciding circular scale division(n′)
Diameter (d1) in cm
d2 =N’ + (n’ x L.C.)
1 2
3 Mean diameter (corrected for zero error) = d+c = ... ….cm
Radius of wire r = 1
2 = ... ….. .cm
Tabulation for Unknown resistance (S)
Sl. No.
Resis
tan
ce R
in
Ω
S in the right gap S in the left gap
S= &3-
-
in Ω
Mean S in Ω
Po
sit
ion
of
bala
nce
po
int
B in
cm
Bala
ncin
g
len
gth
A
B (
l) in
cm
Len
gth
BC
= (
100 –
l)
in c
m
& = (&''()
R
in Ω
Po
sit
ion
of
bala
nce
po
int
B′ in
cm
Bala
ncin
g
len
gth
A
B′ (l′)
in
cm
B′C
= (
100–
l′)
in
cm
S 2 = 4
&''(4R
in Ω
1
2
3
4
5
CALCULATIONS (a) L = …….cm =…….m (b) r = ... ..cm =………m (c) S = ………….. Ω
Substituting these values in ρ =S ,-
. =
The calculated value of ρ =......... ohm-m. RESULT 1. The unknown resistance of the given wire is found to be S = ... ... Ω
2. The resistivity of the material of the wire is ρ= ... ... Ω m.
PRECAUTIONS1. All the connections and plugs should be tight. 2. Jockey should be moved gently over the metre bridge wire. 3. The plug in the key (K1) should be inserted only at the time of taking observations. 4. Null points should be in the middle of the wire (30 cm to 70 cm). SOURCES OF ERROR 1. The metre bridge wire may not be of uniform area of cross-section. 2. Effect of end resistances due to copper strips, connecting screws,may affect the measurement. 3. The length l of the wire should not include the lengths below the terminals when placed in gap. 4. The resistances of end pieces/metal strips may not be negligible. The error introduced by it can be reduced by interchanging the known and unknown resistances in gaps.
5. The length measurements l and l′ may have error if the metre bridge wire is not taut and along the scale in the metre bridge. 6. Galvanometer pointer is expected to be at zero when no current flows through it. However, many times it is observed
that it is not so. In such cases, pointer has to be adjusted to zero by gently moving the screw below the scale with the help of a screw driver .Other wise null point must be obtained by tapping the jockey on the wire.
……………………………………..

AIM-. To verify the laws of combination seriesAPPARATUS REQUIRED (1 ) Metre bridge, (2) Two resisters(X1 & X2), (3) A resistance box, (4) A rheostat, (5) Galvanometer, (6) A jockey, (7) One-way key, (8) A cell or battery eliminator, (9) Thick connecting wires, (10) Sand paper, (11) Screw gauge. THEORY---
A metre bridge works on the principle of Wheatstone’s bridge. As shownresistors P, Q, R and X connected in theconnected to two terminals of a cell through a key Kto a sensitive galvanometer G through a key K
If there is no deflection in the galvanometer G, then balance condition
=
5 , when the jockey is kept at a point B
R
P
A
R
G
D
P
B A
R
R
FIG-B
EXPT NO--03 of combination series of resistances using a metre bridge.
A metre bridge works on the principle of Wheatstone’s bridge. As shown in Fig.Aconnected in the form of a network ABCD. The terminals A and C are
terminals of a cell through a key K1. Terminals B and D are connectedto a sensitive galvanometer G through a key K2.
there is no deflection in the galvanometer G, then balance condition for Wheatstone’s bridge is
jockey is kept at a point B called the null point. In this condition;
FIG-A
C
K
Q
G
B
D
X1 X2
Q
C
K
X1
P
A
R
R
FIG-C
FIG-D
of resistances using a metre bridge.
in Fig.A, it consists of four form of a network ABCD. The terminals A and C are
. Terminals B and D are connected
Wheatstone’s bridge is
point. In this condition;
G
D
B
Q
C
K
X2
C
=
5 , OR
! "
! "# =
5 , OR
/
(&''( )/ =
5 , OR X =
(&''()
R
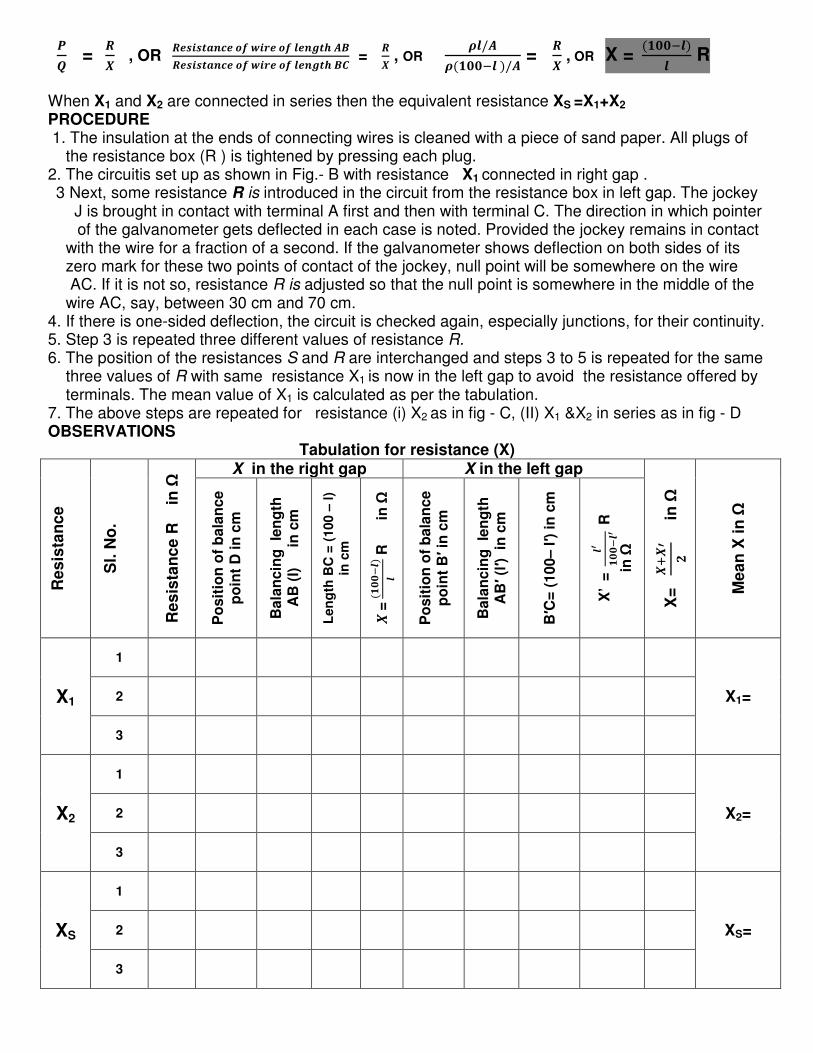
When X1 and X2 are connected in series then the equivalent resistance XS =X1+X2
PROCEDURE
1. The insulation at the ends of connecting wires is cleaned with a piece of sand paper. All plugs of the resistance box (R ) is tightened by pressing each plug. 2. The circuitis set up as shown in Fig.- B with resistance X1 connected in right gap . 3 Next, some resistance R is introduced in the circuit from the resistance box in left gap. The jockey J is brought in contact with terminal A first and then with terminal C. The direction in which pointer of the galvanometer gets deflected in each case is noted. Provided the jockey remains in contact
with the wire for a fraction of a second. If the galvanometer shows deflection on both sides of its zero mark for these two points of contact of the jockey, null point will be somewhere on the wire AC. If it is not so, resistance R is adjusted so that the null point is somewhere in the middle of the wire AC, say, between 30 cm and 70 cm. 4. If there is one-sided deflection, the circuit is checked again, especially junctions, for their continuity. 5. Step 3 is repeated three different values of resistance R. 6. The position of the resistances S and R are interchanged and steps 3 to 5 is repeated for the same three values of R with same resistance X1 is now in the left gap to avoid the resistance offered by terminals. The mean value of X1 is calculated as per the tabulation. 7. The above steps are repeated for resistance (i) X2 as in fig - C, (II) X1 &X2 in series as in fig - D OBSERVATIONS
Tabulation for resistance (X)
Re
sis
tan
ce
Sl.
No
.
Re
sis
tan
ce
R
in Ω
X in the right gap X in the left gap
X=
5
35
6
-
i
n Ω
Me
an
X i
n Ω
Po
sit
ion
of
bala
nce
po
int
D i
n c
m
Bala
ncin
g le
ng
th
AB
(l)
in
cm
Len
gth
BC
= (
100 –
l)
in c
m
5 =
(&'
'(
)
R
in
Ω
Po
sit
ion
of
bala
nce
po
int
B′ in
cm
Bala
ncin
g le
ng
th
AB′ (l′)
in
cm
B′C
= (
100– l′)
in
cm
X’
=
4
&'
'(
4 R
in Ω
X1
1
X1= 2
3
X2
1
X2= 2
3
XS
1
XS= 2
3

CALCULATION 1. The known resistance of the 1st resistor is X’1 = ... ... Ω
2. The resistance of the 1st resistor is found to be X1 = ... ... Ω
3. The error in the resistance of 1st
resistor is ∆∆∆∆X1=……….Ω
4. The known resistance of the 2nd resistor is X’2 = ... ... Ω
5. The resistance of the 2nd resistor is found to be X2 = ... ... Ω
6. The error in the resistance of 2nd
resistor is ∆∆∆∆X2=……….Ω
7. The calculated equivalent resistance of series combination is X’s =X1 + X2 = ... ... Ω
8. The measured equivalent resistance of series combination is XS = ...................... Ω
9. The error in the equivalent resistance of series combination is ∆ XS =………………………….Ω
RESULT 1 The equivalent resistance of series combination is to be X’s = ... ... Ω, but the measured
equivalent resistance of series combination is XS = ...................... Ω ,with error in the
equivalent resistance of series combination is ∆ XS =………………………….Ω. As the measured value is nearly equal to the calculated value, hence the law of series combination is verified. PRECAUTIONS
1. All the connections and plugs should be tight.
2. Jockey should be moved gently over the metre bridge wire.
3. The plug in the key (K1) should be inserted only at the time of taking observations.
4. Null points should be in the middle of the wire (30 cm to 70 cm).
SOURCES OF ERROR
1. The metre bridge wire may not be of uniform area of cross-section.
2. Effect of end resistances due to copper strips, connecting screws, may affect the measurement.
3. The resistances of end pieces/metal strips may not be negligible. The error introduced by it can be
reduced by interchanging the known and unknown resistances in gaps.
4. The length measurements l and l′ may have error if the metre bridge wire is not taut and along the
scale in the metre bridge.
6. Galvanometer pointer is expected to be at zero when no current flows through it. However, many
times it is observed that it is not so. In such cases, pointer has to be adjusted to zero by gently
moving the screw below the scale with the help of a screw driver. Otherwise null point must be
obtained by tapping the jockey on the wire.
…………………………………….

AIM-. To verify the laws of combination parallel APPARATUS REQUIRED (1 ) Metre bridge, (2) Two resisters(X1 & X2), (3) A resistance box, (4) A rheostat, (5) Galvanometer, (6) A jockey, (7) One-way key, (8) A cell or battery eliminator, (9) Thick connecting wires, (10) Sand paper, (11) Screw gauge. THEORY---
A metre bridge works on the principle of Wheatstone’s bridge. As shownresistors P, Q, R and X connected in theconnected to two terminals of a cell through a key Kto a sensitive galvanometer G through a key K
If there is no deflection in the galvanometer G, then balance condition
=
5 , when the jockey is kept at a point B
G
D
P
B A
R
R
A
FIG-B
EXPT NO--04
the laws of combination parallel of resistances using a metre bridge.
A metre bridge works on the principle of Wheatstone’s bridge. As shown in Fig.Aconnected in the form of a network ABCD. The terminals A and C are
terminals of a cell through a key K1. Terminals B and D are connectedto a sensitive galvanometer G through a key K2.
there is no deflection in the galvanometer G, then balance condition for Wheatstone’s bridge is
jockey is kept at a point B called the null point. In this condition;
FIG-A
Q
C
K
X1
P
A
R
R
G
D
P
B
Q
C
K
R
R
X1
X2
FIG-C
FIG-D
of resistances using a metre bridge.
in Fig.A, it consists of four form of a network ABCD. The terminals A and C are
. Terminals B and D are connected
for Wheatstone’s bridge is
point. In this condition;
G
D
B
Q
C
K
X2
C

=
5 , OR
! "
! "# =
5 , OR
/
(&''( )/ =
5 , OR X =
(&''()
R
When X1 and X2 are connected in parallel then the equivalent resistance XP = 7&7-
7&3 7-
PROCEDURE
1. The insulation at the ends of connecting wires is cleaned with a piece of sand paper. All plugs of the resistance box (R ) is tightened by pressing each plug. 2. The circuitis set up as shown in Fig.- B with resistance X1 connected in right gap . 3 Next, some resistance R is introduced in the circuit from the resistance box in left gap. The jockey J is brought in contact with terminal A first and then with terminal C. The direction in which pointer of the galvanometer gets deflected in each case is noted. Provided the jockey remains in contact
with the wire for a fraction of a second. If the galvanometer shows deflection on both sides of its zero mark for these two points of contact of the jockey, null point will be somewhere on the wire AC. If it is not so, resistance R is adjusted so that the null point is somewhere in the middle of the wire AC, say, between 30 cm and 70 cm. 4. If there is one-sided deflection, the circuit is checked again, especially junctions, for their continuity. 5. Step 3 is repeated three different values of resistance R. 6. The position of the resistances S and R are interchanged and steps 3 to 5 is repeated for the same three values of R with same resistance X1 is now in the left gap to avoid the resistance offered by terminals. The mean value of X1 is calculated as per the tabulation. 7. The above steps are repeated for resistance (i) X2 as in fig - C, (II) X1 &X2 in series as in fig - D OBSERVATIONS
Tabulation for resistance (X)
Re
sis
tan
ce
Sl.
No
.
Re
sis
tan
ce
R
in Ω
X in the right gap X in the left gap
X=
5
35
6
-
in Ω
Me
an
X
in Ω
Po
sit
ion
of
bala
nce p
oin
t B
in
cm
Bala
ncin
g
len
gth
AB
(l)
in c
m
Len
gth
BC
= (
100
– l)
in c
m
5 =
(&'
'(
)
R
in Ω
Po
sit
ion
of
bala
nce p
oin
t B′
in c
m
Bala
ncin
g
len
gth
AB′ (l′)
in
cm
B′C
= (
100– l′)
in
cm
X’
=
4
&'
'(
4 R
in Ω
X1
1
X1= 2
3
X2
1
X2= 2
3
XS
1
XS= 2
3
XP
1
XP= 2
3

CALCULATION 1. The known resistance of the 1st resistor is X’1 = ... ... Ω
2. The resistance of the 1st resistor is found to be X1 = ... ... Ω
3. The error in the resistance of 1st
resistor is ∆∆∆∆X1=……….Ω
4. The known resistance of the 2nd resistor is X’2 = ... ... Ω
5. The resistance of the 2nd resistor is found to be X2 = ... ... Ω
6. The error in the resistance of 2nd
resistor is ∆∆∆∆X2=……….Ω
7. The calculated equivalent resistance of parallel combination is X’P = 7&7-
7&3 7- = …... ……Ω
8. The measured equivalent resistance of parallel combination is XP = …………….Ω
9. The error in the equivalent resistance of parallel combination is ∆ XP =………….………… Ω
RESULT 1. The equivalent resistance of parallel combination is to be X’s = ... ... Ω, but the measured
equivalent resistance of parallel combination is XS = ...................... Ω ,with error in the
equivalent resistance of parallel combination is ∆ XS =………………………….Ω. As the measured value
is nearly equal to the calculated value, hence the law of parallel combination is verified. PRECAUTIONS 1. All the connections and plugs should be tight.
2. Jockey should be moved gently over the metre bridge wire.
3. The plug in the key (K1) should be inserted only at the time of taking observations.
4. Null points should be in the middle of the wire (30 cm to 70 cm).
SOURCES OF ERROR
1. The metre bridge wire may not be of uniform area of cross-section.
2. Effect of end resistances due to copper strips, connecting screws, may affect the measurement.
3. The resistances of end pieces/metal strips may not be negligible. The error introduced by it can be
reduced by interchanging the known and unknown resistances in gaps.
4. The length measurements l and l′ may have error if the metre bridge wire is not taut and along the
scale in the metre bridge.
6. Galvanometer pointer is expected to be at zero when no current flows through it. However, many
times it is observed that it is not so. In such cases, pointer has to be adjusted to zero by gently
moving the screw below the scale with the help of a screw driver. Otherwise null point must be
obtained by tapping the jockey on the wire.
……………………………………..

EXPT NO—05
AIM -To compare the e.m.f of two given primary cells using a potentiometer.
APPARATUS REQUIRED
(1)Potentiometer (2) Leclanche cell (3) Daniel cell (4) an miliammeter /ammeter (5) One one way
plug key (6) one two way plug key(7) galvanometer (8) A high resistance box (HRB) (about 0-10 k Ω)
(9) A rheostat (10) jockey (11) Battery eliminator (12) connecting wires.
THEORY
The potential drop between any two part of resistor of uniform cross sectional area carrying constant
current is directly proportional to the length of the resistor between that parts
ℰ α ℓ or ℰ=k ℓ (Where k is potential per unit length)
If l1 and l2 are the distances of the balance null point from end A of the potentiometer for primary cells
of emf ℰ1andℰ2 respectively then
J1α ℓ1 and J 2 α l2 KL M&
M- =
N&
N-
Fig. 1 Circuit to compare emf of two primary cells using a potentiometer PROCEDURE 1. Different electrical components are connected as shown in the circuit .
2. After checking the circuit connections, key K1 , K2 are closed and K3 open and with a protective
high resistance P from the R BOX, the position of the balance point is found for ℰ1. For final reading,
the resistance P is short circuited by closing the key of HRB and the balance length ℓ1 is noted.
3 Now Keeping the readings in the ammeter constant (as in step 2) key K1, K3 are closed and K2 open
and with a protective high resistance P from the R BOX, the position of the balance point is found for
ℰ2.For final reading, the resistance P is short circuited by closing the key of HRB and the balance
length ℓ2 is noted.
4. Changing the readings in the ammeter by shifting the contact point of rheostat step- 2&3 are
repeated to obtained four more observation are taken for ℓ1and ℓ2 .
A
E
E2
E1
G HRB
K2
K3
N2 N1 +
A
K1
-
Rh B

OBSERVATIONS Tabulation for balancing length ℓ
SL.NO Current
in mA/A
ℓ1 in cm ℓ2 in cm
M&
M- =
N&
N-
Mean
M&
M-
1 2 Mean ℓ1 1 2 Mean ℓ2
1
2
3
4
5
RESULT
By calculation from tabulation M&
M- = ...............
PRECAUTIONS 1. The primary cells whose emf is to be compared should not be disturbed during the experiment or else its internal resistance may change. 2. The emf of battery E should be more than the emf of the primary cell, E1. 3. Positive terminals of E and E1 both should be connected at the same point on the potentiometer. 4. Always length is measured from point A i.e. the point at which positive terminals of battery are connected and measure this length up to the balance point. 5. Insert K1 and K2 only when readings are taken otherwise the wires may get heated up due to continuous flow of current and may also affect the internal resistance of the cell. SOURCES OF ERROR 1. Potentiometer wire may not be of uniform cross - section. 2. Brass strips at the ends may have a finite resistance. 3.Emf of the auxiliary battery producing the drop of potential along the wire may not be constant throughout the course of the experiment. 4. Heating of the potentiometer wire by current may introduce some error. DISCUSSION 1. The theory of potentiometer assumes that there is a steady current in wire AB during the period of experiment. Therefore, emf of the accumulator should be constant during the course of the experiment.
2. The position of the jockey can be read within the least count of the measuring scale ±0.1cm.
Moreover, the edge of the jockey may further limit this least count. It is therefore advised to use a sharp edged jockey. 3. There may also be a zero error in the measurement of ℓ, due to the end of the scale not being exactly at the end of the wire.
…………………………………….

EXPT NO--06 AIM -To determine the internal resistance of a given primary cell using a potentiometer. APPARATUS REQUIRED (1)Potentiomete (2) Leclanche cell (3)an miliammeter (4) one resistance box (RB)(about 0-50 Ω) (5) One one way plug key (6) one two way plug key (7) galvanometer (8) Battery eliminator (9) A high resistance box (HRB) (about 0-10 k Ω ) (10) A rheostat (11) jockey (12)connecting wires. THEORY When a resistance R is connected across a cell of emf E and internal resistance r, then the current I
in the circuit is O =P
3Q.The potential difference V (= RI) across the two terminals of the cell is
V = P
3Q Thus r = (
P
R- -1) R
If l1 and l2are the distances of the balance null point from end A ofthe potentiometer for an open and a
closed circuit respectively (Fig), then E α l1and V α l2 KL P
R =
2.
r = ( &
---1) R
Fig. Circuit to measure internal resistance of a primary cell using a potentiometer PROCEDURE 1. Different electrical components are connected as shown in the circuit (Fig.).After checking the circuit connections ,key K1 and K2 is closed. 2. With key K3 open and a protective high resistance P from the HR B, the position of the Balance point is found. For final reading, the resistance P is short circuited by closing the keys of HRB and the balance length ℓ1is noted. 3. R = 10 Ω is taken (from R.B), the key K3 is closed and quickly the new balance length ℓ2 is measured and K3 is open as soon as this has been done. 4. Keeping the readings in the ammeter constant throughout the above observation the balance
length l2 is obtained by reducing the value of R in equal steps of 1 Ω for each value of R 5. At the end of the experiment, by opening key K3 and repeating step 2, ℓ1again found.
A
E
RB
E1
G HRB
K2
K3
N2 N1 +
A
K1
-
Rh B

OBSERVATIONS ℓ1= ... cm (in the beginning of the experiment) ℓ1=…. cm (at the end of the experiment) Mean ℓ1 = ... cm. Tabulation for balancing length ℓ2
SL.NO R in Ω ℓ2in cm
r = ( &
---1) R
in Ω
Mean r in Ω
1
2
3
4
5
6
RESULT By calculation r = ... Ω PRECAUTIONS 1. The primary cell whose internal resistance is to be determined should not be disturbed during the experiment or else its internal resistance may change. 2. The emf of battery E should be more than the emf of the primary cell, E1. 3. Positive terminals of E and E1 both should be connected at the same point on the potentiometer. 4. Always length is measured from point A i.e. the point at which positive terminals of battery are connected and measure this length up to the balance point. 5. Insert K1 and K2 only when readings are taken otherwise the wires may get heated up due to continuous flow of current and may also affect the internal resistance of the cell. SOURCES OF ERROR 1. Potentiometer wire may not be of uniform cross - section. 2. Brass strips at the ends may have a finite resistance. 3.Emf of the auxiliary battery producing the drop of potential along the wire may not be constant throughout the course ofthe experiment. 4. Heating of the potentiometer wire by current may introduce some error. DISCUSSION 1. The theory of potentiometer assumes that there is a steady current in wire AB during the period of experiment. Therefore, emf of the accumulator should be constant during the course of the experiment.
2. The position of the jockey can be read within the least count of the measuring scale ±0.1cm.
Moreover, the edge of the jockey may further limit this least count. It is therefore advised to use a sharp edged jockey. 3. There may also be a zero error in the measurement of l, due to the end of the scale not being exactly at the end of the wire.
…………………………………….

AIM- To determine the resistance of a galvanometer by halfAPPARATUS REQUIRED
(1) A moving coil galvanometer (2) A battery eliminator (0 - 6 V),
(3) one resistance box (RBOX- 1) of range 0
(4) one resistance box(RBOX- 2) of range 0 (5) two one way keys, (6) voltmeter, (7) connecting wires and a piece of sand paper.THEORY Fig.. Circuit for finding resistance of galvanometerGalvanometer Galvanometer is a sensitive device used to detect very lowprinciple that a coil placed in a uniform magnetic fieldset up in it. When a coil carrying current
deflection θθθθ which is related to as I = kfigure of merit of the galvanometer.
When a resistance R is introduced in the circuit, the current
In this case, the key K2 is kept open. galvanometer whose resistance is to
If the current Ig produces a deflection
Combining we get k=P
% 3S)θ……………(1)
On keeping both the keys K1 and K2 deflection of the galvanometer needle becomes half of its initial value, then the resistance of
galvanometer G =
( …………….(2)
PROCEDURE 1. The connecting wires are cleaned with sand
per the circuit diagram (Fig.).
2. From the high resistance box is closed. The resistance R from this resistance box is adjusted to get full scale deflection on the galvanometer .The values of resistance,
EXPT NO--07
To determine the resistance of a galvanometer by half-deflection method and to find its figure of
1) of range 0 - 10 kΩ,
2) of range 0 - 200 Ω,
wires and a piece of sand paper.
Circuit for finding resistance of galvanometer
device used to detect very low current. Its working is based onin a uniform magnetic field experiences a torque when an
set up in it. When a coil carrying current I is placed in a radial magnetic field ,the coil experiences a
I = kθ where k is a constant of proportionality and is termed a.
is introduced in the circuit, the current Ig flowing through it is given by
is kept open. Here E is the emf of battery ,G is the resistance of the galvanometer whose resistance is to be determined.
produces a deflection θ in the galvanometer, then we get Ig = kθ
……………(1)
closed and by adjusting the value of shunt resistance deflection of the galvanometer needle becomes half of its initial value, then the resistance of
…………….(2)
are cleaned with sand paper and a neat and tight connection is made as
(R.BOX- 1) (1-10 kΩ), 5 kΩ key is removed and then the key Kfrom this resistance box is adjusted to get full scale deflection on
The values of resistance, R and deflection θ are recorded.
ethod and to find its figure of merit.
current. Its working is based on the experiences a torque when an electric current is
,the coil experiences a
is a constant of proportionality and is termed as
through it is given by Ig=P
3S.
is the resistance of the
θ
closed and by adjusting the value of shunt resistance S, if the deflection of the galvanometer needle becomes half of its initial value, then the resistance of
paper and a neat and tight connection is made as
key is removed and then the key K1 from this resistance box is adjusted to get full scale deflection on
are recorded.

3. The key K2 is inserted and keeping R fixed the value of shunt resistance S is adjusted to get
the deflection in the galvanometer which is exactly half of θ.The value of S is noted down and then key K2 is removed.
4. A sets of five observations is taken by repeating steps 2 and 3 so that θ is even number of
divisions and the observations for R ,S and θ is recorded in tabular form. 5. The galvanometer resistance G and figure of merit k of galvanometer is calculated using Eq. (1) and (2) respectively. OBSERVATIONS Emf of the battery E = ... V Number of divisions on full scale of galvanometer = ... TABULATION FOR G (RESISTANCE ) & K (FIGURE OF MERIT) OF GALVANOMETER
S.l.no
High
Resistance(R)
in Ω
Deflection in
the galvanometer
θ (divisions)
Shunt
resistance
S (Ω)
Half deflection
in galvanometer
θθ/22 (divisions)
G=
(
in Ω
k=P
% 3S)θ
in A/ divisions
1
2
3
4
5
CALCULATIONS
Mean value of G (resistance of galvanometer) = ...... Ω
Mean value of k (figure of merit of galvanometer) = ....... ampere/division. RESULT 1.Resistance of galvanometer by half deflection method, G = .....
2. Figure of merit of galvanometer, k = .........ampere/division PRECAUTIONS 1.Key K1 should be inserted only after high value of R has been taken out from resistance box
otherwise galvanometer coil may burn. 2.Adjust R such that deflection in galvanometer is of even division so that θ/2 is more
conveniently obtained. 3. Emf of the battery should be constant. 4. Use as high values of R as practically possible. This ensures correct value of G. 5. All the connections and plugs in the resistance box should be tight. SOURCES OF ERRORS 1. Plugs in the resistance boxes may be loose or they may not be clean. 2. The emf of the battery may not be constant.
……………………………………..

AIM To convert the given galvanometer (of known resistance and figure ofdesired range (say 0 to 30 mA APPARATUS AND MATERIAL REQUIRED(a) A galvanometer of known resistance and figure of merit, (b) a constantan or manganin wire of 26 or 30 SWG, (c ) a battery or a battery eliminator, (d) one way key, (e) a rheostat of range 200 Ω, (f) an ammeter of 0-30 mA range, (g) connecting wires and sand paper.PRINCIPLE
Fig. Circuit to verify conversion of
A galvanometer is a sensitive device which can detect the presence ofof the order of 100 mA. For measuringshunt resistance S is connected in parallel across the galvanometer havingtotal current in the circuit for full scale deflection, then theis current that flows through the galvanometer for full scale deflection. The instrument is calibratedas to read the current directly in ampere and then it can beparallel to each other therefore, the potential differences across both are same, hence
IgG = (I0 –Ig) S
The figure of merit of the galvanometer is represented by the symbol corresponding to one scale division; thusgalvanometer scale, the value of current Ig = KN if n represents the actual deflection in the converted galvanometer,
I = T
U
EXPT-8
To convert the given galvanometer (of known resistance and figure of merit) into
APPARATUS AND MATERIAL REQUIRED A galvanometer of known resistance and figure of merit,
or manganin wire of 26 or 30 SWG,
wires and sand paper.
Circuit to verify conversion of galvanometer into an ammeter
A galvanometer is a sensitive device which can detect the presence of very small current in a circuit of the order of 100 mA. For measuring current of the order of an ampere, a low resistance called
is connected in parallel across the galvanometer having resistance circuit for full scale deflection, then the current (I 0 – Ig) passes through
the galvanometer for full scale deflection. The instrument is calibratedas to read the current directly in ampere and then it can be used as an ammeter. Since
potential differences across both are same, hence
Ig) S or S = VWX
V' –VW
The figure of merit of the galvanometer is represented by the symbol k which represents the current corresponding to one scale division; thus if N is the total number of divisions (on either side) of the
scale, the value of current Ig is given by Ig = KN
represents the actual deflection in the converted galvanometer, then the total current will beTVW
U
merit) into an ammeter of a
galvanometer into an ammeter
very small current in a circuit current of the order of an ampere, a low resistance called
resistance G. If I0 is the ) passes through S, where Ig
the galvanometer for full scale deflection. The instrument is calibrated so an ammeter. Since G and S are
potential differences across both are same, hence
which represents the current is the total number of divisions (on either side) of the
then the total current will be

PROCEDURE 1. The galvanometer resistance G and figure of merit k are determined. 2. The total number of divisions N on either side of zero of the galvanometer scale is counted. 3. The current Ig for full scale deflection in the galvanometer is calculated by using the relation where k is the figure of merit of the galvanometer.
4. The shunt resistance S is calculated using the formula S = VWX
V' –VW
5. The radius r of the wire is measured and from the given value of the specific resistance ρ,
the length of the wire l is calculated using the formula l = ππππZ-[
ρρρρ
6. If the calculated length of the wire be 10 cm. Then 3-4 cm extra is cut and is connected in parallel to the galvanometer to complete the circuit as shown in Fig . 7. The length of the wire is so adjusted that when we see full scale deflection in the galvanometer, the current in the ammeter is 30 mA. 8. Thus the galvanometer is now converted to an ammeter whose range is 30 mA. 9. Now the exact length of the shunt wire is measured and its resistance is calculated by using the previously measured value of radius and the known value of specific resistance.
10. The above value of resistance is compared to the one calculated using the formula S ==== .ρρρρ
ππππ -
OBSERVATIONS
1. Galvanometer resistance, G (given) = ... ....................Ω 2. Figure of merit of the galvanometer, k (given) = ... ………..ampere/division 3. Number of divisions on either side of zero of the galvanometer scale, N = ... ……………division 4. Current required for producing full scale deflection of N divisions, Ig = k N = ... ………….ampere 5. Radius of wire: Least
count
in cm
Zero
error
in cm
Zero
correction
in cm
Observed diameter of the wire:
in cm
Mean
observed
diameter, D in
cm
Radius of the
wire r =D/2
in cm
D1 D2 D3 D4
CALCULATIONS
1. Shunt resistance S = VWX
V' –VW =……….Ω
2. Given value of specific resistance of the material of the wire ρ = ... ........Ωm
3. Required length of wire, l = ππππZ-[
ρρρρ =……… cm
4. Observed length of the shunt wire for the desired range, l’ = ... …………cm
5. Shunt resistance from the observed length of the wire, S’ ==== 4ρρρρ
ππππ - ====……........Ω
RESULT To convert the given galvanometer into an ammeter of the range, 0 to ... …..ampere 1. the calculated resistance of the shunt wire, S = ... ……..Ω
2. the observed resistance of the shunt wire, S’ = ... ……..Ω PRECAUTIONS 1. Use the ammeter for verification which has the same range as the range of conversion. 2. Cut about 3 to 4 cm extra to the calculated length of the wire. 3. After adjusting the length of the wire, measure the length of the wire between the two plugs carefully.
……………………………………..
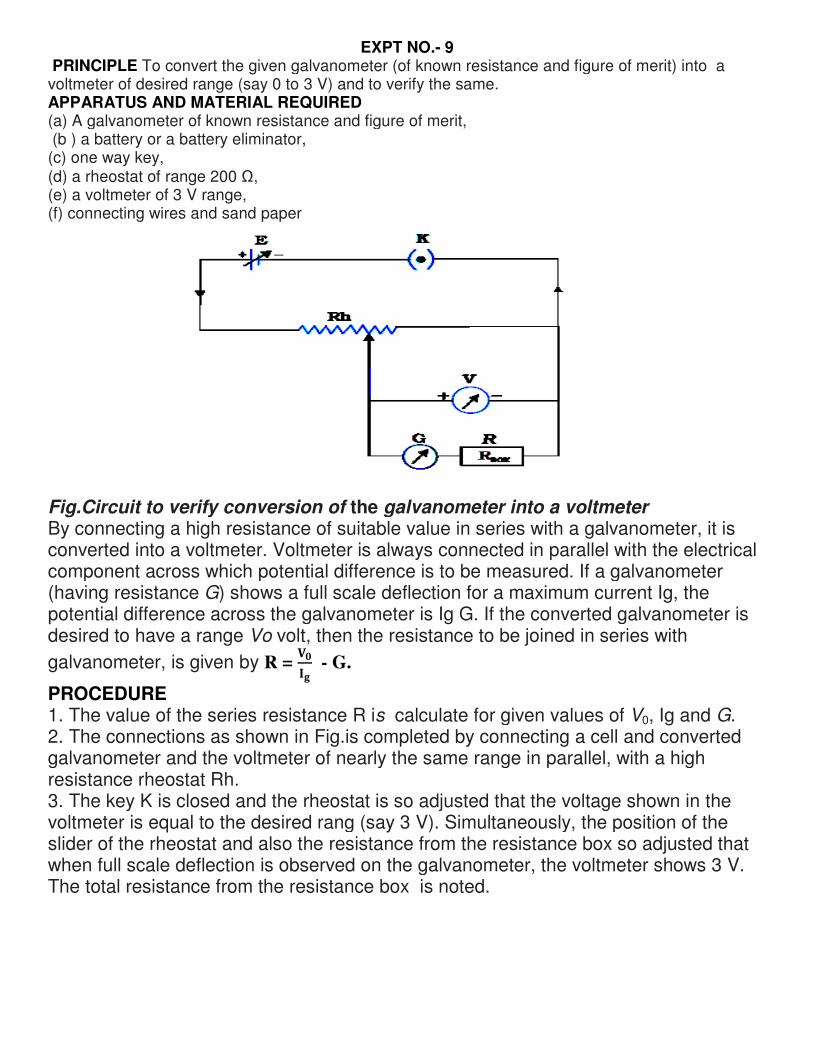
PRINCIPLE To convert the given galvanometer (of known resistance and figure ofvoltmeter of desired range (say 0 to 3 V) and to verify the same.APPARATUS AND MATERIAL REQUIRED(a) A galvanometer of known resistance and figure of merit, (b ) a battery or a battery eliminator,(c) one way key, (d) a rheostat of range 200 Ω, (e) a voltmeter of 3 V range, (f) connecting wires and sand paper
Fig.Circuit to verify conversion of By connecting a high resistanceconverted into a voltmeter. Voltmeter is always connected in parallel with the electrical component across which potential difference is to be measured.(having resistance G) shows a full scale deflectionpotential difference across the galvanometer is desired to have a range Vo volt, then the resistance to be joined in series with
galvanometer, is given by R = \
VW
PROCEDURE 1. The value of the series resistance2. The connections as shown in Fig.is completed galvanometer and the voltmeter of nearly theresistance rheostat Rh. 3. The key K is closed and the rheostatvoltmeter is equal to the desired rangslider of the rheostat and also the resistancewhen full scale deflection is observed on theThe total resistance from the resistance box
EXPT NO.- 9 galvanometer (of known resistance and figure of
voltmeter of desired range (say 0 to 3 V) and to verify the same. APPARATUS AND MATERIAL REQUIRED
A galvanometer of known resistance and figure of merit, nator,
Circuit to verify conversion of the galvanometer into a voltmeterBy connecting a high resistance of suitable value in series with a galvanometer, it is converted into a voltmeter. Voltmeter is always connected in parallel with the electrical component across which potential difference is to be measured. If a galvanometer
full scale deflection for a maximum current galvanometer is Ig G. If the converted galvanometer is
volt, then the resistance to be joined in series with\'
W - G.
he value of the series resistance R is calculate for given values of own in Fig.is completed by connecting a cell and converted
galvanometer and the voltmeter of nearly the same range in parallel, with a high
and the rheostat is so adjusted that the voltage shown in the the desired rang (say 3 V). Simultaneously, the position of the
of the rheostat and also the resistance from the resistance box soscale deflection is observed on the galvanometer, the voltmeter shows 3 V.
he total resistance from the resistance box is noted.
galvanometer (of known resistance and figure of merit) into a
galvanometer into a voltmeter of suitable value in series with a galvanometer, it is
converted into a voltmeter. Voltmeter is always connected in parallel with the electrical If a galvanometer
for a maximum current Ig, the . If the converted galvanometer is
volt, then the resistance to be joined in series with
for given values of V0, Ig and G. by connecting a cell and converted
range in parallel, with a high
that the voltage shown in the Simultaneously, the position of the
from the resistance box so adjusted that galvanometer, the voltmeter shows 3 V.
OBSERVATIONS 1. Resistance of the galvanometer, G (given) = ....................Ω.
2. The figure of merit of the galvanometer, k (given) = ... ………..ampere/division
3. Number of divisions on either side of zero of the galvanometer scale,
N = ... ……….division 4. Current required for producing full scale deflection of N divisions,
Ig = k N = ... …………….ampere
5. Total resistance taken out from the resistance box = ... ..................Ω
CALCULATIONS
Resistance to be connected in series with the galvanometer, R = \'
VW - G = ……..Ω
RESULT To convert the given galvanometer into a voltmeter of the range, 0 to ... …..V
1. The value of the calculated series resistance, R = ……….Ω
2. The value of the observed series resistance, R’ = .............Ω
3. Current for full scale deflection, Ig = ...............ampere.
PRECAUTIONS 1. The resistance box used should be of high resistance. 2. The rheostat should be used as potential divider.
3. High resistance of the order of 10 KΩ from the resistance box should be used first and then the battery key should be closed to avoid any damage to the galvanometer. SOURCES OF ERROR The wire may be of non-uniform area of cross section. DISCUSSION 1. If the area of cross section of the wire is non-uniform, how will it affect the observation? 2. Use a rheostat as current divider and potential divider. 3. To check if friction in your instrument is small enough, measure Ө in the same
setting 5 to 10 times. If each time, the needle comes to exactly the same point on the scale, friction in your instrument is quite small. SELF ASSESSMENT 1. How can you increase the range of the converted galvanometer to 0-60 mA? 2. How can you decrease the range of the converted galvanometer to 0-20 mA? 3. If S << G, what is the order of resistance of converted galvanometer? 4. Why is an ammeter always connected in series with the circuit? 5. Why is a voltmeter always connected in parallel with the circuit?
……………………………………..
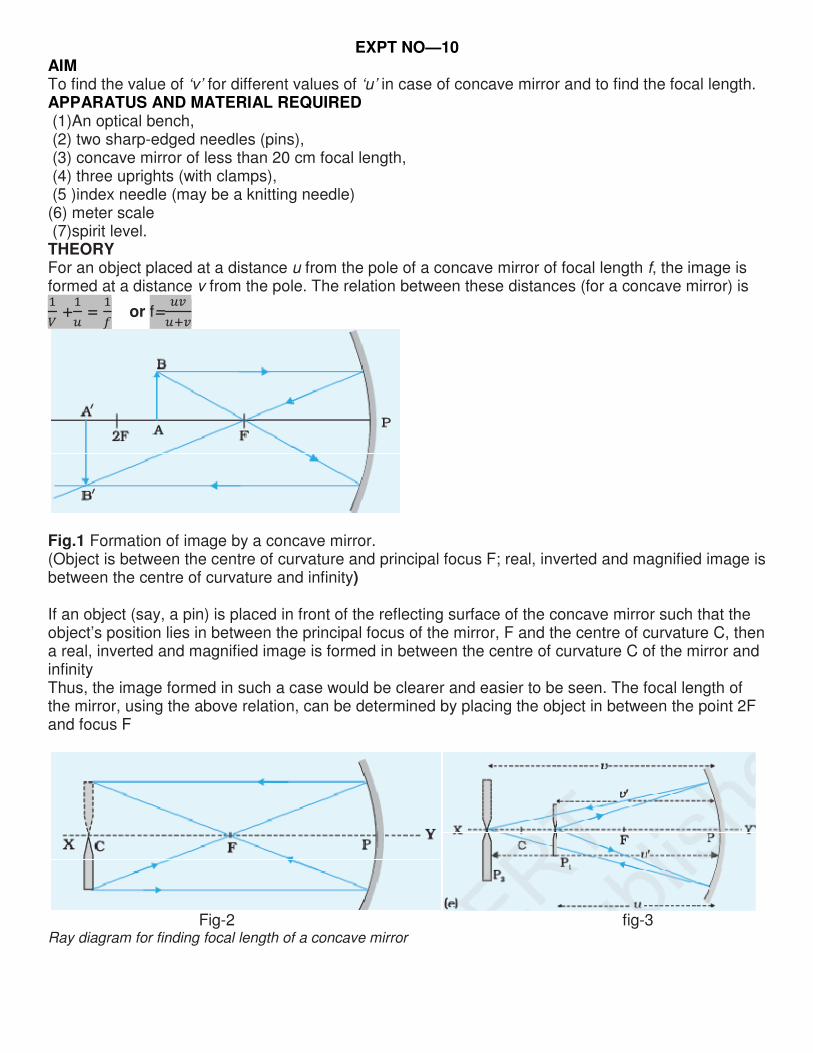
EXPT NO—10 AIM To find the value of ‘v’ for different values of ‘u’ in case of concave mirror and to find the focal length. APPARATUS AND MATERIAL REQUIRED (1)An optical bench, (2) two sharp-edged needles (pins), (3) concave mirror of less than 20 cm focal length, (4) three uprights (with clamps), (5 )index needle (may be a knitting needle) (6) meter scale (7)spirit level. THEORY For an object placed at a distance u from the pole of a concave mirror of focal length f, the image is formed at a distance v from the pole. The relation between these distances (for a concave mirror) is
R +
] =
^ or f=
]_
]3_
Fig.1 Formation of image by a concave mirror. (Object is between the centre of curvature and principal focus F; real, inverted and magnified image is between the centre of curvature and infinity) If an object (say, a pin) is placed in front of the reflecting surface of the concave mirror such that the object’s position lies in between the principal focus of the mirror, F and the centre of curvature C, then a real, inverted and magnified image is formed in between the centre of curvature C of the mirror and infinity Thus, the image formed in such a case would be clearer and easier to be seen. The focal length of the mirror, using the above relation, can be determined by placing the object in between the point 2F and focus F
Fig-2 fig-3 Ray diagram for finding focal length of a concave mirror

. Fig-4 Determination of Index correction
PROCEDURE 1. Approximate value of the focal length of concave mirror is obtained by focusing the image of a distant object. By obtaining bright and clear image of a distant building or tree on a plane wall or a sheet of paper ,the distance between the mirror and the image is measured , which gives the approximate focal length of the concave mirror. 2.The optical bench is placed on a rigid table ,making it horizontal using a spirit level and leveling screws.
3.The concave mirror is clamped on an upright and mounted it vertically near one end of the optical bench. An object pin P1 is moved on the optical bench back and forth so that its image is formed at the same height by making slight adjustments of the height of the pin or the mirror inclination. This procedure ensures that the principal axis of the mirror is parallel to the optical bench.
4.Another vertically mounted sharp and bright pin P2 is placed in front of the reflecting surface of the concave mirror& the pins P1 and P2 are adjusted so that the height of the tips of these pins become equal to the height of the pole P of the mirror from the base of the optical bench [Fig. 3]. 5.To determine index correction, a thin straight index needle is placed so that its one end A1 touches the tip of the pin and the other end B1 touches the pole P of the mirror. The positions of the uprights are readed on the scale. Their difference gives the observed distance between tip of the pin and the pole of the mirror. Length of the needle A1B1 is measured by placing it on the scale which is the actual distance between the points in question. The difference between the two gives the correction to be applied to the observed distance. The index correction is found for both the pins P1 and P2 for all measurements. 6.The pin P1 is moved away from the mirror and is placed almost at 2F till an inverted image of same size as the pin should be visible. 7. Now another pin P2is placed on the bench& its height is adjusted to be almost the same as the earlier pin. A piece of paper is placed on the tip of one pin, taking this as the object pin. 8. The pin is placed with paper at a distance lying between F and 2F. 9. The image of the pin is located using the other pin by removing parallax between the image and the pin.
10. The values of u and v i.e., the distances of the object and image pins from the mirror respectively is noted . 11. The experiment is repeated for at least five different positions of the object and the corresponding values of v is recorded in tabular form. 12. After doing index correction the corrected values of u and v are recorded &the value of focal length, f is found.
OBSERVATIONS 1. Rough focal length of the concave mirror = .........cm
2. Actual distance of the object from the mirror using index needle, l0= ... …….cm 3. Observed distance of the object from the mirror= position of mirror upright – position of object pin
upright on the scale, lo′′′′=............cm
4.Index correction for object distance, eo= actual distance – observed distance.
eo=l0 – lo′′′′=.......cm
Similarly for image pin, ei=l0 – lo′′′′=...........cm

Tabulation for Determination of u, v and f
Sl.
No.
Position of
Observed
u’
(cm)
Observed
v’
(cm)
Corrected
u = u’+ eo
(cm)
Corrected
v = v’ + ei
(cm)
f =`a
`3a
(cm)
Mean f
(cm) Mirror
M
(cm)
Object
pin
P1
(cm)
Image
pin
P2222
(cm)
1
2
3
4
5
6
CALCULATIONS The corrected values of u and v are calculated and the value of f is computed. After tabulating them and the mean value of the focal length of the given concave mirror is found. RESULT- The focal length of the given concave (converging) mirror is f = ... ...cm PRECAUTIONS 1. The uprights supporting the optical elements should be rigid and mounted vertically. 2. The object pin should be kept in between the centre of curvature and the focus of the mirror. 3. The aperture of mirror should be small otherwise the image formed will not be distinct. 4. Eye should be placed at a distance of distinct vision (25 cm) from the image needle. 5. The tip of the inverted image of the object pin must touch the tip of the image pin and must not overlap. It should be ensured while removing the parallax. 6. The image and the object pins should not be interchanged during the course of the experiment. 7. The corrected values of u and v must be put in the formula for calculating f and then a mean value off should betaken. Calculations for f must not be made using the mean values of u and v. 8. A white screen or plane background may be used for seeing the clear image of the pin. 9. Image of the Sun should not be seen directly as it may hurt your eyes. SOURCES OF ERROR 1. An error may arise in the observations if the top of the optical bench is not horizontal and similarly if the tips of pins and pole of the mirror are not at the same horizontal level. 2. The concave mirror should be front-coated, otherwise multiple reflections will come from the
reflecting surface of the mirror. ……………………………………..

EXPT NO—11 AIM To find the focal length of a convex lens by plotting graphs between u and v or between 1/u and 1/v. APPARATUS REQUIRED An optical bench, two sharp-edged needle (pins), convex lens, three uprights (with clamps),index needle (may be a knitting needle), metre scale and spirit level. THEORY
Fig-1 Fig-2
For an object placed at a distance u from the optical centre of a thin convex lens of focal length f , a real and inverted image is formed on the other side of the lens at a distance v from the optical centre. The relation between these distances is
R -
] =
^……….. (1)
According to the new cartesian sign convention u is negative but v is positive Therefore the Eq.(1) takes the following form for magnitudes of u and v.
R +
] =
^………… (2)
orf =]_
]3_……………(3)
In this result the positive values of u and v are substituted.
Eq. (2) shows that
Rversus
]graph is a straight line of negativeslope. If
R = 0 or
] =0
then the intercepts of the graph on both axes are
^
Graph of u versus v is a hyperbola. When u = v, then each equals 2f. Eq. (3 )shows that values of u and v are interchangeable. PROCEDURE 1. Obtain approximate value of the focal length of the thin convex lens by focusing the image of a distant object. It can be found by obtaining a sharp image of the Sun or a distant tree on a screen, say a plane wall, or a sheet of paper placed on the other side of the lens and measuring the distance between the lens and the image with a scale. This distance is a rough estimate of the focal length, f of the convex lens. Note: Do not look at the image of Sun directly as it may hurt your eyes.
1. The optical bench is placed on a rigid table or on a platform, and using the spirit level to make it horizontal with the help of leveling screws provided at the base of the bench.
2. The convex lens is clamped on an upright and mounts it vertically almost near to the middle of the optical bench such that its principal axis is parallel to the optical bench. In this position, the lens would lie in a plane perpendicular to the optical bench.
4. Index correction is found for both the pins.
5. The vertically mounted sharp pins P and P’ are placed on left and right hand sides of the lens respectively. Pins P and P’are so adjusted the heights of the tips of these pins become equal to the height of the optical centre O of the lens from the base of the optical bench. Let the pin P
(placed on left hand side of the lens ) be the object pin and the pin P’ (lying on right hand side) be

the image pin. A small piece of paper is put on one of the pins (say on image pin P’) to differentiate it from the object pin P’. 6. The object pin P (on left side of the lens) is displaced to a distance slightly less than 2f from the optical centre O of the lens &the position of the real and inverted image on the other side of the lens above the image pin P’ is located. 7. Using the method of parallax, the position of the image pin P’ is adjusted such that the image of the object pin P coincides with the image pin P’. Note: As the value of u changes from 2f to f, v changes from 2f to infinity. Since the values of u and v are interchangeable, i.e., the object and image are two conjugate points, therefore it is clear that complete range of values for both u and v between f and infinity are obtained for a movement of the object pin over the range 2f to f. 8. The upright position of the object pin, convex lens and image pin on the optical bench are recorded observation table. 9. The object pin P is moved closer to the optical centre O of the lens (say by 2 cm or 3 cm) & the experiment is repeated for at least six sets of readings for various distances of object pin between f and2f from the lens. OBSERVATIONS 1. Approximate focal length of the convex lens = ... …..cm 2. Length of the index needle as measured by the metre scale,.L0=... cm 3. Thickness of the thin convex lens (given), t = ... cm 4. Actual length between the optical centre O of the lens and tip of the pin, l0= L0+ t/2 = ... …..cm 5. Observed length of the index needle, l’0= Distance between the centre of convex lens and tip of the object pin= Position of lens upright – position of object pin upright on the scale. = ... …..cm – ... …..cm =...........cm 6. Index correction for object distance, eo = l0– l’0 = ……….cm; 7. Similarly. for image pin, ei = li – l’i= ............cm. Tabulation for Determination of u, v and f
Sl.
N
o.
Len
s u
pri
gh
t a (
cm
)
Ob
ject
pin
up
rig
ht
b(c
m)
Imag
e p
in u
pri
gh
t c(c
m)
Ob
serv
ed
u
= a
– b
(cm
)
Ob
serv
ed
v =
a –
c (
cm
)
Co
rre
cte
d u
=
Ob
serv
ed
u +
eo
(cm
)
Co
rre
cte
d v
=
Ob
serv
ed
v +
ei(cm
&
`
In cm-1
&
a
In cm-1
f =`a
`3a
In cm
Mean f In cm
1
2
3
4
5
6

CALCULATIONS (A) .FROM FORMULA.
The corrected values of u and v is calculated & the value of f is computed using formula f =]_
]3_
& tabulate them in the table to find the mean value of the focal length of the given convex lens. (B)CALCULATION OF FOCAL LENGTH BY PLOTTING GRAPHS (a). u – v Graph: Taken u along x-axis and v along y-axis. Scales of x- and y-axis should be same. A hyperbola curve is drawn for various values of u and v (Note that six sets of readings For u between f and 2f, give 12 points on the graph by interchanging values of u and v).
Fig. 3 u versus v graph for convex lens The point u = 2f; v = 2f is shown as point Z on u – v graph . The point Z is the point intersection of a line OZ bisecting the angle XOY with hyperbola. Two lines AZ and BZ drawn perpendicular to Y- and X-axis, respectively. The lengths AZ and BZ are both equal to distance 2f. Thus by plotting the u – v graph, the focal length of the lens can be obtained. Distance OA (= 2f ) on y-axis = ... cm Distance OB (= 2f ) on x-axis = ... cm
Mean focal length of the convex lens, f = b3b"
c =……..cm
(b).1/u – 1/v graph: A straight line graph drawn by plotting 1/u along the X-axis and 1/v along the Y-axis .
Fig. 4 1/u versus 1/v graph for a convex lens

Both the intercepts OA’ (on y-axis) and OB’ (on X-axis) will be equal to distance 1/f.
Intercept OA’ (= 1/f ) on y-axis=............cm–1Intercept OB’ (= 1/f ) on x-axis=.............cm–1
Mean focal length of the convex lens f =-
b3b"=……..cm
RESULT The focal length of the given converging thin convex lens:
(i) from calculations as shown in Observation Table f = ............cm (ii) from u – v graph f =...............cm, and
(iii) from 1/u – 1/v graph f =..........cm. PRECAUTIONS
1. The uprights supporting the optical elements should be rigid and mounted vertically.
2. The aperture of the lens should be small otherwise the image formed will not be distinct.
3. Eye should be placed at a distance more than 25 cm from the image needle.
4. An error may arise in the observations if the top of the optical bench is not horizontal and similarly if
the tips of pins and optical centre of the lens are not at the same horizontal level.
5. The image and object needles should not be interchanged during the performance of the
experiment, as this may cause change in index corrections for object distance and image distance.
6. The tip of the inverted image of the object needle must touch the tip of the image needle and must
not overlap. This should be ensured while removing the parallax.
7. The general instructions to be followed in all optical bench experiments (as given in the description
of optical bench) must be taken care of.
8. The corrected values of the distances u and v must be put in the formula for calculating f and then
a mean of f should be taken. Calculations for f must not be made using the mean values of u and v.
SOURCES OF ERROR
1. The uprights may not be vertical.
2. Parallax removal may not be perfect.
3. If the knitting needle or index rod for finding index correction is not sharp like a needle, its length
may not be accurately found on scale.
*************************

AIM- To find the focal length of a convex mirror using a convex lens.APPARATUS AND MATERIAL REQUIRED
An optical bench with uprights for holding lens, mirror and twoconvex lens, a convex mirror, index needle (may be a knitting needle or a pencil sharply pointed at both ends), a metre scale and a spirit level.PRINCIPLE Fig 1-a
Fig. 1(a) Object is at infinity. A highly diminished and point image is located at the focus behind the convex mirror Fig. 1(b) Object is in front of the mirror. A diminished virtual image is produced between the pole and focus behind the mirror
Fig-1. illustrates the formation of image of an object AB by aaperture) in two different situations. The image formed by a convex mirror iTherefore, its focal length cannot be determined directly. However, itintroducing a convex lens in between the object
An object AB is placed at point P’ in front of a thin convex lens such
magnified image A’B’ is formed at positionmirror is introduced between the convex lens and point C and so adjusted that
image A’B’ coincides with the object AB at pointfrom the tip of the object, after passing through the lens, fall normally on theconvex mirror and retrace their path. Anyalong the radius of that sphere so that point C must be the centre of curvatureTherefore, the distance P C is the radius of
convex mirror. That is ,f =
2 =
2
Fig. 2 Image formed by (a) convex mirror and convex lens
(b) convex lens
EXPT-12
To find the focal length of a convex mirror using a convex lens. REQUIRED
An optical bench with uprights for holding lens, mirror and two needles, two needles (pins), a thin needle (may be a knitting needle or a pencil sharply pointed at
ends), a metre scale and a spirit level.
Fig 1-b
Object is at infinity. A highly diminished and point image is located at the focus behind the convex mirror diminished virtual image is produced between the pole and focus behind the mirror
illustrates the formation of image of an object AB by a convex mirror MM’situations. The image formed by a convex mirror is virtual and erect.
Therefore, its focal length cannot be determined directly. However, it can be determined by introducing a convex lens in between the object and the convex mirror (Fig.2).
front of a thin convex lens such that its real, inverted and
is formed at position C on the other side of the lens [Fig. 2(b)]. Now a convex introduced between the convex lens and point C and so adjusted that the real and in
coincides with the object AB at point P’ [Fig..2 (a)]. This is possible if the light rays starting tip of the object, after passing through the lens, fall normally on the reflecting surface of the
path. Any normal ray (perpendicular) to a spherical surface has to be radius of that sphere so that point C must be the centre of curvature of the convex mirror.
Therefore, the distance P C is the radius of curvature R and half of it would be th
Image formed by (a) convex mirror and convex lens-image A’B’ coincides with the object A B at P’
(b) convex lens- image is inverted and magnified
needles, two needles (pins), a thin needle (may be a knitting needle or a pencil sharply pointed at
Object is at infinity. A highly diminished and point image is located at the focus behind the convex mirror diminished virtual image is produced between the pole and focus behind the mirror
M’ (having a small s virtual and erect.
can be determined by
that its real, inverted and
2(b)]. Now a convex the real and inverted
.2 (a)]. This is possible if the light rays starting reflecting surface of the
normal ray (perpendicular) to a spherical surface has to be of the convex mirror.
and half of it would be the focal length of the
image A’B’ coincides with the object A B at P’

PROCEDURE 1. In case, if the focal length of the given thin convex lens is not known then approximate value of its
focal length should be estimated first.
2. The optical bench is place on a rigid table or on a platform. Using the spirit level, it is made
Horizontal with the help of leveling screws provided at the base of the bench.
3. The uprights mounted with pin P1 (object pin), convex lens LL’, and convex mirror MM’ are
placed on the horizontal optical bench [Fig. .2(a)].
4. The lens, mirror, and pin P1 are vertically placed on the optical bench and the tip of the pin, optical
centre O of the convex lens LL’, and pole P of the convex mirror MM’ adjusted to lie on the same
horizontal straight line, parallel to the optical bench.
5. The index correction is determine between upright holding of the convex mirror and image pin
respectively, using an index needle.
6. The object pin P1 is placed from the convex lens LL’ at a distance slightly greater than the focal
length of the lens.
7. The position of the convex mirror MM’ is adjusted till the light rays reflected back from the mirror
pass through the lens and form a real and inverted image coinciding with the object pin P1, as
shown in Fig.2 (a). This occurs when the rays starting from the tip of pin P1, after passing through
the lens strike the mirror normally and are reflected back along their original paths.
The parallax between the image and object pins is removed.
8. The position of uprights holding the object pin P1, convex lens LL’, and convex mirror MM’ are
recorded in the observation table.
9. The convex mirror is removed from its upright and the image pin P2 is fixed on it. The height of pin
is adjusted such that the tip of it also lies on the principal axis of the lens. That is, the tips of the
pins P1 and P2 and the optical centre O of the convex lens, all lie on a straight horizontal line
parallel to the length of the optical bench.
10. A small piece of paper may placed on image pin P2 to differentiate it from the object pin P1.
11. Using the method of parallax and without changing the position of lens LL’ and object pin P1,
the position of image pin P2 is adjusted on the other side of the lens so that it coincides with the
real and inverted image of the object pin P1 formed by the convex lens [Fig. 2(b)]. The position of
the image pin is noted.
12.The experiment is repeated by changing the separation between the pin P1 and lens LL’ and the
mirror MM’. In this manner, five sets of observations are taken.
OBSERVATION
1. Focal length of the convex lens, f (estimated/given) = ... …..cm
2. Actual length of the index needle, l = ... ………………………cm
3. Observed length of the index needle l’ = Position of mirror upright – position of pin upright on the scale
= ... ……………………..cm
3. Index correction, e = Actual length – observed length (l – l’) = ... cm

Tabulation for Determination of radius of curvature of convex mirror, R
Sl.
No.
Upright position of
Observed
R’ = c – d
(cm)
Corrected
R =
Observed
R’ + e
(cm)
Mean
R
in
(cm)
Focal
length
f
(cm)
Object
pin
P1
a (cm)
Convex
lens LL’
b (cm)
Convex
Mirror
MM’
c (cm)
Image pin
P2
d (cm)
1
2
3
4
5
RESULT The focal length of the given convex mirror is f =... ... cm. PRECAUTIONS
1. The uprights supporting the pins, lens and mirror must be rigid and mounted vertically.
2. The apertures of the given convex lens and convex mirror should be small, otherwise the image
formed will be distorted.
3. Eye should be placed at a distance of about 25 cm or more from the image pin.
4. Optical bench should be horizontal. The tips of pins, centre of convex lens and pole of the mirror
should be at the same horizontal level.
SOURCES OF ERROR
1. The tip of the inverted image of the object pin should just touch the tip of the image pin and must
not overlap. This should be ensured while removing the parallax.
2. Personal eye defects may make removal of parallax tedious.
3. The convex mirror should preferably be front-coated. Otherwise multiple reflections may take
place.
DISCUSSION
It may not be possible to perform this experiment with just any convex lens. The focal length of the
lens used in this experiment should neither be too small nor too large. Why?
**********************************************

EXPT-13 AIM To determine the angle of minimum deviation for a given glass prism by plotting a graph between the angle of incidence and the angle of deviation. APPARATUS AND MATERIAL REQUIRED Drawing board, triangular glass prism, metre scale, alpins, drawing pins, graph paper, protractor, white paper sheets. PRINCIPLE Fig. 1 Refraction of light through a glass prism A triangular prism has three rectangular lateral surfaces and two triangular bases. The line along which any two faces (refracting surfaces) of the prism meet is the refracting edge of the prism and the angle between them is the angle of the prism. For this experiment, it is convenient to place the prism with its rectangular surfaces vertical. The principal section ABC of the prism is obtained by a horizontal plane perpendicular to the refracting edge (Fig.1). A ray of light PQ (from air to glass) incident on the first face AB at an angle i is refracted at an angle r along QR and finally, emerges along RS. The dotted lines in the figure represent the normal to the surfaces. The angle of incidence (from glass to air) at the second face AC is r’ and the angle of refraction (or emergence) is e. The angle between the direction of incident ray PQ (produced forward) and the direction of emergent ray
RS (produced backward) is the angle of deviation δ.
From geometrical considerations we have r + r’ = A, δ = (i – r) + (e – r’) = i + e – A
At the position of the prism for minimum deviation δm, the light ray passes through the prism
symmetrically, i.e. parallel to the base so that when δ = δm, i = e which implies r = r’. The advantage of putting the prism in minimum deviation position is that the image is brightest in this position. Fig. 2 Refraction of light through a glass prism for various angles of incidence PROCEDURE 1. A white sheet of paper is fixed on a drawing board with the help of cello tape or drawing pins.

2. A straight line XY,is drawn using a sharp pencil nearly in the middle and parallel to the length of the paper. 3. Points O1, O2, O3. ., . . . . are marked on the straight line XY at suitable distances of about 8 to 10 cm and normals N1 O1, N2 O2, N3O3. . . . drawn on these points (Fig. 2). 4. Straight lines, P1 O1, P2 O2, P3 O3, . . . are drawn corresponding to the incident rays making angles of incidence at 35°, 40°, 45°, 50°, ... 60° respectively with the normals, using a protractor. The
values of the angles P1 O1 N1, P2 O2 N2, P3 O3 N3,...are written on the white paper sheet ( Fig.2). 5. The prism is placed with its refracting face AB on the line XY with point O1 in the middle of AB as shown in the figure. The boundary of the prism is drawn with a sharp pencil. 6. Two alpins Pl and Q1 are fixed with sharp tips vertically about 10 cm apart, on the incident ray line Pl Ql such that pin Q1 is close to point O1. Closing one eye (say left) and looking through the prism, right eye is brought in line with the images of the pins Pl and Ql. Alpins Rl and Sl are fixed about 10 cm apart vertically on the white paper sheet with their tips in line with the tips of the images of pins Pl and Ql. In this way pins R1 and S1 will become collinear, with the images of pins P1 and Q1. 7. Removing the pins Rl and Sl and encircling their pin pricks on the white paper sheet with the help of a sharp pencil ,the pins P1 and Q1 are removed and their pin pricks encircled also. 8. The points ( or pin pricks) Rl and Sl is joined with the help of a sharp pencil and scale, to obtain the emergent ray Rl S l. R1S1 is produced in backwards to meet the incident ray Pl Ql (produced forward) atT1. Arrowheads are drawn on Pl Ql and R1 S1 to show the direction of the rays.
9. The angle of deviation δ 1and the angle BAC (angle A) of the prism (Fig. 1) are measured with a
protractor and the values of these angles are indicated in the diagram. 10. Steps 5 to 9 are repeated for different values of angle of incidence (40°, 45°, 50°...) and the
corresponding angles of deviation δ2, δ3... are measured with the protractor, and indicated them in the respective diagrams. 11. Observations are recorded in tabular form with proper units and significant figures. OBSERVATIONS Least count of the protractor = ...(degree) Angle of the prism, A = ...(degree)
Tabulation for the angle of incidence, i and angle of deviation δδδδ for a prism
Sl. No. Angle of incidence, i (degrees). Angle of deviation,δ (degrees)
1 35
2 38
3 40
4 42
5 44
6 50
7 55
8 60

Plotting the graph between i and δδδδ for the prism
Takeing angle of incidence i along x-axis and angle of deviation δ along y-axis, from Table a free hand smooth curve passing practically through all the points is plotted on the graph with choosing suitable scales on these axes
Fig. 3 Graph between angle of incidence and angle of deviation CALCULATIONS A tangent is drawn on the lowest point of the graph parallel to x-axis & the angle of minimum
deviation δm is noted on the y-axis of the graph. RESULT
Angle of minimum deviation, δm = ...... degree PRECAUTIONS 1. Alpins should be fixed vertically to the plane of paper. 2. Distance PQ and RS should be about 10 cm in order to locate incident and emergent rays with greater accuracy. 3. Same angle of prism should be used for all observations. 4. Position of the prism should not be disturbed for a given set of observations. SOURCES OF ERROR
1. If the three angles of refraction between adjacent pairs of faces are not equal, then A + δ ≠ i+ e. 2. There may be an error in measuring the values of the angles. DISCUSSION 1. It is suggested that the value of angle of incidence be taken more than 35°. This is required for angles less than 35° as there is a possibility of total internal reflection inside the prism.
2. You must check your readings by applying the formula i + e = A + δ.
3. The i – δ curve that is obtained in this experiment is a non-linear curve. In such situations, more readings should be taken in the minimum deviation region to be able to obtain the value of angle
of minimum deviation accurately. For example, if δ readings are taken initially at 35°, 40°, 45° and
50° and if the i – δ data points are situated as shown in Fig. 3 then a few more readings need to be taken for values of i in the range 45° to 55° say, at a difference of 1° or 2°. Taking more readings in this region will help in drawing a smooth curve. This will enable you to locate the position of the lowest point on the graph more accurately. 4. In the condition of minimum deviation, the refracted ray inside the prism becomes parallel to its base so as to satisfy the condition r = r’ 5. The graph does not show a sharp minimum. We have same deviation for a range of angle of incidence near minimum deviation. Therefore extra care should be taken in drawing tangential line
to the i – δ graph at minimum deviation.
***************************************

AIM: To determine refractive index of
APPARATUS REQUIRED (1) Three glass slabs of different thickness but same material,
(2) A travelling microscope
(3) Lycopodium powder
Theory: Refracting index of a glass slab (n)
PROCEDURE:
(1)The travelling microscope (M) is placed
horizontal by leveling its base screw.
(2)The least count of the vertical scale of microscope is noted down.
(3) A black ink cross mark (O) is put on the base of the microscope
the main scale & vernier scale reading (X
image of ‘O’.
4.Least thickness glass slab is placed over the mark ‘P’ and microscope is f
the microscope its reading (X2)is taken.
5.A few particle of lycopodium powder are sprinkle on the top surface of glass slab and the microscope is
focused on the particle ‘S’ by raising the microscope
6.The above steps 4 and 5 is repeated for other two glass slab.
OBSERVATION:
Least count of vertical scale of microscope =………………….cm.
V
M
+
X1
M
+
EXPT-14
To determine refractive index of material of glass slab using a travelling microscope.
(1) Three glass slabs of different thickness but same material,
(2) A travelling microscope
(3) Lycopodium powder
b (n) = 23
13Re
xx
xx
thicknessApparent
thicknessal
−
−=
(1)The travelling microscope (M) is placed on a table near a window so that sufficient light falls on it nade it
horizontal by leveling its base screw.
(2)The least count of the vertical scale of microscope is noted down.
(3) A black ink cross mark (O) is put on the base of the microscope and the cross wire is focused on it and
the main scale & vernier scale reading (X1) are noted after avoiding paralax between crosswire and the
4.Least thickness glass slab is placed over the mark ‘P’ and microscope is focused on image ‘O’ ’ by raising
)is taken.
5.A few particle of lycopodium powder are sprinkle on the top surface of glass slab and the microscope is
focused on the particle ‘S’ by raising the microscope and its reading(X3) is noted .
6.The above steps 4 and 5 is repeated for other two glass slab.
Least count of vertical scale of microscope =………………….cm.
M
+
X2
V
M
+
X3
V
glass slab using a travelling microscope.
(1) Three glass slabs of different thickness but same material,
on a table near a window so that sufficient light falls on it nade it
and the cross wire is focused on it and
) are noted after avoiding paralax between crosswire and the
ocused on image ‘O’ ’ by raising
5.A few particle of lycopodium powder are sprinkle on the top surface of glass slab and the microscope is
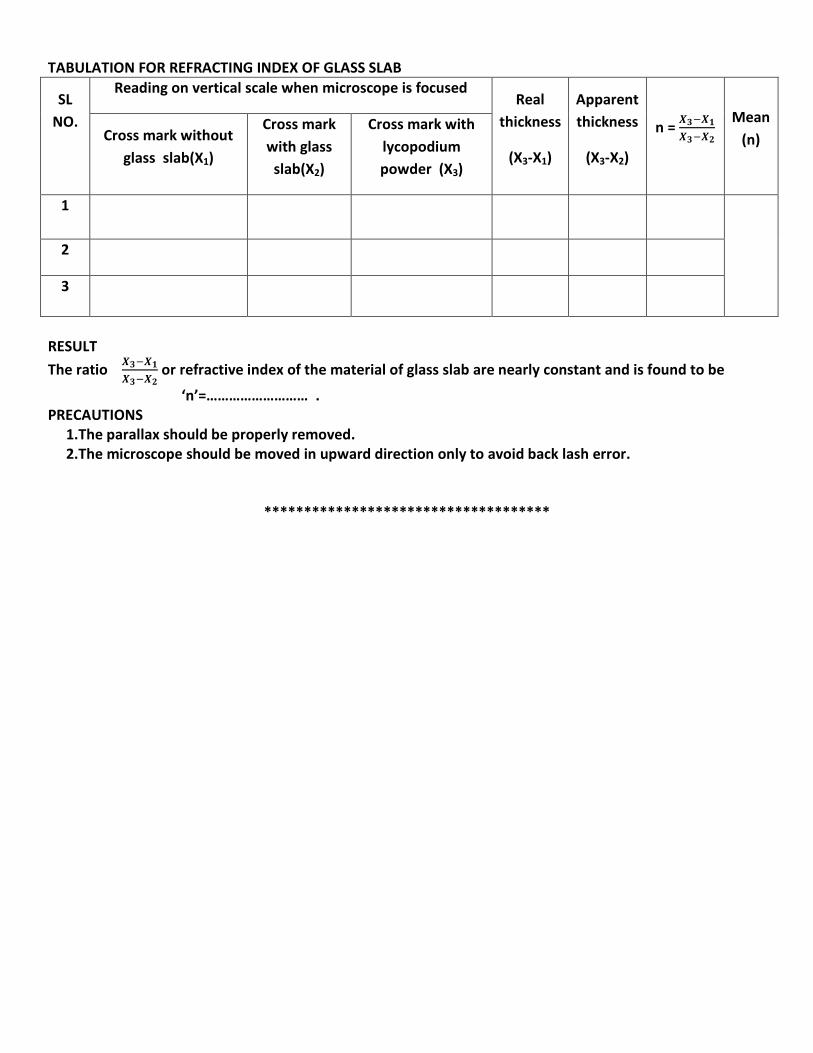
TABULATION FOR REFRACTING INDEX OF GLASS SLAB
SL
NO.
Reading on vertical scale when microscope is focused Real
thickness
(X3-X1)
Apparent
thickness
(X3-X2)
n = 5d(5&
5d(5-
Mean
(n) Cross mark without
glass slab(X1)
Cross mark
with glass
slab(X2)
Cross mark with
lycopodium
powder (X3)
1
2
3
RESULT
The ratio 5d(5&
5d(5- or refractive index of the material of glass slab are nearly constant and is found to be
‘n’=……………………… .
PRECAUTIONS
1.The parallax should be properly removed.
2.The microscope should be moved in upward direction only to avoid back lash error.
************************************

AIM-To find refractive index of a liquid by using convex lens and plane mirror.
APPARATUS REQUIRED-A convex lens, plane Mirror ,a transparent liquid(water),an optical needle, an iron
stand with base and clamp arrangement, a plumb line, a half metre scale.
THEORY.
If f1 and f2 be the focal length of glass convex lens and liquid lens
Respectively and F be the focal length of their combination then
fffF
21
1111⇒+=
For Plano concave liquid lens R1=R (Radius of curvature of convex lens surface) & R
From lens maker formula )(
−=
fn
2
11
fR
n
2
1+=⇒ .Putting the value of f2
PROCEDURE.
1.The rough focal length of the convex lens is found and then it is placed a plane mirror which is already
placed on the horizontal base of the iron stand.
2. An optical needle is horizontally clamped with the stand with its tip equal to
the pole of the convex lens.
4 .Adjusting the height of the needle the tip of the needle is coincide with its image by removing parallax.
5. By the help of plumb line and half metre scale the distance between the tip of needle and upper surface of
lens is measured.
6 .Few drop of transparent liquid is taken in between the plane mirror and lens, the position of the needle(QP)
is raised till its tip again coincide with its image (Q’
OBSERVATION 1.Rough focal length of convex lens
TABULATION FOR DISTANCE OF NEEDLE TIP FROM THE LENS AND MIRROR
Arrangement
Distance of n
From lens surface
(x1)
in cm
Without liquid
With liquid
EXPT-15
refractive index of a liquid by using convex lens and plane mirror.
convex lens, plane Mirror ,a transparent liquid(water),an optical needle, an iron
with base and clamp arrangement, a plumb line, a half metre scale.
focal length of glass convex lens and liquid lens
and F be the focal length of their combination then
fF12
11−=
=R (Radius of curvature of convex lens surface) & R2= ∞
)
−
RR 21
11
−=⇒
R
n
f11
2
2and R, n can be calculated.
1.The rough focal length of the convex lens is found and then it is placed a plane mirror which is already
placed on the horizontal base of the iron stand.
optical needle is horizontally clamped with the stand with its tip equal to the rough focal length above
4 .Adjusting the height of the needle the tip of the needle is coincide with its image by removing parallax.
By the help of plumb line and half metre scale the distance between the tip of needle and upper surface of
6 .Few drop of transparent liquid is taken in between the plane mirror and lens, the position of the needle(QP)
aised till its tip again coincide with its image (Q’ P’)by removing parallax and the reading is recorded .
1.Rough focal length of convex lens=………………..cm
TABULATION FOR DISTANCE OF NEEDLE TIP FROM THE LENS AND MIRROR
Distance of needle tip
Focal length
(=x )
in cm
From plane mirror
(x1)
in cm
Mean
2
21 xxx+
=
In cm
..........1
=f
..........=F
convex lens, plane Mirror ,a transparent liquid(water),an optical needle, an iron
with base and clamp arrangement, a plumb line, a half metre scale.
∞ .
1.The rough focal length of the convex lens is found and then it is placed a plane mirror which is already
the rough focal length above
4 .Adjusting the height of the needle the tip of the needle is coincide with its image by removing parallax.
By the help of plumb line and half metre scale the distance between the tip of needle and upper surface of
6 .Few drop of transparent liquid is taken in between the plane mirror and lens, the position of the needle(QP)
P’)by removing parallax and the reading is recorded .
Focal length
(=x )
in cm
..............
..............

CALCULATION:
Considering the refracting index of material of lens as 1.5 then using lens maker formula for it as
)( ⇒
−
−=
RRfn
211
111
1 )( R
RRRRf
ff=⇒=
=⇒
−
−
−=
1
11
12
2
111115.1
1
( ) ( )...............................111
2
1
2
=+=+=+=f
f
fR
n
RESULT:
The refractive index of the liquid(water) is found to be n=(……….)
PRECAUTION:
1.The liquid taken should be transparent 2. Only few drops of liquid should be taken for
thin layer.3.The parallex should be removed tip to tip.
******************************

AIM-To draw the I-V characteristic curve of
APPARATUS REQUIRED –1.P-N junction diode characteristics apparatus fitted with
(a) a dc miliammeter(0
(c) a dc voltmeter(0
2. P-N junction diode
THEORY
FIGURE 1 (a) Semiconductor diode
Depletion region – The immobile space
Known as depletion region .
Barrier potential-- The potential
movement of electron from the n region into the p region,
When an external voltage
is connected to the positive terminal of the battery and n
to be forward biased.
2(a)
Fig 2(a) p-n junction diode under forward (b) Barrier potential (1) without battery, (2) Low battery voltage, and (3) High
(c)Experimental circuit arrangement for studying
junction diode in forward bias
.The direction of the applied voltage (
.The depletion layer width decreases
. The barrier height is reduced to (V
When the applied voltage is small, the barrier potential will be
equilibrium value, and only a small number of carriers in the uppermost energy
possess enough energy to cross the junction. So
negligibly, till the voltage across the diode crosses a certain value.
voltage the barrier height will be reduced
diode current increases significantly (exponentially), even for
bias voltage. This voltage is called the
When an external voltage (
positive and p-side is negative, it is said to be
.The direction of applied voltage is same
.The barrier height increases to (V0 +
.The depletion region widens
EXPT NO 16
V characteristic curve of a p-n junction in forward bias and reverse bias.
N junction diode characteristics apparatus fitted with
miliammeter(0→10mA) (b) a dc miliammeter(0→1mA or 0→1000
a dc voltmeter(0→2V) (d) a dc voltmeter(0→100V) (d) Two voltage variation knob
N junction diode
(b) Symbol for p-n junction diode.
The immobile space-charge region on either side of the junction together is
potential difference across the junction that tends to prevent the
e n region into the p region, called a barrier potential
When an external voltage V is applied across a semiconductor diode such
is connected to the positive terminal of the battery and n-side to the negative terminal
2 (b) 2 (c)
junction diode under forward bias, (b) Barrier potential (1) without battery, (2) Low battery voltage, and (3) High
Experimental circuit arrangement for studying V-I characteristics of a p
in forward bias .
The direction of the applied voltage (V ) is opposite to the built-in potential
decreases.
V0 – V ).
the applied voltage is small, the barrier potential will be reduced only slightly below the
small number of carriers in the uppermost energy
to cross the junction. So the current first increases very slowly, almost
negligibly, till the voltage across the diode crosses a certain value. , After the characteristic
the barrier height will be reduced, due to increase in minority carrier injection.
diode current increases significantly (exponentially), even for a very small increase in the diode
bias voltage. This voltage is called the threshold voltage or cut-in voltage
When an external voltage (V ) is applied across the diode such
side is negative, it is said to be reverse biased.
The direction of applied voltage is same as the direction of barrier potential.
0 + V ).
in forward bias and reverse bias.
→1mA or 0→1000µA) .
Two voltage variation knob.
charge region on either side of the junction together is
tends to prevent the
barrier potential.
semiconductor diode such that p-side
to the negative terminal it is said
(c)
(b) Barrier potential (1) without battery, (2) Low battery voltage, and (3) High voltage battery.
characteristics of a p-n
in potential V0.
reduced only slightly below the
small number of carriers in the uppermost energy levels—will
the current first increases very slowly, almost
After the characteristic
minority carrier injection., the
a very small increase in the diode
) is applied across the diode such that n-side is
as the direction of barrier potential.

3(a)
Fig 3(a) Diode under reverse bias,
(b) Barrier potential under reverse bias.
(c)Experimental circuit arrangement for studying
junction diode in reverse bias.
Due to drifting of carriers in the presence of junction electric field ,drift current is in few
range and remains constant called
dependent on the applied voltage up
voltage (Vbr ). When V = Vbr, the diode reverse current increases sharply. Even a slight increase
in the bias voltage causes large change in the current.
PROCEDURE
1.The range, least count and zero error of both the voltmeters ,micro ammeter and millammeter
are recorded.
2.After identifying the P and N terminals of given diode, it is connected between the given
Knobs for forward bias in the P
3.Supply is given to P-N junction diode characteristics apparatus and the switch is set to on position.
4.The potential difference across the diode is gradually increased and the voltmeter ,corresponding
milliammeter readings are recorded after suitable interval up to the specified limit.
5. The diode is disconnected from forward bias knob and reconnected between the given
Knobs for reverse bias.
6. The potential difference across the diode is gradually
micro ammeter readings are recorded after suitable interval up to the specified limit.
OBSERVATION
1. Code specification of diode =……………….
2.Maximum current rating =………………….mA
3. Maximum voltage or break down voltage =………….V.
4.TABULATION FOR RANGE,L.C,ZERO ERROR
SL.NO NAME OF METER
1 Milliammeter
2 Microameater
3 Voltmeter (F.B)
4 Voltmeter (R.B)
5.TABULATION FOR (V) AND(I)
3 (b)
under reverse bias,
reverse bias.
Experimental circuit arrangement for studying V-I characteristics of a p
reverse bias.
Due to drifting of carriers in the presence of junction electric field ,drift current is in few
called reverse saturation current. which is not very much
dependent on the applied voltage up to a critical reverse bias voltage, known as
, the diode reverse current increases sharply. Even a slight increase
in the bias voltage causes large change in the current.
range, least count and zero error of both the voltmeters ,micro ammeter and millammeter
After identifying the P and N terminals of given diode, it is connected between the given
P-N junction diode characteristics apparatus.
N junction diode characteristics apparatus and the switch is set to on position.
.The potential difference across the diode is gradually increased and the voltmeter ,corresponding
recorded after suitable interval up to the specified limit.
The diode is disconnected from forward bias knob and reconnected between the given
The potential difference across the diode is gradually increased and the voltmeter ,corresponding
recorded after suitable interval up to the specified limit.
Code specification of diode =……………….
2.Maximum current rating =………………….mA
voltage or break down voltage =………….V.
4.TABULATION FOR RANGE,L.C,ZERO ERROR
RANGE LEAST COUNT
……………….mA ……………….mA
……………….µµµµA ……………….µµµµA
……………….V ……………….V
……………….V ……………….V
5.TABULATION FOR (V) AND(I)
3 (c)
characteristics of a p-n
Due to drifting of carriers in the presence of junction electric field ,drift current is in few µA
which is not very much
to a critical reverse bias voltage, known as breakdown
, the diode reverse current increases sharply. Even a slight increase
range, least count and zero error of both the voltmeters ,micro ammeter and millammeter
After identifying the P and N terminals of given diode, it is connected between the given
N junction diode characteristics apparatus and the switch is set to on position.
.The potential difference across the diode is gradually increased and the voltmeter ,corresponding
The diode is disconnected from forward bias knob and reconnected between the given
increased and the voltmeter ,corresponding
LEAST COUNT ZERO ERROR
……………….mA ……………….mA
A ……………….µµµµA
……………….V
……………….V

SL.NO
P-N JUNCTION IN FORWARD BIAS P-N JUNCTION IN REVERSE BIAS
Voltmeter Reading
in V
Milliammeter reading
in mA
Voltmeter Reading
in V
Microammeter reading
in µµµµA
1
2
3
4
5
6
7
8
9
GRAPH Using data from above table for each set graph is plotted for F.B and R.B, which will
be as below
RESULT1.The I-V characteristic curve of the given p-n junction in forward bias and reverse bias are
shown in the attached graph paper.
2.Thecut in voltage or threshold voltage=………V. 3.Thereverse saturation current is………µA.
4.The reverse break down voltage is ………………….V. SOURCES OF ERROR AND PRECAUTION 1.Voltmeter and milliameter should have appropriate range and least count. 2.The pointer of meters should either be adjusted to zero in the absence of current or zero error of the
instrument should be taken in to count.
3.The variation in V should be done in steps of 0.1V.
4.The terminals of diode should be cheeked and connected to appropriate knob for F.B&R.B.
5.Never cross the limit s specified by the manufacturer ,other wise the diode get damaged.
*****************************

EXPT NO 17
AIM-To draw the characteristic curve of a zener diode and to determine its reverse break down voltage.
APPARATUS REQUIRED –1 Zener diode characteristics apparatus fitted with
(a) a dc micrommeter( 0→250µA) .
(b) a dc voltmeter(0→6V)
(c) voltage variation knob.
2. Zener diode
THEORY
(b)
Fig 1(a) Symbol for Zener diode.
(b)Experimental circuit arrangement for studying characteristics curve of a zener diode in reverse bias.
Zener diode is a special purpose semiconductor diode designed to operate under
reverse bias in the breakdown region. It is fabricated by heavily doping both p-, and n- sides of
the junction. Due to this, depletion region formed is very thin and the electric field of the
junction is extremely high even for a small reverse bias voltage .
When an external voltage (V ) is applied across the Zener diode such that n-side is positive
and p-side is negative, it is said to be reverse biased.
It is seen that when the applied reverse bias voltage(V) increases gradually from zero
on ward there is nearly no increasing in current . As the reverse bias voltage is increased, the
electric field at the junction becomes significant. When the reverse bias voltage V = Vz,( Zener
voltage) then the electric field strength is high enough to pull valence electrons from the host
atoms on the p-side which are accelerated to n-side. So there is a large change in current
produced by almost insignificant change in the reverse bias voltage.
The emission of electrons from the host atoms due to the high electric field is known as
internal field emission or field ionisation.
PROCEDURE
1.The range, least count and zero error of the voltmeter and micro ammeter are recorded.
2.After identifying the P and N terminals of given Zene diode, it is connected between the given
Knobs in the Zener diode characteristics apparatus and the keys are turned on for reverse bias.
3.Supply is given to Zener diode characteristics apparatus and the switch is set to on position.
4.The potential difference across the diode is gradually increased and the voltmeter ,corresponding
micro ammeter readings are recorded after suitable interval up to the specified limit.
5. The potential difference across the diode is gradually increased and the voltmeter ,corresponding
micro ammeter readings are recorded after suitable interval up to the specified limit.
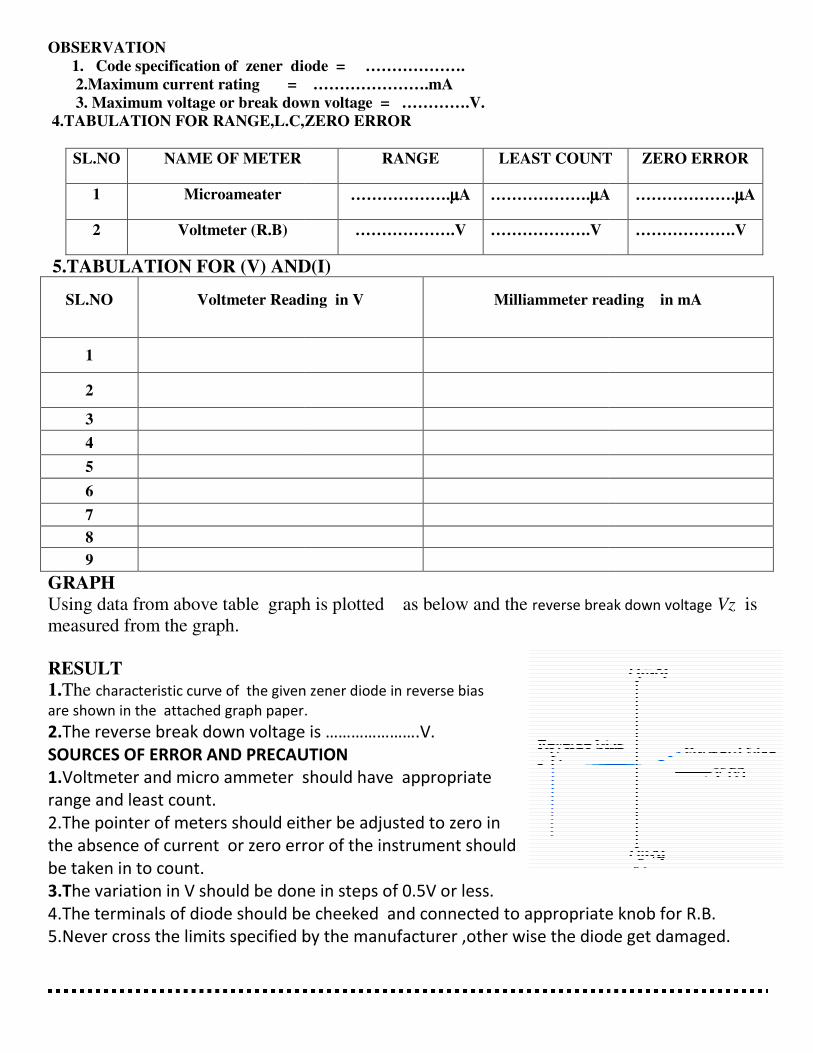
OBSERVATION
1. Code specification of zener diode =
2.Maximum current rating =
3. Maximum voltage or break down voltage = ………….V.
4.TABULATION FOR RANGE,L.C,ZERO ERROR
SL.NO NAME OF METER
1 Microameater
2 Voltmeter (R.B)
5.TABULATION FOR (V) AND(I)
SL.NO Voltmeter Reading in V
1
2
3
4
5
6
7
8
9
GRAPH
Using data from above table graph
measured from the graph.
RESULT
1.The characteristic curve of the given
are shown in the attached graph paper.
2.The reverse break down voltage is ………………….V.
SOURCES OF ERROR AND PRECAUTION
1.Voltmeter and micro ammeter should have appropriate
range and least count.
2.The pointer of meters should either be adjusted to zero in
the absence of current or zero error of the instrument should
be taken in to count.
3.The variation in V should be done in steps of 0.5V or less.
4.The terminals of diode should be cheeked and con
5.Never cross the limits specified by the manufacturer ,other wise the diode get damaged.
diode = ……………….
= ………………….mA
voltage or break down voltage = ………….V.
4.TABULATION FOR RANGE,L.C,ZERO ERROR
RANGE LEAST COUNT
……………….µµµµA ……………….µµµµA
……………….V ……………….V
5.TABULATION FOR (V) AND(I)
Voltmeter Reading in V Milliammeter reading in mA
Using data from above table graph is plotted as below and the reverse break down voltage
the given zener diode in reverse bias
are shown in the attached graph paper.
The reverse break down voltage is ………………….V.
AND PRECAUTION
ltmeter and micro ammeter should have appropriate
pointer of meters should either be adjusted to zero in
the absence of current or zero error of the instrument should
he variation in V should be done in steps of 0.5V or less.
4.The terminals of diode should be cheeked and connected to appropriate knob for R.B.
5.Never cross the limits specified by the manufacturer ,other wise the diode get damaged.
LEAST COUNT ZERO ERROR
A ……………….µµµµA
……………….V
Milliammeter reading in mA
reverse break down voltage Vz is
nected to appropriate knob for R.B.
5.Never cross the limits specified by the manufacturer ,other wise the diode get damaged.