Physics-Based Fragment Acceleration Modeling for ...psam12.org/proceedings/paper/paper_121_1.pdf ·...
12
Probabilistic Safety Assessment and Management PSAM 12, June 2014, Honolulu, Hawaii 1 Physics-Based Fragment Acceleration Modeling for Pressurized Tank Burst Risk Assessments Ted A. Manning a* , Scott L. Lawrence a a NASA Ames Research Center, Moffett Field, CA, USA Abstract: As part of comprehensive efforts to develop physics-based risk assessment techniques for space systems at NASA, coupled computational fluid and rigid body dynamic simulations were carried out to investigate the flow mechanisms that accelerate tank fragments in bursting pressurized vessels. Simulations of several configurations were compared to analyses based on the industry-standard Baker explosion model, and were used to formulate an improved version of the model. The standard model, which neglects an external fluid, was found to agree best with simulation results only in configurations where the internal-to-external pressure ratio is very high and fragment curvature is small. The improved model introduces terms that accommodate an external fluid and better account for variations based on circumferential fragment count. Physics-based analysis was critical in increasing the model’s range of applicability. The improved tank burst model can be used to produce more accurate risk assessments of space vehicle failure modes that involve high-speed debris, such as exploding propellant tanks and bursting rocket engines. Keywords: Physics-based Risk Assessment, Computational Fluid Dynamics, Fluid Structure Interaction, Tank Burst. NOMENCLATURE (..) 00 Initial conditions inside tank (..) 0 Time-evolving bulk conditions enclosed by fragment field (..) ! Far-field, ambient conditions (..) int Fragment wall interior conditions (..) ext Fragment wall exterior conditions N Number of fragments ! Fragment half-angle M t Tank mass A frag Fragment frontal area R frag Inner radius of tank fragment x Radial position of tank fragment t Time ! Characteristic time X Characteristic length " Ratio of specific heats (C p /C v ) a Speed of sound # Nondimensional time g Nondimensional fragment position p Nondimensional pressure $ Density T Temperature V 0 Volume enclosed by fragment field A gap Fragment gap area (total) C d Discharge Coefficient F Baum burst scaling parameter "t Acoustic passing time over fragment half-width. n Expansion term phase-in factor 1. INTRODUCTION * Highly pressurized tanks, which are pervasive in a wide range of industrial and aerospace applications, pose a significant risk to surrounding personnel, structures, and equipment in the event of a structural failure. While the release of the stored content is itself often inherently problematic, high-speed impacts from fragments of the failed tank wall and support structure may be the source of the greatest damage. Crewed space launch vehicles contain a number of pressurized vessels, including cryogenic propellant tanks, helium ullage pressurization tanks, and high-pressure combustion chambers. The burst of any one of these has the potential to damage adjacent systems and compromise the crew module, either directly or through a chain of failures and bursts. Understanding the details of the pressurized tank burst process is therefore important in assessing the risk to crew. As part of comprehensive efforts to develop physics-based risk assessment techniques for space systems at NASA, we carried out numerical simulations to investigate mechanisms for accelerating tank fragments in a two-dimensional representation of pressure vessels found in space launch vehicles. We * [email protected]
Transcript of Physics-Based Fragment Acceleration Modeling for ...psam12.org/proceedings/paper/paper_121_1.pdf ·...

Probabilistic Safety Assessment and Management PSAM 12, June 2014, Honolulu, Hawaii
1!
Physics-Based Fragment Acceleration Modeling for Pressurized Tank Burst Risk Assessments
Ted A. Manninga*, Scott L. Lawrencea
a NASA Ames Research Center, Moffett Field, CA, USA
Abstract: As part of comprehensive efforts to develop physics-based risk assessment techniques for space systems at NASA, coupled computational fluid and rigid body dynamic simulations were carried out to investigate the flow mechanisms that accelerate tank fragments in bursting pressurized vessels. Simulations of several configurations were compared to analyses based on the industry-standard Baker explosion model, and were used to formulate an improved version of the model. The standard model, which neglects an external fluid, was found to agree best with simulation results only in configurations where the internal-to-external pressure ratio is very high and fragment curvature is small. The improved model introduces terms that accommodate an external fluid and better account for variations based on circumferential fragment count. Physics-based analysis was critical in increasing the model’s range of applicability. The improved tank burst model can be used to produce more accurate risk assessments of space vehicle failure modes that involve high-speed debris, such as exploding propellant tanks and bursting rocket engines. Keywords: Physics-based Risk Assessment, Computational Fluid Dynamics, Fluid Structure Interaction, Tank Burst. NOMENCLATURE(..)00 Initial conditions inside tank (..)0 Time-evolving bulk conditions enclosed
by fragment field (..)! Far-field, ambient conditions (..)int Fragment wall interior conditions (..)ext Fragment wall exterior conditions N Number of fragments ! Fragment half-angle Mt Tank mass Afrag Fragment frontal area Rfrag Inner radius of tank fragment x Radial position of tank fragment t Time ! Characteristic time X Characteristic length
" Ratio of specific heats (Cp/Cv) a Speed of sound # Nondimensional time g Nondimensional fragment position p Nondimensional pressure $ Density T Temperature V0 Volume enclosed by fragment field Agap Fragment gap area (total) Cd Discharge Coefficient F Baum burst scaling parameter "t Acoustic passing time over fragment
half-width. n Expansion term phase-in factor
1. INTRODUCTION* Highly pressurized tanks, which are pervasive in a wide range of industrial and aerospace applications, pose a significant risk to surrounding personnel, structures, and equipment in the event of a structural failure. While the release of the stored content is itself often inherently problematic, high-speed impacts from fragments of the failed tank wall and support structure may be the source of the greatest damage. Crewed space launch vehicles contain a number of pressurized vessels, including cryogenic propellant tanks, helium ullage pressurization tanks, and high-pressure combustion chambers. The burst of any one of these has the potential to damage adjacent systems and compromise the crew module, either directly or through a chain of failures and bursts. Understanding the details of the pressurized tank burst process is therefore important in assessing the risk to crew. As part of comprehensive efforts to develop physics-based risk assessment techniques for space systems at NASA, we carried out numerical simulations to investigate mechanisms for accelerating tank fragments in a two-dimensional representation of pressure vessels found in space launch vehicles. We !!!!!!!!!!!!!!!!!!!!!!!!!!!!!!!!!!!!!!!!!!!!!!!!!!!!!!!!* [email protected]

Probabilistic Safety Assessment and Management PSAM 12, June 2014, Honolulu, Hawaii
2!
compared these results to an industry-standard explosion model and proposed some modifications that bring the model more in line with the simulation results. The use of physics-based modeling in estimating debris strike probability is well established in space launch vehicle risk assessments. Reference [1] describes an approach in which a “catalog” of propellant tank debris assigned with mass, position, and velocity forms the initial condition for physics-based analysis to find the probability of debris penetration and loss of the crewed abort vehicle. Although such debris strike predictions use three-degree-of-freedom trajectory and nonlinear structural dynamics analyses, the initial debris catalog is based on engineering judgment and empirical data from a specific explosion scenario. To obtain fragment velocity estimations that more directly reflect the configurations in question, engineering models have been developed to estimate debris velocities from simplified representations of bursting tanks. These models are typically based on one of three physical approaches: energy partition, momentum conservation, or force driven. In energy partition methods, the expansion work of the enclosed fluid is allocated to the blast wave, tank wall fragments, and other energy manifestations (e.g., thermal energy). For example, Baum [2] obtains the upper-limit fragment velocity based on an energy scaling of the tank’s initial operating conditions. In momentum conservation methods, which are typical for liquid storage tanks, the speed of fragments from a full burst is sized from the fluid escape velocity one would obtain in a large but localized breach [3]. In force-driven methods, the evolution of pressure-accelerated wall fragments is directly modeled. Baker, et al. [4] devised a force-driven cylindrical tank burst model that draws from a number of earlier works for spherical and cylindrical tanks [5,6,7]. The model assumes that infinitely long cylindrical wall fragments are driven by the time-varying pressure of the internal fluid, which decreases according to expansion of the enclosed volume and flow through the gaps between the fragments (Figure 1). The model neglects the effect of an external fluid, which may be valid if the internal pressure is very high, but raises concerns regarding its usefulness for sea-level bursts of tanks of more modest pressure. Given its force-driven formulation, the Baker model is readily examined using computational fluid dynamics (CFD) analysis.
Figure 1: Simplified geometry of cylindrical tank burst model (N = 12 fragments).
!! ! In the present work, we conducted time-accurate CFD simulations of bursting cylindrical tanks to evaluate the Baker model and guide any improvements. We utilized the CFD code OVERFLOW [8], and invoked its rigid-body dynamics module to capture fluid interaction with accelerating tank fragments. As in the Baker model, we defined a two-dimensional domain based on the cross-sectional slice of an infinitely long cylindrical tank. While CFD is commonly used to assess blast overpressure risk [9], there are fewer examples in debris acceleration. Wang et al. [10] conducted cylindrical tank burst simulations, but the fracture in this work was considerably different than the present effort, involving only a single break at the mid-plane, perpendicular to the tank axis.
Rfrag
x(t)

Probabilistic Safety Assessment and Management PSAM 12, June 2014, Honolulu, Hawaii
3!
Based on our initial, cylindrical tank simulations, we modified the Baker model to account for external ambient pressure, inner and outer wall expansion and compression, and varying fragment size. Through a detailed comparison of the modeled and simulated peak fragment velocities from bursts of several launch vehicle pressure vessel configurations, we show that, despite the complexity of the tank burst flow, Baker-type models predict maximum fragment velocity reasonably well when internal-to-external pressure ratios are high. We then show that our modified model provides improved fragment velocity predictions over a wider range of conditions, particularly in low-pressure-ratio cases where the original Baker model over-predicts the peak fragment velocity by several times. The modified model will form the basis for constructing new debris catalogs for physics-based risk assessments of crewed launch vehicle failure modes that involve debris strike. Due to subtle geometric inconsistencies found in the Baker model formulation [4], derivations and results shown in this paper that are attributed to the original Baker model reflect the corrected rather than strictly original formulation. In Section 2, beginning with the simplified, two-dimensional representation of a cylindrical tank, we first present the formulation of the Baker model, and follow this with our proposed modifications. In Section 3 we describe the CFD tools that we used to simulate the flow of a bursting tank using the same simplified geometry as the Baker model. In Section 4, we compare the peak velocities from the classic Baker model, modified Baker model, and simulation results to an energy-partition-based velocity limit prediction for five pressure vessel configurations. Finally, we evaluate the detailed fragment velocity and internal pressure trends for two of the five tank configurations. 2. BAKER MODEL AND PROPOSED MODIFICATIONS In this section, the Baker model formulation is described in terms of geometric assumptions and processes affecting pressure evolution, and important steps in the derivation of the governing equations are highlighted. The modifications to the Baker model, which involve adjusting key terms in the original formulation, are then discussed. 2.1. Baker Model The premise of the Baker model is that a cylindrical tank can be approximated using an infinitely long cylinder with fragments that also extend the length of the cylinder. The fragment dynamics can then be assessed in a two-dimensional framework. There are N fragments of equal subtended angle 2!, such that the fragment half-angle is ! = !/N (Figure 1). When the energy of fracture is small compared to the energy of the pressurized fluid [4], fracture dynamics may be neglected, allowing one to consider only the fragment motion due to the pressure field distribution arising from the explosively escaping fluid. The Baker model considers a fragment that is driven by the pressure enclosed within the ring of fragments traveling away from the center of the tank. The internal pressure is assumed to be high enough to neglect the effects of the fluid outside the tank, such that the external pressure is considered zero (a vacuum). The evolution of the decreasing interior pressure is then governed by two effects: 1) fluid loss through the gaps between the fragments and 2) the enlarging volume enclosed by the fragments. The motion of the fragment is then simply governed by a force balance (F = ma). The resulting equations can be solved to obtain fragment positions and velocities as a function of time. The asymptotic or peak velocity that arises from this solution is then typically taken as the terminal velocity of the fragment. The force balance for each fragment is represented in the expression
(1)
where Mt/N is the fragment mass, x(t) is the distance of the fragment from the original tank center, Afrag is the projected frontal area of the fragment in the x direction, and pint and pext are the average pressure on the interior and exterior faces of the tank wall fragment, respectively. The nondimensional variables for time (t), fragment position (x), and bulk interior pressure (p0), are normalized as

Probabilistic Safety Assessment and Management PSAM 12, June 2014, Honolulu, Hawaii
4!
(2)
to characteristic temporal and spatial reference quantities
(3)
and initial interior pressure (p00). These nondimensional parameters reduce Equation 1 to
. (4)
The subscript “00” denotes initial conditions inside the tank, a00 is the interior speed of sound, and " is the ratio of specific heats in the tank interior. The choice of interior and exterior pressure is the modified model’s first point of departure from the original Baker model and will be further discussed in the next section. In Baker, the interior fragment pressure is assumed to be related to the velocity of the fluid at the fragment wall, x´(t), through a one-dimensional isentropic perfect gas relation, whereas the exterior fragment wall pressure, pext, is taken as 0. In nondimensional form, the interior and exterior wall pressures are then
(5)
giving Baker’s nondimensional force-balance equation
. (6)
To augment the force-balance equation, Baker derives a pressure equation from the differential form of the ideal gas equation, which is expressed in terms of the time-varying bulk thermodynamic properties of pressure p0, volume V0, mass m0, gas constant Rgas, and temperature T0 inside the tank: !
. (7)
This equation is of the form A = B + C – D. The density form of the ideal gas law and the adiabatic assumption of constant allow us to express the term C as a function of pressure and combine it with A. The rate at which the bulk pressure falls inside the tank depends on mass loss through the gaps (term B) and volume expansion of the tank as defined by the envelope of fragments (term D). If we assume that the mass flow through the gaps satisfies the conditions for choked (sonic) flow (modulated by a discharge coefficient Cd), then the mass flow can be related to the interior conditions and the gap area Agap. Using the nondimensionalizations of Eqs. 2 and 3, we then obtain Baker’s pressure equation:
(8a)
where

Probabilistic Safety Assessment and Management PSAM 12, June 2014, Honolulu, Hawaii
5!
. (8b)
Eqs. 6 and 8 are the governing equations of the classic Baker model. Eq. 8b reduces the published Baker definition of % by a factor of two by correcting the definition of fragment gap area; we use this corrected definition in both the Baker and modified Baker model results. 2.2. Modifications to the Baker Model Several modifications to the Baker model are proposed based on comparisons with computational results. The modifications are summarized as follows: Force balance equation:
1. Use of one-dimensional receding piston relation to define interior wall pressure 2. Addition of ambient static external pressure 3. Use of one-dimensional advancing piston relation to define exterior wall pressure
Pressure equation:
1. Initial suppression of expansion effect term, followed by phase-in.
With respect to the force-balance equation (Eq. 4), the modification to the method for evaluating the interior wall pressure pint (Figure 2) was guided by the CFD simulation results, which indicated that the internal pressure on the fragments would be better represented using the relation for a receding piston rather than the isentropic formula of Eq. 5. Additionally, the modified method incorporates the external wall pressure pext (which is omitted in Baker’s model) in terms of an ambient pressure p∞ and a compression wave imparted by the moving fragment. Figure 2: Pressure evolution due to fragment motion in modified model (one-dimensional view).
The moving piston relations (see, for example [11]) can be expressed in nondimensional form as:
(9a)
. (9b)
Examination of the CFD simulation results also provided some insight in modeling Baker’s pressure equation (Eq. 8a). The dynamic nature of the expansion process suggested that the term representing expansion effects (term D in Eq. 7) might not be appropriate, at least in the initial phases of the expansion. For this reason, we introduced a phase-in of the expansion effects term, initiated after some delay following initialization. In the present implementation, the delay and phase-in time intervals are
pintpext
p00p0
Expansion
Compression
Initial Tank Pressure
Bulk Pressure
Wall Pressure
Wall Pressure
Ambient Pressure

Probabilistic Safety Assessment and Management PSAM 12, June 2014, Honolulu, Hawaii
6!
based on a simple inverse relationship with the number of fragments. That is, the dynamic effects are assumed to take longer to settle when fewer gaps are available to foster communication between the external and internal conditions. The governing equations of the modified Baker model are obtained by substituting Eqs. 9 into Eq. 4 to obtain the force-balance equation and by multiplying the expansion term of Eq. 8 by a phase-in function to obtain the pressure equation. Both the Baker and modified Baker governing equations are coupled sets of ordinary differential equations, which we solve using the ODE45 function in MATLAB [12]. 3. COMPUTATIONAL FLUID DYNAMICS SIMULATIONS We used the high-fidelity CFD code, OVERFLOW [8], to evaluate the suitability of the Baker model. Where differences were found, the high-fidelity results were used to guide the modifications to the Baker model described in the previous section. OVERFLOW was used to assess the maximum velocity of a tank fragment for the same simplified tank geometry utilized in the Baker and modified Baker analyses. While fluid mechanical simplifications were made regarding the use of two-dimensionality and omission of viscosity, a number of high-fidelity flow properties were retained, including compressibility and multiple gas species. OVERFLOW is an aerospace industry-standard CFD code that is developed and maintained at NASA. It is typically used to compute flow fields about complex aerospace vehicles, including space launch vehicles, and can include energetic flow features such as rocket plumes. To obtain flow fields, OVERFLOW solves unsteady, compressible Navier-Stokes equations on overlapping, structured grids, known as overset meshes, which can accommodate complex and time-varying geometries. It also permits moving bodies to be modeled according to the laws of rigid body dynamics, which are needed in the present research to simulate fragment acceleration. OVERFLOW is used in its two-dimensional mode, and viscosity and turbulence modeling are disabled. For the scale of tanks considered, the dominant forces are governed by inviscid (i.e., pressure) rather than viscous effects. The computational domain is simplified in the manner Baker has taken, where a single fragment is considered within a two-dimensional representation of the cylindrical tank cross-section. Due to the bilateral symmetry of the fragment, the domain is further reduced to a pie-wedge-shaped region with angle !, i.e., as bounded by the black lines in Figure 1. The fragment is an annular piece of the tank wall and is assumed to be fractured at the upper boundary. To simplify the simulation, this pre-fractured portion is represented as an initial gap between the fragment and the domain boundary, typically at 2% of the fragment arc. The lower boundary lies on the bilateral symmetry plane. Figure 3 shows a schematic of the computational domain and the overset mesh around a fragment gap.
Figure 3: Computational domain and overset grid [13] detail at fragment gap (N = 6).
The domain is initialized with a quiescent flow field set to prescribed thermodynamic equilibrium conditions inside and outside the tank. The interface between the high-pressure inner region and
Symmetry Boundary
Symmetry Boundary
Out!ow
Boundary
Fragment Body Grid
Background Grid
Fragment
Trimmed Grid
Fragment Gap
Detail
Probabilistic Safety Assessment and Management PSAM 12, June 2014, Honolulu, Hawaii
7!
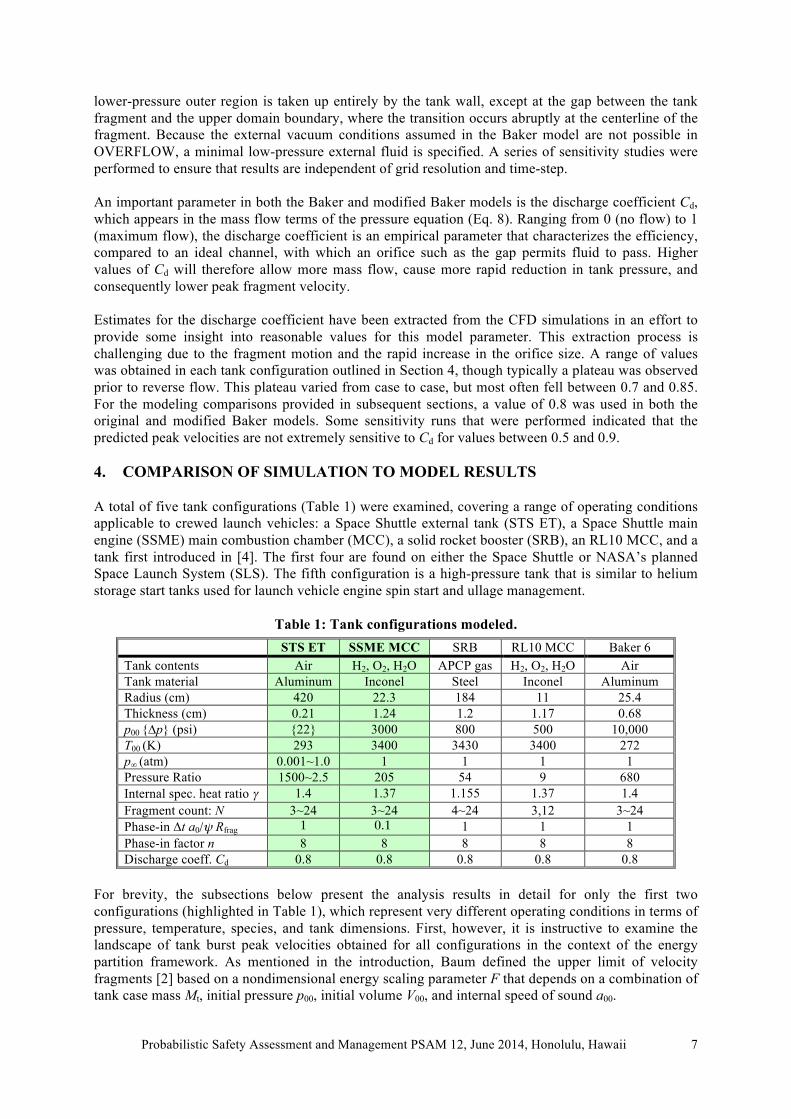
lower-pressure outer region is taken up entirely by the tank wall, except at the gap between the tank fragment and the upper domain boundary, where the transition occurs abruptly at the centerline of the fragment. Because the external vacuum conditions assumed in the Baker model are not possible in OVERFLOW, a minimal low-pressure external fluid is specified. A series of sensitivity studies were performed to ensure that results are independent of grid resolution and time-step. An important parameter in both the Baker and modified Baker models is the discharge coefficient Cd, which appears in the mass flow terms of the pressure equation (Eq. 8). Ranging from 0 (no flow) to 1 (maximum flow), the discharge coefficient is an empirical parameter that characterizes the efficiency, compared to an ideal channel, with which an orifice such as the gap permits fluid to pass. Higher values of Cd will therefore allow more mass flow, cause more rapid reduction in tank pressure, and consequently lower peak fragment velocity. Estimates for the discharge coefficient have been extracted from the CFD simulations in an effort to provide some insight into reasonable values for this model parameter. This extraction process is challenging due to the fragment motion and the rapid increase in the orifice size. A range of values was obtained in each tank configuration outlined in Section 4, though typically a plateau was observed prior to reverse flow. This plateau varied from case to case, but most often fell between 0.7 and 0.85. For the modeling comparisons provided in subsequent sections, a value of 0.8 was used in both the original and modified Baker models. Some sensitivity runs that were performed indicated that the predicted peak velocities are not extremely sensitive to Cd for values between 0.5 and 0.9. 4. COMPARISON OF SIMULATION TO MODEL RESULTS A total of five tank configurations (Table 1) were examined, covering a range of operating conditions applicable to crewed launch vehicles: a Space Shuttle external tank (STS ET), a Space Shuttle main engine (SSME) main combustion chamber (MCC), a solid rocket booster (SRB), an RL10 MCC, and a tank first introduced in [4]. The first four are found on either the Space Shuttle or NASA’s planned Space Launch System (SLS). The fifth configuration is a high-pressure tank that is similar to helium storage start tanks used for launch vehicle engine spin start and ullage management.
Table 1: Tank configurations modeled. STS ET SSME MCC SRB RL10 MCC Baker 6 Tank contents Air H2, O2, H2O APCP gas H2, O2, H2O Air Tank material Aluminum Inconel Steel Inconel Aluminum Radius (cm) 420 22.3 184 11 25.4 Thickness (cm) 0.21 1.24 1.2 1.17 0.68 p00 {"p} (psi) {22} 3000 800 500 10,000 T00 (K) 293 3400 3430 3400 272 p! (atm) 0.001~1.0 1 1 1 1 Pressure Ratio 1500~2.5 205 54 9 680 Internal spec. heat ratio " 1.4 1.37 1.155 1.37 1.4 Fragment count: N 3~24 3~24 4~24 3,12 3~24 Phase-in "t a0/! Rfrag 1 0.1 1 1 1 Phase-in factor n 8 8 8 8 8 Discharge coeff. Cd 0.8 0.8 0.8 0.8 0.8
For brevity, the subsections below present the analysis results in detail for only the first two configurations (highlighted in Table 1), which represent very different operating conditions in terms of pressure, temperature, species, and tank dimensions. First, however, it is instructive to examine the landscape of tank burst peak velocities obtained for all configurations in the context of the energy partition framework. As mentioned in the introduction, Baum defined the upper limit of velocity fragments [2] based on a nondimensional energy scaling parameter F that depends on a combination of tank case mass Mt, initial pressure p00, initial volume V00, and internal speed of sound a00. !

Probabilistic Safety Assessment and Management PSAM 12, June 2014, Honolulu, Hawaii
8!
(9)
When fitted to experimental results, Baum’s upper limit for cylindrical tank peak velocity is !
. (10)
We find that the limit line is consistent with the upper bound of the cases considered in this study (Figure 4), both experimentally and modeled. This adds evidence that the simplified representation of the cylindrical tank assumed in this paper is reasonably valid.
Figure 4: Tank burst velocity peaks compared to velocity limit of Baum [2]. Black symbols are experimental results, colored symbols are simulation and model results.
The burst of any of the tanks considered would generate tank wall fragments that either directly threaten the crew module, even during abort, or begin a cascade of bursts. In each of the two cases presented in detail below, we begin by describing the findings of the CFD simulations. We then compare the velocity and pressure histories of the modified Baker analysis to those of the original Baker formulation and the CFD analyses. The sensitivity of the velocity peak to the fragment count N and external pressure is also presented for the STS ET case. The first configuration is modeled after the oxygen tank of the Space Shuttle external tank, which is similar to the first stage of the planned Space Launch System. The aluminum walls of the ET are very thin compared to the radius and the internal pressure is only a small multiple of standard atmospheric pressure. The second case is the main combustion chamber of the Space Shuttle main engine. It is characterized by very high pressure and temperature. In both cases, we model the internal fluid as an ideal gas, with specific gas constants and ratios of specific heat selected based on weighted averages of the constituents. The CFD simulations show that, in all tank burst cases, the flow field is characterized by jets, preceded by cylindrical shock waves, issuing out of the narrow gaps between the fragments. The fragments accelerate radially from the tank center, a compression wave rises from the leading face of the fragments, the gaps and jets widen, and the internal pressure falls. The shocks then coalesce into a single front and part of the flow recirculates back toward the centerline of the fragments. The shape of the jets is a strong function of the initial pressure ratio; for pressure ratios above the critical value for choked flow, the flow is dominated by a supersonic jet that expands rapidly with respect to radial distance, whereas the jet remains subsonic and narrow for low pressure ratios (Figure 5). Meanwhile,
!"!#$
!"#$
#$
#!$
!"!!#$ !"!#$ !"#$ #$ #!$
!"#$%&'
()*&+,-.(/0))*
1)3# 4
4)
5#6%)!)!#-(,"0)7144)*44)389():)#447;)
%&''()*$+#,-!.$
/01$
2&*3&4(56$+#,-7.$
8(9:;)$+#,<=.$
/;>:$?@A&::@)B@B$1(:(5$
CD@EF&4$
/;3@EG$CE(H$
/;3@EG$2&B$
!"#$%&''%
((&)%&''%
(!*%
(+(%)+%
*,-./%0%

Probabilistic Safety Assessment and Management PSAM 12, June 2014, Honolulu, Hawaii
9!
expansion waves originating from the widening gaps and the trailing edge of the accelerating fragments travel within the tank interior, causing the interior pressure to fall. The internal pressure eventually falls below the external pressure, and the flow relative to the fragments reverses and causes fragment deceleration.
Figure 5: STS ET simulation density contours for N = 12, pext = 0.01 atm (choked, left) and 1 atm (unchoked, right).
4.1. Space Shuttle External Tank To retain a tractable albeit approximate basis for comparing simulation and model results in the low-pressure-ratio and low-tank-wall-mass regimes of the STS ET, we forgo the physics of phase change and assume the tank is filled with ambient-temperature air instead of cryogenic liquid propellant and ullage gases. The ET pressure is only a small multiple of standard atmospheric pressure (1.5 atmospheres above the external pressure), and the tank wall is a very small fraction of the initial tank radius. As a result, the external pressure plays an important role in the fragment dynamics. Despite being relatively thin, the tank walls were assumed to be rigid and deformation of the tank wall was not modeled. The STS ET oxygen tank is rated to 22-psi gauge pressure, such that the gauge pressure ("p = p00 – p!) is held constant with decreasing external pressure during normal ascent, giving decreasing internal pressures with altitude. The internal pressure in the simulations and the modified Baker model is set according to p00 = "p + p!. However, because the original Baker model omits the external fluid, we set the Baker model pressure to p00 = "p for all p!. The values of the parameters in the modified Baker model (phase-in "t, n) were selected to produce the best match with simulation results. Simulation and model results for STS ET fragment peak velocities as functions of fragment count N and external pressure pext (in terms of equivalent altitude) are presented in Figure 6 and Figure 7, respectively. The simulation results indicate that the variation of peak fragment velocity at pext = 1 atm (sea level) is only a weak function of fragment count, reaching a maximum of just below 100 m/s for 10 or more fragments and rising only slightly at smaller counts (Figure 6a). The modified Baker result captures this trend well, whereas the classic Baker model vastly over-predicts the peak and produces the opposite trend in small N. The time history of the N = 12 case at sea level (Figure 6b) shows an early velocity peak followed by a decay in the OVERFLOW results. The modified Baker result reproduces the velocity rise and peak, but diverges slightly on the decay. The internal pressure trace (Figure 6c) shows a rapid fall punctuated by periodic waves that, based on the simulations, can be attributed to the multiple passings of the expansion wave from the initial opening of the fragment gap. The modified Baker model captures the internal pressure well up to the second expansion wave passing, at which point the solutions diverge slightly. The simulation shows that the internal pressure falls below the external pressure (below p0/p00 # 0.4), whereas the modified Baker model decays more slowly. The classic Baker results exhibit large error at pext = 1 atm due to its inability to account for the external pressure. As effective altitude increases (lowering external pressure), the simulation results predict that the fragment velocity increases toward an asymptotic maximum of around 270 m/s. The modified Baker model captures this trend well. As shown in Figure 7a, the modified Baker and simulation results agree

Probabilistic Safety Assessment and Management PSAM 12, June 2014, Honolulu, Hawaii
10!
in peak velocity over a range of effective altitudes. The original Baker result, which is independent of altitude, agrees best with the simulation result at higher altitudes. For example, at the effective altitude of 48 km (pext = 0.001 atm, Figure 7b and c), both Baker models nearly reproduce the simulations results in velocity and internal pressure, with a slight edge to the modified model. Figure 6: STS ET results at pext = 1 atm: (a) Peak velocity sensitivity to N, (b) velocity at N = 12,
and (c) internal pressure history at N = 12.
Figure 7: STS ET results at N = 12: (a) Peak velocity vs. effective altitude, (b) velocity at pext = 0.001 atm, and (c) internal pressure history at pext = 0.001 atm.
! ! !
4.2. Space Shuttle Main Engine Main Combustion Chamber The Space Shuttle main engine, which is also now called RS-25 on the core stage of the SLS, operates its main combustion chamber at very high pressures and temperature due its staged combustion cycle. A burst of this chamber could send fragments into critical thrust vector control systems, high-pressure helium tanks, propellant feed-lines, or the core stage tanks directly. Unlike the STS ET, the internal fluid is modeled as a separate species from the external air, since the low molecular weight of the hydrogen fuel will affect the gas properties. While the actual, roughly cylindrical combustion chamber walls contain coolant channels, the walls in the model were simplified to solid annuli that achieve the same axial and azimuthal mass distribution. The expansion effect phase-in parameters for the modified Baker model were retuned to the values indicated in Table 1 to achieve better agreement with simulation results.
0 5 10 15 20 250
50
100
150
200
250
300
350
400
Velo
city
(m/s
)
Number of Fragments
Ove owBaker ClassicBaker, Modi edBaum V for F = 0.9328
0 1 2 3 4 50
50
100
150
200
250
300
350
400
Nondimensional Time ta00/Rfrag
Velo
city
(m
/s)
Baker, OriginalBaker, Modi edOve ow
0 1 2 3 4 50
0.1
0.2
0.3
0.4
0.5
0.6
0.7
0.8
0.9
1
Inte
rnal
Wal
l Pre
ssur
e p
int/p
00
Baker, OriginalBaker, Modi edOve ow Centerline
Nondimensional Time ta00/Rfrag
0 5 10 15 20 25 30 35 40 45 500
50
100
150
200
250
300
350
400
Velo
city
(m/s
)
Effective Altitude (km)
Ove owBaker ClassicBaker, Modi edBaum V for F = 0.9328
0 1 2 3 4 50
50
100
150
200
250
300
350
400
Baker ClassicBaker, Modi edOve ow
Nondimensional Time ta00/Rfrag
Velo
city
(m/s
)
0 1 2 3 4 50
0.1
0.2
0.3
0.4
0.5
0.6
0.7
0.8
0.9
1
Baker ClassicBaker, Modi edOve ow Centerline
Inte
rnal
Wal
l Pre
ssur
e p
int/p
00
Nondimensional Time ta00/Rfrag

Probabilistic Safety Assessment and Management PSAM 12, June 2014, Honolulu, Hawaii
11!
Visualizations of the OVERFLOW simulation results (Figure 8) again show supersonic jets issuing from the fragment gaps. There are propagating shocks inside the jet and numerous vortical structures. Despite this complexity, the simulations suggest again that the peak velocity is only a weak function of the fragment count, though with a slight decrease at low N instead of the increases seen in the other configurations. With retuned expansion term phase-in parameters (Table 1), the modified Baker model peak velocities agree better with the simulation results than the classic Baker, at least in the high-N limit. Both models predict a stronger dependence on fragment count at low N. At N = 12, the velocity over-prediction by the classic Baker model, despite the very good agreement in internal pressure, is attributed to the lack of external pressure. Figure 8: SSME MCC simulation Mach number contours for N = 12, with reverse flow shown in
fourth image.
Figure 9: Velocity, internal pressure, and peak velocity results for SSME MCC.
5. CONCLUSIONS In an effort to introduce high-fidelity, physics-based analysis to catastrophic failure propagation modeling in crewed launch vehicle risk assessments, the Baker engineering model for estimating the maximum velocities of fragments from bursting pressurized cylindrical tanks was updated using the results of coupled CFD and rigid body dynamic simulations. Time-accurate, two-dimensional, inviscid flow simulations were carried out on five pressurized tank configurations over a range of fragment sizes and external pressures. The tank configurations varied in terms of internal pressure regime, temperature, gas properties, and tank wall mass and thickness. The modifications to the engineering model included the addition of external atmospheric pressure, local internal and external effects based on one-dimensional piston theory, and measures to account for fragment curvature. Simulation results were also used to calibrate modeling parameters such as the discharge coefficient.
Mach0.0 5.9 Mach0.0 5.1
Mach0.0 3.6 Mach0.0 2.4
t a00/Rfrag = 10.7
t a00/Rfrag = 5.36t a00/Rfrag = 2.68
t a00/Rfrag= 21.4
0 5 10 15 20 250
20
40
60
80
100
120
140
160
180
200
Velo
city
(m/s
)
Number of Fragments
Ove owBaker ClassicBaker, Modi edBaum V for F = 0.0161
0 5 10 15 200
20
40
60
80
100
120
140
160
180
200
Velo
city
(m/s
)
Baker ClassicBaker, Modi edOve ow
Nondimensional Time ta00/Rfrag
0 5 10 15 2010-3
10-2
10-1
100
Baker ClassicBaker, Modi edOve ow Centerline
Nondimensional Time ta00/Rfrag
Inte
rnal
Wal
l Pre
ssur
e p
int/p
00

Probabilistic Safety Assessment and Management PSAM 12, June 2014, Honolulu, Hawaii
12!
As a plausibility check for the simplified tank representation used in the models and simulations covered in this paper, the velocity peaks of all five simulated and modeled tank configurations were scaled and found to comply with a velocity bound from an energy-partition-based prediction. Among the two tank configurations presented in detail, the modified Baker model was found to agree better with the simulation-based predictions for maximum fragment velocity than the original model in nearly all of the conditions examined, although this advantage diminished at high pressure ratios. The modified model was found to be extremely reliable in the low internal-to-external pressure ratio case of the propellant tank across all ranges of fragment counts at sea level, where the original model did not produce a useful result. The modified model was still found to be a reliable predictor in the high fragment count limit of the high-pressure, high-temperature case of the Space Shuttle main engine combustion chamber, but fared less well in the low fragment count limit, where the original Baker model also over-predicted a drop in peak velocity. Future work on the modified model will be directed at improving the low fragment count (large fragment curvature) predictions in high-temperature and high-pressure cases. The effect of evaporating cryogenic propellants will also be considered. The modified engineering model will be used to help improve the definition of fragment velocities in debris catalogs used for debris strike risk assessments of crew modules and other vulnerable crew launch vehicle systems.
References
[1] K. Gee. and S. L. Lawrence, “Launch Vehicle Debris Models and Crew Vehicle Ascent Abort Risk,” Reliability and Maintainability Symposium (RAMS), Orlando, FL, January 2013.
[2] M. R. Baum, “Disruptive Failure of Pressure Vessels: Preliminary Design Guidelines for Fragment Velocity and the Extent of the Hazard Zone,” ASME Pressure Vessels and Piping Conference, San Diego CA, June 1987.
[3] W. M. Hinckley, D. L. Lehto, N. L. Coleburn, A. J. Gorechlad, J. M. Ward, and J. Petes, “Space Shuttle Range Safety Command Destruct System Analysis and Verification. Phase II – Ordnance Options for a Space Shuttle Range Safety Command Destruct System,” NSWC Technical Report 80-417, March 1981.
[4] W. E. Baker, J. J. Kulesz, R. E. Ricker, R. L. Bessey, P. S. Westine, V. B. Parr, and G. A. Oldham, “Workbook for predicting pressure wave and fragment effects of exploding propellant tanks and gas storage vessels,” Contractor Report CR-134906, NASA (1977).
[5] W. E. Baker, V. B. Parr, R. L. Bessey, and P. A. Cox, “Assembly and Analysis of Fragmentation Data for Liquid Propellant Vessels,” Contractor Report CR-134538, NASA (1974).
[6] R. L. Bessey, “Fragment Velocities from Exploding Liquid Propellant Tanks,” The Shock and Vibration Bulletin, Part 3: Shock Testing, Shock Analysis. Naval Research Laboratory, Aug. 1974, pp. 133-139.
[7] D. E. Taylor, C. F. Price, “Velocity of Fragments From Bursting Gas Reservoirs,” Journal of Engineering for Industry, Nov. 1971.
[8] R. H. Nichols, R. W. Tramel, and P. G. Buning, “Solver and Turbulence Model Upgrades to OVERFLOW 2 for Unsteady and High-Speed Applications,” AIAA Paper 2006-2824, June 2006.
[9] S. L. Lawrence, D. L. Mathias, K. Gee, and M. Olsen “Simulation Assisted Risk Assessment: Blast Overpressure Modeling,” PSAM-0197, 8th International Conference on Probabilistic Safety Assessment and Management (PSAM8), New Orleans, LA, May 2006.
[10] J. C. T. Wang, M. F. Werner, and D. R. Langley, “Transient Flowfield from a Ruptured Pressurized Cylinder,” AIAA Paper No. 1998-2658, 29th AIAA Fluid Dynamics Conference, Albuquerque, NM, June 1998.
[11] H. W. Liepmann, and A. Roshko, “Elements of Gas Dynamics,” John Wiley and Sons, 1957. [12] The MathWorks, MATLAB vR2014a. http://www.mathworks.com/help/matlab/ref/ode45.html [13] W. Chan, R. Gomez, S. Rogers, and P. Buning, “Best Practices in Overset Grid Generation,”
AIAA-2002-3191, 32nd AIAA Fluid Dynamics Conference, St. Louis, MO, June 24-26, 2002.