Physicochemical, Functional and Bioactive Properties of ...
17
Physicochemical, Functional and Bioactive Properties of Pea (Pisum sativum L.) Pods Microwave and Convective Dried Powders Lynda Hadjout ( [email protected] ) Universite de Bejaia Faculte des Sciences de la Nature et de la Vie https://orcid.org/0000-0002-6130- 9103 Farid Dahmoune Universite de Bouira https://orcid.org/0000-0001-6072-0411 Mohamed Hentabli Universite Dr Yahia Fares de Medea https://orcid.org/0000-0002-6693-0708 Giorgia Spigno Universita Cattolica del Sacro Cuore Khodir Madani Universite de Bejaia Faculte des Sciences de la Nature et de la Vie https://orcid.org/0000-0001-5356- 6890 Research Article Keywords: Pea pods powders, microwave drying, Convective drying, color, functional properties, bioactive compounds Posted Date: November 2nd, 2021 DOI: https://doi.org/10.21203/rs.3.rs-951507/v1 License: This work is licensed under a Creative Commons Attribution 4.0 International License. Read Full License
Transcript of Physicochemical, Functional and Bioactive Properties of ...
Physicochemical, Functional and BioactiveProperties of Pea (Pisum sativum L.) PodsMicrowave and Convective Dried PowdersLynda Hadjout ( [email protected] )
Universite de Bejaia Faculte des Sciences de la Nature et de la Vie https://orcid.org/0000-0002-6130-9103Farid Dahmoune
Universite de Bouira https://orcid.org/0000-0001-6072-0411Mohamed Hentabli
Universite Dr Yahia Fares de Medea https://orcid.org/0000-0002-6693-0708Giorgia Spigno
Universita Cattolica del Sacro CuoreKhodir Madani
Universite de Bejaia Faculte des Sciences de la Nature et de la Vie https://orcid.org/0000-0001-5356-6890
Research Article
Keywords: Pea pods powders, microwave drying, Convective drying, color, functional properties, bioactivecompounds
Posted Date: November 2nd, 2021
DOI: https://doi.org/10.21203/rs.3.rs-951507/v1
License: This work is licensed under a Creative Commons Attribution 4.0 International License. Read Full License
1
Physicochemical, functional and bioactive properties of pea (Pisum sativum L.) pods 1
microwave and convective dried powders 2
3
Lynda Hadjout-Krimat1*, Farid Dahmoune1,2, Mohamed Hentabli3 ,Giorgia Spigno4 ,Khodir Madani1,5 4
5
1Laboratoire de Biomathématiques, Biophysique, Biochimie, et Scientométrie (L3BS), Faculté des Sciences de la 6
Nature et de la Vie, Université de Bejaia, 06000 Bejaia, Algeria. 7
2Département de Biologie, Faculté des Sciences de la Nature et de la Vie et des Sciences de la Terre, Université 8
de Bouira, 10000Bouira, Algeria. 9
3Laboratory of Biomaterials and Transport Phenomena (LBMPT), Faculty of Technology, University Yahia 10
Fares of Médéa, 26000, Médéa, Algeria 11
4DiSTAS – Department for SustainableFoodProcess, Università Cattolica del Sacro Cuore, Via Emilia 12
Parmense 84, 29122 Piacenza, Italy. 13
5Centre de Recherche en Technologies Agro-alimentaires (CRTAA), 06000 Bejaia, Algeria. 14
15
16
Corresponding authors: 17
Address: Laboratoire de Biomathématiques, Biophysique, Biochimie, et Scientométrie (L3BS), Faculté des 18
Sciences de la Nature et de la Vie, Université de Bejaia, 06000 Bejaia, Algeria. 19
Tel.: +213698553029 20
E-mail: [email protected] / [email protected] 21
(L. Hadjout) https://orcid.org/0000-0002-6130-9103 22
23
Conflict of interest term form 24
The present work has no known conflicts of interest associated and there has been no significant financial 25 support that could have influenced its outcome. 26 27
Data availability statement 28
Authors can confirm that all data generated during the study are included in the article and/or its supplementary 29
information files. 30
31
Keywords: Pea pods powders; microwave drying; Convective drying; color; functional properties; bioactive 32
compounds. 33
34
35
2
Abstract 36
As the primary by‐product of pea processing industry, pea pods represent a rich source of various high-value 37
molecules. The aim of this work is to investigate the effect of nine different microwave output powers (200 to 38
1000 W) and five different ventilated oven temperatures (40, 60, 80, 100 and 120 °C) on the quality of pea pod 39
such as physical-chemical (water activity, total color change), functional properties (water retention capacities 40
and swelling capacity) and bioactive properties (total phenolic content, total flavonoid content and antioxidant 41
capacity). The results show that microwave drying reduced significantly the drying time. Convective drying led 42
to a greater color change than microwave drying. Convective drying at 80 °C for 135.33 min appeared the best 43
process in terms of functional properties giving the highest values of water retention capacity and swelling 44
capacity. Both microwave and convective drying methods could increase phenolic and antioxidant compounds 45
content of pea pods. It was suggested that the microwave method can be a promising technology for drying the 46
pea pods due to the shorter drying time, and higher product quality. 47
48
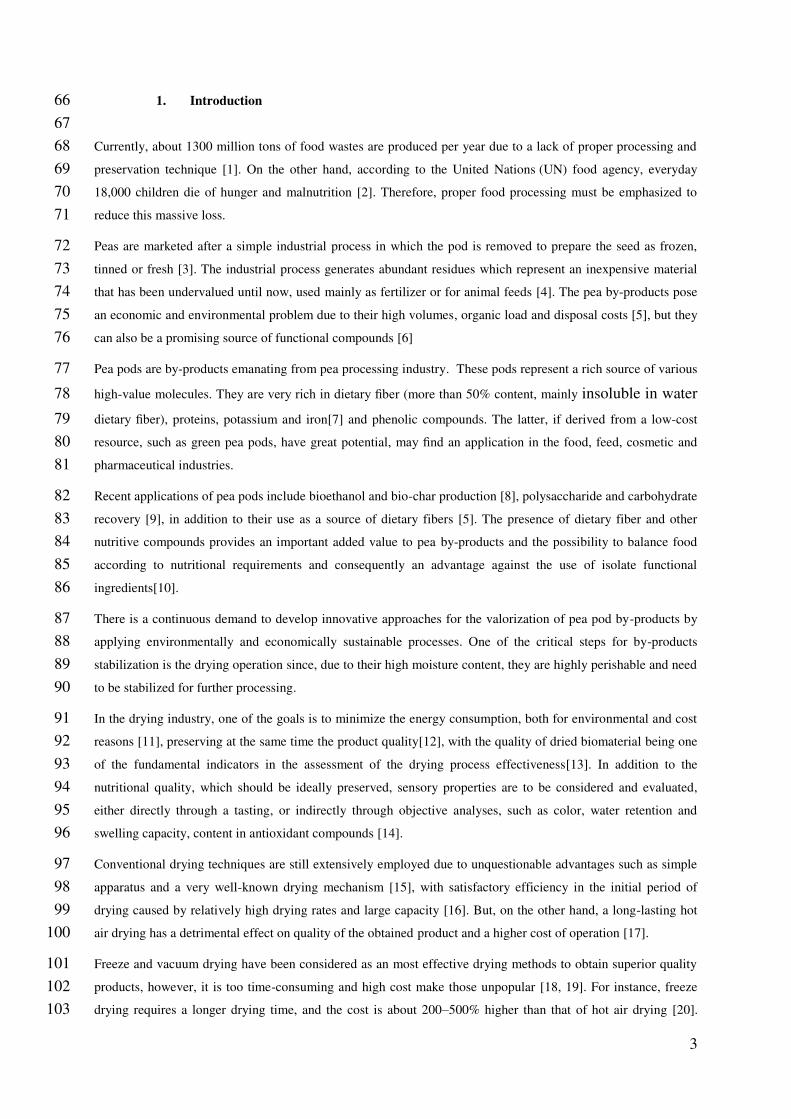
Graphical Abstract 49
50
51
Statement of Novelty 52
Drying of by-products from pea processing industry was investigated as a critical step prior to their 53
valorization for energy and fuel production as well as chemicals recovery. The drying of pea pods has never been 54
investigated before which is the case of the present study. Our research work reported that microwave drying 55
technique can be used for conservation of this valuable product by preserving quality of fresh materials and to 56
economizing energy and time. 57
58
59
60
61
62
63
64
65
3
1. Introduction 66
67
Currently, about 1300 million tons of food wastes are produced per year due to a lack of proper processing and 68
preservation technique [1]. On the other hand, according to the United Nations (UN) food agency, everyday 69
18,000 children die of hunger and malnutrition [2]. Therefore, proper food processing must be emphasized to 70
reduce this massive loss. 71
Peas are marketed after a simple industrial process in which the pod is removed to prepare the seed as frozen, 72
tinned or fresh [3]. The industrial process generates abundant residues which represent an inexpensive material 73
that has been undervalued until now, used mainly as fertilizer or for animal feeds [4]. The pea by-products pose 74
an economic and environmental problem due to their high volumes, organic load and disposal costs [5], but they 75
can also be a promising source of functional compounds [6] 76
Pea pods are by-products emanating from pea processing industry. These pods represent a rich source of various 77
high-value molecules. They are very rich in dietary fiber (more than 50% content, mainly insoluble in water 78
dietary fiber), proteins, potassium and iron[7] and phenolic compounds. The latter, if derived from a low-cost 79
resource, such as green pea pods, have great potential, may find an application in the food, feed, cosmetic and 80
pharmaceutical industries. 81
Recent applications of pea pods include bioethanol and bio-char production [8], polysaccharide and carbohydrate 82
recovery [9], in addition to their use as a source of dietary fibers [5]. The presence of dietary fiber and other 83
nutritive compounds provides an important added value to pea by-products and the possibility to balance food 84
according to nutritional requirements and consequently an advantage against the use of isolate functional 85
ingredients[10]. 86
There is a continuous demand to develop innovative approaches for the valorization of pea pod by-products by 87
applying environmentally and economically sustainable processes. One of the critical steps for by-products 88
stabilization is the drying operation since, due to their high moisture content, they are highly perishable and need 89
to be stabilized for further processing. 90
In the drying industry, one of the goals is to minimize the energy consumption, both for environmental and cost 91
reasons [11], preserving at the same time the product quality[12], with the quality of dried biomaterial being one 92
of the fundamental indicators in the assessment of the drying process effectiveness[13]. In addition to the 93
nutritional quality, which should be ideally preserved, sensory properties are to be considered and evaluated, 94
either directly through a tasting, or indirectly through objective analyses, such as color, water retention and 95
swelling capacity, content in antioxidant compounds [14]. 96
Conventional drying techniques are still extensively employed due to unquestionable advantages such as simple 97
apparatus and a very well-known drying mechanism [15], with satisfactory efficiency in the initial period of 98
drying caused by relatively high drying rates and large capacity [16]. But, on the other hand, a long-lasting hot 99
air drying has a detrimental effect on quality of the obtained product and a higher cost of operation [17]. 100
Freeze and vacuum drying have been considered as an most effective drying methods to obtain superior quality 101
products, however, it is too time-consuming and high cost make those unpopular [18, 19]. For instance, freeze 102
drying requires a longer drying time, and the cost is about 200–500% higher than that of hot air drying [20]. 103
4
Whereas, vacuum drying needs higher initial and operating cost to maintain low pressure throughout the drying 104
process [21]. Consequently, novel drying methods are emerging to deal with the weakness of conventional, 105
freeze and vacuum drying and create high-quality products. 106
Microwave drying, a relatively new technology, has been recommended as a fast and effective alternative drying 107
technique [22]. Microwave-assisted thermal conversion of biomass has received significant attention in recent 108
years as it is capable of improving the process efficiency and product quality through rapid volumetric heating 109
[23]. 110
In the literature several vegetables were dried using the microwave drying methods. Some of them are; Green 111
Bean Slices [24], asparagus [25], mushroom [26], eggplant [27] green peas [28]. As it seen from the literature 112
the drying effect on the quality of pea pods has never been investigated before which is the case of the present 113
study whose objectives were: (i) to determine and evaluate quality of pea pods powders obtained by convective 114
and microwave drying methods, (ii) to compare two processes: convection drying and microwave drying of pea 115
pods, and finally (iii) to find the most suitable drying conditions among the applied ones for achieving high-116
quality pea pods powders. 117
2.Materials and methods 118
2.1 Raw material 119
Good quality fresh and matured fruits of green peas (Pisum sativum L.) were purchased from the local market 120
(Bejaia, Algeria). The fruits were sorted, washed with tap water followed by distilled water to remove the dust, 121
shelled and the two recovered half-pods cut into approximately equal parts with dimension of about 1 cm2 and 122
0.3 cm thickness. 123
2.2 Drying procedures 124
For microwave drying (MWD), a domestic microwave (Maxipower, Model MASMO23S, China) with 2450 kHz 125
working frequency was used. The microwave was equipped with cavity dimensions of 22.5 cm × 37.5 cm × 38.6 126
cm and a digital control system for microwave power (the latter linearly adjustable from 100 to 1000 W) and 127
irradiation time. Approximately, 100 g of pea pods pieces were spread uniformly in a monolayer on the plate and 128
dried at nine different microwave powers (200, 300, 400, 500, 600,700, 800, 900 and 1000 W) until constant 129
weight. Conventional drying (CD) experiments were performed in a ventilated oven (Memmert, ULE-600, 130
Germany). Approximately100 g of pea pods pieces were spread uniformly in a monolayer on the oven tray 131
(38.5 cm × 27 cm) and dried at five different temperatures (40, 60, 80, 100 and 120 °C) and air velocities of 1.0 132
m/s until constant weight. Three repetitions were performed for each temperature and power, and the data 133
provided were an average of these results. 134
The dried pod pieces were crushed using an electric grinder (IKA model A11 basic), and sieved using an 135
automatic sieve shaker (Rheinische Str.36 model D-42781 Haan) in order to obtain a fine and homogeneous 136
powder. The resulting powders were stored in glass jars, hermetically sealed, protected from light, until use. 137
138
5
The moisture content (MC) of the fresh and dried pea pods samples was evaluated according to the Schulze, 139
Hubbermann [29]. The results were expressed as a percentage of the wet base. 140
141
142
2.1 Physicochemical properties 143
Determination of water activity (aw) 144
Water activity (aw) was measured at 25 °C using an AquaLab Series 4TEV water activity meter (Decagon 145
Devices, Inc., Pullman, Washington, United States). 146
Color measurement 147
The surface color of fresh and dried samples was determined by a colorimeter (Minolta CR-400, Konica 148
Minolta, Japan) in five different points on the sample surface. The CIE Lab color parameters were used to 149
describe the color of samples, where L* indicates lightness, a* indicates chromaticity on a green (−) to red (+) 150
axis and b* indicates chromaticity on a blue (−) to yellow (+) axis. The total color change ∆E between fresh and 151
dried product was calculated with Eq. (1)[30]: 152
153
∆𝐸 = √(∆𝐿∗)2 + (∆𝑎∗)2 + (∆𝑏∗)2
154
155
156
2.4 Functional properties 157
Swelling Capacity (SC) 158
The Swelling Capacity (SC)was analyzed by the method described by Robertson, de Monredon [31]. One 159
hundred milligrams of dry weight of sample were hydrated in a measuring cylinder with 10mLdistilled water at 160
room temperature. After 18 h, the final volume (mL) was recorded, and SC was expressed as volume (mL)/g of 161
original substrate dry weight. 162
Water-Holding Capacity (WHC) 163
The Water-Holding Capacity (WHC) was according to the method described byLv, Liu [32]: distilled water (15 164
mL) was transferred into centrifuge tubes containing 250 mg of sample. The mixture was agitated and kept at 165
room temperature for 24 h. After centrifugation at 3641rpm for 1 h, the mixture was filtrated using quantitative 166
filter paper and residue fresh weight was recorded. WHC was expressed as grams of water per gram of dry 167
weight, respectively. 168
169
2.5 Bioactive properties 170
2.5.1 Total Phenolic Content (TPC) 171
6
To evaluate the total phenolic content, dried pea pods powders were extracted using an ultrasonic processor 172
(SonicsVCX 500, Connecticut, USA) according to the protocol proposed by Dahmoune, Boulekbache [33]. 173
Briefly, one gram of dried pea pods powder was extracted with 40 mL (w/v) of 64%ethanol (v/v) at 77.79% of 174
amplitude during 15.05 min of holding time. The extracts were filtered using filter paper Whatman n°3 and 175
transferred to 100 mL volumetric flask. 176
Total phenolic content was determined spectrophotometrically using the Folin–Ciocalteu colorimetric method. A 177
2.5 mL sample of distilled water-diluted Folin-Ciolcateu reagent (1/10) was added with 1 mL of the extract. 178
After incubation for 2 min at room temperature, 2 mL of sodium carbonate (75g·L–1) were added.the mixture 179
was incubated for 15 min at 50 °C and finally cooled in a water-ice bath. The absorbance at 760 nm 180
(SHIMADZU UV-1800, Japan) was immediately measured [34] against the blank (obtained with the same 181
protocol but with ethanol instead of the extract). Results were expressed as gallic acid equivalents content of pea 182
pods (mgGAE/gDW) by means of a calibration curve obtained with a standard of gallic acid dissolved in ethanol in 183
the 0.02 to 0.12 mg/mL concentration range. The same extract was used to evaluate the content of flavonoids and 184
antioxidant activity. 185
186
2.5.2 Flavonoid content 187
Flavonoid content was estimated by the AlCl3 (Aluminium chloride) method [35]: 1 mL of the extract solution 188
was added to 1 ml of 2% methanolic AlCl3·6H2O. The absorbance was read 10 min later at 430 nm against a 189
blank. The flavonoid contents were expressed as equivalents (mg quercetin/gDW) by means of a calibration 190
curve obtained with standard quercetin (dissolved in ethanol concentration range 0.01to 0.06 mg/mL) treated in 191
the same conditions. 192
193
2.5.3 DPPH° Radical-scavenging activity assay 194
The free radical scavenging activity was determined according to the method described by Mishra, Ojha [36] and 195
Sharma and Bhat [37]. Briefly, 0.1 mL of the extract were mixed with 3.9 mL of a 6 × 10⁻⁵ M methanol DPPH 196
solution. The mixtures were vigorously shaken and left standing at room temperature in the dark for 30 min, and 197
the final absorbance was measured at 517 nm. The results were expressed as a percentage effect (I%) of control 198
absorbance reduction (Eq. 2) 199
Percentage effect (I%) = (AbsControl − AbssampleAbsControl ) × 100 (2)
Different sample dilutions in methanol were used in order to obtain anti radical curves and calculate the 200
IC50 values, which is the extract concentration for a 50% percentage effect. The I% was plotted versus pea pods 201
powder concentration. 202
203
2.5.4 Ferric reducing power assay (FRAP) 204
The reducing power was performed according to the method reported byFerreira, Baptista [38]. Various 205
concentrations of pea pod ethanolic extracts (2.5 mL) were added to 2.5 mL of phosphate buffer (200 mM, pH 206
7
6.6) followed by 2.5 mL of 1% potassium ferricyanide. The reacting mixture was then incubated in a water bath 207
at 50 °Cfor 20 minutes. The reaction was stopped by adding2.5 mL of 10% (w/v) trichloroacetic acid and the 208
content was centrifuged at 650 rpm for 10 min. To 5 mL of the supernatant was added 5 mL of distilled water 209
and 1 mL of 0.1% ferric chloride and the resulting mixture was vortexed and finally the absorbance was read at 210
700 nm. The reductive potential was expressed as EC50 (µg/mL) related to the pea pods powder corresponding 211
to 50% absorbance intensity. 212
2.6 Parameter estimation and statistical methods 213
Three replications of each drying experiment were carried out and triplicate samples of each experiment were 214
analyzed. All assays were carried out in triplicate and the results are expressed as mean values ± standard 215
deviations. The effect of microwave drying power and oven drying temperature on the estimated parameters of 216
the best fitted model was statistically evaluated using analysis of variance (ANOVA). ANOVA was performed 217
using JMP7 Statistics Software. Tukey’s multiple range test (HSD) was used to compare means of the estimated 218
kinetic parameters. Evaluations were based on the α=0.05 level Move 219
. 220
3. Results and discussion 221
3.1 Physicochemical properties 222
Drying of the pea pods started with an initial moisture content around 87.79 ± 0.195% and continued until no 223
further changes in their mass were observed, e.g., to a final moisture content of about 10% which was then taken 224
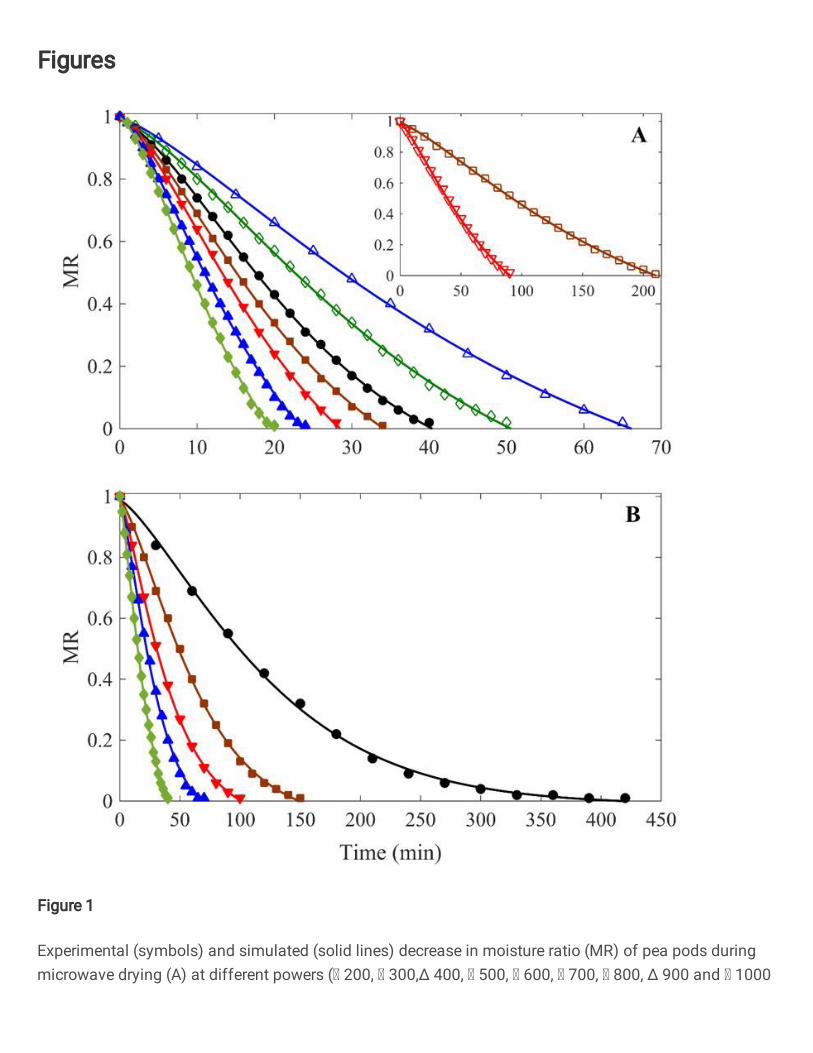
as the equilibrium moisture content in the next computations. The changes in MR with time during drying of the 225
pea pods are shown in Figure 1. 226
Drying temperature and microwave power have a significant effect on drying time with drying time decreasing 227
considerably with increasing oven temperature or microwave power. The required drying time to equilibrium 228
moisture in conventional drying at 40, 60, 80, 100 and 120°C was about 850 ± 22.91, 206.33 ± 4.61, 229
135.33 ± 6.42, 86.33 ± 5.68 and 50.16 ± 1.25 min, respectively. At higher drying temperatures, the heat transfer 230
rate and mass transfer rate increase leading to faster moisture evaporation and shorter drying duration[39]. In 231
microwave drying, time to reach equilibrium moisture at 200, 300, 400, 500, 600, 700, 800, 900 and 1000 W was 232
about 217.11 ± 0.67, 99.05 ± 2.04, 72.91 ± 0.79, 53.88 ± 0.29, 44 ± 0.94, 37.55 ± 0.34, 32.16± 0.36, 233
27.38 ± 0.39 and 22.36 ± 0.42 min, respectively, suggesting higher mass and heat transfer rates. In fact, in MWD 234
there is a rapid MW penetration in the product volume with fast heat generation, followed by a great vapor 235
pressure difference between the center and the surface of the products, resulting in forced expulsion of gases and 236
fast water vapor diffusion[40]. 237
3.1.1 Water activity 238
Water activity (aw) is a critical parameter that allows determining the product stability and safety. it is worth 239
mentioning that above the value of 0.4 the relative speed of hydrolysis, lipid oxidation, enzymatic, 240
microbiological and Maillard reactions increases considerably [41].The overall dry products obtained by 241
different drying conditions were characterized by the aw lower than 0.4 (Table 1). The lowest aw value was 242
8
reached after microwave drying at 1000 W for 22min and the highest aw value was reached for sample dried in 243
conventional oven at 40 °C for 850 min. 244
3.1.2 Color 245
The color parameters of fresh and dried pea pods including the L*, a*, b* and ∆E, under different drying 246
conditions, are shown in Table 2. 247
The L* value increases with drying indicating formation of a darker color. A reduction in drying time reduced 248
the lightness variation. The darker color may be due to exposure to oxygen and to enzymatic browning reaction 249
[42]. The statistical analysis showed differences between fresh and dried pea pods at different drying conditions 250
(p < 0.05) for the two drying methods. Also the relatively high content of sugars, proteins, and chlorophyll may 251
favor color changes in dried pea pods [28]. 252
The initial sample showed a negative a* value indicating greenness, while it increased towards positive (red) 253
values together with the drying treatment severity in terms of high temperatures or microwave powers. The 254
statistical analysis showed significant differences between fresh and dried pea pods at different drying conditions 255
(p < 0.05) for both drying methods, except for CD at 40 °C. Temperatures above 120 °C expediting molecular 256
changes towards the creation of brown compounds as the result of diverse reactions, such as for example 257
decomposition of chlorophyll and other pigments such as carotenoid, polyphenols polymerization and Maillard 258
reaction[43]or even pigment concentration due to water reduction [44]. However, the b* values slightly changed 259
and in conventional drying it increased more the longer the treatment revealing in this case decomposition of 260
different compounds probably more sensitive to oxygen exposition, rather than heat (such as carotenoids). In 261
microwave drying b* variation was not so correlated with drying time. 262
The total color change of dried pea pods (∆E), showed the same trend as b* and lower values for MD confirming 263
that a long-lasting hot air drying causes a meaningful color alteration and application of microwave can shorten 264
the drying time limiting color change [13]. 265
3.2 Functional properties 266
In order to evaluate possible modifications affecting the structural arrangement of cell wall 267
polysaccharides from pea pods samples, hydration-related properties such as swelling and water retention 268
capacity were measured on fresh and dried samples (Table3). 269
3.2.1 Swelling capacity (SC). 270
Convective drying decreased this property showing anyway an increase from the treatment at 40°C to 271
that at 80°C (with a value close to that of fresh sample) and then a decrease with increasing temperature. The 272
statistical analysis showed significant differences between fresh and dried pea pods for both microwave and 273
convective drying methods (p < 0.05), except for CD at 80°C. At lower temperatures, the drying time necessary 274
to decrease moisture content is considerably high affecting functional properties. On the flip side, high 275
temperatures cause some structural changes in final products, such as changes to carbohydrate granules, in 276
particular starch, protein denaturation. So, the optimal conditions for functional properties are a compromise 277
betwixt temperature and drying time [14]. For microwave drying, SC values were on average lower and the 278
increase in microwave power led to the decrease of SC until 400 W and then an increase from 500 to 1000 W .It 279
is reported that MD affects the fibrous matrix modifying the structural characteristics and the chemical 280

9
composition of the fiber (water affinity components) due to the high internal pressure produced by microwave 281
heating which can cause expansion and SW of the sample structure [45]. 282
3.2.2 Water retention capacity (WRC). 283
In general, dehydration promoted a decrease of the WRC for all the tested conditions, with a correlation with 284
temperature / microwave power similar to that commented for SC which is expected due to the same compounds 285
involved in SC and WRC. Statistical analysis showed significant differences between fresh and dried pea pods 286
for both microwave and convective drying methods (p < 0.05).Similar investigations reported that drying 287
temperature is the main factor affecting the WRC [46]. The results for MD showed that volumetric heating 288
during microwave caused higher internal pressure at the start of the drying stage and faster evaporation, resulting 289
in cell swelling, but with the reduction of moisture content, the volume shrinkage is increased which decreases 290
the rehydration capacity[47].According to Hodge and Osman [48], flours with high WRC have more hydrophilic 291
constituents such as fibers. Apple, wheat, pea, and carrot fibers have a WRC ranging from 2.5 to 10 g/g dry 292
weight. From a technological point of view, fibers are used as texturing agent or additive to increase volume, 293
essentially due to their capacity to absorb water [49]. Thanks to the high value of WRC, pea byproduct could be 294
utilized as a functional ingredient: to reduce calories intake, avoid syneresis, modify the viscosity and texture of 295
formulated foods. 296
3.3 Total polyphenolic, total flavonoids compounds and antioxidant activity 297
The content in antioxidant compounds and antioxidant activity of plant materials was generally lower in the 298
fresh material in agreement with some recent studies that have demonstrated that dehydrated plant materials 299
contain larger amounts of antioxidants when compared to fresh plant materials [50]. 300
3.3.1 Antioxidant compounds 301
In the present study, the total polyphenols content (TPC) and total flavonoids (TFC) in ethanol extracts of pea 302
pods increased significantly after both conventional and microwave drying and with decreasing drying time. The 303
statistical analysis showed significant differences between fresh and dried pea pods at different drying conditions 304
(p < 0.05) using both drying methods, except for CD at 40 and 60 °C and MD at 200 W. This increase was 305
probably due to changes in their extractability due to the disruption of the plant cell wall(as already commented 306
for MD) enhancing the release of bound polyphenolic and flavonoid compounds [51]. Additionally, the 307
formation of Maillard reaction products may add antioxidant activity and interfere with the Folin-Ciocalteu, 308
DPPH and FRAP test. A decrease in total phenolics and flavonoids was observed only for CD at 40 and 60 °C 309
and MD at 200 W for which overexposure to atmospheric oxygen for long times might have brought to 310
compounds oxidation [52]. Another possibility concerning the low level of phenolic compounds in the fresh 311
sample could be the presence of active enzyme polyphenol oxidase which is faster inactivated at higher 312
temperatures [53]. 313
3.3.2 Antioxidant activity 314
The effect of drying method on the antioxidant capacity of ethanol extracts from pea by-product was assessed by 315
the DPPH° radical scavenging assay and the ferric-reducing power estimation. In agreement with what observed 316
for antioxidant compounds, results showed that drying significantly enhanced the overall antioxidant activities of 317
samples, except for the samples dried at 40 °C in CD. The maximum radical scavenging activity values were 318
found after microwave treatment at 1000W. The ferric reducing ability of the extract showed a similar trend to 319
10
the results observed from the DPPH° assay. Firstly, this can be atributable to the increased amount of antioxidant 320
compounds in the extracts. High correlations were found between DPPH° and total flavonoids and total 321
phenolics. Secondly, there might also be the formation of novel compounds having antioxidant activity during 322
drying, as Maillard compounds[54]. 323
4. Conclusion 324
In this study, the effects of microwave output powers and oven temperatures on the different factors including 325
color, functional and bioactive properties of pea pods were investigated to find suitable drying conditions among 326
the applied ones for this valuable product. The main findings of this study can be summarized as: 327
Increasing the microwave power level or drying temperature resulted in a reduction in drying time and 328
that this reduction is more significant when applying microwave drying. 329
The lowest water activity aw value was reached after microwave drying at 1000 W for 22min. 330
The convective dried pea pods samples exhibited a greater color change than microwave dried pea pods 331
samples. 332
Conventional drying at 80 °C during 135.33 min was the most efficient combination that provided the 333
highest swelling and water retention capacity. 334
Drying could increase functional compounds, in terms of extractable phenolic and antioxidant 335
compounds, with microwave drying at 1000 W for 22.36 min appearing the best process from this 336
point of view. 337
338
Acknowledgements 339
The authors gratefully acknowledge the Algerian Ministry of Higher Education and Scientific Research for 340
funding the study. The first author also wishes to thank DiSTAS – Department for Sustainable Food Process, 341
Università Cattolica del Sacro Cuore (Italy) for the laboratory financial support. 342
343
Funding 344
The authors gratefully acknowledge the Algerian Ministry of Higher Education and Scientific Research for 345
funding the study under the research project “Projet de Recherche Universitaire” entitled « Procédé de séchage 346
assisté par Microonde-ultrason et son impact sur la qualité organoleptique et phénolique des matrices 347
alimentaires: Modélisation, Simulation et Optimisation-extraction [No. D01N01UN100120180002] » 348
References 349
1. Gustavsson, J., et al., Global food losses and food waste, 2011, FAO Rome. 350
2. UN, 18,000 children die every day of hunger. 2007. 351
3. Belghith-Fendri, L., et al., Pea and Broad Bean Pods as a Natural Source of Dietary Fiber: 352 The Impact on Texture and Sensory Properties of Cake. J Food Sci, 2016. 81(10): p. C2360-353 C2366. 354
11
4. Mateos-Aparicio, I., A. Redondo-Cuenca, and M.J. Villanueva-Suárez, Isolation and 355 characterisation of cell wall polysaccharides from legume by-products: Okara (soymilk 356 residue), pea pod and broad bean pod. Food Chemistry, 2010. 122(1): p. 339-345. 357
5. Mateos-Aparicio, I., A. Redondo-Cuenca, and M.J. Villanueva-Suarez, Broad bean and pea 358 by-products as sources of fibre-rich ingredients: potential antioxidant activity measured in 359 vitro. J Sci Food Agric, 2012. 92(3): p. 697-703. 360
6. Carle, R., et al., Method for obtaining useful materials from the by-products of fruit and 361 vegetable processing. Patent application, WO, 2001. 1(78859): p. A1. 362
7. Mateos-Aparicio, I., et al., Pea pod, broad bean pod and okara, potential sources of 363 functional compounds. LWT - Food Science and Technology, 2010. 43(9): p. 1467-1470. 364
8. Stella Mary, G., et al., Production, characterization and evaluation of biochar from pod 365 (Pisum sativum), leaf (Brassica oleracea) and peel (Citrus sinensis) wastes. International 366 Journal of Recycling of Organic Waste in Agriculture, 2016. 5(1): p. 43-53. 367
9. Vojvodic, A., et al., Compositional evaluation of selected agro-industrial wastes as valuable 368 sources for the recovery of complex carbohydrates. Food Res Int, 2016. 89(Pt 1): p. 565-573. 369
10. Tiwari, B.K., A. Gowen, and B. McKenna, Pulse foods: processing, quality and nutraceutical 370 applications2011: Academic Press. 371
11. Talens, C., M. Castro-Giraldez, and P.J. Fito, A thermodynamic model for hot air microwave 372 drying of orange peel. Journal of Food Engineering, 2016. 175: p. 33-42. 373
12. Sabarez, H.T., Modelling of drying processes for food materials. 2015: p. 95-127. 374
13. Szadzinska, J., et al., The effect of high power airborne ultrasound and microwaves on 375 convective drying effectiveness and quality of green pepper. Ultrason Sonochem, 2017. 34: p. 376 531-539. 377
14. Dehnad, D., S.M. Jafari, and M. Afrasiabi, Influence of drying on functional properties of food 378 biopolymers: From traditional to novel dehydration techniques. Trends in Food Science & 379 Technology, 2016. 57: p. 116-131. 380
15. Szadzińska, J., S.J. Kowalski, and M. Stasiak, Microwave and ultrasound enhancement of 381 convective drying of strawberries: Experimental and modeling efficiency. International 382 Journal of Heat and Mass Transfer, 2016. 103: p. 1065-1074. 383
16. Figiel, A., Drying kinetics and quality of beetroots dehydrated by combination of convective 384 and vacuum-microwave methods. Journal of Food Engineering, 2010. 98(4): p. 461-470. 385
17. Mujumdar, A. and S. Jangam, Some Innovative Drying Technologies for Dehydration of 386 Foods2018. 387
18. Pan, Y.K., L.J. Zhao, and W.B. Hu, The Effect of Tempering-Intermittent Drying on Quality 388 and Energy of Plant Materials. Drying Technology, 1998. 17(9): p. 1795-1812. 389
19. Xu, Y., et al., A comparative evaluation of nutritional properties, antioxidant capacity and 390 physical characteristics of cabbage (Brassica oleracea var. Capitate var L.) subjected to 391 different drying methods. Food Chem, 2020. 309: p. 124935. 392
12
20. Zhang, M., H. Jiang, and R.-X. Lim, Recent Developments in Microwave-Assisted Drying of 393 Vegetables, Fruits, and Aquatic Products—Drying Kinetics and Quality Considerations. 394 Drying Technology, 2010. 28(11): p. 1307-1316. 395
21. Gunasekaran, S., Pulsed microwave-vacuum drying of food materials. Drying Technology, 396 1999. 17(3): p. 395-412. 397
22. Horuz, E., et al., Effects of hybrid (microwave-convectional) and convectional drying on 398 drying kinetics, total phenolics, antioxidant capacity, vitamin C, color and rehydration 399 capacity of sour cherries. Food Chem, 2017. 230: p. 295-305. 400
23. Asomaning, J., et al., Recent developments in microwave-assisted thermal conversion of 401 biomass for fuels and chemicals. Renewable and Sustainable Energy Reviews, 2018. 92: p. 402 642-657. 403
24. Doymaz, I., A.S. Kipcak, and S. Piskin, Microwave drying of green bean slices: drying 404 kinetics and physical quality. Czech Journal of Food Sciences, 2016. 33(No. 4): p. 367-376. 405
25. Kipcak, A.S. and O. Ismail, < b> Comparison of the microwave drying kinetics of culture and 406 natural asparagus. Acta Scientiarum. Technology, 2018. 40: p. e39922-e39922. 407
26. Lombraña, J.I., R. Rodríguez, and U. Ruiz, Microwave-drying of sliced mushroom. Analysis of 408 temperature control and pressure. Innovative Food Science & Emerging Technologies, 2010. 409 11(4): p. 652-660. 410
27. Chouaibi, M., et al., Influence of drying processes on bioactive compounds profiles, 411 hydroxymethylfurfural, color parameters, and antioxidant activities of Tunisian eggplant 412 (Solanum melongena L.). Journal of Food Processing and Preservation, 2021: p. e15460. 413
28. Chahbani, A., et al., Microwave drying effects on drying kinetics, bioactive compounds and 414 antioxidant activity of green peas (Pisum sativum L.). Food Bioscience, 2018. 25: p. 32-38. 415
29. Schulze, B., E.M. Hubbermann, and K. Schwarz, Stability of quercetin derivatives in vacuum 416 impregnated apple slices after drying (microwave vacuum drying, air drying, freeze drying) 417 and storage. LWT - Food Science and Technology, 2014. 57(1): p. 426-433. 418
30. Garau, M.C., et al., Effect of air-drying temperature on physico-chemical properties of dietary 419 fibre and antioxidant capacity of orange (Citrus aurantium v. Canoneta) by-products. Food 420 Chem, 2007. 104(3): p. 1014-1024. 421
31. Robertson, J.A., et al., Hydration Properties of Dietary Fibre and Resistant Starch: a 422 European Collaborative Study. LWT - Food Science and Technology, 2000. 33(2): p. 72-79. 423
32. Lv, J.S., et al., Chemical composition and functional characteristics of dietary fiber-rich 424 powder obtained from core of maize straw. Food Chem, 2017. 227: p. 383-389. 425
33. Dahmoune, F., et al., Valorization of Citrus limon residues for the recovery of antioxidants: 426 Evaluation and optimization of microwave and ultrasound application to solvent extraction. 427 Industrial Crops and Products, 2013. 50: p. 77-87. 428
34. Georgé, S., et al., Rapid Determination of Polyphenols and Vitamin C in Plant-Derived 429 Products. Journal of Agricultural and Food Chemistry, 2005. 53(5): p. 1370-1373. 430
35. Quettier-Deleu, C., et al., Phenolic compounds and antioxidant activities of buckwheat 431 (Fagopyrum esculentum Moench) hulls and flour. Journal of Ethnopharmacology, 2000. 432 72(1): p. 35-42. 433
13
36. Mishra, K., H. Ojha, and N.K. Chaudhury, Estimation of antiradical properties of antioxidants 434 using DPPH assay: A critical review and results. Food Chem, 2012. 130(4): p. 1036-1043. 435
37. Sharma, O.P. and T.K. Bhat, DPPH antioxidant assay revisited. Food Chem, 2009. 113(4): p. 436 1202-1205. 437
38. Ferreira, I.C.F.R., et al., Free-radical scavenging capacity and reducing power of wild edible 438 mushrooms from northeast Portugal: Individual cap and stipe activity. Food Chem, 2007. 439 100(4): p. 1511-1516. 440
39. Torki-Harchegani, M., et al., Dehydration characteristics and mathematical modelling of 441 lemon slices drying undergoing oven treatment. Heat and Mass Transfer, 2015. 52(2): p. 281-442 289. 443
40. Sadeghi, M., O. Mirzabeigi Kesbi, and S.A. Mireei, Mass transfer characteristics during 444 convective, microwave and combined microwave-convective drying of lemon slices. J Sci Food 445 Agric, 2013. 93(3): p. 471-8. 446
41. Labuza, T.P., Water content and stability of low moisture and intermediate moisture foods. 447 Food Technol, 1970. 24: p. 543-550. 448
42. Maurya, V.K., et al., Effect of drying methods (microwave vacuum, freeze, hot air and sun 449 drying) on physical, chemical and nutritional attributes of five pepper (Capsicum annuum var. 450 annuum) cultivars. J Sci Food Agric, 2018. 98(9): p. 3492-3500. 451
43. Michalska, A., et al., Physicochemical properties of whole fruit plum powders obtained using 452 different drying technologies. Food Chem, 2016. 207: p. 223-32. 453
44. Wojdyło, A., A. Figiel, and J. Oszmiański, Effect of drying methods with the application of 454 vacuum microwaves on the bioactive compounds, color, and antioxidant activity of strawberry 455 fruits. Journal of Agricultural and Food Chemistry, 2009. 57(4): p. 1337-1343. 456
45. Sumnu, G., E. Turabi, and M. Oztop, Drying of carrots in microwave and halogen lamp–457 microwave combination ovens. LWT - Food Science and Technology, 2005. 38(5): p. 549-458 553. 459
46. Vega-Gálvez, A., et al., Effect of air drying temperature on the quality of rehydrated dried red 460 bell pepper (var. Lamuyo). Journal of Food Engineering, 2008. 85(1): p. 42-50. 461
47. Wang, H., M. Zhang, and A.S. Mujumdar, Comparison of Three New Drying Methods for 462 Drying Characteristics and Quality of Shiitake Mushroom (Lentinus edodes). Drying 463 Technology, 2014. 32(15): p. 1791-1802. 464
48. Hodge, J. and E. Osman, Principles of Food Science Part 1. Food Chemistry. by 0. R. 465 Fennema, Marcel Dekker Inc., New York, Basel, 1976. 466
49. Oakenfull, D., Physicochemical properties of dietary fiber: Overview. FOOD SCIENCE AND 467 TECHNOLOGY-NEW YORK-MARCEL DEKKER-, 2001: p. 195-206. 468
50. Pinela, J., et al., Antioxidant activity, ascorbic acid, phenolic compounds and sugars of wild 469 and commercial Tuberaria lignosa samples: effects of drying and oral preparation methods. 470 Food Chem, 2012. 135(3): p. 1028-35. 471
51. Choi, Y., et al., Influence of heat treatment on the antioxidant activities and polyphenolic 472 compounds of Shiitake (Lentinus edodes) mushroom. Food Chem, 2006. 99(2): p. 381-387. 473
14
52. Sousa, A.D., et al., Drying kinetics and effect of air-drying temperature on chemical 474 composition of Phyllanthus amarus and Phyllanthus niruri. Drying Technology, 2018. 36(5): 475 p. 609-616. 476
53. Roshanak, S., M. Rahimmalek, and S.A. Goli, Evaluation of seven different drying treatments 477 in respect to total flavonoid, phenolic, vitamin C content, chlorophyll, antioxidant activity and 478 color of green tea (Camellia sinensis or C. assamica) leaves. J Food Sci Technol, 2016. 53(1): 479 p. 721-9. 480
54. Hayta, M., M. Alpaslan, and A. Baysar, Effect of drying methods on functional properties of 481 tarhana: A wheat flour‐yogurt mixture. Journal of Food Science, 2002. 67(2): p. 740-744. 482
483 484
485 486 487 Figure Legends 488
Fig. 1– Experimental (symbols) and simulated (solid lines) decrease in moisture ratio (MR) of pea pods during 489
microwave drying (A) at different powers ( 200, 300, 400, 500, ● 600, 700, 800, 900 and 490
1000 W) and oven drying (B) at different temperatures (● 40, 60, 80, 100 and 120 °C). Solid lines 491
are calculated MR using the Midilli et al. model. 492
493
Figures
Figure 1
Experimental (symbols) and simulated (solid lines) decrease in moisture ratio (MR) of pea pods duringmicrowave drying (A) at different powers ( 200, 300,Δ 400, 500, 600, 700, 800, Δ 900 and 1000

W) and oven drying (B) at different temperatures ( 40, 60, 80, Δ 100 and 120 °C). Solid lines arecalculated MR using the Midilli et al. model.
Supplementary Files
This is a list of supplementary �les associated with this preprint. Click to download.
GraphicalabstractandStatementofNovelty.docx