
Physicochemical and Sensory Evaluation of Mixed Juices ...
12
Tanzania Journal of Science 47(1): 332-343, 2021 ISSN 0856-1761, e-ISSN 2507-7961 © College of Natural and Applied Sciences, University of Dar es Salaam, 2021 332 http://journals.udsm.ac.tz/index.php/tjs www.ajol.info/index.php/tjs Physicochemical and Sensory Evaluation of Mixed Juices from Banana, Pineapple and Passion Fruits during Storage Victor Vicent Matabura * and Oscar Kibazohi Department of Food Science and Technology, University of Dar es Salaam, P. O. Box 35134, Dar es Salaam, Tanzania * Corresponding author; E-mail addresses: [email protected]; [email protected] Received 25 Sep 2020, Revised 2 Feb 2021, Accepted 4 Feb 2021, Published Feb 2021 Abstract Juices from fresh fruits offer various health benefits, including strengthening the immune system and preventing diseases. Mixed fruit juices tend to have good nutritional contents and organoleptic properties like colour, flavour, taste, and overall appeal of different fruits. This work investigated the physicochemical and sensory attributes of fruit juice of low viscosity banana juice blended with pineapple and passion juices. The prepared juices were pasteurised at 92 °C for 15 s, bottled in air-tight glass bottles, and subsequently stored in two different conditions: an ambient temperature of approximately 28 ± 2 °C and a fridge at 4 ºC for one month. Ascorbic acid content, total soluble solids, acidity, pH, and sensory evaluation were measured during the storage period. The results revealed that ascorbic acid and pH decrease significantly (p < 0.05) as the acidity increases. The changes ranged between 16 and 37% for ascorbic acid, 0.8 and 1.8% for pH, and from 12 to 27% for acidity were observed. The total soluble solids were found to increase until ten days of storage. The control samples showed no changes in all the physicochemical properties analysed during storage. The juice sample that consisted of 80% banana juice and 20% passion juice emerged as the utmost imperative sample as it scored the highest hedonic scale on all sensory attributes. The results imply that low viscosity banana juice can be used as a major component for the preparation of commercial mixed juices. Keywords: Banana Juice; Chemical Analysis; Sensory Evaluation; Mixed Juice. Introduction Fruits are excellent sources of carbohydrates, vitamins, minerals, antioxidants, and fibres (Orrego et al. 2014, Slavin and Lloyd 2012). It is suggested that antioxidants obtained from fresh fruits scavenge free radicals (Pillay and Fungo 2016, Rasheed and Azeez 2019). Hence, consumption of fruits has health benefits such as reducing the risk of heart diseases and several types of cancer (Dhandevi and Jeewon 2015, Slavin and Lloyd 2012). Tanzania produces varieties of fruits such as bananas, mangoes, oranges, pineapples, passion, watermelons, avocados, and many more (NBS 2017). However, fruit consumption in most African countries, including Tanzania is below the recommended levels (Amao 2018, James and Zikankuba 2017, Okop et al. 2019, WHO 2003). Low consumption of fruits may be due to lack of awareness on fruit benefits and lack of postharvest management to make them available throughout a year (James and Zikankuba 2017, WHO 2003). Fruits are perishable products as they contain high moisture and are rich in nutrients. Once harvested, fresh fruits undergo several biochemical processes, such as ripening and respiration (El-Ramady et al. 2015, James and Zikankuba 2017, Singh et al. 2014). These phenomena change the physicochemical
Transcript of Physicochemical and Sensory Evaluation of Mixed Juices ...
Tanzania Journal of Science 47(1): 332-343, 2021
ISSN 0856-1761, e-ISSN 2507-7961
© College of Natural and Applied Sciences, University of Dar es Salaam, 2021
332
http://journals.udsm.ac.tz/index.php/tjs www.ajol.info/index.php/tjs
Physicochemical and Sensory Evaluation of Mixed Juices from Banana,
Pineapple and Passion Fruits during Storage
Victor Vicent Matabura* and Oscar Kibazohi
Department of Food Science and Technology, University of Dar es Salaam, P. O. Box
35134, Dar es Salaam, Tanzania *Corresponding author; E-mail addresses: [email protected]; [email protected]
Received 25 Sep 2020, Revised 2 Feb 2021, Accepted 4 Feb 2021, Published Feb 2021
Abstract
Juices from fresh fruits offer various health benefits, including strengthening the immune system
and preventing diseases. Mixed fruit juices tend to have good nutritional contents and organoleptic
properties like colour, flavour, taste, and overall appeal of different fruits. This work investigated
the physicochemical and sensory attributes of fruit juice of low viscosity banana juice blended
with pineapple and passion juices. The prepared juices were pasteurised at 92 °C for 15 s, bottled
in air-tight glass bottles, and subsequently stored in two different conditions: an ambient
temperature of approximately 28 ± 2 °C and a fridge at 4 ºC for one month. Ascorbic acid content,
total soluble solids, acidity, pH, and sensory evaluation were measured during the storage period.
The results revealed that ascorbic acid and pH decrease significantly (p < 0.05) as the acidity
increases. The changes ranged between 16 and 37% for ascorbic acid, 0.8 and 1.8% for pH, and
from 12 to 27% for acidity were observed. The total soluble solids were found to increase until ten
days of storage. The control samples showed no changes in all the physicochemical properties
analysed during storage. The juice sample that consisted of 80% banana juice and 20% passion
juice emerged as the utmost imperative sample as it scored the highest hedonic scale on all sensory
attributes. The results imply that low viscosity banana juice can be used as a major component for
the preparation of commercial mixed juices.
Keywords: Banana Juice; Chemical Analysis; Sensory Evaluation; Mixed Juice.
Introduction
Fruits are excellent sources of
carbohydrates, vitamins, minerals, antioxidants,
and fibres (Orrego et al. 2014, Slavin and
Lloyd 2012). It is suggested that antioxidants
obtained from fresh fruits scavenge free
radicals (Pillay and Fungo 2016, Rasheed and
Azeez 2019). Hence, consumption of fruits has
health benefits such as reducing the risk of
heart diseases and several types of cancer
(Dhandevi and Jeewon 2015, Slavin and Lloyd
2012). Tanzania produces varieties of fruits
such as bananas, mangoes, oranges, pineapples,
passion, watermelons, avocados, and many
more (NBS 2017). However, fruit consumption
in most African countries, including Tanzania
is below the recommended levels (Amao 2018,
James and Zikankuba 2017, Okop et al. 2019,
WHO 2003). Low consumption of fruits may
be due to lack of awareness on fruit benefits
and lack of postharvest management to make
them available throughout a year (James and
Zikankuba 2017, WHO 2003). Fruits are
perishable products as they contain high
moisture and are rich in nutrients.
Once harvested, fresh fruits undergo several
biochemical processes, such as ripening and
respiration (El-Ramady et al. 2015, James and
Zikankuba 2017, Singh et al. 2014). These
phenomena change the physicochemical

Tanz. J. Sci. Vol. 47(1), 2021
333
properties, quality, and nutritional value of the
fruits, and eventually cause fruit senescence.
Moreover, a large number of fruits are
available during peak seasons. James and
Zikankuba (2017) reported that postharvest
losses of fruits are higher than 30% in sub-
Saharan Africa mostly due to lack of
postharvest management technologies. Thus,
proper postharvest handling, preservation, and
processing strategies are indispensable to
circumvent fruit losses during the peak seasons
and to make fruits accessible and available
during the off-season periods (Toivonen et al.
2014).
Fruits can be processed to produce various
products like fruit juice, wine, vinegar, jam,
concentrate, pulp, and dehydrated products. For
instance, the juices are mostly extracted from
fruits by mashing and pressing the pulp of a
given fruit. However, a low viscosity banana
juice is extracted from banana by a mechanical
or enzymatic method (Byarugaba-Bazirake
2008, Kibazohi et al. 2017, Kyamuhangire et
al. 2002, Majaliwa et al. 2019). Kibazohi et al.
(2017) developed a mechanical method to
extract low viscosity juice from ripe bananas.
The method involves mashing of ripe bananas
with high tannin content to allow the
combination of tannin and protein to form an
insoluble pulp, and enhance the separation of
low viscosity banana juice from the pulp
(Kibazohi et al. 2017). This technique was later
optimised by Majaliwa et al. (2019) purposely
to increase banana juice production for
commercial purposes. However, the potential
commercialisation of low viscosity banana
juice requires a comprehensive understanding
of juice formulation with other fruit juices and
an assessment of consumer’s acceptability. In
the case of pineapple and passion juices,
pineapple juice is mainly processed from ripe
pineapple fruit by peeling, excising the core,
mashing, and pressing to separate juice (Begum
et al. 2018, Biswas et al. 2016). Passion juice
can be extracted by cutting the passion fruit,
scooping the cortex part and seeds, mashing,
and pressing to separate juice from the pulp.
The refreshing aroma, colour, and sweet-and-
sour tartness taste of passion fruit make it
appealing when eating (Kulkarni and
Vijayanand 2010, Wong et al. 2014).
It is therefore recognized that evaluating the
use of banana juice, as the main ingredient in a
mixed fruit juice of passion or pineapple juice,
is important for both the fruit processing
industry and consumer’s acceptability. This
also suits well for investigation and
contribution to our understanding of the mixed
juice process and quality. This is because
different fruits have different functional
properties. Hence, blending juices from
different fruits may offer nutritional values and
sensory attributes such as colour, flavour, taste,
and palatability. However, previous studies
have partially reported the development of
mixed juices from several fruits such as mango,
orange, and pineapple (Begum et al. 2018).
Other studies blended pineapple, orange,
papaya, and banana (Hossain et al. 2016), pears
and pineapple (Reddy et al. 2017). This
enlightens that investigation of mixed juice,
using low viscosity banana juice as the primary
ingredient and other fruit juices like passion or
pineapple, is poorly explored. Also, studying
the physicochemical properties of mixed juices
is a crucial aspect in determining juice quality
and commercialisation. The physicochemical
properties of interest include vitamin C
(ascorbic acid), acidity, pH, and total soluble
solids. These are essential properties because
ascorbic acid is a common indicator employed
to evaluate the possible negative effects of
nutritional value during food processing.
Acidity is mostly used to assess the shelf-life of
the product and unfold some chemical changes
during storage (Begum et al. 2018, Hossain et
al. 2016). This paper explores the
physicochemical properties of mixed fruit
juices from banana, passion, and pineapple
fruits, as well as their sensory acceptance
during one month of storage.
Materials and Methods
Materials
Banana (Musa acuminata), pineapple (Ananas
comosus), and passion (Passiflora edulis) fruits

Matabura and Kibazohi - Physicochemical and sensory evaluation of mixed juices …
were purchased from Urafiki-Mabibo local
market in Dar es Salaam, Tanzania. About 20
kg of banana bunches and 10 kg of pineapple
and passion fruits each were brought to the
Food laboratory at the Department of Chemical
and Mining Engineering, University of Dar es
Salaam for experiments. Ascorbic acid, starch
and phenolphthalein indicators, citric acid,
sodium hydroxide, and iodine solution were
purchased from Sigma-Aldrich (Steinheim,
Germany) and used as standards and reagents
for physicochemical analysis.
Juice extraction
Before juice extraction, banana fruits were
allowed to ripen to stage 5 at an ambient
temperature of 28 ± 2 °C following a colour
index code suggested by USDA (2001). The
ripe banana fingers were washed and manually
peeled with a stainless knife. Subsequently, the
peeled banana fingers were mashed with a
mechanical blender (Blixer 4 V.V., Robot
Couple, France) until the texture changed to a
semi-solid state (Kibazohi et al. 2017,
Majaliwa et al. 2019). The pulp was wrapped
in a cheese-cloth and then pressed with a fruit
pulp presser (50 PI, Voran Maschinen GmbH,
Austria) to separate the juice from the pulp.
The passion fruits were washed, sliced into two
halves with a stainless knife, and the cortex
parts together with seeds were scooped out
with a spoon. In the case of pineapples, the
fruits were washed, peeled, and sliced using a
stainless knife. Both scooped and sliced
samples were separately mashed using a
mechanical blender (Blixer 4 V.V, Robot
Couple, France). The obtained pulps were
filtered through a cheese-cloth in a fruit pulp
presser (50 PI, Voran Maschinen GmbH,
Austria) to separate the juice. After filtration,
the juice samples were stored in a horizontal
freezer (Electrolux, ECM30132W) set at –20
°C for further analysis.
Formulation of mixed fruit juice
The mixed fruit juice was prepared in different
ratios of low viscosity banana, pineapple, and
passion juices as shown in Table 1. The first
sample S1 consisted of 80% of banana juice
and 20% of pineapple juice. The second sample
S2 consisted of 70% of banana juice and 30%
of pineapples juice. The third sample S3 was
made from 80% banana juice and 20% passion
juice. The fourth sample S4 consisted of 70% of
banana juice and 30% passion juice. Low
viscosity banana juice 100%, pineapple juice
100%, and passion juice 100% were also
prepared and considered as control samples S5,
S6, and S7, respectively. The prepared mixed
juice samples were diluted with distilled water
to 13.8 °Brix. Then, citric acid (0.3%) was
added to S1, S2, S5, and S6 formulations to
adjust pH to about 3.9. Subsequently, these
samples were pasteurised at 92 °C for 15 s
using a coil pasteuriser (PA 90, Voran
Maschinen GmbH, Austria) and immediately
bottled in 330 mL amber glass bottles and
crown capped.
Table 1: Fruit juices formulation using banana, pineapple and passion fruit juices
Ingredients Sample
Formulation S1 S2 S3 S4 S5 S6 S7
Banana juice (%) 80 70 80 70 100 - -
Pineapple juice (%) 20 30 - - - 100 -
Passion juice (%) - - 20 30 - - 100
Citric acid - - -
Storage experiment
The pasteurised samples were stored at two
different temperatures for one month. The first
portion, having 24 bottles with six bottles from
each blended sample (S1, S2, S3, and S4), was
kept in a fridge set at 4 ºC for the sensory
evaluation test. The second part with 20 bottles
consisted of five bottles from each mixed juice
sample (S1, S2, S3, and S4) were placed at an
ambient temperature of approximately 28 ± 2

Tanz. J. Sci. Vol. 47(1), 2021
335
°C for physicochemical analysis. The control
samples: S5, S6, and S7 were stored at 4 °C for
physicochemical analysis.
Quality measurements
The first measurements for the
physicochemical analysis were carried out
immediately after juice extraction for ascorbic
acid content, total soluble solids, titratable
acidity, and pH. These parameters were also
measured in each mixed fruit juice before
pasteurisation. The next analyses were
undertaken on the pasteurised juices on day
zero and after every 10 days during the 30 days
of storage at an ambient temperature. For each
time point, one bottle was taken from each
sample for the physicochemical analysis. The
control samples were analysed at day zero and
the end of the storage period, i.e., 30 days for
ascorbic acid, acidity, pH, and total soluble
solids. For sensory evaluation, the testing was
performed at day zero and 30 days of storage at
4 °C.
Ascorbic acid content
The ascorbic acid content in mixed fruit juice
samples was determined by titration method
(Vicent et al. 2018) using an iodine solution of
0.1 M. For each sample, 25 mL of blended
juice was poured into a 250 mL volumetric
flask. Subsequently, 10 drops of a prepared
soluble starch solution of 1% were added. The
mixed solution was titrated with 0.1 M of
iodine solution until a blue colour was
observed to persist for 15 s. Before ascorbic
acid determination in fruit juice samples, the
titration method was optimised using standard
solutions of ascorbic acid, which were titrated
with 0.1 M iodine solution. The ascorbic acid
determination was performed in three replicates
per juice sample, and then the ascorbic acid
content was quantified in mg ascorbic acid per
100 g of mixed fruit juice as shown in Equation
(1).
100acidAscorbicjuice
AAI
m
FV (1)
Where: VI is the volume of iodine solution
consumed (L), FAA is a conversion factor of the
ascorbic acid consumed with iodine solution
(mg of ascorbic acid per litre), which was
obtained by taking the molarity of iodine times
the molecular mass of ascorbic acid, and mjuice
is the mass of the juice sample (g).
Titratable acidity
In each fruit juice sample, titratable acidity was
analysed using 0.1 N NaOH solution as
described by Bello et al. (2014). To this end, 5
mL of the mixed juice sample was diluted to 50
mL using distilled water and then poured into a
250 mL volumetric flask. Three drops of
phenolphthalein indicator were added and the
sample was titrated with 0.1 N NaOH solution
until an endpoint of pink colour was observed.
Titratable acidity was quantified as shown in
Equation (2).
100N
acid%juice
acidNaOHNaOH
V
FV (2)
Where: NNaOH is the normality of NaOH used
(g L-1
), VNaOH is the volume of NaOH solution
consumed (L), Facid is an equivalent factor of
the acid in the fruit juice sample = 0.067
equivalent weight of malic acid, and Vjuice is the
volume of the juice sample (L). The titratable
acidity was expressed in percentage by
assuming the density of juice is equal to that of
water (g L–1
).
Total soluble solids and pH
Total soluble solids (TSS) in the mixed fruit
juice samples was measured as °Brix using a
digital pocket refractometer (ATAGO, Japan)
with TSS ranging between 0 and 88 °Brix and
a precision of 0.1 °Brix. The refractometer was
tested for distilled water before each TSS
measurement. The pH of the juice sample was
examined by using a pH meter (HI98129,
Hanna Instruments Inc, Limena, Italy) with
0.01 precision.
Sensory evaluation
Sensory acceptance of all the mixed juice
samples was evaluated by 40 panellists of both
genders (aged between 20 and 30 years) who
were selected from the Department of Food
Matabura and Kibazohi - Physicochemical and sensory evaluation of mixed juices …
Science and Technology of the University of
Dar es Salaam. The panellist team was briefed
about the experiment before assessing the
sensory acceptance of the mixed juice samples
and were then requested to evaluate for colour,
flavour, sweetness, and overall acceptability.
The sensory analysis was based on a 9-point
hedonic scale following the method of Curi et
al. (2017). The hedonic scoring scale was
arranged such that: 9 = like extremely, 8 = like
very much, 7 = like moderately, 6 = like
slightly, 5 = neither like nor dislike, 4 = dislike
slightly, 3 = dislike moderately, 2 = dislike
very much, 1 = dislike extremely. Organoleptic
acceptance was carried out using the mixed
juice samples stored at 4 °C.
The panellists were randomly served with
about 30 mL of each juice mix in transparent
plastic cups for evaluation. They were asked to
drink water before testing the next sample.
Sensory acceptance assessment was performed
at day zero and after 30 days of storage period.
Data analysis
The resulting experimental datasets were
imported into Matlab (R2017a, Mathworks Inc,
Natick, MA, U.S.A), where the statistical
analysis (factorial ANOVA with replication)
was carried out to assess the significant effects
of the storage time for each mixed juice
sample. A two-sample Kolmogorov-Smirnov
test (p < 0.05) was carried out for statistical
comparison of the measured mean values
expressed as mean and standard deviation (�̅� ±
S.D.).
Results and Discussion
Composition of banana, passion and
pineapple juices
The prepared samples of low viscosity
banana, passion, and pineapple juices were
analysed for ascorbic acid, titratable acidity,
pH, and total soluble solids. Table 2 shows the
results of the physicochemical compositions
measured in each fresh juice before mixing.
The low viscosity banana juice had 6.33 0.44
mg ascorbic acid per 100 g juice, 0.65 0.20%
titratable acidity, 4.60 0.02 pH, and 23.6
0.7 °Brix. Conversely, pineapple juice had 7.43
0.29 mg ascorbic acid per 100 g juice, 0.63
0. 07% titratable acidity, 4.37 0.01 pH, and
14.5 0.8 °Brix, while passion juice had 28.27
0.73 mg ascorbic acid per 100 g juice, 3.24
0.74% titratable acidity, 3.04 0.01 pH and
16.2 0.4 °Brix.
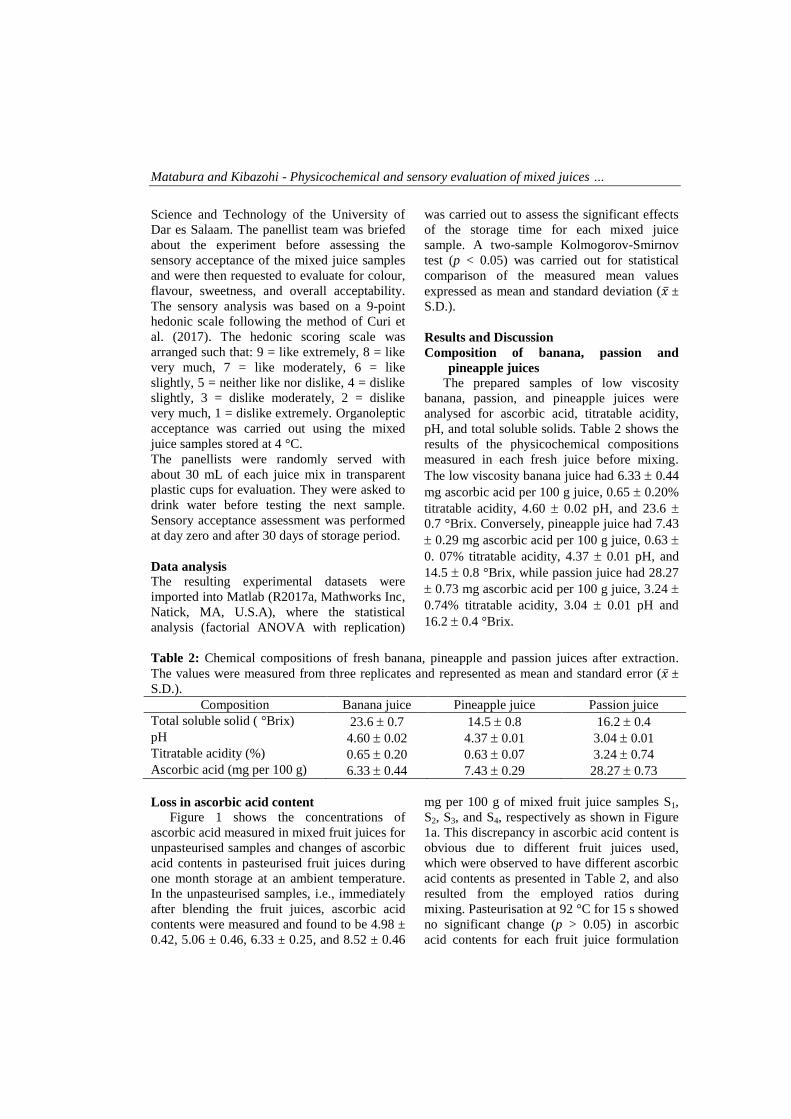
Table 2: Chemical compositions of fresh banana, pineapple and passion juices after extraction.
The values were measured from three replicates and represented as mean and standard error (�̅� ±
S.D.).
Composition Banana juice Pineapple juice Passion juice
Total soluble solid ( °Brix) 23.6 0.7 14.5 0.8 16.2 0.4
pH 4.60 0.02 4.37 0.01 3.04 0.01
Titratable acidity (%) 0.65 0.20 0.63 0.07 3.24 0.74
Ascorbic acid (mg per 100 g) 6.33 0.44 7.43 0.29 28.27 0.73
Loss in ascorbic acid content
Figure 1 shows the concentrations of
ascorbic acid measured in mixed fruit juices for
unpasteurised samples and changes of ascorbic
acid contents in pasteurised fruit juices during
one month storage at an ambient temperature.
In the unpasteurised samples, i.e., immediately
after blending the fruit juices, ascorbic acid
contents were measured and found to be 4.98 ±
0.42, 5.06 ± 0.46, 6.33 ± 0.25, and 8.52 ± 0.46
mg per 100 g of mixed fruit juice samples S1,
S2, S3, and S4, respectively as shown in Figure
1a. This discrepancy in ascorbic acid content is
obvious due to different fruit juices used,
which were observed to have different ascorbic
acid contents as presented in Table 2, and also
resulted from the employed ratios during
mixing. Pasteurisation at 92 °C for 15 s showed
no significant change (p > 0.05) in ascorbic
acid contents for each fruit juice formulation

Tanz. J. Sci. Vol. 47(1), 2021
337
(Figure 1a-b). The ascorbic acid contents of
mixed fruit juices showed a significantly
decreasing pattern (p < 0.05) with increasing
storage time. The ascorbic acid decreased at a
faster rate in the S4 sample (36.8%) after 30
days of storage. This trend was also evident for
S1 and S3 samples that had comparable ascorbic
acid losses of approximately 21.1% and 22.2%,
respectively. Moreover, the S2 sample had a
slow ascorbic acid loss of 15.9% during the one
month of storage (Figure 1b). The loss in
ascorbic acid may be due to the irreversible
oxidation mechanism that occurs during
storage, which may have rapidly converted L-
ascorbic acid into dihydro-ascorbic acid
(Tiwari et al. 2009).
These results concur with other studies that
reported a decreasing pattern of ascorbic acid
contents in some mixed fruit juices during
storage (Begum et al. 2018, Hossain et al.
2016, Islam et al. 2014, Reddy et al. 2017). In
this way, Hossain et al. (2016) reported a
decreasing trend of about 42.9% of ascorbic
acid in mixed juice of pineapple, orange,
papaya, and banana fruits during four months
of storage at 25 °C. Begum et al. (2018)
described a gradual loss in ascorbic acid
content in mixed fruit juices of mango, orange,
and pineapple during one month of storage at
an ambient temperature. Also, Islam et al.
(2014) stated that losses in ascorbic acid ranged
from 66% to over 79% in mixed fruit juices of
oranges and pineapples during 35 days of
storage. The differences between ascorbic acid
losses reported in the current study and the
aforementioned studies may be due to
differences in storage plans and inherent
material composition.
Figure 1: Concentrations of ascorbic acid (mg per 100 g) in different mixed fruit juice samples
before pasteurisation (a). Changes of ascorbic acid in pasteurised mix juices (b) during
a one-month storage period at an ambient temperature. The points are the means of the
measured values from three replicates, with error bars denoting the standard error at
each time-point.

Matabura and Kibazohi - Physicochemical and sensory evaluation of mixed juices …
Titratable acidity
Figure 2 presents acidity (%) in fruit juices
before and after pasteurisation, and during
storage at an ambient temperature for one
month. The unpasteurised juices showed
titratable acidity of 0.61 ± 0.07% (S1), 0.57 ±
0.02% (S2), 0.63 ± 0.02% (S3), and 0.72 ±
0.02% (S4) (Figure 2a). The pasteurised juice
samples presented no changes in acidity at day
zero (Figure 2b) compared to unpasteurised
juices. A significant change (p < 0.05) was
observed in the pasteurised juice during the
storage period of 30 days. Sample S4 had a
high acidity percentage at day zero and
throughout the storage period. This may be due
to a high amount of passion juice used (Table
1), which was examined to be very acidic juice
with 3.24 0.74% acidity (Table 2). After 30
days of storage, the acidity (%) was observed
to increase to 0.72 ± 0.07, 0.64 ± 0.06, 0.79 ±
0.05, and 0.90 ± 0.08 for S1, S2, S3, and S4
samples, respectively (Figure 2b). Changes of
acidity throughout storage are similar to those
reported by other researchers (Begum et al.
2018, Hossain et al. 2016, Islam et al. 2014).
Begum et al. (2018) reported an acidity
increase from 0.30 to 0.37% in mixed fruit
juices during 30 days of storage at an ambient
temperature. Hossain et al. (2016) stated an
acidity increase from 0.30 to 0.56% in mixed
fruit juice during four months of storage at 25
°C. Islam et al. (2014) worked on mixed fruit
juice of orange and pineapple and described
similar results in acidity increase during the
storage period of 35 days.
Figure 2: Titratable acidity (%) of different mixed fruit juice samples before pasteurisation (a).
Changes of titratable acidity in pasteurised fruit juice samples during a one-month
storage period at an ambient temperature (b). The points are the means of the
measured values from three replicates, with error bars indicating the standard error at
each time-point.
pH
Figure 3 displays pH in fruit juice samples
before and after pasteurisation, and during
storage at an ambient temperature for one
month. For each mixed fruit juice, pH values
ranging between 3.87 and 3.90 were quantified
in unpasteurised mixed juices (Figure 3a). The
pasteurised juices S3 showed a considerable

Tanz. J. Sci. Vol. 47(1), 2021
339
change in pH from 3.90 0.02 to 3.84 0.02 at
day zero (Figure 3b). This implies that the
pasteurisation process affected the juice sample
S3 and not juice samples S1, S2, and S4 as
depicted in Figure 3. On the other hand, the pH
decreased to 3.86 0.06, 3.87 0.04, 3.84
0.02, and 3.83 0.03 in samples S1, S2, S3, and
S4, respectively at the end of 30 days of storage
(Figure 3b). In general, pH is inversely
proportional to the acidity of the respective
solution. As such, the results explicitly showed
that the increase in titratable acidity (Figure 2b)
decreases the pH of the respective sample
during storage (Figure 3b). Both reductions in
pH and increase in acidity can probably be
explained by the degradation of carbohydrates
in the respective juice during storage. These
findings are aligned with the results reported by
other researchers (Begum et al. 2018, Biswas et
al. 2016, Hossain et al. 2016). Biswas et al.
(2016) reported that the pH of fruit juices
decreased from 3.9 to 3.6 as the acidity
increased from 0.17% to 19% during 21 days
of storage. Likewise, Hossain et al. (2016)
stated a gradual decrease in pH during storage.
However, it should be pointed out that these
researchers worked on fruit juices blended
from different fruits, rather than the ones
presented in this current study.
Figure 3: pH of different mixed fruit juice samples before pasteurisation (a). Change of pH in
pasteurised fruit juices during a one-month storage period at an ambient temperature
(b). The points are the means of the measured values from three replicates, with error
bars representing the standard error at each time-point.
Total soluble solids (TSS)
Figure 4 shows the total soluble solids in
unpasteurised samples and pasteurised juices.
TSS values ranging from 13.7 to 13.9 °Brix
were found in the unpasteurised juice samples.
Significant changes (p < 0.05) in TSS were
observed in samples S1, S2, and S3 after
pasteurisation. These changes were measured
to be 13.4 ± 0.08, 13.6 ± 0.06, 13.6 ± 0.04, and
13.7 ± 0.18 °Brix in S1, S2, S3, and S4 samples,
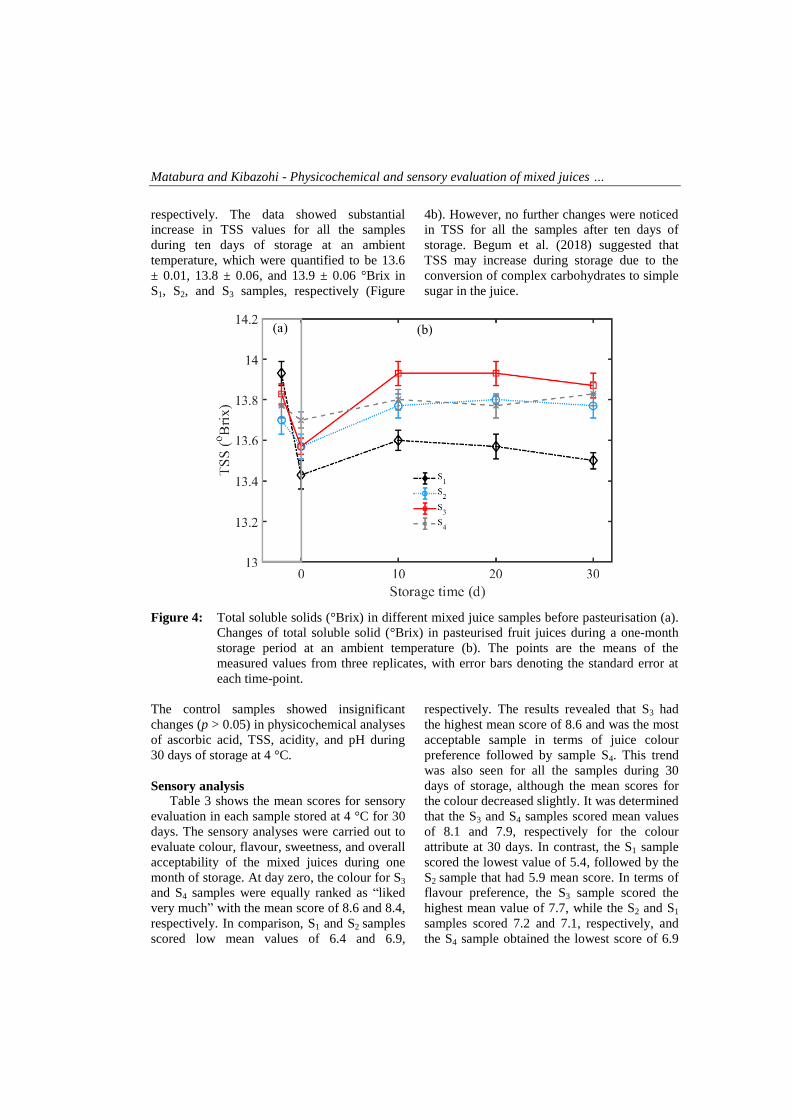
Matabura and Kibazohi - Physicochemical and sensory evaluation of mixed juices …
respectively. The data showed substantial
increase in TSS values for all the samples
during ten days of storage at an ambient
temperature, which were quantified to be 13.6
± 0.01, 13.8 ± 0.06, and 13.9 ± 0.06 °Brix in
S1, S2, and S3 samples, respectively (Figure
4b). However, no further changes were noticed
in TSS for all the samples after ten days of
storage. Begum et al. (2018) suggested that
TSS may increase during storage due to the
conversion of complex carbohydrates to simple
sugar in the juice.
Figure 4: Total soluble solids (°Brix) in different mixed juice samples before pasteurisation (a).
Changes of total soluble solid (°Brix) in pasteurised fruit juices during a one-month
storage period at an ambient temperature (b). The points are the means of the
measured values from three replicates, with error bars denoting the standard error at
each time-point.
The control samples showed insignificant
changes (p > 0.05) in physicochemical analyses
of ascorbic acid, TSS, acidity, and pH during
30 days of storage at 4 °C.
Sensory analysis
Table 3 shows the mean scores for sensory
evaluation in each sample stored at 4 °C for 30
days. The sensory analyses were carried out to
evaluate colour, flavour, sweetness, and overall
acceptability of the mixed juices during one
month of storage. At day zero, the colour for S3
and S4 samples were equally ranked as “liked
very much” with the mean score of 8.6 and 8.4,
respectively. In comparison, S1 and S2 samples
scored low mean values of 6.4 and 6.9,
respectively. The results revealed that S3 had
the highest mean score of 8.6 and was the most
acceptable sample in terms of juice colour
preference followed by sample S4. This trend
was also seen for all the samples during 30
days of storage, although the mean scores for
the colour decreased slightly. It was determined
that the S3 and S4 samples scored mean values
of 8.1 and 7.9, respectively for the colour
attribute at 30 days. In contrast, the S1 sample
scored the lowest value of 5.4, followed by the
S2 sample that had 5.9 mean score. In terms of
flavour preference, the S3 sample scored the
highest mean value of 7.7, while the S2 and S1
samples scored 7.2 and 7.1, respectively, and
the S4 sample obtained the lowest score of 6.9
Tanz. J. Sci. Vol. 47(1), 2021
341
at day zero (Table 3). After 30 days of storage,
the S3 sample scored the highest mean value of
7.8 and was ranked as “likely moderate” in
terms of its flavour. The least mean value of
6.0 was found in the sample S4, which indicates
the least preference by the panellists in terms of
flavour (Table 3). No significant difference (p
> 0.05) in flavour was found in S1, S2, and S3
samples throughout the storage time. At day
zero, the S1 sample scored the mean value of
7.8 in terms of the sweetness parameter and
was preferred by the panellists. After 30 days
of storage, the tested S3 sample became the
sweetest sample as it scored the mean value of
7.5. In addition, the S1 and S2 samples were
observed to be significantly different (p < 0.05)
from the S3 sample (Table 3) in terms of
sweetness attribute. The overall acceptance
results indicated that the S3 sample had the
highest scores of 7.8 at day zero and 7.6 at 30
days. Therefore, these results suggested that the
S3 sample of 80% banana juice and 20%
passion juice was the most appealing sample
for all the sensory attributes, i.e., colour,
flavour, sweetness, and overall acceptance
during storage.
Table 3: Mean scores for sensory evaluation of mixed fruit juices at 0 d and 30 d of the storage
period in a fridge set at 4 °C; values with different superscripts for each sensory parameter indicate
that the means are significantly different at p < 0.05. Storage
time (d) Sensory attributes
0 30
Sample Colour Flavour Sweetness Overall
acceptance
Colour Flavour Sweetness Overall
acceptance
S1 6.4a 7.1
a 7.5
a 7.2
ab 5.7
a 6.4
a 6.5
a 6.8
a
S2 6.9a 7.2
a 7.1
a 7.0
ab 5.9
a 6.5
a 6.6
a 6.7
a
S3 8.6b 7.7
a 7.4
a 7.8
a 8.1
b 7.8
b 7.5
b 7.6
b
S4 8.4b 6.9
a 6.8
a 6.9
b 7.9
b 6.0
a 6.8
ab 6.3
a
Conclusion
In this study, the physicochemical and
organoleptic properties of mixed fruit juices
that contain low viscosity banana juice as the
main component with pineapple or passion
fruit juice were investigated. The ascorbic acid
content, acidity, total soluble solids, and pH
changed during one month of storage. The
results demonstrated a decreasing trend in
ascorbic acid and pH as the acidity increases
when stored at an ambient temperature. Total
soluble solids increased during ten days of
storage. The ratio of 80% low viscosity banana
juice and 20% passion juice scored the highest
hedonic scale on each sensory attribute
considered throughout the storage time. Hence,
banana juice can be the main ingredient of the
mixed juices, especially when blended with
passion fruit juice at the observed ratio.
The results of this study are very useful to
stakeholders in the food sector. They provide
insights on understanding the quality changes
of mixed fruit juices during shelf-life storage
for low viscosity banana juice blended with
passion or pineapple juice. The data presented
in this work, are indispensable for assessing
quality and consumers’ acceptability, which
were previously missing, especially for low
viscosity banana juice blended with passion or
pineapple juice. Future work will focus on
microbial analyses, which may provide insights
into low viscosity banana juice blended with
passion and pineapple juices during long shelf-
life storage.
Acknowledgment
The authors gratefully acknowledge the
financial support from the Swedish
International Development Cooperation
Agency (SIDA) of Sweden through the Sida
Program at the University of Dar es Salaam,
Tanzania. The authors would also like to thank
the panellists/team members who volunteered
to test the samples of the juices.
Matabura and Kibazohi - Physicochemical and sensory evaluation of mixed juices …
Conflict of Interest: The authors declare that
there is no conflict of interest regarding this
work.
References
Amao I 2018 Health benefits of fruits and
vegetables: Review from Sub-Saharan
Africa. In: Asaduzzaman M and Asao T
(Eds) Vegetables: Importance of Quality
Vegetables to Human Health (pp. 33-53),
IntechOpen.
Begum S, Das PC and Karmoker P 2018
Processing of mixed fruit juice from
mango, orange and pineapple. Fundam.
Appl. Agric. 3(2): 440-445.
Bello OO, Bello TK, Fashola MO and Afolabi
O 2014 Microbiological quality of some
locally-produced fruit juices in Ogun State,
South western Nigeria. Afr. J. Microbiol.
Res. 2(1): 1-8.
Biswas S, Masih D, Singh M and Sonkar C
2016 Development and quality evaluation
of Aloe vera and pineapple juice blended
beverage. Int. Res. J. Eng. Technol. 03(10):
214- 220.
Byarugaba-Bazirake GW 2008 The effect of
enzymatic processing on banana juice and
wine. PhD thesis, Stellenbosch University,
South Africa.
Curi PN, Almeida ABD ,Tavares BDS, Nunes
CA, Pio R, Pasqual M and Souza VRD
2017 Optimization of tropical fruit juice
based on sensory and nutritional
characteristics. J. Food Sci. Technol. 37(2):
308-314.
Dhandevi PEM and Jeewon R 2015 Fruit and
vegetable intake: benefits and progress of
nutrition education interventions-narrative
review article. Iran. J. Public Health
44(10): 1309.
El-Ramady HR, Domokos-Szabolcsy É,
Abdalla NA, Taha HS and Fári M 2015
Postharvest management of fruits and
vegetables storage. In: Lichtfouse E (Ed)
Sustainable Agriculture Reviews vol. 15
(pp. 65-152), Springer, Cham.
Hossain M, Shishir MRI, Saifullah KUS,
Safeuzzaman RM 2016 Production and
investigation of biochemical and
organoleptic changes of mixed fruit juice
during storage period. Int. J. Food Sci.
Nutri. Diet. 5(3): 271-277.
Islam MA, Ahmad I, Ahmed S and Sarker A
2014 Biochemical composition and shelf
life study of mixed fruit juice from orange
and pineapple. J. Environ. Sci. Nat. Resour
7(1): 227-232.
James A and Zikankuba V 2017 Postharvest
management of fruits and vegetable: A
potential for reducing poverty, hidden
hunger and malnutrition in sub-Sahara
Africa. Cogent Food & Agric. 3(1):
1312052.
Kibazohi O, Kyamuhangire W, Kaunga DL
and Rokoni C 2017 Process improvement
for mechanical extraction of lowviscosity
clear banana juice. Afr. J. Food Sci. 11(8):
291-295.
Kulkarni SG and Vijayanand P 2010 Effect of
extraction conditions on the quality
characteristics of pectin from passion fruit
peel (Passiflora edulis f. flavicarpa L.).
LWT-Food Sci. Technol. 43(7): 1026-1031.
Kyamuhangire W, Myhre H, Sorensen HT and
Pehrson P 2002 Yield, characteristics and
composition of banana juice extracted by
the enzymatic and mechanical methods. J.
Sci. Food Agric. 82(4):478-482.
Majaliwa N, Kibazohi O and Alminger M 2019
Optimization of process parameters for
mechanical extraction of banana juice using
response surface methodology. J. Food Sci.
Technol. 56(9): 4068-4075.
NBS (National Bureau of Statistics) 2017
Annual Agriculture Sample Survey
2016/17, United Republic of Tanzania , 88.
Okop KJ, Ndayi K, Tsolekile L, Sanders D and
Puoane T 2019 Low intake of commonly
available fruits and vegetables in socio-
economically disadvantaged communities
of South Africa: influence of affordability
and sugary drinks intake. BMC Public
Health 19(1): 940.
Orrego CE, Salgado N and Botero CA 2014
Developments and trends in fruit bar

Tanz. J. Sci. Vol. 47(1), 2021
343
production and characterization. Crit. Rev.
Food Sci. Nutr. 54(1): 84-97.
Pillay M and Fungo R 2016 Diversity of iron
and zinc content in bananas from East and
Central Africa. HortSci. 51(4): 320-324.
Rasheed A and Azeez RFA 2019 A review on
natural antioxidants. In: Mordeniz C (Ed)
Traditional and Complementary Medicine.
IntechOpen.
Reddy SC, Sucharitha KV, Reddy KJ and
Syamala B 2017 Development and
evaluation of physico-chemical quality
markers of opuntia and pineapple squash.
Int. J. Adv. Res. 5(2): 941-950.
Singh V, Hedayetullah M, Zaman P and Meher
J 2014 Postharvest technology of fruits and
vegetables: an overview. J. Post Harvest
Technol. 2(2): 124-135.
Slavin JL and Lloyd B 2012 Health benefits of
fruits and vegetables. Adv. Nutr. 3(4): 506-
516.
Tiwari BK, O'Donnell CP, Muthukumarappan
K, Cullen PJ 2009 Ascorbic acid
degradation kinetics of sonicated orange
juice during storage and comparison with
thermally pasteurized juice. LWT-Food. Sci.
Technol. 42(3): 700-704.
Toivonen PM, Mitcham EJ and Terry LA 2014
Postharvest care and the treatment of fruits
and vegetables. In: Dixon GR and Aldous
DE (Eds) Horticulture: Plants for People
and Places, vol. 1 (pp. 465-483), Springer,
Dordrecht.
USDA 2001 Banana Visual Aid.
https://www.ams.usda.gov/sites/default/file
s/media/Bananas_
Visual_Aid%5B1%5D.pdf. Accessed 08
July 2020.
Vicent V, Ndoye FT, Verboven P, Nicolai BM
and Alvarez G 2018 Quality changes
kinetics of apple tissue during frozen
storage with temperature fluctuations. Int.
J. Refrig. 92: 165-175.
WHO 2003 Diet, nutrition, and the prevention
of chronic diseases: Report of a Joint
WHO/FAO Expert Consultation, WHO
Technical Report Series No. 916. World
Health Organization, Geneva, Switzerland.
Wong YS, Sia CM, Eng H, Ang YK, Chang
SK and Yim HS 2014 Influence of
extraction conditions on antioxidant
properties of passion fruit (Passiflora
edulis) peel. Acta Sci. Pol. Technol.
Aliment. 13(3): 257-265.


![Physicochemical and Sensory Characteristics of a Chagalapoli …downloads.hindawi.com/journals/ijfs/2019/9687281.pdf · 2019-10-12 · Organisation of Vine and Wine [13]. Colorimetric](https://static.fdocuments.us/doc/165x107/5ec8631ec3bf4e3c3d47d129/physicochemical-and-sensory-characteristics-of-a-chagalapoli-2019-10-12-organisation.jpg)


