

Physicians in Canada, 2017 · email ([email protected]). Any questions regarding this publication...
58
Physicians in Canada, 2017 Summary report February 2019
Transcript of Physicians in Canada, 2017 · email ([email protected]). Any questions regarding this publication...

Production of this document is made possible by financial contributions from Health Canada and provincial and territorial governments. The views expressed herein do not necessarily represent the views of Health Canada or any provincial or territorial government.
Unless otherwise indicated, this product uses data provided by Canada’s provinces and territories.
All rights reserved.
The contents of this publication may be reproduced unaltered, in whole or in part and by any means, solely for non-commercial purposes, provided that the Canadian Institute for Health Information is properly and fully acknowledged as the copyright owner. Any reproduction or use of this publication or its contents for any commercial purpose requires the prior written authorization of the Canadian Institute for Health Information. Reproduction or use that suggests endorsement by, or affiliation with, the Canadian Institute for Health Information is prohibited.
For permission or information, please contact CIHI:
Canadian Institute for Health Information495 Richmond Road, Suite 600Ottawa, Ontario K2A 4H6Phone: 613-241-7860Fax: [email protected]
ISBN 978-1-77109-745-1 (PDF)
© 2019 Canadian Institute for Health Information
How to cite this document:Canadian Institute for Health Information. Physicians in Canada, 2017. Ottawa, ON: CIHI; 2019.
Cette publication est aussi disponible en français sous le titre Les médecins au Canada, 2017.ISBN 978-1-77109-746-8 (PDF)

Table of contentsAbout CIHI’s physician data . . . . . . . . . . . . . . . . . . . . . . . . . . . . . . . . . . . . . . . . . . . . . . . . . . . 4
More information . . . . . . . . . . . . . . . . . . . . . . . . . . . . . . . . . . . . . . . . . . . . . . . . . . . . . . . . . . . 6
Highlights . . . . . . . . . . . . . . . . . . . . . . . . . . . . . . . . . . . . . . . . . . . . . . . . . . . . . . . . . . . . . . . . 8
Supply, demographics and migration . . . . . . . . . . . . . . . . . . . . . . . . . . . . . . . . . . . . . . . . . . . 10
Physician supply . . . . . . . . . . . . . . . . . . . . . . . . . . . . . . . . . . . . . . . . . . . . . . . . . . . . . . . 11
Physician demographics . . . . . . . . . . . . . . . . . . . . . . . . . . . . . . . . . . . . . . . . . . . . . . . . . 15
International medical graduates . . . . . . . . . . . . . . . . . . . . . . . . . . . . . . . . . . . . . . . . . . . . 19
Physician payments and utilization . . . . . . . . . . . . . . . . . . . . . . . . . . . . . . . . . . . . . . . . . . . . 23
How much are physicians paid? . . . . . . . . . . . . . . . . . . . . . . . . . . . . . . . . . . . . . . . . . . . . 24
Physician full-time equivalents . . . . . . . . . . . . . . . . . . . . . . . . . . . . . . . . . . . . . . . . . . . . . . . . 29
Types of physician remuneration . . . . . . . . . . . . . . . . . . . . . . . . . . . . . . . . . . . . . . . . . . . 31
FFS utilization . . . . . . . . . . . . . . . . . . . . . . . . . . . . . . . . . . . . . . . . . . . . . . . . . . . . . . . . . . . . 35
Appendix: Text alternatives for figures . . . . . . . . . . . . . . . . . . . . . . . . . . . . . . . . . . . . . . . . . . 38

4
Physicians in Canada, 2017
About CIHI’s physician dataCollecting and reporting physician information assists decision-makers in the planning, distribution and funding of physicians. Information on the supply, distribution and migration of physicians from the data sources used in this report has been collected since 1968, and information on physician service utilization and payments has been collected since 1989. The Canadian Institute for Health Information (CIHI) has reported on this information since its inception in 1994.
Starting in 2014, CIHI merged data from Scott’s Medical Database and the National Physician Database into a single release. This provides readers with a set of documents for all physician-related data on the supply of physicians, their payments and the services they provide.
What’s new in this report• For the first time, CIHI is introducing a more comprehensive full-time
equivalence metric that includes both fee-for-service (FFS) and alternative payment plan (APP) programs.
• Due to concerns about the completeness of the underlying data, CIHI is not including estimates on international migration of physicians in and out of Canada in 2017.
5
Physicians in Canada, 2017
To ensure that our work reflects priority needs, we invite our readers to join the discussion using CIHI’s Facebook page (facebook.com/CIHI.ICIS), Twitter account (twitter.com/CIHI_ICIS) or email ([email protected]).
Any questions regarding this publication should be directed to
Program Lead Physician InformationCanadian Institute for Health Information495 Richmond Road, Suite 600Ottawa, Ontario K2A 4H6
Phone: 613-241-7860Fax: 613-241-8120Email: [email protected]
Or visit CIHI online at cihi.ca.

6
Physicians in Canada, 2017
More informationThe following companion products to Physicians in Canada, 2017 are available on CIHI’s website:
• A profile of physicians in Canada, 2017 (infographic; .pdf)
• Supply, Distribution and Migration of Physicians in Canada, 2017 — Data Tables (.xlsx)
• Supply, Distribution and Migration of Physicians in Canada, 2017— Quick Stats (.xlsx)
• Supply, Distribution and Migration of Physicians in Canada, 2017 — Methodological Notes (.pdf)
• Supply, Distribution and Migration of Physicians in Canada, 2017 — Historical Data (.xlsx)
• National Physician Database — Payments Data, 2016–2017 (.xlsx)
• National Physician Database — Utilization Data, 2016–2017 (.xlsx)
• National Physician Database Historical Payments: Data Tables (.xlsx)
• National Physician Database Historical Utilization: Data Tables (.xlsx)
• National Physician Database Data Release, 2016–2017 — Methodological Notes (.pdf)
• Physician Services Benefit Rates, 2016–2017: Data Tables (.xlsx)
• Physician Services Benefit Rates, 2016–2017 — Methodological Notes (.pdf)
PowerPoint slides of key findings for use in presentations are available on demand. Please email [email protected] for more information.

7
Physicians in Canada, 2017
The following health workforce products are also available at cihi.ca:
• Regulated Nurses, 2017 (.pdf)
• Health Workforce, 2017 — Data Tables (.xlsx)
• Health Workforce, 2017: Indicators (.xlsx)
• Health Workforce Database, 2017 — Methodology Guide (.pdf)
• Canada’s Health Care Providers: Provincial Profiles, 2008 to 2017 — Data Tables (.xlsx)
Feedback and questions are welcome at [email protected].

8
Physicians in Canada, 2017
Highlights This report contains information on the supply of physicians in Canada, physician service utilization and payments to physicians that are administered through the provincial and territorial medical care plans. Data on the supply, demographics and migration of physicians is as of December 31, 2017. Service utilization and payments data is for fiscal year 2016–2017.
Clinical payments to physicians in Canada increased 2.8% over the previous year.
• In 2016–2017, total clinical payments to physicians increased 2.8% over the previous year to $26.4 billion; this is the lowest single-year increase since CIHI began reporting total clinical payments to physicians in 2000–2001.
• Over the last 5 years, the proportion of clinical payments paid through fee for service has gradually increased from 70.6% to 72.6% of total clinical payments.
The average gross payment per physician was virtually unchanged.
• The average gross clinical payment per physician in 2016–2017 was $342,000; this amount is virtually unchanged from 2015–2016 (up 0.6%). The average gross clinical payment per physician, in the jurisdictions able to report, ranged from $274,000 in Newfoundland and Labrador to $386,000 in Alberta.
• The average gross clinical payment to family medicine physicians decreased by less than 1% in 2016–2017 to $277,000. The average gross clinical payment per medical specialist increased by 1.2% to $357,000, and the average per surgical specialist was $477,000, a small increase (1.1%) over 2015–2016.

9
Physicians in Canada, 2017
Consultations and visits made up the majority of both services and payments.
• In 2016–2017, the average cost per service paid to physicians was $65.38. Family physicians billed an average cost per service of $48.11, while medical and surgical specialists billed an average of $83.96 and $89.24 per service, respectively.
For the 11th year in a row, the number of physicians and the number per 100,000 population increased in Canada.
• In 2017, there were 86,644 physicians in Canada, representing a 3.1% increase over 2016. This is in line with the growth rates observed over the previous 5 years.
• Between 2013 and 2017, growth in the number of physicians outpaced population growth, resulting in 234 physicians per 100,000 population in 2017.
• The number of female physicians in the workforce continued to rise. Between 2013 and 2017, the number of female physicians increased by 19.2%, while the number of male physicians increased by 6.8%.
• The average age of physicians remained stable at 50.2 years from 2013 to 2017. The average age of female physicians was 46.3, while the average age of male physicians was 52.8.
• Over one-quarter of physicians in Canada in 2017 (26.5%) had received their MD degree outside of Canada, representing 30.2% of family physicians and 22.5% of specialists.

10
Physicians in Canada, 2017
Physician supply, demographic and migration data includes active physicians in clinical and non-clinical practice (e.g., research and academia) who have an MD degree and a valid mailing address. The data excludes residents, physicians in the military, and semi-retired and retired physicians. The data also excludes non-registered physicians who requested that their information not be published as of December 31 of the reference year. Data is as of December 31, 2017.
Supply, demographics and migration

11
Physicians in Canada, 2017
Physician supplyThe physician supply in Canada is increasing. In 2017, there were more physicians and more per 100,000 population than ever before.
12
Physicians in Canada, 2017
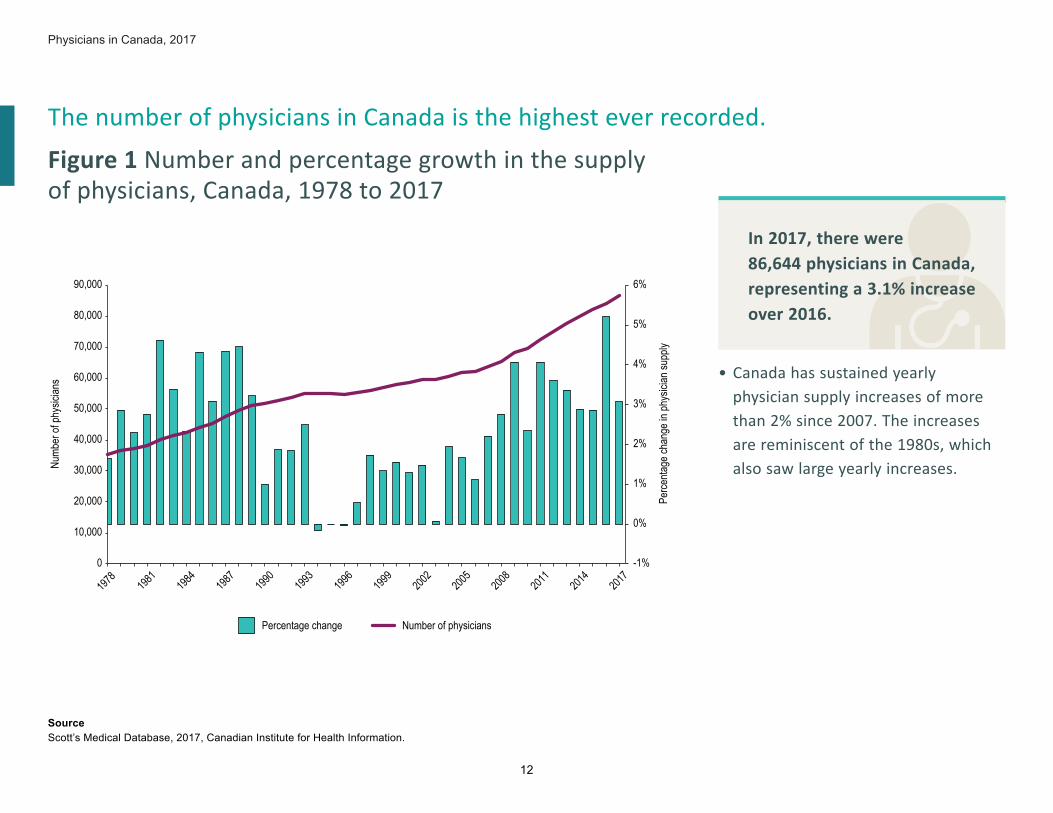
In 2017, there were 86,644 physicians in Canada, representing a 3.1% increase over 2016.
Number of physicians
-1%
0%
1%
2%
3%
4%
5%
6%
0
10,000
20,000
30,000
40,000
50,000
60,000
70,000
80,000
90,000
1978
1981
1984
1987
1990
1993
1996
1999
2002
2005
2008
2011
2014
2017
Perce
ntage
chan
ge in
phys
ician
supp
ly
Numb
er of
phys
ician
s
Percentage change
SourceScott’s Medical Database, 2017, Canadian Institute for Health Information.
The number of physicians in Canada is the highest ever recorded.
Figure 1 Number and percentage growth in the supply of physicians, Canada, 1978 to 2017
• Canada has sustained yearly physician supply increases of more than 2% since 2007. The increases are reminiscent of the 1980s, which also saw large yearly increases.

13
Physicians in Canada, 2017
0
50
100
150
200
250
SpecialistsFamily medicine All physicians
1978: 147
2013: 2202017: 234
Numb
er of
phys
ician
s per
100,0
00 po
pulat
ion
1978
1981
1984
1987
1990
1993
1996
1999
2002
2005
2008
2011
2014
2017
SourceScott’s Medical Database, 2017, Canadian Institute for Health Information.
Physician supply in Canada continues to outpace population growth.
Figure 2 Number of physicians per 100,000 population, by specialty, Canada, 1978 to 2017
• In 2017, there were 234 physicians per 100,000 population: 119 family medicine physicians and 115 specialists per 100,000.
• Nationally, the proportion of family medicine and specialist physicians has remained relatively equal since the late 1970s, with family medicine physicians representing between 50% and 53% of the physician workforce.
Between 2013 and 2017, the number of physicians increased at a faster rate than the population, resulting in more physicians per 100,000 population than ever before.

14
Physicians in Canada, 2017
The number of physicians per 100,000 population in Canada increased by 6.6% between 2013 and 2017.
• Jurisdictions with the highest number of physicians per 100,000 population included Nova Scotia and Newfoundland and Labrador (257 and 255 per 100,000 population, respectively).
• The number of physicians per 100,000 population in Alberta increased by 11.0% between 2013 and 2017, representing the largest increase of all jurisdictions.
The number of physicians per 100,000 population in Canada is the highest ever recorded.
Figure 3 Number of physicians per 100,000 population, by jurisdiction, 2013 and 2017
NoteThe Northwest Territories and Nunavut were excluded from this analysis due to small numbers.SourceScott’s Medical Database, 2017, Canadian Institute for Health Information.
0
50
100
150
200
250
300
N.L. P.E.I. N.S. N.B. Que. Ont. Man. Sask. Alta. B.C. Y.T. Canada
Num
ber o
f phy
sician
s per
100
,000
pop
ulatio
n
2013 2017

15
Physicians in Canada, 2017
Physician demographicsThe proportion of female physicians continues to rise, particularly among family medicine physicians. The average age of physicians is stable.

16
Physicians in Canada, 2017
NoteThe Northwest Territories and Nunavut were excluded from this analysis due to small numbers.SourceScott’s Medical Database, 2017, Canadian Institute for Health Information.
Between 2013 and 2017, the number of female physicians increased by 19.2%, while the number of male physicians increased by 6.8%.
The proportion of female physicians increased in all provinces.
Figure 4 Percentage of female physicians, by jurisdiction, 2013 and 2017
• In 2017, 41.0% of physicians were women, compared with 38.3% in 2013.
• Quebec had the highest proportion of female physicians at 48.5%, while P.E.I. had the lowest at 32.3%.
2013 2017
0%
10%
20%
30%
40%
50%
60%
N.L. P.E.I. N.S. N.B. Que. Ont. Man. Sask. Alta. B.C. Y.T. Canada
Perce
ntage
of fe
male
phys
ician
s

17
Physicians in Canada, 2017
SourceScott’s Medical Database, 2017, Canadian Institute for Health Information.
Across all jurisdictions, females represented a larger proportion of family medicine physicians than specialists.
Females represent a larger proportion of family medicine physicians than specialists.
Figure 5 Percentage of physicians, by sex and physician type, 1978 to 2017
• In Canada in 2017, 45.5% of family medicine physicians were female and 54.5% were male.
• 36.2% of specialist physicians were female in 2017 and 63.8% of specialist physicians were male.
• The overall proportion of female physicians in the workforce has grown from 11.1% in 1978 to 41.0% in 2017.
Family medicine, maleFamily medicine, femaleSpecialists, maleSpecialists, female
0%
10%
20%
30%
40%
50%
60%
70%
80%
90%
100%
1978
1981
1984
1987
1990
1993
1996
1999
2002
2005
2008
2011
2014
2017
Perce
ntage
of ph
ysici
ans

18
Physicians in Canada, 2017
The average age of physicians remained stable over 5 years.
Figure 6 Average age of physicians in Canada, by jurisdiction, 2013 and 2017
NoteThe Northwest Territories and Nunavut were excluded from this analysis due to small numbers.SourceScott’s Medical Database, 2017, Canadian Institute for Health Information.
• Overall in 2017, the jurisdiction with the highest average age was P.E.I., at 53.0 years, and the jurisdiction with the lowest average age was Yukon, at 47.4.
• Between 2013 and 2017, the average age of physicians remained stable in Quebec; decreased in Ontario, Saskatchewan, B.C. and Yukon; and increased in all other provinces.
2013 2017
40
42
44
46
48
50
52
54
N.L. P.E.I. N.S. N.B. Que. Ont. Man. Sask. Alta. B.C. Y.T. Canada
Aver
age p
hysic
ian ag
e
The average age of physicians in Canada remained stable at 50.2 years from 2013 to 2017. In 2017, the average age of physicians ranged from 47.4 to 53.0 across all jurisdictions.

19
Physicians in Canada, 2017
International medical graduatesCanada continues to gain internationally trained physicians. More family physicians than specialists received their MD degree outside of Canada.

20
Physicians in Canada, 2017
NoteThe Northwest Territories and Nunavut were excluded from this analysis due to small numbers.SourceScott’s Medical Database, 2017, Canadian Institute for Health Information.
Canada continues to gain internationally trained physicians.
Figure 7 Percentage of physicians with international MD degrees, by jurisdiction, 2013 and 2017
• Saskatchewan and Newfoundland and Labrador had the largest proportions of internationally trained physicians (53.1% and 38.0%, respectively), while Quebec and P.E.I. had the smallest (9.5% and 15.9%, respectively).
2013 2017
0%
10%
20%
30%
40%
50%
60%
N.L. P.E.I. N.S. N.B. Que. Ont. Man. Sask. Alta. B.C. Y.T. Canada
Perce
ntage
of ph
ysici
ans w
ith in
terna
tiona
l MD
degr
ees
The percentage of physicians who received their MD degree outside of Canada increased slightly in recent years, from 25.3% in 2013 to 26.5% in 2017.

21
Physicians in Canada, 2017
SourceScott’s Medical Database, 2017, Canadian Institute for Health Information.
Over one-quarter (26.5%) of Canada’s physicians received their MD degree outside of Canada.
In recent years, more family physicians than specialists have received their MD degree outside of Canada.
Figure 8 Percentage of physicians with international MD degrees, by physician type, 1978 to 2017
• In 2017, more family physicians (30.2%) than specialists (22.5%) received their MD degree outside of Canada.
• The percentage of internationally trained family medicine physicians in Canada increased from 28.0% in 2013 to 30.2% in 2017, while the percentage of specialists remained virtually the same at 22.5%.
SpecialistsFamily medicine All physicians
2017: 22.5%
2017: 30.2%
0%
10%
20%
30%
40%
1978
1981
1984
1987
1990
1993
1996
1999
2002
2005
2008
2011
2014
2017
Perce
ntage
of ph
ysici
ans w
ith in
terna
tiona
l MD
degr
ees
1978: 31.6%
1978: 33.4%

22
Physicians in Canada, 2017
SourceScott’s Medical Database, 2017, Canadian Institute for Health Information.
Physicians from South Africa, India, and the United Kingdom combined made up 29.7% of all internationally trained physicians in Canada in 2017.
More internationally trained physicians received their MD degree in South Africa than in any other country.
Figure 9 Top 10 countries of MD graduation for internationally trained physicians, by physician type, 2017
• In 2017, family medicine physicians accounted for 58.2% of all internationally trained physicians.
• The top country of graduation for internationally trained family medicine physicians was South Africa, while the top country of graduation for internationally trained specialists was India.
Family medicine Specialists
0 500 1,000 1,500 2,000 2,500
Poland
Iran
Nigeria
Pakistan
United States
Egypt
Ireland
United Kingdom
India
South Africa
Number of physicians
Coun
try of
MD
grad
uatio
n

23
Physicians in Canada, 2017
This report contains information on physician service utilization and on payments to physicians that are administered through the provincial and territorial medical care plans. This data is for 2016–2017.
Physician payments and utilization

24
Physicians in Canada, 2017
How much are physicians paid?The cost of physician services in Canada can be understood by examining total and average clinical payments to physicians, the types of services paid for, and information about the providers and recipients of these services.
Since 2009, CIHI has reported average gross clinical payments made to physicians by provincial/territorial medical care plans. These payment amounts are calculated as the sum of all gross clinical payments (FFS and alternative payments) divided by the total number of physicians reported to CIHI by the jurisdictions. In addition to total average payments per physician, CIHI publishes a series of specialty-level average payments per physician for 8 jurisdictions, including distributions of payments, standard deviations and average payments with monetary cut-offs.

25
Physicians in Canada, 2017
NotesFFS: Fee for service.Excludes Nunavut. Nunavut does not report to the National Physician Database. SourceNational Physician Database, Canadian Institute for Health Information.
FFS clinical payments to physicians reached $19.2 billion in 2016–2017, while alternative payments reached $7.2 billion.
Total gross clinical payments to physicians increased to $26.4 billion in 2016–2017.
Figure 10 Total gross clinical and FFS payments to physicians, Canada, 1999–2000 to 2016–2017
• In 2016–2017, total clinical payments to physicians increased 2.8% over the previous year to $26.4 billion; this is the lowest single-year increase since CIHI began reporting total payments to physicians in 2000–2001.
FFS clinical payments ($ billions)Total gross clinical payments ($ billions)
$19.2 billion
$26.4 billion
$0
$5
$10
$15
$20
$25
$30
Paym
ents
in bil
lions
of do
llars
1999–2
000
2000–2
001
2001–2
002
2002–2
003
2003–2
004
2004–2
005
2005–2
006
2006–2
007
2007–2
008
2008–2
009
2009–2
010
2010–2
011
2011–2
012
2012–2
013
2013–2
014
2014–2
015
2015–2
016
2016–2
017

26
Physicians in Canada, 2017
NotesDue to the greater proportion of short-term, visiting and locum physicians and their lower associated payments in certain smaller jurisdictions relative to larger ones, in an attempt to improve comparability, CIHI has agreed to calculate the average payment per physician using only permanent in-province physicians in P.E.I. and physicians whose total gross payments are at least $60,000 in Yukon (2012–2013 not reported for Yukon). Results for Nova Scotia not reported due to data quality concerns.Data is not available for the Northwest Territories or Nunavut. Nunavut does not report to the National Physician Database.SourceNational Physician Database, Canadian Institute for Health Information.
The average gross clinical payment per physician in Canada was $342,000 in 2016–2017, a 4.1% increase over 2012–2013. Some jurisdictions saw increases, while others saw decreases.
The average gross clinical payments to physicians increased 4.1% over 5 years.
Figure 11 Average gross clinical payments to physicians, by jurisdiction, 2012–2013 and 2016–2017
• The average gross payment in Manitoba increased from $306,000 to $360,000 (17.8%).
• The average gross payment in Ontario decreased from $367,000 to $345,000 (-6.2%).2012–2013 2016–2017
$0
$50,000
$100,000
$150,000
$200,000
$250,000
$300,000
$350,000
$400,000
N.L. P.E.I. N.S. N.B. Que. Ont. Man. Sask. Alta. B.C. Y.T. Canada
Aver
age c
linica
l pay
ments
to ph
ysici
ans

27
Physicians in Canada, 2017
By combining FFS data with physician-level alternative payment data, CIHI is able to report comprehensive average payments per physician by specialty.
The average gross clinical payment per surgical specialist is higher than that per medical specialist and family medicine physician.
Figure 12 Average gross clinical payments, by physician specialty, Canada, 2016–2017
NoteExcludes Nova Scotia, Saskatchewan, Alberta, the Northwest Territories and Nunavut. Nunavut does not report to the National Physician Database.Source National Physician Database, Canadian Institute for Health Information.
• The average gross clinical payment per family medicine physician was $277,000.
• The average gross clinical payment per medical specialist was $357,000.
• The average gross clinical payment per surgical specialist was $477,000.
$0 $200,000 $400,000 $600,000
Family medicine
Surgical specialties
Total physicians
Medical specialties
Total medical/surgical specialties
Average gross clinical payment
$273,000$277,000$279,000
$299,000$313,000
$342,000$357,000
$377,000$387,000$394,000$400,000
$426,000$434,000$438,000
$452,000$477,000$481,000
$521,000$600,000
$749,000
PsychiatryFamily medicine
Physical medicinePediatricsNeurology
Total physiciansTotal medical specialists
Plastic surgeryDermatology
Obstetrics/gynecologyInternal medicine
Orthopedic surgeryAnesthesia
OtolaryngologyGeneral surgery
Total surgical specialistsUrology
NeurosurgeryThoracic/cardiovascular surgery
Ophthalmology

28
Physicians in Canada, 2017
Average gross clinical payment varies across Canada.
Figure 13 Average gross clinical payments, by physician specialty and jurisdiction, 2016–2017
Notesn/a: Specialty-level information for Saskatchewan, Alberta and the Northwest Territories at the level needed for this analysis was not available. Results for Nova Scotia not reported due to data quality concerns.n/r: Nunavut does not report to the National Physician Database.Due to the greater proportion of short-term, visiting and locum physicians and their lower associated payments in certain smaller jurisdictions relative to larger ones, in an attempt to improve comparability, CIHI has agreed to calculate the average payment per physician using only permanent in-province physicians in P.E.I. and physicians whose total gross payments are at least $60,000 in Yukon.Canada figures exclude Nova Scotia, Saskatchewan, Alberta, the Northwest Territories and Nunavut.SourceNational Physician Database, Canadian Institute for Health Information.
• The average gross clinical payment per family medicine physician ranged from $209,000 in Newfoundland and Labrador to $307,000 in Ontario.
• The average for medical specialists ranged from $319,000 in Newfoundland and Labrador to $385,000 in Manitoba.
• The average for surgical specialists ranged from $390,000 in New Brunswick to $531,000 in Manitoba.
Canada
B.C.
Alta.
Ont.
Que.
N.L.
N.B.
P.E.I.
N.S.Man.
Sask.
N.W.T.Y.T.
Nun.FM: $263,000MS: $308,000SS: $425,000
FM: $219,000MS: $336,000SS: $480,000 FM: $303,000
MS: $385,000SS: $531,000
FM: $307,000MS: $341,000SS: $480,000
FM: $261,000MS: $384,000SS: $453,000
FM: $255,000MS: $333,000SS: $390,000
FM: $315,000MS: $420,000SS: $545,000
FM: $209,000MS: $319,000SS: $420,000
FM: $277,000MS: $357,000SS: $477,000
FM: n/aMS: n/aSS: n/a
FM: n/aMS: n/aSS: n/a
FM: n/aMS: n/aSS: n/a FM: n/a
MS: n/aSS: n/a
FM: n/rMS: n/rSS: n/r
Family medicine (FM)
Surgical specialists (SS)
Medical specialists (MS)

29
Physicians in Canada, 2017
Physician full-time equivalents
Another metric that can be used to analyze physician payments and supply is the full-time equivalent (FTE). The FTE is used to adjust the total count of physicians to reflect their activity based on total clinical payments.
Historically, CIHI published an FTE indicator based on FFS payments only. Since the late 1990s, there has been considerable migration from FFS to APP payments. As a result, CIHI has developed an enhanced FTE indicator that focuses on a physician’s full clinical payments by including both FFS and APP payments to physicians and replaces the former FTE indicator that used only FFS payment data.
The aim of the new FTE indicator remains the same: to produce statistics that are comparable in 3 dimensions — over time, across jurisdictions and across specialties.
A full description of the FTE indicator methodologies is provided in the Methodological Notes document in appendices C and G.

30
Physicians in Canada, 2017
The FTE methodology uses payments as a proxy for activity and computes FTEs that reflect clinical activity for each given specialty.
NotesFTE: Full-time equivalent.Saskatchewan and Alberta FTEs are based on FFS payments only.Results for Nova Scotia not reported due to data quality concerns.Canada figures exclude Nova Scotia.Data is not available for Yukon, the Northwest Territories or Nunavut. Nunavut does not report to the National Physician Database.SourceNational Physician Database, Canadian Institute for Health Information.
Total average gross clinical payment per FTE physician now includes alternative payments.
Figure 14 Total average gross clinical payment per FTE physician, by physician specialty and jurisdiction, 2016–2017
• The average payment per family medicine FTE in Canada was $321,000.
• The average payment per medical specialist FTE in Canada was $389,000, and the average payment per surgical specialist FTE in Canada was $554,000.
0
$100,000
$200,000
$300,000
$400,000
$500,000
$600,000
$700,000
$800,000
N.L. P.E.I. N.S. N.B. Que. Ont. Man. Sask. Alta. B.C. Canada
Family medicine Surgical specialistsMedical specialties
Aver
age c
linica
l pay
ment
per F
TE ph
ysici
an

31
Physicians in Canada, 2017
Types of physician remunerationSince the introduction of the public medical care system in the 1960s, most physicians in Canada have been compensated through FFS payments. APPs first became prevalent in the mid-1990s; they have become an increasingly popular method of remuneration to physicians in the last 2 decades, now representing nearly 30% of all clinical payments.
Alternative methods of paying physicians include salaries, sessional and hourly rates, capitation models and contract-based payments.
Many physicians receive compensation through multiple models, which could include both FFS and alternative payments; however, funding through FFS and APPs varies significantly across jurisdictions.

32
Physicians in Canada, 2017
NotesFFS: Fee for service.APP: Alternative payment plan.Excludes Nunavut. Nunavut does not report to the National Physician Database.SourceNational Physician Database, Canadian Institute for Health Information.
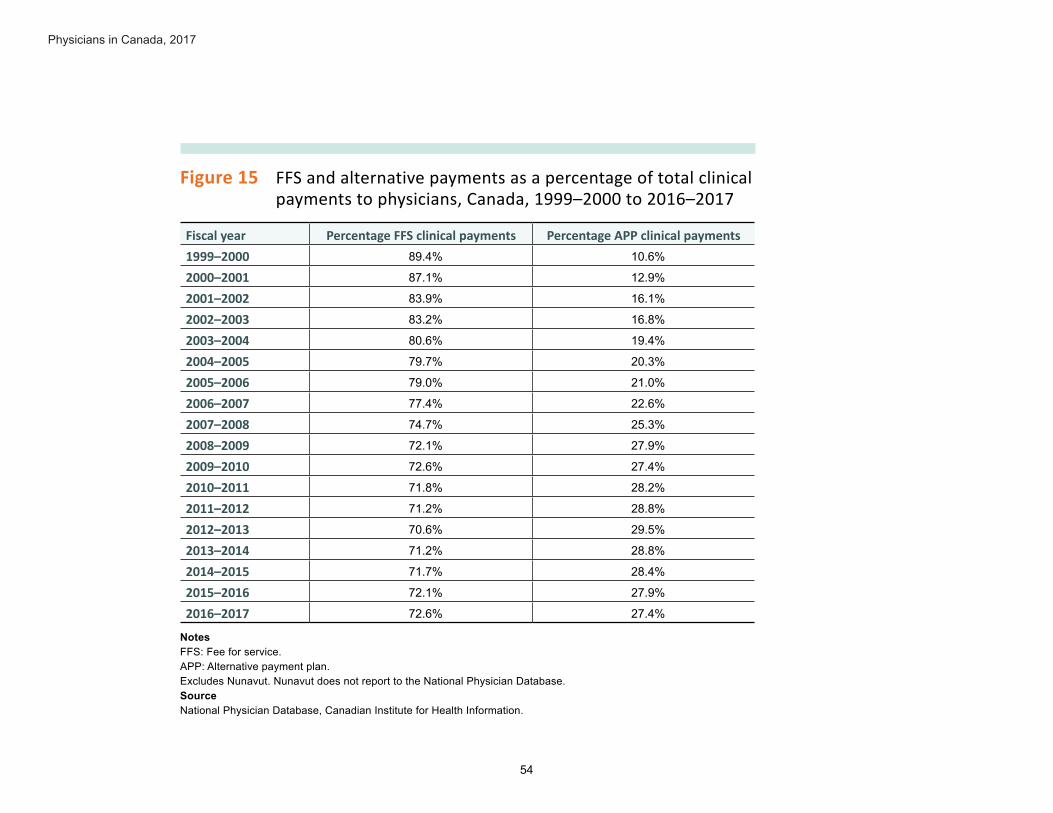
A shift toward APPs in place of FFS payments appears to have stabilized; since 2008–2009, FFS payments have made up between 70% and 73% of total clinical payments.
The proportion of APP clinical payments stabilized between 2008–2009 and 2016–2017.
Figure 15 FFS and alternative payments as a percentage of total clinical payments to physicians, Canada, 1999–2000 to 2016–2017
• In 2016–2017, alternative payments accounted for 27.4% of all gross clinical payments, compared with 10.6% in 1999–2000.
• For the fourth consecutive year, alternative payments as a proportion of total clinical payments decreased slightly.
Percentage APPPercentage FFS
0%
20%
40%
60%
80%
100%
Total
clini
cal p
ayme
nts
1999–2
000
2000–2
001
2001–2
002
2002–2
003
2003–2
004
2004–2
005
2005–2
006
2006–2
007
2007–2
008
2008–2
009
2009–2
010
2010–2
011
2011–2
012
2012–2
013
2013–2
014
2014–2
015
2015–2
016
2016–2
017
27.4% APP
72.6% FFS

33
Physicians in Canada, 2017
Most physicians receive compensation through multiple models, including both FFS and alternative payments.
Figure 16 Distribution of physicians and clinical payments, by payment type and jurisdiction, 2016–2017
NotesFFS: Fee for service.APP: Alternative payment plan.Results for Nova Scotia not reported due to data quality concerns.Data is not available for the Northwest Territories or Nunavut. Nunavut does not report to the National Physician Database.SourceNational Physician Database, Canadian Institute for Health Information.
Over 98% of all physicians are paid a portion of their total payments via FFS, and 68% of physicians are paid a portion via APPs.
• In Ontario and Quebec, almost all physicians (99%) received some FFS payments. The proportion receiving APP payments in those provinces differed: 56% in Ontario and 87% in Quebec.
• Alberta had the lowest proportion of physicians receiving some payments through APPs, at 17%; this proportion varied for all jurisdictions.
0%
20%
40%
60%
80%
100%
N.L. P.E.I. N.S. N.B. Que. Ont. Man. Sask. Alta. B.C. Y.T. Canada
Percentage of physicians who received any APP payments
Percentage of physicians who received any FFS paymentsFFS clinical payments
APP clinical payments

34
Physicians in Canada, 2017
NotesFFS: Fee for service.APP: Alternative payment plan.Excludes Nova Scotia, Saskatchewan, Alberta, the Northwest Territories and Nunavut. Nunavut does not report to the National Physician Database.Numbers may not add to 100% due to rounding.SourceNational Physician Database, Canadian Institute for Health Information.
Alternative methods of paying physicians include salaries, hourly rates, capitation models and contract-based payments.
Family medicine physicians are more likely to be paid through APPs than medical specialists and surgical specialists.
Figure 17 Distribution of physicians, by payment type and physician specialty, Canada, 2016–2017
• In Canada, 35% of family medicine physicians, 15% of medical specialists and 8% of surgical specialists received more than half of their total clinical payments through APPs in 2016–2017.
4%
32%
49%58%
24%
7%4%10% 8%
0%
20%
40%
60%
80%
100%
Family medicine Medical specialists Surgical specialists
90% FFS 50%–90% FFS 50%–90% APP 90% APP
34%
37%
34%

35
Physicians in Canada, 2017
The largest payment program as a proportion of total gross clinical payments to physicians in Canada is still FFS, at almost 73% of total payments in 2016–2017. FFS services provided by physicians can be split into 2 broad types: consultations/visits and procedures.
The cost and amount of physician services can be analyzed to determine which types of services physicians who are paid under FFS are providing and which types of physicians are providing the FFS services, as well as information on patients who are receiving these services.
Although family medicine physicians perform the greatest number of services and receive the largest proportion of payments, medical and surgical specialists are paid more per service on average. Services may not always be comparable, as the amount of work required differs depending on the type of service.
FFS utilization

36
Physicians in Canada, 2017
NotesFFS: Fee for service.Excludes reciprocal billing, imaging and laboratory services, anesthesia services and anesthesiology specialists, and unclassified physicians.Excludes the Northwest Territories and Nunavut. Nunavut does not report to the National Physician Database.SourceNational Physician Database, Canadian Institute for Health Information.
Although the majority of services provided by a physician are consultations and visits, procedures cost more.
The types of services provided by physicians under the FFS model can be grouped into 2 broad categories: consultations/visits and procedures.
Figure 18 FFS services and payments, Canada, 2016–2017
• Consultations and visits made up 72% of services delivered and accounted for 67% of payments.
• Procedures made up 28% of services delivered and accounted for 33% of payments.
Consultations and visits Procedures
0%
20%
40%
60%
80%
100%
28%
72%
33%
67%
Percentage of services provided via FFS
Percentage of paymentspaid via FFS

37
Physicians in Canada, 2017
NotesIncludes FFS payments only.Excludes the Northwest Territories and Nunavut. Nunavut does not report to the National Physician Database.SourceNational Physician Database, Canadian Institute for Health Information.
Medical and surgical specialists paid through FFS receive more per service on average than family medicine physicians.
Figure 19 Average cost per service, by physician specialty, Canada, 2016–2017
• In 2016–2017, the average cost per service was $65.38.
• Family medicine physicians billed an average cost per service of $48.11, while medical and surgical specialists billed an average of $83.96 and $89.24 per service, respectively.
Family medicine Surgical specialists Total physiciansMedical specialties
$0
$50
$100
$150
$200
$250
Aver
age c
ost p
er se
rvice
$65.38
Family
medicin
e
Interna
l medi
cine
Cardiolo
gy
Gastroe
nterolo
gy
Neurolo
gy
Psychia
try
Pediatri
cs
Dermato
logy
Physica
l medi
cine
Anesthe
sia
General
surger
y
Thoraci
c/card
iovasc
ular su
rgery
Urology
Orthoped
ic surg
ery
Plastic
surger
y
Neurosu
rgery
Ophthal
mology
Otolaryn
gology
Obstetri
cs/gyn
ecolog
y

38
Physicians in Canada, 2017
Appendix: Text alternatives for figures
Figure 1 Number and percentage growth in the supply of physicians, Canada, 1978 to 2017
Year Number of physicians Percentage change1978 35,400 1.6%
1979 36,413 2.9%
1980 37,252 2.3%
1981 38,280 2.8%
1982 40,046 4.6%
1983 41,401 3.4%
1984 42,364 2.3%
1985 44,194 4.3%
1986 45,560 3.1%
1987 47,536 4.3%
1988 49,649 4.4%
1989 51,251 3.2%
1990 51,759 1.0%
1991 52,726 1.9%
1992 53,698 1.8%
1993 55,035 2.5%
1994 54,944 -0.2%
1995 54,940 0.0%

39
Physicians in Canada, 2017
Year Number of physicians Percentage change1996 54,918 0.0%
1997 55,207 0.5%
1998 56,163 1.7%
1999 56,914 1.3%
2000 57,803 1.6%
2001 58,546 1.3%
2002 59,412 1.5%
2003 59,454 0.1%
2004 60,612 1.9%
2005 61,622 1.7%
2006 62,307 1.1%
2007 63,682 2.2%
2008 65,440 2.8%
2009 68,101 4.1%
2010 69,699 2.3%
2011 72,529 4.1%
2012 75,142 3.6%
2013 77,674 3.4%
2014 79,905 2.9%
2015 82,198 2.9%
2016 84,063 5.2%
2017 86,644 3.1%
SourceScott’s Medical Database, 2017, Canadian Institute for Health Information.

40
Physicians in Canada, 2017
Figure 2 Number of physicians per 100,000 population, by specialty, Canada, 1978 to 2017
YearPhysicians per
100,000 populationFamily medicine physicians
per 100,000 populationSpecialist physicians
per 100,000 population1978 147.1 74.3 72.7
1979 149.6 75.8 73.8
1980 151.0 76.4 74.7
1981 153.2 76.9 76.3
1982 158.6 80.6 78.1
1983 162.5 82.9 79.6
1984 164.7 83.9 80.8
1985 170.2 87.7 82.5
1986 173.5 89.5 84.0
1987 178.6 93.0 85.6
1988 183.6 96.3 87.3
1989 186.5 98.7 87.8
1990 185.8 98.0 87.8
1991 187.1 98.9 88.2
1992 188.1 99.5 88.6
1993 190.7 101.5 89.1
1994 188.2 98.2 90.0
1995 186.2 96.9 89.3
1996 184.6 94.8 89.8

41
Physicians in Canada, 2017
YearPhysicians per
100,000 populationFamily medicine physicians
per 100,000 populationSpecialist physicians
per 100,000 population
1997 183.8 93.5 90.3
1998 185.6 94.2 91.3
1999 186.4 94.3 92.1
2000 187.5 94.4 93.1
2001 187.8 95.0 92.8
2002 188.7 96.1 92.6
2003 187.1 96.5 90.6
2004 189.0 96.9 92.0
2005 190.2 97.6 92.6
2006 190.4 97.8 92.7
2007 192.7 98.6 94.1
2008 195.8 100.9 94.9
2009 201.4 102.9 98.5
2010 204.0 103.5 100.5
2011 210.0 106.5 103.5
2012 215.1 109.2 105.9
2013 219.8 111.5 108.3
2014 223.8 114.2 109.6
2015 228.1 115.3 112.8
2016 230.3 116.5 113.8
2017 234.4 119.6 114.8
SourceScott’s Medical Database, 2017, Canadian Institute for Health Information.

42
Physicians in Canada, 2017
Figure 3 Number of physicians per 100,000 population, by jurisdiction, 2013 and 2017
Year N.L. P.E.I. N.S. N.B. Que. Ont. Man. Sask. Alta. B.C. Y.T. Canada2013 240.4 189.9 260.9 227.0 236.8 208.7 204.0 184.6 222.7 224.7 185.4 219.8
2017 255.3 189.2 256.5 236.2 247.7 223.9 210.3 201.4 247.3 243.4 198.3 234.4
NoteThe Northwest Territories and Nunavut were excluded from this analysis due to small numbers.SourceScott’s Medical Database, 2017, Canadian Institute for Health Information.
Figure 4 Percentage of female physicians, by jurisdiction, 2013 and 2017
Year N.L. P.E.I. N.S. N.B. Que. Ont. Man. Sask. Alta. B.C. Y.T. Canada2013 36.5% 30.2% 36.9% 36.9% 44.9% 36.9% 33.6% 33.1% 36.0% 35.1% 47.8% 38.3%
2017 37.2% 32.3% 38.7% 39.3% 48.5% 39.4% 36.0% 35.1% 38.3% 38.0% 46.8% 41.0%
NoteThe Northwest Territories and Nunavut were excluded from this analysis due to small numbers.SourceScott’s Medical Database, 2017, Canadian Institute for Health Information.

43
Physicians in Canada, 2017
Figure 5 Percentage of physicians, by sex and physician type, 1978 to 2017
Year Family medicine, female Family medicine, male Specialists, female Specialists, male1978 13.8% 86.2% 8.4% 91.6%
1979 14.7% 85.3% 8.9% 91.1%
1980 15.3% 84.7% 9.5% 90.5%
1981 16.1% 83.9% 9.9% 90.1%
1982 17.8% 82.2% 10.7% 89.3%
1983 18.9% 81.1% 11.3% 88.7%
1984 20.2% 79.8% 12.1% 87.9%
1985 21.4% 78.6% 12.9% 87.1%
1986 22.4% 77.6% 13.5% 86.5%
1987 23.8% 76.2% 14.2% 85.8%
1988 24.9% 75.1% 15.0% 85.0%
1989 25.8% 74.2% 15.8% 84.2%
1990 26.8% 73.2% 16.8% 83.2%
1991 28.0% 72.0% 17.5% 82.5%
1992 28.9% 71.1% 18.2% 81.8%
1993 29.6% 70.4% 18.9% 81.1%
1994 30.4% 69.6% 19.6% 80.4%
1995 31.2% 68.8% 20.3% 79.7%
1996 31.8% 68.2% 21.3% 78.7%
1997 32.5% 67.5% 21.9% 78.1%
1998 33.2% 66.8% 22.7% 77.3%

44
Physicians in Canada, 2017
Year Family medicine, female Family medicine, male Specialists, female Specialists, male1999 34.1% 65.9% 23.4% 76.6%
2000 34.6% 65.4% 24.2% 75.8%
2001 35.3% 64.7% 25.2% 74.8%
2002 35.8% 64.2% 26.0% 74.0%
2003 36.2% 63.8% 26.5% 73.5%
2004 37.0% 63.0% 27.1% 72.9%
2005 37.4% 62.6% 27.6% 72.4%
2006 38.2% 61.8% 28.3% 71.7%
2007 39.0% 61.0% 28.5% 71.5%
2008 39.7% 60.3% 29.4% 70.6%
2009 40.7% 59.3% 30.2% 69.8%
2010 41.4% 58.6% 30.8% 69.2%
2011 41.7% 58.3% 31.1% 68.9%
2012 42.5% 57.5% 32.2% 67.8%
2013 43.2% 56.8% 33.3% 66.7%
2014 43.9% 56.1% 34.0% 66.0%
2015 44.6% 55.4% 35.0% 65.0%
2016 45.3% 54.7% 35.9% 64.1%
2017 45.5% 54.5% 36.2% 63.8%
SourceScott’s Medical Database, 2017, Canadian Institute for Health Information.

45
Physicians in Canada, 2017
Figure 6 Average age of physicians in Canada, by jurisdiction, 2013 and 2017
Year N.L. P.E.I. N.S. N.B. Que. Ont. Man. Sask. Alta. B.C. Y.T. Canada2013 48.1 52.5 50.5 49.0 49.7 51.2 50.1 48.8 48.1 51.0 50.2 50.2
2017 49.6 53.0 52.0 49.8 49.7 51.0 50.3 48.6 48.3 50.5 47.4 50.2
NoteThe Northwest Territories and Nunavut were excluded from this analysis due to small numbers.SourceScott’s Medical Database, 2017, Canadian Institute for Health Information.
Figure 7 Percentage of physicians with international MD degrees, by jurisdiction, 2013 and 2017
Year N.L. P.E.I. N.S. N.B. Que. Ont. Man. Sask. Alta. B.C. Y.T. Canada2013 37.6% 19.4% 30.7% 25.7% 10.5% 27.6% 34.6% 53.1% 32.4% 29.6% 31.3% 25.3%
2017 38.0% 15.9% 31.2% 25.5% 9.5% 29.5% 34.8% 53.1% 35.1% 30.8% 19.7% 26.5%
NoteThe Northwest Territories and Nunavut were excluded from this analysis due to small numbers.SourceScott’s Medical Database, 2017, Canadian Institute for Health Information.

46
Physicians in Canada, 2017
Figure 8 Percentage of physicians with international MD degrees, by physician type, 1978 to 2017
Year Family medicine Specialists All physicians1978 33.4% 31.5% 32.5%
1979 32.2% 31.8% 32.0%
1980 31.7% 31.8% 31.7%
1981 31.2% 31.7% 31.4%
1982 30.0% 31.4% 30.7%
1983 29.2% 31.0% 30.1%
1984 28.5% 30.5% 29.5%
1985 27.8% 29.8% 28.8%
1986 27.5% 29.6% 28.5%
1987 26.7% 29.3% 27.9%
1988 26.0% 28.8% 27.3%
1989 25.2% 28.4% 26.7%
1990 24.6% 27.9% 26.2%
1991 24.4% 27.5% 25.9%
1992 23.7% 27.3% 25.4%
1993 23.4% 27.0% 25.1%
1994 23.1% 26.9% 24.9%
1995 22.6% 26.5% 24.5%
1996 22.5% 26.2% 24.3%
1997 22.3% 25.8% 24.0%

47
Physicians in Canada, 2017
Year Family medicine Specialists All physicians1998 22.2% 25.2% 23.7%
1999 22.2% 24.6% 23.4%
2000 22.3% 24.1% 23.2%
2001 22.6% 23.5% 23.0%
2002 23.2% 22.9% 23.0%
2003 23.5% 22.1% 22.8%
2004 23.5% 21.8% 22.7%
2005 24.0% 21.6% 22.8%
2006 24.3% 21.2% 22.8%
2007 24.6% 21.7% 23.2%
2008 25.6% 21.5% 23.6%
2009 26.2% 21.8% 24.1%
2010 26.0% 22.7% 24.4%
2011 26.7% 23.0% 24.9%
2012 27.4% 22.8% 25.2%
2013 28.0% 22.5% 25.3%
2014 28.6% 22.5% 25.6%
2015 28.6% 22.7% 25.7%
2016 29.3% 22.4% 25.9%
2017 30.2% 22.5% 26.5%
SourceScott’s Medical Database, 2017, Canadian Institute for Health Information.

48
Physicians in Canada, 2017
Figure 9 Top 10 countries of MD graduation for internationally trained physicians, by physician type, 2017
Country Family medicine Specialists All physiciansSouth Africa 1,966 707 2,673
India 1,028 1,049 2,077
United Kingdom 1,114 903 2,017
Ireland 795 568 1,363
Egypt 660 394 1,054
United States 516 509 1,025
Pakistan 566 387 953
Nigeria 454 294 748
Iran 346 288 634
Poland 286 230 516
SourceScott’s Medical Database, 2017, Canadian Institute for Health Information.

49
Physicians in Canada, 2017
Figure 10 Total gross clinical and FFS payments to physicians, Canada, 1999–2000 to 2016–2017
Fiscal yearTotal gross clinical payments
(billions of dollars)FFS clinical payments
(billions of dollars)1999–2000 $9.7 $8.6
2000–2001 $10.2 $8.9
2001–2002 $11.0 $9.2
2002–2003 $11.6 $9.6
2003–2004 $12.4 $10.0
2004–2005 $13.0 $10.4
2005–2006 $14.1 $11.1
2006–2007 $14.9 $11.6
2007–2008 $16.3 $12.2
2008–2009 $17.9 $12.9
2009–2010 $19.3 $14.0
2010–2011 $20.5 $14.7
2011–2012 $22.0 $15.7
2012–2013 $22.8 $16.1
2013–2014 $24.0 $17.1
2014–2015 $24.8 $17.8
2015–2016 $25.7 $18.5
2016–2017 $26.4 $19.2
NotesFFS: Fee for service.Excludes Nunavut. Nunavut does not report to the National Physician Database. SourceNational Physician Database, Canadian Institute for Health Information.

50
Physicians in Canada, 2017
Figure 11 Average gross clinical payments to physicians, by jurisdiction, 2012–2013 and 2016–2017
Fiscal year N.L. P.E.I. N.S. N.B. Que. Ont. Man. Sask. Alta. B.C. Y.T. Canada2012–2013 $276,502 $339,672 n/a $296,935 $279,206 $367,299 $305,857 $365,886 $348,221 $271,483 n/r $328,778
2016–2017 $273,899 $378,280 n/a $301,782 $328,360 $344,531 $360,287 $360,745 $385,522 $289,972 $275,715 $342,228
Notesn/a: Results for Nova Scotia not reported due to data quality concerns.n/r: Not reported.Due to the greater proportion of short-term, visiting and locum physicians and their lower associated payments in certain smaller jurisdictions relative to larger ones, in an attempt to improve comparability, CIHI has agreed to calculate the average payment per physician using only permanent in-province physicians in P.E.I. and physicians whose total gross payments are at least $60,000 in Yukon (2012–2013 not reported for Yukon). Data is not available for the Northwest Territories or Nunavut. Nunavut does not report to the National Physician Database.SourceNational Physician Database, Canadian Institute for Health Information.
Figure 12 Average gross clinical payments, by physician specialty, Canada, 2016–2017
Specialty Average gross clinical paymentPsychiatry $273,000
Family medicine $277,000
Physical medicine $279,000
Pediatrics $299,000
Neurology $313,000
Total physicians $342,000

51
Physicians in Canada, 2017
Specialty Average gross clinical paymentTotal medical specialists $357,000
Plastic surgery $377,000
Dermatology $387,000
Obstetrics/gynecology $394,000
Internal medicine $400,000
Orthopedic surgery $426,000
Anesthesia $434,000
Otolaryngology $438,000
General surgery $452,000
Total surgical specialists $477,000
Urology $481,000
Neurosurgery $521,000
Thoracic/cardiovascular surgery $600,000
Ophthalmology $749,000
NoteExcludes Nova Scotia, Saskatchewan, Alberta, the Northwest Territories and Nunavut. Nunavut does not report to the National Physician Database.Source National Physician Database, Canadian Institute for Health Information.

52
Physicians in Canada, 2017
Figure 13 Average gross clinical payments, by physician specialty and jurisdiction, 2016–2017
Jurisdiction Family medicine Medical specialists Surgical specialistsN.L. $209,000 $319,000 $420,000
P.E.I. $315,000 $420,000 $545,000
N.S. n/a n/a n/a
N.B. $255,000 $333,000 $390,000
Que. $261,000 $384,000 $453,000
Ont. $307,000 $341,000 $480,000
Man. $303,000 $385,000 $531,000
Sask. n/a n/a n/a
Alta. n/a n/a n/a
B.C. $219,000 $336,000 $480,000
Y.T. $263,000 $308,000 $425,000
N.W.T. n/a n/a n/a
Nun. n/r n/r n/r
Canada $277,000 $357,000 $477,000
Notesn/a: Specialty-level information for Saskatchewan, Alberta and the Northwest Territories at the level needed for this analysis was not available. Results for Nova Scotia not reported due to data quality concerns.n/r: Nunavut does not report to the National Physician Database.Due to the greater proportion of short-term, visiting and locum physicians and their lower associated payments in certain smaller jurisdictions relative to larger ones, in an attempt to improve comparability, CIHI has agreed to calculate the average payment per physician using only permanent in-province physicians in P.E.I. and physicians whose total gross payments are at least $60,000 in Yukon.Canada figures exclude Nova Scotia, Saskatchewan, Alberta, the Northwest Territories and Nunavut.SourceNational Physician Database, Canadian Institute for Health Information.

53
Physicians in Canada, 2017
Figure 14 Total average gross clinical payment per FTE physician, by physician specialty and jurisdiction, 2016–2017
Physician specialty N.L. P.E.I. N.S. N.B. Que. Ont. Man. Sask. Alta. B.C. CanadaFamily medicine $274,594 $296,818 n/a $336,177 $344,214 $297,627 $341,990 $323,834 $391,539 $300,073 $321,340
Medical specialists $362,023 $387,772 n/a $410,360 $398,472 $367,995 $403,244 $434,578 $432,908 $401,761 $389,283
Surgical specialists $496,793 $577,434 n/a $553,875 $538,691 $507,469 $615,376 $644,036 $707,704 $600,924 $554,262
NotesFTE: Full-time equivalent.n/a: Results for Nova Scotia not reported due to data quality concerns.Saskatchewan and Alberta FTEs are based on FFS payments only.Canada figures exclude Nova Scotia.Data is not available for Yukon, the Northwest Territories or Nunavut. Nunavut does not report to the National Physician Database.SourceNational Physician Database, Canadian Institute for Health Information.
54
Physicians in Canada, 2017
Figure 15 FFS and alternative payments as a percentage of total clinical payments to physicians, Canada, 1999–2000 to 2016–2017
Fiscal year Percentage FFS clinical payments Percentage APP clinical payments1999–2000 89.4% 10.6%
2000–2001 87.1% 12.9%
2001–2002 83.9% 16.1%
2002–2003 83.2% 16.8%
2003–2004 80.6% 19.4%
2004–2005 79.7% 20.3%
2005–2006 79.0% 21.0%
2006–2007 77.4% 22.6%
2007–2008 74.7% 25.3%
2008–2009 72.1% 27.9%
2009–2010 72.6% 27.4%
2010–2011 71.8% 28.2%
2011–2012 71.2% 28.8%
2012–2013 70.6% 29.5%
2013–2014 71.2% 28.8%
2014–2015 71.7% 28.4%
2015–2016 72.1% 27.9%
2016–2017 72.6% 27.4%
NotesFFS: Fee for service.APP: Alternative payment plan.Excludes Nunavut. Nunavut does not report to the National Physician Database.SourceNational Physician Database, Canadian Institute for Health Information.

55
Physicians in Canada, 2017
Figure 16 Distribution of physicians and clinical payments, by payment type and jurisdiction, 2016–2017
JurisdictionAPP clinical payments
FFS clinical payments
Percentage of physicians who received any
FFS payments
Percentage of physicians who received any
APP paymentsN.L. 33.4% 66.6% 88% 53%
P.E.I. 36.1% 63.9% 91% 73%
N.S. 48.1% 51.9% n/a n/a
N.B. 35.2% 64.8% 95% 63%
Que. 20.4% 79.6% 99% 87%
Ont. 35.7% 64.3% 99% 56%
Man. 28.3% 71.7% 92% 73%
Sask. 36.4% 63.6% 67% 45%
Alta. 13.2% 86.8% 92% 17%
B.C. 20.5% 79.5% 95% 67%
Y.T. 41.3% 58.7% 99% 58%
Canada 27.4% 72.6% 98% 68%
NotesFFS: Fee for service.APP: Alternative payment plan.n/a: Results for Nova Scotia not reported due to data quality concerns.Data is not available for the Northwest Territories or Nunavut. Nunavut does not report to the National Physician Database.SourceNational Physician Database, Canadian Institute for Health Information.

56
Physicians in Canada, 2017
Figure 17 Distribution of physicians, by payment type and physician specialty, Canada, 2016–2017
Physician specialty 90% APP 50%–90% APP 90% FFS 50%–90% FFSFamily medicine 10% 24% 32% 34%
Medical specialists 8% 7% 49% 37%
Surgical specialists 4% 4% 58% 34%
NotesFFS: Fee for service.APP: Alternative payment plan.Excludes Nova Scotia, Saskatchewan, Alberta, the Northwest Territories and Nunavut. Nunavut does not report to the National Physician Database.Numbers may not add to 100% due to rounding.SourceNational Physician Database, Canadian Institute for Health Information.
Figure 18 FFS services and payments, Canada, 2016–2017
Percentage via FFS Consultations and visits ProceduresServices provided 72% 28%
Payments paid 67% 33%
NotesFFS: Fee for service.Excludes reciprocal billing, imaging and laboratory services, anesthesia services and anesthesiology specialists, and unclassified physicians.Excludes the Northwest Territories and Nunavut. Nunavut does not report to the National Physician Database.SourceNational Physician Database, Canadian Institute for Health Information.

57
Physicians in Canada, 2017
Figure 19 Average cost per service, by physician specialty, Canada, 2016–2017
Group Physician specialty Average cost per serviceFamily medicine Family medicine $48.11Medical specialties Internal medicine $82.45
Cardiology $84.15Gastroenterology $109.07Neurology $105.69Psychiatry $98.22Pediatrics $71.85Dermatology $43.63Physical medicine $80.65Anesthesia $149.95
Surgical specialties General surgery $122.41Thoracic/cardiovascular surgery $197.89Urology $81.10Orthopedic surgery $116.10Plastic surgery $106.01Neurosurgery $208.78Ophthalmology $64.22Otolaryngology $67.20Obstetrics/gynecology $85.29Total physicians $65.38
NotesIncludes FFS payments only.Excludes the Northwest Territories and Nunavut. Nunavut does not report to the National Physician Database.SourceNational Physician Database, Canadian Institute for Health Information.

[email protected] Ottawa495 Richmond Road
Suite 600
Ottawa, Ont.
K2A 4H6
613-241-7860
CIHI Toronto 4110 Yonge Street
Suite 300
Toronto, Ont.
M2P 2B7
416-481-2002
CIHI Victoria 880 Douglas Street
Suite 600
Victoria, B.C.
V8W 2B7
250-220-4100
CIHI Montréal 1010 Sherbrooke Street West
Suite 602
Montréal, Que.
H3A 2R7
514-842-2226
cihi.ca8695-1218


