Physician Emigration from Sub-Saharan Africa to the … · Statistics along with graduation and...
28
Physician Emigration from Sub-Saharan Africa to the United States: Analysis of the 2011 AMA Physician Masterfile Akhenaten Benjamin Siankam Tankwanchi 1¤ *,C ¸ ag ˘ lar O ¨ zden 2 , Sten H. Vermund 3,4 1 Department of Human and Organizational Development, Peabody School of Education, Vanderbilt University, Nashville, Tennessee, United States of America, 2 Development Research Group, The World Bank, Washington (D.C.), United States of America, 3 Vanderbilt Institute for Global Health, Vanderbilt University, Nashville, Tennessee, United States of America, 4 Department of Pediatrics, School of Medicine, Vanderbilt University, Nashville, Tennessee, United States of America Abstract Background: The large-scale emigration of physicians from sub-Saharan Africa (SSA) to high-income nations is a serious development concern. Our objective was to determine current emigration trends of SSA physicians found in the physician workforce of the United States. Methods and Findings: We analyzed physician data from the World Health Organization (WHO) Global Health Workforce Statistics along with graduation and residency data from the 2011 American Medical Association Physician Masterfile (AMA- PM) on physicians trained or born in SSA countries who currently practice in the US. We estimated emigration proportions, year of US entry, years of practice before emigration, and length of time in the US. According to the 2011 AMA-PM, 10,819 physicians were born or trained in 28 SSA countries. Sixty-eight percent (n = 7,370) were SSA-trained, 20% (n = 2,126) were US- trained, and 12% (n =1,323) were trained outside both SSA and the US. We estimated active physicians (age #70 years) to represent 96% (n =10,377) of the total. Migration trends among SSA-trained physicians increased from 2002 to 2011 for all but one principal source country; the exception was South Africa whose physician migration to the US decreased by 8% (2156). The increase in last-decade migration was .50% in Nigeria (+1,113) and Ghana (+243), .100% in Ethiopia (+274), and .200% (+244) in Sudan. Liberia was the most affected by migration to the US with 77% (n = 175) of its estimated physicians in the 2011 AMA-PM. On average, SSA-trained physicians have been in the US for 18 years. They practiced for 6.5 years before US entry, and nearly half emigrated during the implementation years (1984–1999) of the structural adjustment programs. Conclusion: Physician emigration from SSA to the US is increasing for most SSA source countries. Unless far-reaching policies are implemented by the US and SSA countries, the current emigration trends will persist, and the US will remain a leading destination for SSA physicians emigrating from the continent of greatest need. Please see later in the article for the Editors’ Summary. Citation: Tankwanchi ABS, O ¨ zden C ¸ , Vermund SH (2013) Physician Emigration from Sub-Saharan Africa to the United States: Analysis of the 2011 AMA Physician Masterfile. PLoS Med 10(9): e1001513. doi:10.1371/journal.pmed.1001513 Academic Editor: Margaret E. Kruk, Columbia University Mailman School of Public Health, United States of America Received March 1, 2013; Accepted August 2, 2013; Published September 17, 2013 Copyright: ß 2013 Tankwanchi et al. This is an open-access article distributed under the terms of the Creative Commons Attribution License, which permits unrestricted use, distribution, and reproduction in any medium, provided the original author and source are credited. Funding: Partial funding for this project was provided by the Knowledge for Change Program of the World Bank and by the Vanderbilt Institute for Global Health. The funders had no role in study design, data collection and analysis, decision to publish, or preparation of the manuscript. The findings, conclusions and views expressed are entirely those of the authors and should not be attributed to the World Bank, its executive directors, or the countries they represent. Competing Interests: We have read the journal’s policy and have the following conflict: SV is a current academic editor of PLOS ONE. Abbreviations: AMA-PM, American Medical Association Physician Masterfile; ECFMG, Educational Commission for Foreign Medical Graduates; IMG, international medical graduate; OECD, Organization of Economic Cooperation and Development; SAP, structural adjustment program; SD, standard deviation; SSA, sub-Saharan Africa; SSA-IMG, SSA medical graduate; USMG, US medical graduate; WHO, World Health Organization. * E-mail: [email protected] ¤ Current address: independent consultant Introduction The large-scale emigration of physicians from sub-Saharan Africa (SSA) to high income countries undermines the quality and delivery of health services in the resource-constrained origin countries. The World Health Organization (WHO) has empha- sized the importance of an adequate number of qualified health care personnel for the effective delivery of health services [1–3]. As the late former WHO Director-General LEE Jong-Wook noted, ‘‘it takes a considerable investment of time and money to train health workers,’’ and when the latter emigrate, ‘‘there is a loss of hope and a loss of years of investment’’ [4]. Since 1970, the growth in physician density has been negligible or even negative in a significant number of SSA countries (Table 1) [5–11]. Liberia is one of the most dramatic examples. With only 51 physicians in 2008 for a largely rural population of almost 4 million people [5], Liberia has had one of the lowest physician-to- patient ratios in the world (1.37 physician per 100,000 people). PLOS Medicine | www.plosmedicine.org 1 September 2013 | Volume 10 | Issue 9 | e1001513
Transcript of Physician Emigration from Sub-Saharan Africa to the … · Statistics along with graduation and...
Physician Emigration from Sub-Saharan Africa to theUnited States: Analysis of the 2011 AMA PhysicianMasterfileAkhenaten Benjamin Siankam Tankwanchi1¤*, Caglar Ozden2, Sten H. Vermund3,4
1 Department of Human and Organizational Development, Peabody School of Education, Vanderbilt University, Nashville, Tennessee, United States of America,
2 Development Research Group, The World Bank, Washington (D.C.), United States of America, 3 Vanderbilt Institute for Global Health, Vanderbilt University, Nashville,
Tennessee, United States of America, 4 Department of Pediatrics, School of Medicine, Vanderbilt University, Nashville, Tennessee, United States of America
Abstract
Background: The large-scale emigration of physicians from sub-Saharan Africa (SSA) to high-income nations is a seriousdevelopment concern. Our objective was to determine current emigration trends of SSA physicians found in the physicianworkforce of the United States.
Methods and Findings: We analyzed physician data from the World Health Organization (WHO) Global Health WorkforceStatistics along with graduation and residency data from the 2011 American Medical Association Physician Masterfile (AMA-PM) on physicians trained or born in SSA countries who currently practice in the US. We estimated emigration proportions,year of US entry, years of practice before emigration, and length of time in the US. According to the 2011 AMA-PM, 10,819physicians were born or trained in 28 SSA countries. Sixty-eight percent (n = 7,370) were SSA-trained, 20% (n = 2,126) were US-trained, and 12% (n = 1,323) were trained outside both SSA and the US. We estimated active physicians (age #70 years) torepresent 96% (n = 10,377) of the total. Migration trends among SSA-trained physicians increased from 2002 to 2011 for all butone principal source country; the exception was South Africa whose physician migration to the US decreased by 8% (2156).The increase in last-decade migration was .50% in Nigeria (+1,113) and Ghana (+243), .100% in Ethiopia (+274), and .200%(+244) in Sudan. Liberia was the most affected by migration to the US with 77% (n = 175) of its estimated physicians in the 2011AMA-PM. On average, SSA-trained physicians have been in the US for 18 years. They practiced for 6.5 years before US entry,and nearly half emigrated during the implementation years (1984–1999) of the structural adjustment programs.
Conclusion: Physician emigration from SSA to the US is increasing for most SSA source countries. Unless far-reachingpolicies are implemented by the US and SSA countries, the current emigration trends will persist, and the US will remain aleading destination for SSA physicians emigrating from the continent of greatest need.
Please see later in the article for the Editors’ Summary.
Citation: Tankwanchi ABS, Ozden C, Vermund SH (2013) Physician Emigration from Sub-Saharan Africa to the United States: Analysis of the 2011 AMA PhysicianMasterfile. PLoS Med 10(9): e1001513. doi:10.1371/journal.pmed.1001513
Academic Editor: Margaret E. Kruk, Columbia University Mailman School of Public Health, United States of America
Received March 1, 2013; Accepted August 2, 2013; Published September 17, 2013
Copyright: � 2013 Tankwanchi et al. This is an open-access article distributed under the terms of the Creative Commons Attribution License, which permitsunrestricted use, distribution, and reproduction in any medium, provided the original author and source are credited.
Funding: Partial funding for this project was provided by the Knowledge for Change Program of the World Bank and by the Vanderbilt Institute for GlobalHealth. The funders had no role in study design, data collection and analysis, decision to publish, or preparation of the manuscript. The findings, conclusions andviews expressed are entirely those of the authors and should not be attributed to the World Bank, its executive directors, or the countries they represent.
Competing Interests: We have read the journal’s policy and have the following conflict: SV is a current academic editor of PLOS ONE.
Abbreviations: AMA-PM, American Medical Association Physician Masterfile; ECFMG, Educational Commission for Foreign Medical Graduates; IMG, internationalmedical graduate; OECD, Organization of Economic Cooperation and Development; SAP, structural adjustment program; SD, standard deviation; SSA, sub-SaharanAfrica; SSA-IMG, SSA medical graduate; USMG, US medical graduate; WHO, World Health Organization.
* E-mail: [email protected]
¤ Current address: independent consultant
Introduction
The large-scale emigration of physicians from sub-Saharan
Africa (SSA) to high income countries undermines the quality and
delivery of health services in the resource-constrained origin
countries. The World Health Organization (WHO) has empha-
sized the importance of an adequate number of qualified health
care personnel for the effective delivery of health services [1–3]. As
the late former WHO Director-General LEE Jong-Wook noted,
‘‘it takes a considerable investment of time and money to train
health workers,’’ and when the latter emigrate, ‘‘there is a loss of
hope and a loss of years of investment’’ [4].
Since 1970, the growth in physician density has been negligible
or even negative in a significant number of SSA countries (Table 1)
[5–11]. Liberia is one of the most dramatic examples. With only
51 physicians in 2008 for a largely rural population of almost 4
million people [5], Liberia has had one of the lowest physician-to-
patient ratios in the world (1.37 physician per 100,000 people).
PLOS Medicine | www.plosmedicine.org 1 September 2013 | Volume 10 | Issue 9 | e1001513

Ta
ble
1.
Ch
ang
es
inp
hys
icia
n-t
o-p
op
ula
tio
nra
tio
s(d
en
sity
)an
dm
ed
ical
sch
oo
lsin
sele
cte
dA
fric
anan
dn
on
-Afr
ican
cou
ntr
ies,
ran
ked
by
chan
ge
inp
hys
icia
nd
en
sity
.
Co
un
try
Cir
ca1
97
0a
Cir
ca2
01
0a
Ch
an
ge
ov
er
Tim
e
Po
pu
lati
on
(in
1,0
00
)P
hy
sici
an
s(n
)
De
nsi
ty(1
00
Kp
eo
ple
)M
ed
ica
lS
cho
ols
(n)
Po
pu
lati
on
(in
1,0
00
)P
hy
sici
an
s(n
)
De
nsi
ty(1
00
Kp
eo
ple
)M
ed
ica
lS
cho
ols
(n)
Ph
ysi
cia
nD
en
sity
(ab
solu
te)
Ph
ysi
cia
nD
en
sity
(%)
Me
dic
al
Sch
oo
ls(n
)
Lib
eri
a1
,39
71
32
9.4
14
,19
05
11
.21
28
.22
87
.1%
0
Tan
zan
ia1
4,3
54
57
64
.01
47
,78
33
00
0.6
52
3.4
28
4.4
%4
Zim
bab
we
5,5
15
1,0
35
18
.81
13
,72
48
27
6.0
12
12
.72
67
.9%
0
Mo
zam
biq
ue
9,3
04
51
05
.51
25
,20
35
48
2.2
42
3.3
26
0.3
%3
Sie
rra
Leo
ne
2,7
89
14
95
.30
5,9
79
13
62
.31
23
.12
57
.4%
1
Zam
bia
4,2
48
52
71
2.4
11
4,0
75
83
65
.91
26
.52
52
.1%
0
Som
alia
3,6
67
19
35
.31
10
,19
53
00
2.9
22
2.3
24
4.1
%1
Djib
ou
ti1
80
52
28
.90
90
61
85
20
.41
28
.52
29
.3%
1
Co
ng
o1
,27
21
63
12
.81
4,3
37
40
19
.21
23
.62
27
.8%
0
Nig
er
4,8
41
10
92
.31
17
,15
72
88
1.7
12
0.6
22
5.4
%0
Gh
ana
8,7
89
85
69
.72
25
,36
62
,03
38
.04
21
.72
17
.7%
2
Sen
eg
al4
,31
82
81
6.5
11
3,7
26
74
15
.44
21
.12
17
.04
%3
Gu
ine
a-B
issa
u6
20
55
8.9
01
,66
41
24
7.5
12
1.4
21
6.0
%1
Leso
tho
1,0
67
50
4.7
02
,05
28
94
.30
20
.32
7.4
%0
To
go
1,9
64
95
4.8
16
,64
33
49
5.3
10
.48
.6%
0
Swaz
ilan
d4
55
54
11
.90
1,2
31
17
31
4.1
02
.21
8.4
%0
Sou
thA
fric
a2
2,7
40
12
,06
05
3.0
75
2,3
86
38
,23
67
3.0
82
0.0
37
.6%
1
Eth
iop
ia2
9,4
69
37
41
.32
91
,72
92
,15
22
.31
21
.18
4.9
%1
0
An
go
la5
,60
63
83
6.8
12
0,8
21
2,9
46
14
.17
7.3
10
7.1
%6
Rw
and
a3
,76
97
72
.01
11
,45
85
68
5.0
12
.91
42
.6%
0
Gam
bia
48
51
93
.91
1,7
91
17
59
.81
5.9
14
9.4
%0
Nig
eri
a5
9,6
07
2,3
43
3.9
12
16
9,0
00
55
,37
63
2.8
25
28
.87
33
.6%
13
Su
b-S
ah
ara
nA
fric
a2
87
,85
62
5,5
04
8.9
53
91
3,3
02
15
0,3
05
16
.51
09
7.6
85
.7%
56
Can
ada
22
,47
93
7,2
77
16
5.8
16
34
,83
86
9,6
99
20
0.1
17
34
.22
0.6
%1
Bra
zil
58
,85
45
9,5
73
10
1.2
77
19
9,0
00
34
1,8
49
17
1.8
90
70
.66
9.7
%1
3
USA
21
1,9
09
33
8,1
11
15
9.6
12
63
18
,00
09
09
,74
92
86
.11
47
12
6.5
79
.3%
21
UK
55
,96
87
5,1
41
13
4.3
26
62
,78
31
72
,55
32
74
.83
31
40
.61
04
.7%
7
Be
lgiu
m9
,75
71
6,4
76
16
8.9
71
1,0
90
39
,69
03
57
.91
11
89
.01
11
.9%
4
Au
stra
lia1
2,9
59
17
,97
21
38
.78
23
,05
08
1,6
39
35
4.2
21
21
5.5
15
5.4
%1
3
Sou
thK
ore
a3
2,9
05
16
,37
74
9.8
19
49
,00
39
8,2
93
20
0.6
52
15
0.8
30
3.0
%3
3
Cu
ba
8,0
74
7,0
00
86
.77
11
,27
17
6,5
06
67
8.8
14
59
2.1
68
2.9
%7
Dat
aso
urc
es:
Wo
rld
He
alth
Org
aniz
atio
n[5
];W
orl
dH
eal
thO
rgan
izat
ion
[6];
Mu
llan
et
al.
[7];
Fou
nd
atio
nfo
rA
dva
nce
me
nt
of
Inte
rnat
ion
alM
ed
ical
Edu
cati
on
and
Re
sear
ch[8
];U
niv
ers
ity
of
Co
pe
nh
age
nan
dW
orl
dH
eal
thO
rgan
izat
ion
[9];
Re
di-
Me
dD
ata
[10
];U
nit
ed
Stat
es
Ce
nsu
sB
ure
au[1
1].
aC
irca
19
70
,1
96
9–
19
76
;ci
rca
20
10
,2
00
3–
20
12
.d
oi:1
0.1
37
1/j
ou
rnal
.pm
ed
.10
01
51
3.t
00
1
Physician Emigration from Sub-Saharan Africa
PLOS Medicine | www.plosmedicine.org 2 September 2013 | Volume 10 | Issue 9 | e1001513

Yet, 35 y earlier in 1973, there were 132 physicians in Liberia
when the population was 1.7 million people [6], a 6-fold
proportionate loss of coverage. Since its independence over
160 y ago, there has been only one medical school in Liberia
[7–9]. Moreover, the long and ruinous civil wars that wreaked
havoc in Liberia in the late 1980s and early 2000 destroyed scarce
human resources and physical infrastructures, triggering a major
brain drain from Africa’s oldest republic [12].
However, civil war does not explain the negative growth of
physician density in relatively peaceful, politically stable, and
steadily growing countries like Tanzania or Zambia, both of which
were listed in 2011 among the world’s ten fastest-growing
economies by The Economist [13]. Yet, they have experienced,
respectively, a 59% and 83% proportionate loss of physician
coverage between the early 1970s and mid-2010s (Table 1). The
extremely low physician densities in most SSA countries are
exacerbated by limited medical education capacity [7,14,15], as
well as large-scale emigration of physicians [16–28] in the midst of
widespread communicable disease transmission and the rapid
growth of non-communicable diseases [29–31]. Data from
Clemens and Pettersson [16] suggest that Tanzania and Zambia,
respectively, had 52% and 57% of their physicians living abroad
between 1995 and 2001. The authors reported 1,264 physicians to
be living in Tanzania in 1995 [16]. In their 2004 publication [19],
Hagopian et al. reported 1,384 physicians in Tanzania for a
population of nearly 38 million. If the latest WHO estimate of the
Tanzanian active physician workforce (n = 300 physicians in 2006)
is credible, this implies that Tanzania’s health system has lost
1,084 (78.3%) active physicians in ,10 y. Thus, Tanzania’s
physician density has effectively decreased from 4.1 physicians per
100,000 population to 0.69 physician per 100,000 population,
amounting to a 5-fold loss of physician coverage in Tanzania
between 1995 and 2004.
While the international migration choices of health care workers
from SSA are becoming increasingly diverse, the two most
prominent destinations are the United Kingdom and the United
States [16–28]. Using the 2002 American Medical Association
Physician Masterfile (AMA-PM), Hagopian et al. identified 5,334
US-based international medical graduates (IMGs) who received
their medical degrees from SSA-based medical schools (hereafter
SSA-IMGs). The leading countries were Nigeria, South Africa,
Ghana, and Ethiopia. They further recorded 2,151 SSA-IMGs in
Canada and estimated the combined figure of SSA-IMGs
practicing in North America to represent over 9% of the stock
of physicians available in SSA at the time [19]. Similarly, Mullan
computed ‘‘The Metrics of the Physician Brain Drain’’ [20] by
using the 2004 AMA-PM, identifying an aggregate total of 13,272
SSA-IMGs in the AMA-PM (US), the National Health Service
(UK), the Southam Medical Database of the Canadian Institute
for Health Information, the Canadian Post-MD Education
Registry of the Association of Faculties of Medicine, and the
Australian Institute of Health and Welfare. In this analysis, the
SSA region had the highest rate of emigration, though absolute
numbers of physician emigres are higher from Asia and Latin
America where there are much higher physician populations
(notably from India, Pakistan, Philippines, and the Caribbean).
It is necessary to account for all SSA emigre physicians,
including those educated outside SSA, to get an accurate picture of
their migration profiles. The studies by Hagopian et al. [19] and
Mullan [20] did not include the substantial number of African-
born physicians trained internationally but now practicing in the
US. This omission, typical also in other analyses [21,22], does not
permit an assessment of how many African physicians trained
overseas are now unavailable to their home countries. In contrast,
Western-educated physicians who practice, teach, and conduct
research in medical schools across Africa are an integral part of the
national physician counts reported by WHO [5], and are included
in denominator data for physician emigration rates.
Clemens and Pettersson attempted to address the above
limitation in their ‘‘New Data on African Health Professionals
Abroad’’ [16]. Contrary to previous studies, which used location of
medical education as a proxy for country of origin, Clemens and
Pettersson identified the country of origin of medical expatriates
by their place of birth. They observed that almost 65,000 African-
born emigre physicians and nearly 70,000 African-born emigre
professional nurses were practicing in eight Organization of
Economic Cooperation and Development (OECD) high-income
countries and in South Africa. Interestingly, while South Africa
has been losing its own physicians and nurses to wealthier OECD
countries, South Africa has also served as the main destination for
African physicians who migrated regionally, that is, from one SSA
country to another. Excluding SSA physicians and nurses who
immigrated to South Africa, there were 35,000 SSA-born
physicians and 53,000 SSA-born professional nurses identified
by Clemens and Pettersson in eight OECD countries, representing
one-fifth of SSA-born physicians and one-tenth of SSA-born
professional nurses. SSA harbors about 14% of the world’s
population, but has only 3% of the world’s health professionals [2],
of whom 17.5% had emigrated by 2005. Clemens and Pettersson’s
findings indicated that the UK was the destination for the largest
proportion of SSA medical emigrants, representing 10%
(n = 13,350) of SSA-born physicians and 4% (n = 20,372) of SSA-
born nurses. They further identified 6.4% (n = 8,558) physicians
and 4% (n = 19,545) nurses from the SSA region in the US [16].
Clemens and Pettersson captured larger numbers of SSA emigre
health professionals than reported in previous studies using the
AMA-PM data. However, their analysis conflated emigre physi-
cians trained by origin African countries and those trained
internationally. They provided no information on the percentage
comprising each group. Also, the use of the 2000 US Census data
suggests that almost 9 y had elapsed from the time of data
collection to the time the authors published their study. Since US
census data are self-reported, IMGs who did not gain admission
into US residency may or may not identify as medical doctors
when completing US census surveys. Indeed, a cross-section of
IMGs hoping to obtain a license to practice in the US do not pass
the Educational Commission for Foreign Medical Graduates
(ECFMG) certification, a requirement for IMGs’ admission into
US graduate medical education, the pathway through which one
becomes licensed to practice medicine in the US [32]. A number
of SSA-trained physicians currently living in the US are probably
among these unsuccessful applicants. However, no known study
has estimated their number nor examined their migration profile
or encore/alternative careers in the US.
The US consistently reports significantly more African physi-
cians than the UK when the ‘‘country of medical education’’ is
used to define SSA physicians. For example, Mullan [20] counted
2,392 Nigerian-trained physicians in the US compared to 1,529 in
the UK. Likewise, Hagopian et al. [19] reported 5,334 SSA-
trained physicians in the US as opposed to 3,451 SSA-trained
physicians in the UK. But when ‘‘country of birth’’ is used as the
selection criterion, the UK has higher numbers as evidenced by
Clemens and Pettersson [16]. We speculate that many African
physicians may enter the UK at younger ages, often as students,
and then decide to stay and practice in the UK. In contrast,
African migrant physicians typically come to the US at compar-
atively older ages, to work or seek additional training after initial
training and work in their home countries. Hence, despite the
Physician Emigration from Sub-Saharan Africa
PLOS Medicine | www.plosmedicine.org 3 September 2013 | Volume 10 | Issue 9 | e1001513

relatively larger population of SSA physicians and nurses in the
UK, the transfer of medical skills from SSA to the US may be
more significant than to the UK due to the increased level of
education and professional experience that would-be migrants to
the US possess at time of emigration.
Medical skill transfers from SSA result in remittances sent to the
home countries by migrant physicians. In 2008, officially recorded
remittances from all emigres to Africa totaled US$41.1 billion,
compared to US$39.4 billion of official development aid [33].
Also, a proportion of remittances unaccounted for, but believed to
be significant, is sent through informal channels such as hand-
delivery during short-term home visits [33]. In addition to
remittances, some SSA medical migrants have reported sending
medications, medical supplies, and diagnostic equipment to their
home communities [34]. Nonetheless, while acknowledging the
potential for remittances to support the livelihood of emigres’
relatives in origin countries, the large-scale emigration of medical
professionals from poor to rich countries remains a serious drain
on the health care workforce with both financial and human
consequences. We state this assuming that emigre remittances are
rarely invested in health care worker education, nor do they pay
for physician salaries.
Mills and colleagues [35] estimated that nine SSA countries
with HIV prevalence $5% have lost about US$2.2 billion of
returns from the investment made on the medical education of
their physicians who migrated to the UK, the US, Canada, and
Australia. They also estimated that UK and the US have saved
US$2.7 billion and US$846 million, respectively, from the services
provided by these emigre physicians. The World Health Report 2006
states: ‘‘Financial loss is not the most damaging outcome, however.
When a country has a fragile health system, the loss of its
workforce can bring the whole system close to collapse and the
consequences can be measured in lives lost. In these circumstanc-
es, the calculus of international migration shifts from brain drain
or gain to ‘fatal flows’’’ [2].
To characterize the magnitude of the SSA physician ‘‘brain
drain’’ to the US, we examined a cross-section of SSA emigre
physicians who successfully completed or were currently complet-
ing graduate medical education and specialty certification in the
US (i.e., licensed and resident physicians; a resident is a physician
training in a specialty, analogous to a registrar in the UK system).
We use the phrase ‘‘SSA physician’’ to define any medical doctor
born or trained in any countries located within the SSA sub-
continent. We sought a rigorous recent count of emigre physicians
trained in SSA and sub-Saharan African natives trained outside
SSA who are now part of the physician workforce in the US,
assessing both historical patterns and recent emigration trends.
Methods
Ethical StatementAn earlier draft of this paper was part of the first author’s
doctoral dissertation [34]. The work was approved by the
Vanderbilt University Institutional Review Board. Prior to
purchasing the dataset for the study, the first author also obtained
approval from the American Medical Association for non-
commercial use of physicians’ data.
Study DataThe American Medical Association Physician Masterfile (AMA-
PM) was begun in 1906 to provide comprehensive biographic data
on all US-based physicians. The AMA collects demographic,
academic, and professional data on all residents and licensed
physicians who practice in the US, including US medical
graduates (USMGs) and IMGs. The annual data collection
involves the voluntary cooperation of several health-related
agencies, institutions, and organizations, including US medical
schools, post-graduate medical training programs, state licensing
agencies, the National Board of Medical Examiners (NBME), the
ECFMG, and the American Board of Medical Specialties (ABMS)
[36]. Quality issues in the AMA-PM records have been
documented, namely undercounting, overcounting, and inaccu-
rate addresses [37,38]. For instance, the conflation of mailing/
domicile and office addresses in the AMA-PM has yielded spatial
errors in geocoding physician locations, resulting in overestimation
of physician supply in certain affluent suburban neighborhoods
where physicians reside but may not practice, and underestimation
of supply in some inner city locations where physicians may
practice but do not live [37]. These limitations notwithstanding,
the AMA data are presently the best available representation of
the US physician workforce, and are accessible to external users
through AMA database licensees [39].
We obtained AMA data lists for all IMGs who received their
education in medical schools located in SSA and all medical
graduates who were born in SSA, but trained outside Africa. The
records obtained included name, sex, medical school attended and
year of graduation, year of birth, birth country, professional
address, telephone number, primary specialty, residency program
attended, and date of residency completion. The AMA does not
collect information on residency admission date. We examined all
records to identify and exclude potential outliers. Such outliers
included 205 IMGs from three schools with uncertain location
and/or legitimate existence: Kigezi International Medical School
of Kabale (KIMSOK), St. Christopher’s College of Medicine
(SCCOM), and St. Luke School of Medicine (SLSOM). In our
AMA dataset, these three schools were listed as located in Uganda,
Senegal, and Liberia respectively.
However, KIMSOK (n = 51 IMGs) was actually located in the
UK although accredited in Uganda until 2005, when its
accreditation was revoked by Uganda’s National Council for
Higher Education [40]. SCCOM (n = 153 IMGs) claimed
accreditation from Senegal’s government, but had locations in
Dakar, Senegal, and Luton, UK [41]. Side-by-side comparison
of the surnames of all SCCOM graduates in our dataset with
263 popular surnames from 12 main Senegalese ethnic groups
[42] produced no surname matches between the two groups; we
believe that these SCCOM graduates were US nationals who
trained in the Luton-based campus in the UK [43,44]. Despite a
report of multiple international locations in Liberia, Ghana, and
California for SLSOM [41], we could merely identify a webpage
for the school [45], suggesting that SLSOM may be essentially
an internet-based training program. In 2005, SLSOM was
disowned by Liberia’s government as a ghost medical school,
and removed from the International Medical Education
Directory (IMED) at the request of Liberian authorities
[41,46,47]. Only three IMGs in our data subset were trained
in SLSOM. Birth countries of graduates from all three medical
schools were missing for all but 21 IMGs in our dataset, only
two of whom were born in SSA countries. We included these
two IMGs in our analysis.
Since many older physicians are likely to have retired, we
excluded those physicians .70 y (n = 442) for most analyses. We
also excluded the five North African countries (Algeria, Egypt,
Libya, Morocco, and Tunisia) since they have significantly
different health care burdens, higher life expectancies, and higher
physician-population ratios [5]. Information on country of birth
and residency completion dates was incomplete. More specifically,
there were 70.2% missing birth country and 10.5% missing
Physician Emigration from Sub-Saharan Africa
PLOS Medicine | www.plosmedicine.org 4 September 2013 | Volume 10 | Issue 9 | e1001513
residency completion dates among IMGs who graduated from
SSA-based medical schools. Absence of birth country data
especially limits our ability to analyze the extent of emigration
among SSA-born but Western/overseas-trained physicians.
Statistical AnalysisWe used available data on residency completion dates to
construct a proxy for year of immigration to the US by subtracting
5 y from SSA-IMGs’ year of residency completion. Boulet et al.
[48] analyzed trends in certification and residency training among
IMGs and found that between 1995 and 2003, internal medicine,
family practice, and pediatrics accounted for about 70% of IMGs
specializations. Since residency training in the above primary care
specializations is on average 3 y, we used 3 y as the minimum time
spent in residency. We added 2 more years to the 3-y residency
length in order to account for possible time spent in the US before
the beginning of residency. The 2-y pre-residency length of stay in
the US was estimated from primary data collected for a qualitative
study of SSA-IMGs residing in the US [34].
From the comprehensive analysis of all SSA-IMGs appearing in
the 2002 AMA-PM [19], we derived baseline metrics for our
analysis, enabling calculation of the size of recent migration
cohorts and the overall percentage increase of SSA-IMGs in the
US during the last decade. We defined medical migration
proportion (p) by the following formula: p = M4(N+M) * 100,
where M represents the number of SSA migrant physicians in the
US, and N the stock of SSA physicians in the source country as
reported by the WHO Global Health Workforce Statistics [5].
Likewise, we defined emigration percentage growth rate (r) as
follows:
r~ Myear2011{Myear2002
� �7Myear2002 � 100,
where Myear2011 represents the number of SSA physicians in the
2011 AMA-PM, and Myear2002 the number of SSA physicians in
the 2002 AMA-PM. To estimate the length of service provided
before immigration to the US among SSA-IMGs, we subtracted
year of medical school graduation from the estimated year of entry
in the US. Likewise, we subtracted the estimated age at entry in
the US from migrant physicians’ current age to estimate the length
of time spent in the US. We used year of graduation as the
chronological marker for the migration of SSA-born physicians
trained outside SSA. We operationalized recent migrants as
physicians who graduated or emigrated in 2000 or later. No SSA-
IMGs from Cameroon, Tanzania, or Sudan were reported by
Hagopian et al. [19], but appear in relatively significant numbers
in our 2011 AMA-PM data subset. We used pre-and-post 2002
residency completion dates to estimate the emigration growth rate
of Cameroonian, Tanzanian, and Sudanese emigre physicians.
To ascertain whether or not birth country information was
missing completely at random, we used the Student’s t-test to
compare physicians with missing and complete birth country data
on three variables: age, graduation age, and graduation year. We
also used a series of scatter plots to highlight the linear relationship
between the numerical distributions of variables among the main
subgroups of migrant physicians identified in our analysis. We
visualized temporal trends in physician graduation and emigration
using histograms and smoothed lines. We used both Excel and the
statistical package of social sciences (SPSS) to analyze the data.
Results
In the 2011 AMA-PM, 17,376 physicians were born or trained
in Africa (Table 2). Physicians who were trained or born in the
SSA subcontinent represent 62% (n = 10,819) of the total, with the
remainder from North Africa (n = 6,557). Of the 10,819 SSA-
origin physicians, 68% (n = 7,370) were trained in medical schools
located in SSA (SSA-IMGs), 19.7% (n = 2,126) in US-based
medical schools (SSA-USMGs), and 12.2% (n = 1,323) in medical
schools located outside the SSA region and the US (Figure 1).
About 18% (n = 1,929) of these emigres can be considered early-
career physicians or recent immigrants as they graduated in 2000
or later (Figure 2). As shown in both Figures 1 and 2, the
proportional representation of women has consistently increased
over time and across all three subgroups (SSA-IMGs, SSA-
USMGs, and other IMGs).
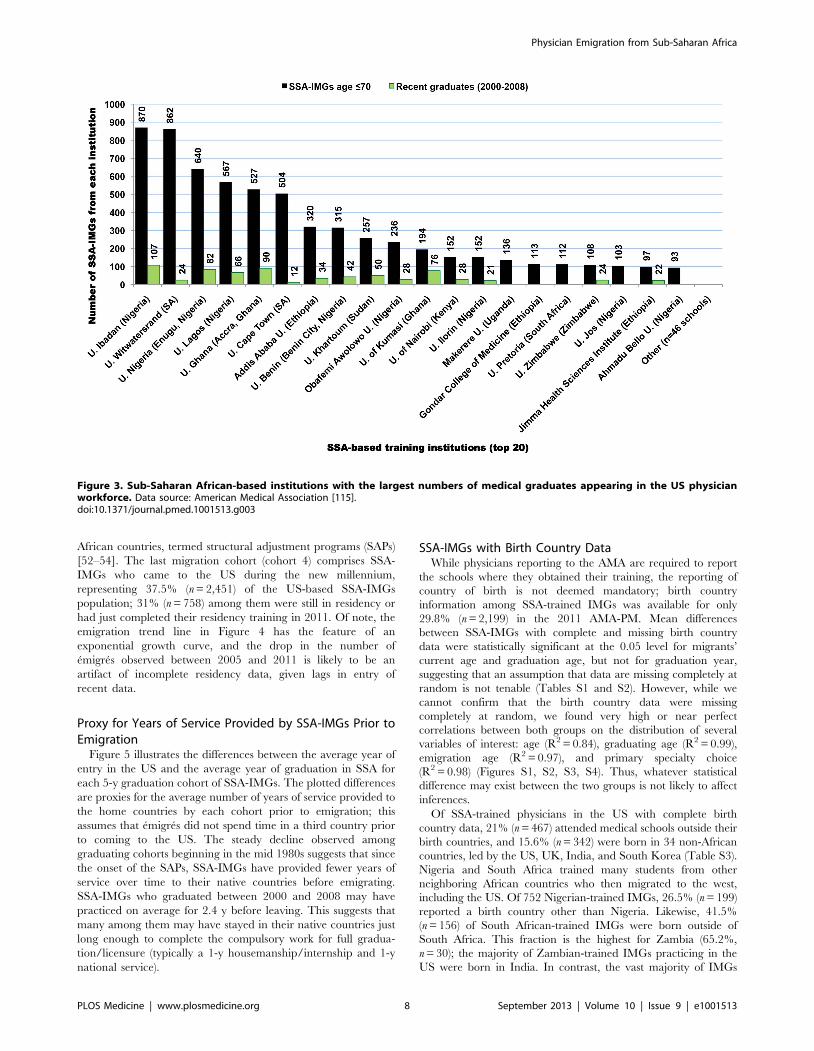
SSA-Trained International Medical GraduatesSSA-IMGs (n = 7,370) appearing in the 2011 AMA-PM were
trained in 28 SSA countries, with over two-third coming from
medical schools in Nigeria and South Africa (Figure 3). The top 12
SSA countries of medical schools featured in our analysis
represented 99% of SSA-IMGs in the US physician workforce
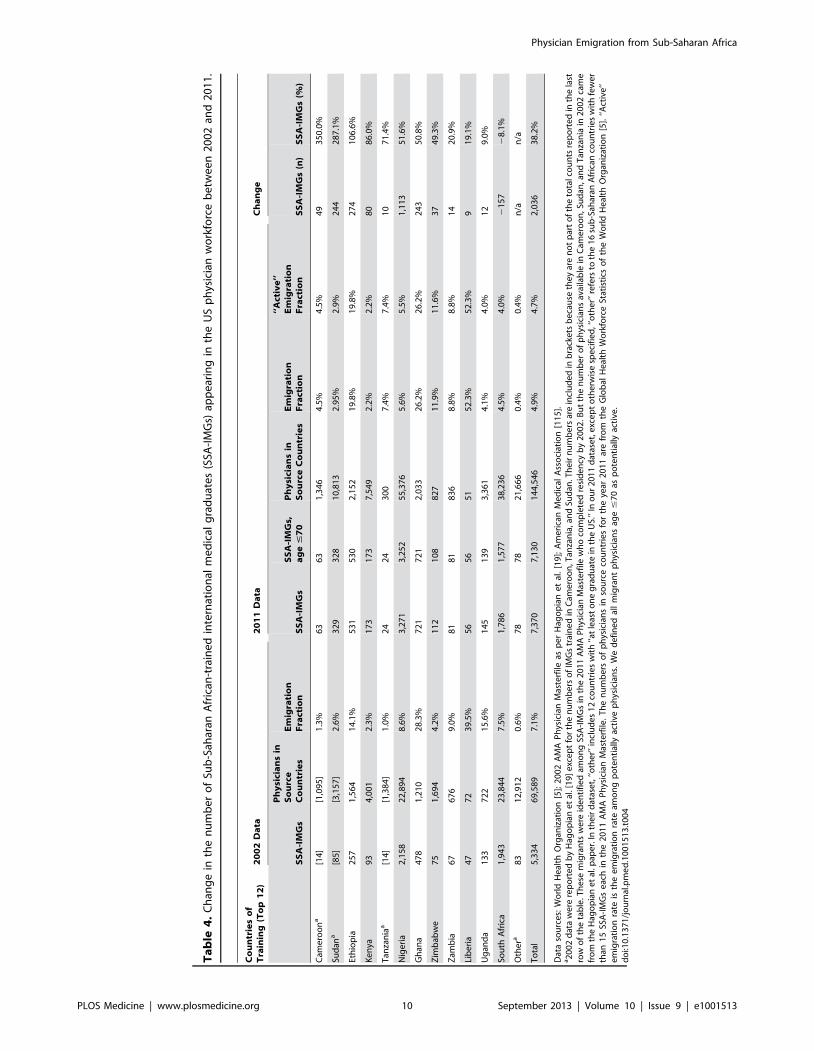
(Table 3). The number of SSA-IMGs in the 2011 AMA-PM
increased by over 38% (n = 2,036) since 2002, and over 50%
(n = 1,113) of this increase came from Nigerian-trained IMGs
(Table 4). However, Cameroon, Sudan, Ethiopia, and Kenya had
the largest percentage increases of SSA-IMGs in the US physician
workforce (AMA-PM) since 2002: 350% (n = 49), 287% (n = 244),
107% (n = 274), and 86% (n = 174), respectively. The number of
IMGs from South Africa decreased by 8% (n = 2157). In addition,
of the 240 (3.3%) SSA-IMGs age .70 y excluded from most of
our analysis, 87% (n = 209) were from South Africa, reflecting the
seniority and early migration history of South African IMGs.
Relative to the size of the physician workforce reported in the
source countries, Liberian, Ghanaian, and Ethiopian-trained
IMGs experienced the largest physician losses to the US, with
52.3% (n = 59), 26.2% (n = 721), and 22.7% (n = 531) of physicians
emigrating respectively. This emigration proportion is based solely
on the number of SSA-IMGs found in the 2011 AMA-PM. It
Table 2. African-origin physicians appearing in the USphysician workforce in 2011.
Sub-Regions Main Regions of Medical Training
Africa AmericasAsia andPacific Europe Subtotal
Sub-SaharanAfrica
7,370 7,370
USA 2,126 2,126
India 420 420
Caribbean 254 254
Euro zone 168 168
UK 154 154
Middle East 79 79
Other 28a 70 23 127 248
Subtotal 7,398 2,450 522 449 10,819
North Africa 6,557 6,557
Total 13,955 2,450 522 449 17,376
Data source: American Medical Association [115].aThese 28 physicians are sub-Saharan African-born IMGs trained in North Africa.They were included in our data analysis while the other 6,557 North African-trained and North African-born IMGs were excluded.doi:10.1371/journal.pmed.1001513.t002
Physician Emigration from Sub-Saharan Africa
PLOS Medicine | www.plosmedicine.org 5 September 2013 | Volume 10 | Issue 9 | e1001513

would likely increase if one includes the sizeable numbers of SSA-
born physicians trained in the US and SSA-born physicians
trained in medical schools located outside the US and outside
SSA. It will certainly be much higher if one includes all SSA
migrant physicians in other main destination countries (e.g., the
UK, Canada, or Australia).
Demographic Characteristics of SSA-IMGsOf the 7,130 potentially active migrant physicians (age #70) in
our SSA-IMG data subset, 26% (n = 1,857) were women. The
representation of women has consistently increased over time.
From 10% in the earliest graduation cohort (1969 and earlier),
women represent a little over 40% of all SSA-IMGs who
graduated and emigrated during the last decade (Figures 1 and
2). As shown in Table 5, the mean year of birth of SSA-IMGs
appearing in the 2011 AMA-PM is 1963 (standard deviation
[SD] = 9.4), for a mean age of 50. On average, they completed
medical school in 1988 (SD = 9.6) at age 25 (SD = 2.2), and then
moved to the US about 6.5 y later. But, as reflected in the large
standard deviations reported for each mean, these average figures
vary substantially within and between source countries. With a
mean age of 57 (SD = 9.4), South African SSA-IMGs are the
oldest, and have been living in the US for over 26 y (SD = 10.3),
the longest length of time of any groups. Sudanese migrants are
the youngest (mean age = 45.1, SD = 8.0) and have been living in
the US for about 13 y. Their age demographics and rapid
migration are comparable to Cameroonian SSA-IMGs, the second
youngest group from the nation with the fastest growing physician
emigration rate.
SSA-Based Medical SchoolsSSA-IMGs appearing in the 2011 AMA-PM graduated from 66
SSA medical schools, with over 70% (n = 5,098) coming from only
ten medical schools. Eighteen of 25 Nigerian medical schools are
represented in the 2011 AMA-PM, with seven of them figuring in
the top 20 (Figure 3). These seven Nigerian medical schools
accounted for <39% (n = 2,883) of all SSA-IMGs and <90% of all
Nigerian IMGs practicing in the US in 2011. Five of these schools
are located in Southern Nigeria (Igboland and Yorubaland), and
have .100 SSA-IMGs in the US each. Emigres from medical
schools located in Northern Nigeria (Hausaland), the largest
geographic region of Nigeria, are comparatively underrepresented
within the US-based Nigerian physician workforce. This may be
due in part to Northern Nigeria having fewer medical schools
(n = 6), and thus training fewer physicians than Southern Nigeria
(n = 19 medical schools) [7].
Graduates from the University of Witwatersrand and the
University of Cape Town make up .87% of all South African
SSA-IMGs, but South African-trained migrant physicians repre-
sent fewer than 4% (n = 54) of recent SSA-IMGs (Table 3). Recent
SSA-IMGs graduated between 2000 and 2008, the last year for
which graduation records appear among SSA-IMGs in the 2011
AMA-PM, and they attended 56 SSA-based medical schools.
Respectively, 46.5% (n = 433), 18% (n = 166), and 9% (n = 80) of
these recent graduates come from Nigerian, Ghanaian, and
Sudanese institutions. As shown in Figure 3, the University of
Ibadan (n = 107; Nigeria), the University of Accra (n = 90; Ghana),
the University of Nigeria in Enugu (n = 82; Nigeria), the University
of Kumasi (n = 76; Ghana), and the University of Lagos (n = 66;
Figure 1. Subgroups of Sub-Saharan African migrant physicians identified in the US physician workforce. Data source: AmericanMedical Association [115].doi:10.1371/journal.pmed.1001513.g001
Physician Emigration from Sub-Saharan Africa
PLOS Medicine | www.plosmedicine.org 6 September 2013 | Volume 10 | Issue 9 | e1001513

Nigeria) are the top five medical schools with the largest numbers
of recent SSA-IMGs in the 2011 AMA-PM.
With 28 medical schools, Sudan has the largest number of
medical schools on the African continent [7]. While the 2000–
2008 Sudanese graduates account for only 24.3% (n = 80) of the
total Sudanese SSA-IMGs in the 2011 AMA-PM, 244 Sudanese
SSA-IMGs have actually been added to the AMA-PM since 2002.
Nearly 80% (n = 258) of all Sudanese SSA-IMGs present in the
2011 AMA-PM graduated from the University of Khartoum. Post-
2002 residency completions among graduates from the University
of Khartoum represent 75% (n = 163) of 216 Sudanese SSA-IMGs
completing residency after 2002.
Residency Institutions and Primary SpecialtyOver 600 US-based residency programs provided post-
graduate training to 6,517 SSA-IMGs with complete residency
records in the 2011 AMA-PM. Howard University Hospital was
the most popular of these residency institutions, and trained <5%
(n = 314) of those SSA-IMGs with complete residency training
information. Four of five residency programs that recruited $100
SSA-IMGs are located in New York City and its suburbs
(Table 6). With 3,347 SSA-IMGs, the primary care specialties of
internal medicine, pediatrics, and family practice represent
<50% of all identified medical and surgical specialties (Table 7).
This percentage would be higher if we included the various
subspecialties within these primary specialties. While women
represented less than one-third of the overall SSA-IMG
population, they outnumbered men in pediatrics. Surgical
specializations were uncommon among SSA-IMGs, representing
,2% (n = 143) of all SSA-IMGs with identified specialties
(n = 7,298).
Migration CohortsAvailable residency data on SSA-IMGs indicate that the earliest
cohort of SSA-IMGs entering the US (cohort 1) was composed
primarily of graduates of South African medical schools, Makerere
University in Uganda, and the University of Ibadan in Nigeria.
These first emigres came to the US prior to the 1970s, when
African medical schools were smaller, fewer in number, and
heavily reliant on the expertise of expatriates from former colonial
powers [49,50]. The second cohort (cohort 2) reflects SSA-IMGs
who emigrated in the 1970s and early 1980s, a time when most
SSA countries opened at least one medical school and graduated
at least the first domestic batch of MD-equivalent Bachelor of
Medicine, Bachelor of Surgery (MBChB or MBBS) graduates
[8,9]. Except in apartheid-plagued South Africa, opportunities for
further medical specialization were largely unavailable to SSA-
IMGs graduating in this period. Cohorts 1 and 2 are smaller than
subsequent cohorts and represent 14.8% (n = 965) of SSA-IMGs
with available residency information in the 2011 AMA-PM
(Figure 4); physician retirements and deaths are to be expected
in these older cohorts. Interestingly, South African IMGs, most of
whom are white, represent 60% (n = 578) of these early SSA
migrants. By and large, they were escaping apartheid [51], the
legally sanctioned racist policy governing South Africa from the
late 1940s to early 1990s.
The third migration cohort (cohort 3) represents 47.7%
(n = 3,112) of SSA-IMGs. They came to the US between the
mid-1980s and late 1990s. The surge in medical migration
unfolding in the mid-1980s and sharply increasing throughout
the following decade (1991–2000) coincided with the implemen-
tation of austere economic measures in low- and middle-income
countries (LMICs), resulting in shrinkage of the public sector in
Figure 2. Sub-Saharan African migrant physicians who completed medical school in 2000 or later and are present in the USphysician workforce. Data source: American Medical Association [115].doi:10.1371/journal.pmed.1001513.g002
Physician Emigration from Sub-Saharan Africa
PLOS Medicine | www.plosmedicine.org 7 September 2013 | Volume 10 | Issue 9 | e1001513
African countries, termed structural adjustment programs (SAPs)
[52–54]. The last migration cohort (cohort 4) comprises SSA-
IMGs who came to the US during the new millennium,
representing 37.5% (n = 2,451) of the US-based SSA-IMGs
population; 31% (n = 758) among them were still in residency or
had just completed their residency training in 2011. Of note, the
emigration trend line in Figure 4 has the feature of an
exponential growth curve, and the drop in the number of
emigres observed between 2005 and 2011 is likely to be an
artifact of incomplete residency data, given lags in entry of
recent data.
Proxy for Years of Service Provided by SSA-IMGs Prior toEmigration
Figure 5 illustrates the differences between the average year of
entry in the US and the average year of graduation in SSA for
each 5-y graduation cohort of SSA-IMGs. The plotted differences
are proxies for the average number of years of service provided to
the home countries by each cohort prior to emigration; this
assumes that emigres did not spend time in a third country prior
to coming to the US. The steady decline observed among
graduating cohorts beginning in the mid 1980s suggests that since
the onset of the SAPs, SSA-IMGs have provided fewer years of
service over time to their native countries before emigrating.
SSA-IMGs who graduated between 2000 and 2008 may have
practiced on average for 2.4 y before leaving. This suggests that
many among them may have stayed in their native countries just
long enough to complete the compulsory work for full gradua-
tion/licensure (typically a 1-y housemanship/internship and 1-y
national service).
SSA-IMGs with Birth Country DataWhile physicians reporting to the AMA are required to report
the schools where they obtained their training, the reporting of
country of birth is not deemed mandatory; birth country
information among SSA-trained IMGs was available for only
29.8% (n = 2,199) in the 2011 AMA-PM. Mean differences
between SSA-IMGs with complete and missing birth country
data were statistically significant at the 0.05 level for migrants’
current age and graduation age, but not for graduation year,
suggesting that an assumption that data are missing completely at
random is not tenable (Tables S1 and S2). However, while we
cannot confirm that the birth country data were missing
completely at random, we found very high or near perfect
correlations between both groups on the distribution of several
variables of interest: age (R2 = 0.84), graduating age (R2 = 0.99),
emigration age (R2 = 0.97), and primary specialty choice
(R2 = 0.98) (Figures S1, S2, S3, S4). Thus, whatever statistical
difference may exist between the two groups is not likely to affect
inferences.
Of SSA-trained physicians in the US with complete birth
country data, 21% (n = 467) attended medical schools outside their
birth countries, and 15.6% (n = 342) were born in 34 non-African
countries, led by the US, UK, India, and South Korea (Table S3).
Nigeria and South Africa trained many students from other
neighboring African countries who then migrated to the west,
including the US. Of 752 Nigerian-trained IMGs, 26.5% (n = 199)
reported a birth country other than Nigeria. Likewise, 41.5%
(n = 156) of South African-trained IMGs were born outside of
South Africa. This fraction is the highest for Zambia (65.2%,
n = 30); the majority of Zambian-trained IMGs practicing in the
US were born in India. In contrast, the vast majority of IMGs
Figure 3. Sub-Saharan African-based institutions with the largest numbers of medical graduates appearing in the US physicianworkforce. Data source: American Medical Association [115].doi:10.1371/journal.pmed.1001513.g003
Physician Emigration from Sub-Saharan Africa
PLOS Medicine | www.plosmedicine.org 8 September 2013 | Volume 10 | Issue 9 | e1001513

trained in Cameroon, Ethiopia, Ghana, Kenya, and Sudan are
natives of those countries. Further, 24% (n = 510) of SSA-IMGs
with complete birth country data are women. Of those with
residency completion information (n = 1,651), over 70% (n = 1,183)
immigrated to the US during the implementation years of the
SAPs, and they represent 38% of all SSA-IMGs who moved to the
US during that time-period (Figure 6). The trend in specialty
choices among these emigres with complete birth country data is
quite similar to that of their counterparts with missing birth
country data, with 49.6% (n = 1,038) specializing in primary care
(internal medicine, pediatrics, and family medicine), and women
outnumbering men in pediatrics (Figure 7). In sum, the 30% of
physicians with complete birth country data among SSA-IMGs
appear to be a fairly representative sample of the entire SSA-
trained physician population in the 2011 AMA-PM.
SSA-Born US Medical GraduatesIn addition to SSA-trained physicians, there are 2,126 SSA-
born migrant physicians who graduated from US-based medical
schools in the 2011 AMA-PM. A small number of them (n = 73,
3.4%) are older than 70 y old and may likely be retired. When
excluding the latter, the average SSA-born USMG is 46.3 y
old (SD = 10.5), and graduated from medical school at age
29.3 (SD = 3.9), or 4 y later than the average SSA-IMG
(Table 8). This graduation age gap between the two groups is
intuitively understandable given that USMGs typically com-
plete a 4-y undergraduate degree program before admission to
medical school, whereas their counterparts in SSA enter
medical school directly from high school. Cameroonian-born
SSA-USMGs are the youngest, with a mean age of 40.7 y
(SD = 10.7), while Tanzanian-born are the oldest (mean
age = 56.3, SD = 7.7). With a mean age of 42.2 y (SD = 8.6)
and a mean graduation age of 28.5 y (SD = 3.4), women SSA-
USMGs are 6 y younger than men (mean age = 48.8;
SD = 10.7), and they graduated 1.2 y earlier than their male
counterparts. Overall, women represent 36% (n = 762) of this
subgroup of SSA-born physicians educated in the US.
However, if the current trends persist, their number will
proportionately increase as suggested by current trends and
their majority status among African physician graduates
between 2005 and 2010 (Figure 8).
Among SSA countries with US-based physicians #70 y old,
Ghana, a country with 27 times fewer medical doctors than
Nigeria (see e.g., Table 1), has the highest absolute number of US-
trained physicians in the US (Table 8). As was the case with SSA-
trained migrant physicians, most of the same leading countries
appear in the top five for SSA-USMGs: Ghana (n = 398), Nigeria
(n = 383), Kenya (n = 292), Ethiopia (n = 235), and South Africa
(n = 174). Ghanaian and Kenyan-born USMGs represent, respec-
tively, 27.9% (n = 216) and 21.3% (n = 162) of all SSA-USMGs
who obtained their medical degrees in the US between 2000 and
2010. The number of SSA-USMGs in the AMA-PM appears to
determine in part the number of SSA-trained IMGs and the
number of SSA-born IMGs trained outside SSA found in the
AMA-PM. The scatter plots (Figures S5, S6, S7) of the bivariate
relationships between the numbers of USMGs and IMGs yielded
the following determination coefficients: R2 = 0.5 (for SSA-
USMGs and SSA-IMGs), R2 = 0.49 (for SSA-USMGs and SSA-
born IMGs trained outside SSA), and R2 = 0.08 (for SSA-IMGs
and SSA-born IMGs trained outside SSA). While the last value is
Table 3. Sub-Saharan African-trained international medical graduates (SSA-IMGs) appearing in the US physician workforce in 2011.
Countries with $5 SSA-IMGs SSA-IMGs Potentially Active SSA-IMGs (age #70) Recent Graduates (2000–2008)
n Cumulative Percent n Cumulative Percent n Percent
Nigeria 3,271 44.4 3,252 45.6 433 13.3
South Africa 1,787 68.6 1,578 67.7 54 3.4
Ghana 721 78.4 721 77.9 166 23
Ethiopia 531 85.6 530 85.3 70 13.2
Sudan 329 90.1 328 89.9 80 24.4
Kenya 173 92.4 173 92.3 40 23.1
Uganda 145 94.4 139 94.3 16 11.5
Zimbabwe 112 95.9 108 95.8 24 22.2
Zambia 81 97 81 96.9 9 11.1
Cameroon 63 97.9 63 97.8 21 33.3
Liberia 56 98.6 56 98.6 0 0
Tanzania 24 99 24 98.9 2 8.3
Somalia 14 99.1 14 99.1 0 0
Congo (DRC)a 13 99.3 13 99.3 4 30.8
Senegal 11 99.5 11 99.5 3 27.3
Guinea 6 99.6 6 99.5 1 16.7
Sierra Leone 6 99.6 6 99.6 1 16.7
Ivory Coast 5 99.7 5 99.7 2 40
Other (n = 10)a 22 100 22 100 2 9.1
Total 7,370 7,130 928 13
Data source: American Medical Association [115].aDRC is the Democratic Republic of Congo. Other includes ten countries with fewer than five SSA-IMGs each in the 2011 AMA Physician Masterfile.doi:10.1371/journal.pmed.1001513.t003
Physician Emigration from Sub-Saharan Africa
PLOS Medicine | www.plosmedicine.org 9 September 2013 | Volume 10 | Issue 9 | e1001513
Ta
ble
4.
Ch
ang
ein
the
nu
mb
er
of
Sub
-Sah
aran
Afr
ican
-tra
ine
din
tern
atio
nal
me
dic
alg
rad
uat
es
(SSA
-IM
Gs)
app
ear
ing
inth
eU
Sp
hys
icia
nw
ork
forc
eb
etw
ee
n2
00
2an
d2
01
1.
Co
un
trie
so
fT
rain
ing
(To
p1
2)
20
02
Da
ta2
01
1D
ata
Ch
an
ge
SS
A-I
MG
s
Ph
ysi
cia
ns
inS
ou
rce
Co
un
trie
sE
mig
rati
on
Fra
ctio
nS
SA
-IM
Gs
SS
A-I
MG
s,a
ge
#7
0P
hy
sici
an
sin
So
urc
eC
ou
ntr
ies
Em
igra
tio
nF
ract
ion
‘‘A
ctiv
e’’
Em
igra
tio
nF
ract
ion
SS
A-I
MG
s(n
)S
SA
-IM
Gs
(%)
Cam
ero
on
a[1
4]
[1,0
95
]1
.3%
63
63
1,3
46
4.5
%4
.5%
49
35
0.0
%
Sud
ana
[85
][3
,15
7]
2.6
%3
29
32
81
0,8
13
2.9
5%
2.9
%2
44
28
7.1
%
Eth
iop
ia2
57
1,5
64
14
.1%
53
15
30
2,1
52
19
.8%
19
.8%
27
41
06
.6%
Ke
nya
93
4,0
01
2.3
%1
73
17
37
,54
92
.2%
2.2
%8
08
6.0
%
Tan
zan
iaa
[14
][1
,38
4]
1.0
%2
42
43
00
7.4
%7
.4%
10
71
.4%
Nig
eri
a2
,15
82
2,8
94
8.6
%3
,27
13
,25
25
5,3
76
5.6
%5
.5%
1,1
13
51
.6%
Gh
ana
47
81
,21
02
8.3
%7
21
72
12
,03
32
6.2
%2
6.2
%2
43
50
.8%
Zim
bab
we
75
1,6
94
4.2
%1
12
10
88
27
11
.9%
11
.6%
37
49
.3%
Zam
bia
67
67
69
.0%
81
81
83
68
.8%
8.8
%1
42
0.9
%
Lib
eri
a4
77
23
9.5
%5
65
65
15
2.3
%5
2.3
%9
19
.1%
Ug
and
a1
33
72
21
5.6
%1
45
13
93
,36
14
.1%
4.0
%1
29
.0%
Sou
thA
fric
a1
,94
32
3,8
44
7.5
%1
,78
61
,57
73
8,2
36
4.5
%4
.0%
21
57
28
.1%
Oth
era
83
12
,91
20
.6%
78
78
21
,66
60
.4%
0.4
%n
/an
/a
To
tal
5,3
34
69
,58
97
.1%
7,3
70
7,1
30
14
4,5
46
4.9
%4
.7%
2,0
36
38
.2%
Dat
aso
urc
es:
Wo
rld
He
alth
Org
aniz
atio
n[5
];2
00
2A
MA
Ph
ysic
ian
Mas
terf
ileas
pe
rH
ago
pia
ne
tal
.[1
9];
Am
eri
can
Me
dic
alA
sso
ciat
ion
[11
5].
a2
00
2d
ata
we
rere
po
rte
db
yH
ago
pia
ne
tal
.[1
9]
exc
ep
tfo
rth
en
um
be
rso
fIM
Gs
trai
ne
din
Cam
ero
on
,Tan
zan
ia,a
nd
Sud
an.T
he
irn
um
be
rsar
ein
clu
de
din
bra
cke
tsb
eca
use
the
yar
en
ot
par
to
fth
eto
talc
ou
nts
rep
ort
ed
inth
ela
stro
wo
fth
eta
ble
.Th
ese
mig
ran
tsw
ere
ide
nti
fie
dam
on
gSS
A-I
MG
sin
the
20
11
AM
AP
hys
icia
nM
aste
rfile
wh
oco
mp
lete
dre
sid
en
cyb
y2
00
2.B
ut
the
nu
mb
er
of
ph
ysic
ian
sav
aila
ble
inC
ame
roo
n,S
ud
an,a
nd
Tan
zan
iain
20
02
cam
efr
om
the
Hag
op
ian
et
al.p
ape
r.In
the
ird
atas
et,
‘‘oth
er’
’in
clu
de
s1
2co
un
trie
sw
ith
‘‘at
leas
to
ne
gra
du
ate
inth
eU
S.’’
Ino
ur
20
11
dat
ase
t,e
xce
pt
oth
erw
ise
spe
cifi
ed
,‘‘o
the
r’’r
efe
rsto
the
16
sub
-Sah
aran
Afr
ican
cou
ntr
ies
wit
hfe
we
rth
an1
5SS
A-I
MG
se
ach
inth
e2
01
1A
MA
Ph
ysic
ian
Mas
terf
ile.
Th
en
um
be
rso
fp
hys
icia
ns
inso
urc
eco
un
trie
sfo
rth
eye
ar2
01
1ar
efr
om
the
Glo
bal
He
alth
Wo
rkfo
rce
Stat
isti
cso
fth
eW
orl
dH
eal
thO
rgan
izat
ion
[5].
‘‘Act
ive
’’e
mig
rati
on
rate
isth
ee
mig
rati
on
rate
amo
ng
po
ten
tial
lyac
tive
ph
ysic
ian
s.W
ed
efi
ne
dal
lm
igra
nt
ph
ysic
ian
sag
e#
70
asp
ote
nti
ally
acti
ve.
do
i:10
.13
71
/jo
urn
al.p
me
d.1
00
15
13
.t0
04
Physician Emigration from Sub-Saharan Africa
PLOS Medicine | www.plosmedicine.org 10 September 2013 | Volume 10 | Issue 9 | e1001513

Ta
ble
5.
Bir
th,g
rad
uat
ion
,re
sid
en
cyco
mp
leti
on
,an
de
stim
ate
dU
Se
ntr
yye
ars
amo
ng
Sub
-Sah
aran
Afr
ican
-tra
ine
dm
ed
ical
gra
du
ate
s(S
SA-I
MG
s)ap
pe
arin
gin
the
US
ph
ysic
ian
wo
rkfo
rce
in2
01
1.
Co
un
trie
so
fT
rain
ing
(To
p1
2)
SS
A-I
MG
sa
ge
#7
0M
ea
nY
ea
ro
fB
irth
(SD
)M
ea
nY
ea
ro
fG
rad
ua
tio
n(S
D)
Me
an
Ye
ar
of
Re
sid
en
cyC
om
ple
tio
n(S
D)
Est
ima
ted
Me
an
Ye
ar
at
US
En
try
(SD
)M
ea
nA
ge
(SD
)in
20
13
Me
an
Ag
e(S
D)
at
Gra
du
ati
on
Est
ima
ted
Me
an
Ag
e(S
D)
at
US
En
try
Me
an
Le
ng
tho
fT
ime
inU
S(S
D)
Sou
thA
fric
a1
,57
71
95
6(9
.4)
19
80
(9.4
)1
99
1.8
(10
.3)
19
86
.8(1
0.3
)5
7(9
.4)
24
.1(1
.6)
29
.1(4
.7)
26
.2(1
0.3
)
Ug
and
a1
39
19
56
.9(1
2.4
)1
98
2.1
(12
.3)
19
92
.5(1
3.4
)1
98
7.5
(13
.4)
56
.2(1
2.4
)2
5.3
(1.5
)2
9.8
(4.2
)2
5.5
(13
.5)
Zam
bia
81
19
60
.6(8
)1
98
6.4
(7.9
)1
99
5.6
(9.3
)1
99
0.6
(9.3
)5
2.4
(8)
25
.8(2
.2)
30
.2(4
.4)
22
.4(9
.4)
Tan
zan
ia2
41
95
9.6
(9.4
)1
98
4.8
(9.3
)1
99
7.6
(10
.3)
19
92
.6(1
0.3
)5
3.8
(9.4
)2
5.5
(1.3
)3
3(6
.0)
20
.4(1
0.6
)
Lib
eri
a5
61
95
7(4
.6)
19
84
.7(4
.7)
19
98
.5(6
.7)
19
93
.5(6
.7)
56
(4.6
)2
7.7
(2.6
)3
6.4
(6.7
)1
9.5
(6.8
)
Zim
bab
we
10
81
96
4.5
(10
.2)
19
89
.2(9
.6)
20
00
.3(9
.5)
19
95
.3(9
.5)
48
.6(1
0.2
)2
4.8
(2.3
)2
9.8
(4.4
)1
7.7
(9.5
)
Ke
nya
17
31
96
4.6
(10
)1
99
0.1
(10
.4)
20
00
.4(1
0.7
)1
99
5.5
(10
.7)
47
.4(1
0.2
)2
5.5
(1.2
)3
1.1
(5.1
)1
7.6
(10
.8)
Gh
ana
72
11
96
3.6
(9)
19
90
.7(9
.4)
20
00
.5(8
.8)
19
95
.5(8
.8)
49
.4(9
)2
7.1
(1.6
)3
1.8
(3.8
)1
7.5
(8.8
)
Nig
eri
a3
,25
21
96
5.3
(7.6
)1
99
0.2
(7.7
)2
00
2.3
(7.3
)1
99
7.3
(7.3
)4
7.7
(7.7
)2
4.8
(2.3
)3
1.9
(4.9
)1
5.7
(7.3
)
Eth
iop
ia5
30
19
65
.8(8
)1
99
1(7
.6)
20
04
(7.4
)1
99
9.0
(7.4
)4
7.1
(8)
25
.1(1
.9)
33
.1(4
.7)
14
.0(7
.4)
Cam
ero
on
63
19
67
.2(8
.6)
19
93
.3(8
.5)
20
05
.2(6
.4)
20
00
.2(6
.4)
45
.7(8
.6)
26
.0(1
.4)
32
.8(4
.6)
12
.8(6
.5)
Sud
an3
28
19
67
.8(7
.9)
19
93
(8)
20
05
.3(6
.2)
20
00
.3(6
.2)
45
.1(8
)2
5.1
(1.8
)3
2.7
(5.2
)1
2.7
(6.2
)
Oth
er
(n=
16
)a7
81
96
2.5
(7.7
)1
99
0.6
(8.6
)2
00
4.3
(3.8
)1
99
9.3
(3.8
)5
0.6
(8.2
)2
8.1
(4.7
)3
6.2
(6.5
)1
3.7
(6.2
)
To
tal
7,1
30
19
62
.9(9
.4)
19
87
.9(9
.6)
20
00
.1(9
.4)
19
95
.1(9
.4)
50
.1(9
.4)
25
.0(2
.2)
31
.5(5
.0)
17
.9(9
.4)
Dat
aso
urc
e:
Am
eri
can
Me
dic
alA
sso
ciat
ion
[11
5].
aSu
b-S
ahar
anA
fric
anco
un
trie
sw
ith
,1
5SS
A-I
MG
se
ach
inth
e2
01
1A
MA
Ph
ysic
ian
Mas
terf
ile.
No
te:R
esi
de
ncy
com
ple
tio
nd
ata
we
reav
aila
ble
for
on
ly6
,42
1SS
A-I
MG
sag
e#
70
.Giv
en
that
the
Am
eri
can
Me
dic
alA
sso
ciat
ion
do
es
no
tco
llect
dat
ao
nre
sid
en
cyad
mis
sio
nd
ate
,ye
aro
fU
Se
ntr
yw
ase
stim
ate
db
ysu
btr
acti
ng
5y
fro
mre
sid
en
cyco
mp
leti
on
year
.Am
on
gSS
A-I
MG
sst
illin
resi
de
ncy
atth
eti
me
(n=
43
9),
the
5-y
lag
was
adju
ste
dp
rop
ort
ion
ally
toth
ean
tici
pat
ed
year
of
resi
de
ncy
com
ple
tio
n.
Esti
mat
es
we
rere
adju
ste
du
pw
ard
for
tho
seSS
A-
IMG
sw
ho
see
stim
ate
dye
aro
fe
ntr
yin
the
US
pre
ced
ed
the
irg
rad
uat
ion
year
.Fo
re
xam
ple
,ye
aro
fU
Se
ntr
yfo
ra
Nig
eri
an-t
rain
ed
ph
ysic
ian
wh
og
rad
uat
ed
fro
mm
ed
ical
sch
oo
lin
20
08
and
was
exp
ect
ed
toco
mp
lete
resi
de
ncy
in2
01
2,
was
read
just
ed
fro
m2
00
7(i
.e.,
20
12
min
us
5y)
to2
00
8(y
ear
of
gra
du
atio
n).
Esti
mat
es
we
rere
adju
ste
dd
ow
nw
ard
for
tho
seSS
A-I
MG
sw
ho
see
stim
ate
dU
Se
ntr
yye
arw
asab
ove
20
11
.d
oi:1
0.1
37
1/j
ou
rnal
.pm
ed
.10
01
51
3.t
00
5
Physician Emigration from Sub-Saharan Africa
PLOS Medicine | www.plosmedicine.org 11 September 2013 | Volume 10 | Issue 9 | e1001513
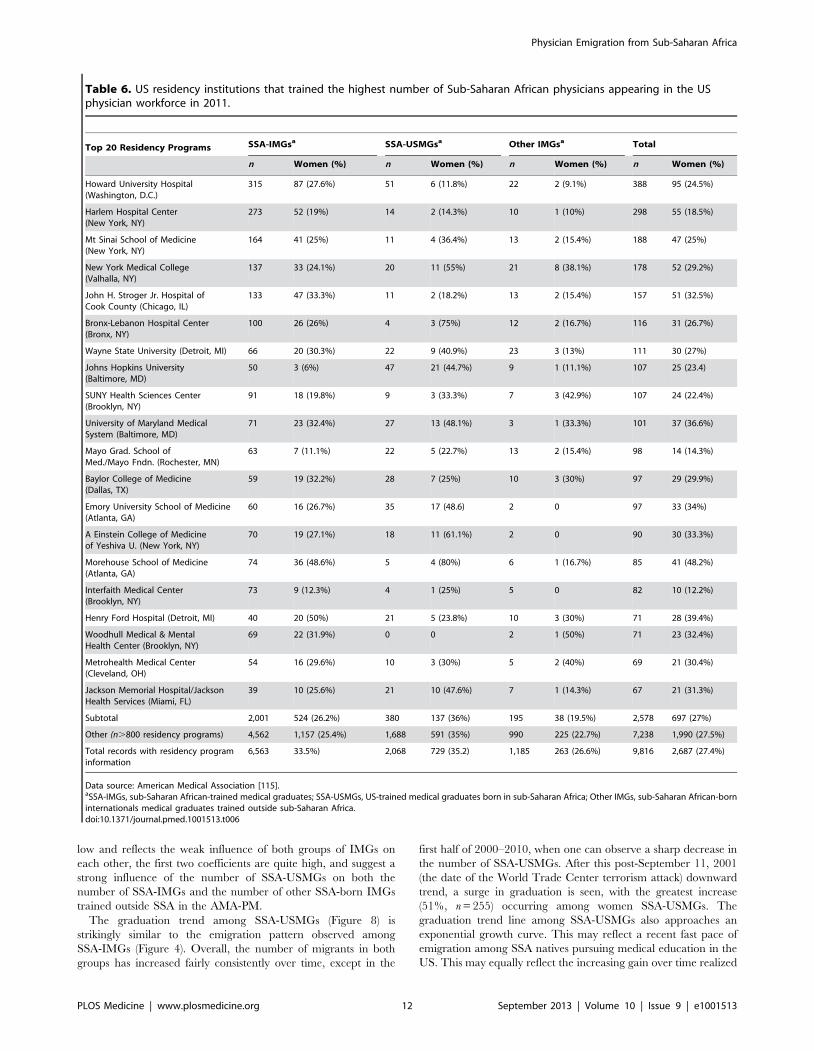
low and reflects the weak influence of both groups of IMGs on
each other, the first two coefficients are quite high, and suggest a
strong influence of the number of SSA-USMGs on both the
number of SSA-IMGs and the number of other SSA-born IMGs
trained outside SSA in the AMA-PM.
The graduation trend among SSA-USMGs (Figure 8) is
strikingly similar to the emigration pattern observed among
SSA-IMGs (Figure 4). Overall, the number of migrants in both
groups has increased fairly consistently over time, except in the
first half of 2000–2010, when one can observe a sharp decrease in
the number of SSA-USMGs. After this post-September 11, 2001
(the date of the World Trade Center terrorism attack) downward
trend, a surge in graduation is seen, with the greatest increase
(51%, n = 255) occurring among women SSA-USMGs. The
graduation trend line among SSA-USMGs also approaches an
exponential growth curve. This may reflect a recent fast pace of
emigration among SSA natives pursuing medical education in the
US. This may equally reflect the increasing gain over time realized
Table 6. US residency institutions that trained the highest number of Sub-Saharan African physicians appearing in the USphysician workforce in 2011.
Top 20 Residency Programs SSA-IMGsa SSA-USMGsa Other IMGsa Total
n Women (%) n Women (%) n Women (%) n Women (%)
Howard University Hospital(Washington, D.C.)
315 87 (27.6%) 51 6 (11.8%) 22 2 (9.1%) 388 95 (24.5%)
Harlem Hospital Center(New York, NY)
273 52 (19%) 14 2 (14.3%) 10 1 (10%) 298 55 (18.5%)
Mt Sinai School of Medicine(New York, NY)
164 41 (25%) 11 4 (36.4%) 13 2 (15.4%) 188 47 (25%)
New York Medical College(Valhalla, NY)
137 33 (24.1%) 20 11 (55%) 21 8 (38.1%) 178 52 (29.2%)
John H. Stroger Jr. Hospital ofCook County (Chicago, IL)
133 47 (33.3%) 11 2 (18.2%) 13 2 (15.4%) 157 51 (32.5%)
Bronx-Lebanon Hospital Center(Bronx, NY)
100 26 (26%) 4 3 (75%) 12 2 (16.7%) 116 31 (26.7%)
Wayne State University (Detroit, MI) 66 20 (30.3%) 22 9 (40.9%) 23 3 (13%) 111 30 (27%)
Johns Hopkins University(Baltimore, MD)
50 3 (6%) 47 21 (44.7%) 9 1 (11.1%) 107 25 (23.4)
SUNY Health Sciences Center(Brooklyn, NY)
91 18 (19.8%) 9 3 (33.3%) 7 3 (42.9%) 107 24 (22.4%)
University of Maryland MedicalSystem (Baltimore, MD)
71 23 (32.4%) 27 13 (48.1%) 3 1 (33.3%) 101 37 (36.6%)
Mayo Grad. School ofMed./Mayo Fndn. (Rochester, MN)
63 7 (11.1%) 22 5 (22.7%) 13 2 (15.4%) 98 14 (14.3%)
Baylor College of Medicine(Dallas, TX)
59 19 (32.2%) 28 7 (25%) 10 3 (30%) 97 29 (29.9%)
Emory University School of Medicine(Atlanta, GA)
60 16 (26.7%) 35 17 (48.6) 2 0 97 33 (34%)
A Einstein College of Medicineof Yeshiva U. (New York, NY)
70 19 (27.1%) 18 11 (61.1%) 2 0 90 30 (33.3%)
Morehouse School of Medicine(Atlanta, GA)
74 36 (48.6%) 5 4 (80%) 6 1 (16.7%) 85 41 (48.2%)
Interfaith Medical Center(Brooklyn, NY)
73 9 (12.3%) 4 1 (25%) 5 0 82 10 (12.2%)
Henry Ford Hospital (Detroit, MI) 40 20 (50%) 21 5 (23.8%) 10 3 (30%) 71 28 (39.4%)
Woodhull Medical & MentalHealth Center (Brooklyn, NY)
69 22 (31.9%) 0 0 2 1 (50%) 71 23 (32.4%)
Metrohealth Medical Center(Cleveland, OH)
54 16 (29.6%) 10 3 (30%) 5 2 (40%) 69 21 (30.4%)
Jackson Memorial Hospital/JacksonHealth Services (Miami, FL)
39 10 (25.6%) 21 10 (47.6%) 7 1 (14.3%) 67 21 (31.3%)
Subtotal 2,001 524 (26.2%) 380 137 (36%) 195 38 (19.5%) 2,578 697 (27%)
Other (n.800 residency programs) 4,562 1,157 (25.4%) 1,688 591 (35%) 990 225 (22.7%) 7,238 1,990 (27.5%)
Total records with residency programinformation
6,563 33.5%) 2,068 729 (35.2) 1,185 263 (26.6%) 9,816 2,687 (27.4%)
Data source: American Medical Association [115].aSSA-IMGs, sub-Saharan African-trained medical graduates; SSA-USMGs, US-trained medical graduates born in sub-Saharan Africa; Other IMGs, sub-Saharan African-borninternationals medical graduates trained outside sub-Saharan Africa.doi:10.1371/journal.pmed.1001513.t006
Physician Emigration from Sub-Saharan Africa
PLOS Medicine | www.plosmedicine.org 12 September 2013 | Volume 10 | Issue 9 | e1001513
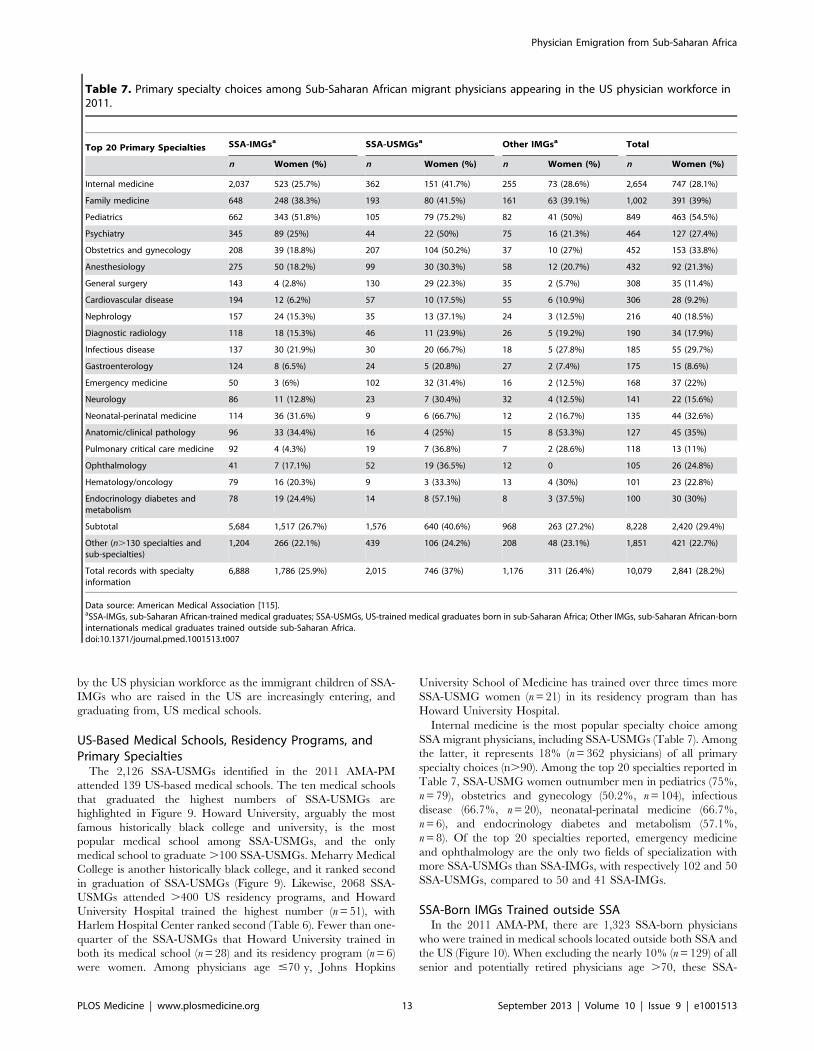
by the US physician workforce as the immigrant children of SSA-
IMGs who are raised in the US are increasingly entering, and
graduating from, US medical schools.
US-Based Medical Schools, Residency Programs, andPrimary Specialties
The 2,126 SSA-USMGs identified in the 2011 AMA-PM
attended 139 US-based medical schools. The ten medical schools
that graduated the highest numbers of SSA-USMGs are
highlighted in Figure 9. Howard University, arguably the most
famous historically black college and university, is the most
popular medical school among SSA-USMGs, and the only
medical school to graduate .100 SSA-USMGs. Meharry Medical
College is another historically black college, and it ranked second
in graduation of SSA-USMGs (Figure 9). Likewise, 2068 SSA-
USMGs attended .400 US residency programs, and Howard
University Hospital trained the highest number (n = 51), with
Harlem Hospital Center ranked second (Table 6). Fewer than one-
quarter of the SSA-USMGs that Howard University trained in
both its medical school (n = 28) and its residency program (n = 6)
were women. Among physicians age #70 y, Johns Hopkins
University School of Medicine has trained over three times more
SSA-USMG women (n = 21) in its residency program than has
Howard University Hospital.
Internal medicine is the most popular specialty choice among
SSA migrant physicians, including SSA-USMGs (Table 7). Among
the latter, it represents 18% (n = 362 physicians) of all primary
specialty choices (n.90). Among the top 20 specialties reported in
Table 7, SSA-USMG women outnumber men in pediatrics (75%,
n = 79), obstetrics and gynecology (50.2%, n = 104), infectious
disease (66.7%, n = 20), neonatal-perinatal medicine (66.7%,
n = 6), and endocrinology diabetes and metabolism (57.1%,
n = 8). Of the top 20 specialties reported, emergency medicine
and ophthalmology are the only two fields of specialization with
more SSA-USMGs than SSA-IMGs, with respectively 102 and 50
SSA-USMGs, compared to 50 and 41 SSA-IMGs.
SSA-Born IMGs Trained outside SSAIn the 2011 AMA-PM, there are 1,323 SSA-born physicians
who were trained in medical schools located outside both SSA and
the US (Figure 10). When excluding the nearly 10% (n = 129) of all
senior and potentially retired physicians age .70, these SSA-
Table 7. Primary specialty choices among Sub-Saharan African migrant physicians appearing in the US physician workforce in2011.
Top 20 Primary Specialties SSA-IMGsa SSA-USMGsa Other IMGsa Total
n Women (%) n Women (%) n Women (%) n Women (%)
Internal medicine 2,037 523 (25.7%) 362 151 (41.7%) 255 73 (28.6%) 2,654 747 (28.1%)
Family medicine 648 248 (38.3%) 193 80 (41.5%) 161 63 (39.1%) 1,002 391 (39%)
Pediatrics 662 343 (51.8%) 105 79 (75.2%) 82 41 (50%) 849 463 (54.5%)
Psychiatry 345 89 (25%) 44 22 (50%) 75 16 (21.3%) 464 127 (27.4%)
Obstetrics and gynecology 208 39 (18.8%) 207 104 (50.2%) 37 10 (27%) 452 153 (33.8%)
Anesthesiology 275 50 (18.2%) 99 30 (30.3%) 58 12 (20.7%) 432 92 (21.3%)
General surgery 143 4 (2.8%) 130 29 (22.3%) 35 2 (5.7%) 308 35 (11.4%)
Cardiovascular disease 194 12 (6.2%) 57 10 (17.5%) 55 6 (10.9%) 306 28 (9.2%)
Nephrology 157 24 (15.3%) 35 13 (37.1%) 24 3 (12.5%) 216 40 (18.5%)
Diagnostic radiology 118 18 (15.3%) 46 11 (23.9%) 26 5 (19.2%) 190 34 (17.9%)
Infectious disease 137 30 (21.9%) 30 20 (66.7%) 18 5 (27.8%) 185 55 (29.7%)
Gastroenterology 124 8 (6.5%) 24 5 (20.8%) 27 2 (7.4%) 175 15 (8.6%)
Emergency medicine 50 3 (6%) 102 32 (31.4%) 16 2 (12.5%) 168 37 (22%)
Neurology 86 11 (12.8%) 23 7 (30.4%) 32 4 (12.5%) 141 22 (15.6%)
Neonatal-perinatal medicine 114 36 (31.6%) 9 6 (66.7%) 12 2 (16.7%) 135 44 (32.6%)
Anatomic/clinical pathology 96 33 (34.4%) 16 4 (25%) 15 8 (53.3%) 127 45 (35%)
Pulmonary critical care medicine 92 4 (4.3%) 19 7 (36.8%) 7 2 (28.6%) 118 13 (11%)
Ophthalmology 41 7 (17.1%) 52 19 (36.5%) 12 0 105 26 (24.8%)
Hematology/oncology 79 16 (20.3%) 9 3 (33.3%) 13 4 (30%) 101 23 (22.8%)
Endocrinology diabetes andmetabolism
78 19 (24.4%) 14 8 (57.1%) 8 3 (37.5%) 100 30 (30%)
Subtotal 5,684 1,517 (26.7%) 1,576 640 (40.6%) 968 263 (27.2%) 8,228 2,420 (29.4%)
Other (n.130 specialties andsub-specialties)
1,204 266 (22.1%) 439 106 (24.2%) 208 48 (23.1%) 1,851 421 (22.7%)
Total records with specialtyinformation
6,888 1,786 (25.9%) 2,015 746 (37%) 1,176 311 (26.4%) 10,079 2,841 (28.2%)
Data source: American Medical Association [115].aSSA-IMGs, sub-Saharan African-trained medical graduates; SSA-USMGs, US-trained medical graduates born in sub-Saharan Africa; Other IMGs, sub-Saharan African-borninternationals medical graduates trained outside sub-Saharan Africa.doi:10.1371/journal.pmed.1001513.t007
Physician Emigration from Sub-Saharan Africa
PLOS Medicine | www.plosmedicine.org 13 September 2013 | Volume 10 | Issue 9 | e1001513
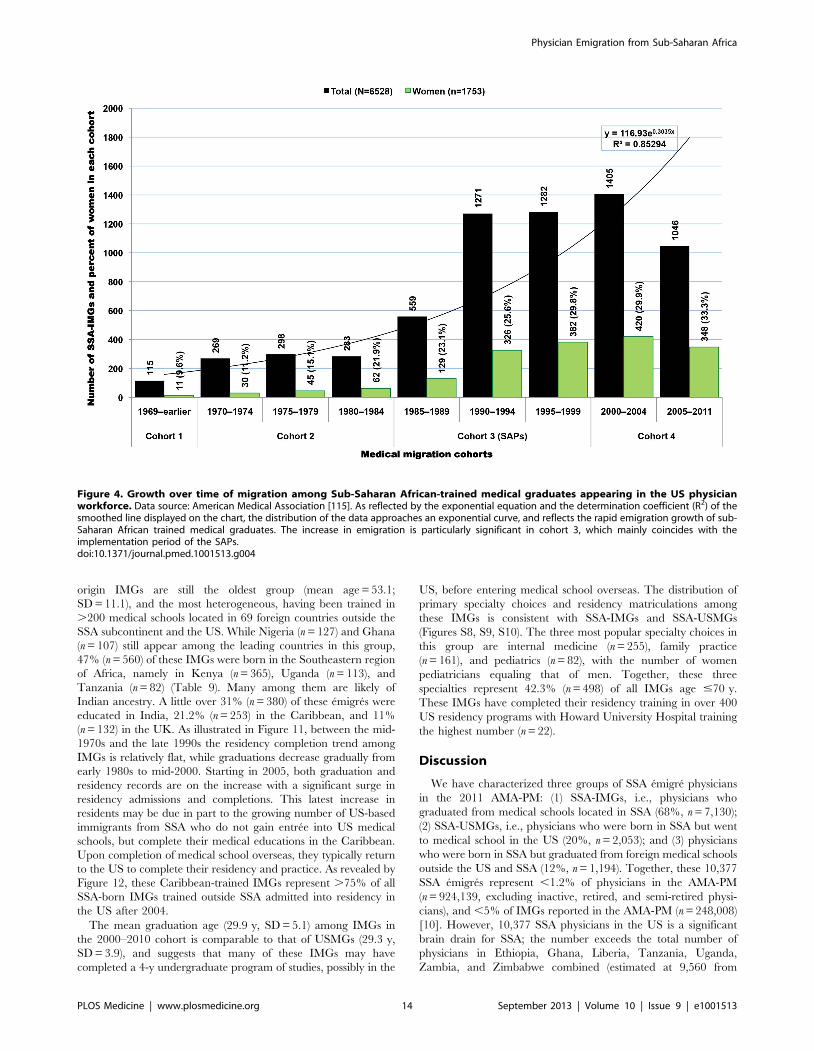
origin IMGs are still the oldest group (mean age = 53.1;
SD = 11.1), and the most heterogeneous, having been trained in
.200 medical schools located in 69 foreign countries outside the
SSA subcontinent and the US. While Nigeria (n = 127) and Ghana
(n = 107) still appear among the leading countries in this group,
47% (n = 560) of these IMGs were born in the Southeastern region
of Africa, namely in Kenya (n = 365), Uganda (n = 113), and
Tanzania (n = 82) (Table 9). Many among them are likely of
Indian ancestry. A little over 31% (n = 380) of these emigres were
educated in India, 21.2% (n = 253) in the Caribbean, and 11%
(n = 132) in the UK. As illustrated in Figure 11, between the mid-
1970s and the late 1990s the residency completion trend among
IMGs is relatively flat, while graduations decrease gradually from
early 1980s to mid-2000. Starting in 2005, both graduation and
residency records are on the increase with a significant surge in
residency admissions and completions. This latest increase in
residents may be due in part to the growing number of US-based
immigrants from SSA who do not gain entree into US medical
schools, but complete their medical educations in the Caribbean.
Upon completion of medical school overseas, they typically return
to the US to complete their residency and practice. As revealed by
Figure 12, these Caribbean-trained IMGs represent .75% of all
SSA-born IMGs trained outside SSA admitted into residency in
the US after 2004.
The mean graduation age (29.9 y, SD = 5.1) among IMGs in
the 2000–2010 cohort is comparable to that of USMGs (29.3 y,
SD = 3.9), and suggests that many of these IMGs may have
completed a 4-y undergraduate program of studies, possibly in the
US, before entering medical school overseas. The distribution of
primary specialty choices and residency matriculations among
these IMGs is consistent with SSA-IMGs and SSA-USMGs
(Figures S8, S9, S10). The three most popular specialty choices in
this group are internal medicine (n = 255), family practice
(n = 161), and pediatrics (n = 82), with the number of women
pediatricians equaling that of men. Together, these three
specialties represent 42.3% (n = 498) of all IMGs age #70 y.
These IMGs have completed their residency training in over 400
US residency programs with Howard University Hospital training
the highest number (n = 22).
Discussion
We have characterized three groups of SSA emigre physicians
in the 2011 AMA-PM: (1) SSA-IMGs, i.e., physicians who
graduated from medical schools located in SSA (68%, n = 7,130);
(2) SSA-USMGs, i.e., physicians who were born in SSA but went
to medical school in the US (20%, n = 2,053); and (3) physicians
who were born in SSA but graduated from foreign medical schools
outside the US and SSA (12%, n = 1,194). Together, these 10,377
SSA emigres represent ,1.2% of physicians in the AMA-PM
(n = 924,139, excluding inactive, retired, and semi-retired physi-
cians), and ,5% of IMGs reported in the AMA-PM (n = 248,008)
[10]. However, 10,377 SSA physicians in the US is a significant
brain drain for SSA; the number exceeds the total number of
physicians in Ethiopia, Ghana, Liberia, Tanzania, Uganda,
Zambia, and Zimbabwe combined (estimated at 9,560 from
Figure 4. Growth over time of migration among Sub-Saharan African-trained medical graduates appearing in the US physicianworkforce. Data source: American Medical Association [115]. As reflected by the exponential equation and the determination coefficient (R2) of thesmoothed line displayed on the chart, the distribution of the data approaches an exponential curve, and reflects the rapid emigration growth of sub-Saharan African trained medical graduates. The increase in emigration is particularly significant in cohort 3, which mainly coincides with theimplementation period of the SAPs.doi:10.1371/journal.pmed.1001513.g004
Physician Emigration from Sub-Saharan Africa
PLOS Medicine | www.plosmedicine.org 14 September 2013 | Volume 10 | Issue 9 | e1001513

2005–2010) [5]. These seven countries have significant fractions of
their physicians in the US and a combined population exceeding
210 million people, equivalent to 0.05 physician for 1,000 people
compared to 2.5/1,000 in the US in 2009, a 50-fold ratio [55].
Another striking example is that of Liberia. If only half of the
Liberian physicians identified in the 2011 AMA-PM were to
return to Liberia, their presence would more than double the
Liberian physician workforce (Table 10). Likewise, if half of
Ghanaian-trained physicians identified in the 2011 AMA-PM
and Ghanaian-born emigres who graduated from US medical
schools were to return to Ghana, their presence would increase
Ghana’s physician workforce by .30%. Such hypotheticals are
instructive to illustrate the magnitude of the brain drain burden,
though we do not suggest that such a reverse migration would
occur in the absence of improved facilities, drugs, supplies,
support staff, financial conditions, and, perhaps, political reform.
In some cases, IMGs returning home may face regulatory
obstacles to have their US credentials recognized and obtain a
license to practice [56].
A near doubling from the 5,336 SSA emigre physicians since
2002 [19] to 10,819 in 2011, using the same AMA source with its
incomplete and missing data, suggests: (a) a probable underesti-
mation of the actual number of SSA migrant physicians integrated
into the US physician workforce; and (b) a serious continuing
depletion of scarce human resources from SSA if current patterns
were to continue. SSA has only 2% of the global physician
workforce [57], yet bears 24% of the global burden of diseases
including 69% of the world’s HIV/AIDS infections [58]. The SSA
region needs an estimated 420,000 additional physicians by 2015
in order to meet health-related targets for the millennium
development goals [57]. As US medical schools awarded 29,775
medical degrees from 1978 to 2008 to Blacks/African Americans
[59], we roughly estimate the population of SSA physicians age
#70 identified in the 2011 AMA-PM to represent between 22.4%
(n = 8,588 when excluding South African physicians) and 27.3%
(n = 10,377 when including South African physicians) of the
‘‘black’’ physician workforce in the US. While we are unaware of
any specific study of SSA physicians’ clientele and outcomes in the
US, studies of IMGs in general suggest they are more likely to
practice in underserved communities than are USMGs [60–63].
Similarly, black physicians are more likely to practice in
underserved communities than are whites [64–71], so one can
speculate that SSA doctors are disproportionately valuable to a US
health system plagued with geographic maldistributions. This may
be a motivation for US institutions, notably historically black
colleges and universities like Howard University and Meharry
Figure 5. Length of service provided to the home country by each graduation cohort of Sub-Saharan African-trained medicalgraduates before migration to the United States. Note: Based on n = 6,421 complete graduation and residency records. Estimated mean year oftime between graduation and entry in the United States: 6.4 y (SD = 4.6). Data source: American Medical Association [115].doi:10.1371/journal.pmed.1001513.g005
Physician Emigration from Sub-Saharan Africa
PLOS Medicine | www.plosmedicine.org 15 September 2013 | Volume 10 | Issue 9 | e1001513
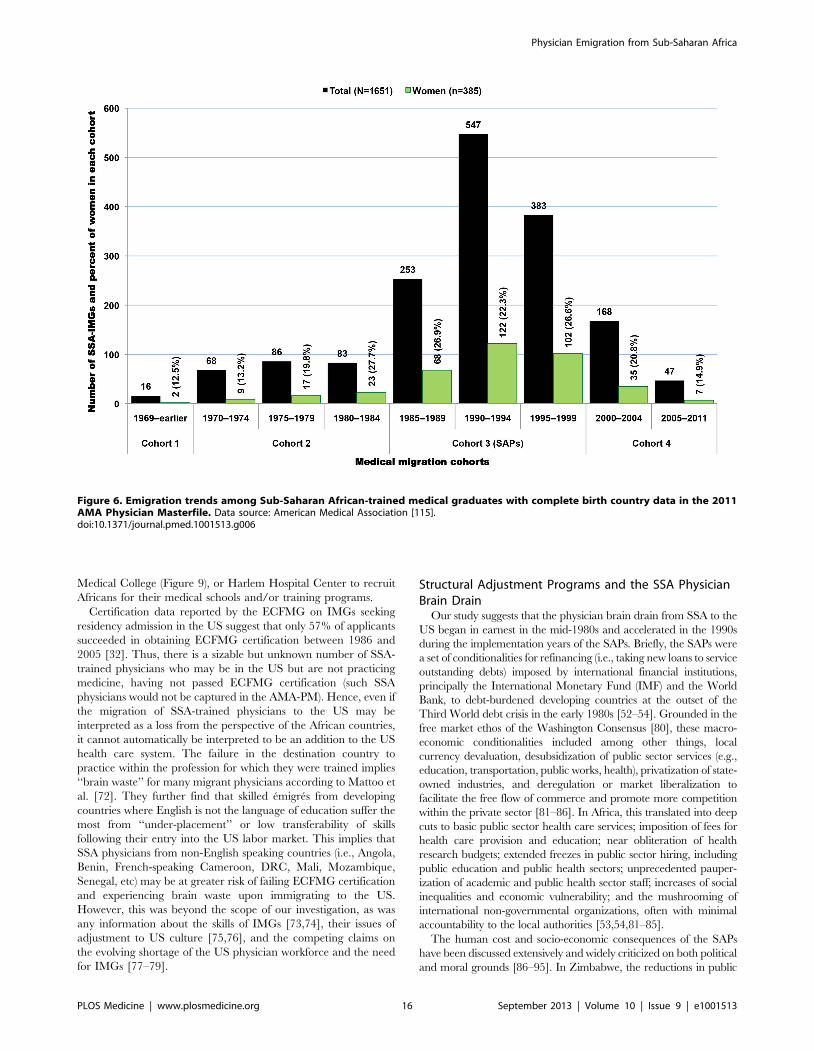
Medical College (Figure 9), or Harlem Hospital Center to recruit
Africans for their medical schools and/or training programs.
Certification data reported by the ECFMG on IMGs seeking
residency admission in the US suggest that only 57% of applicants
succeeded in obtaining ECFMG certification between 1986 and
2005 [32]. Thus, there is a sizable but unknown number of SSA-
trained physicians who may be in the US but are not practicing
medicine, having not passed ECFMG certification (such SSA
physicians would not be captured in the AMA-PM). Hence, even if
the migration of SSA-trained physicians to the US may be
interpreted as a loss from the perspective of the African countries,
it cannot automatically be interpreted to be an addition to the US
health care system. The failure in the destination country to
practice within the profession for which they were trained implies
‘‘brain waste’’ for many migrant physicians according to Mattoo et
al. [72]. They further find that skilled emigres from developing
countries where English is not the language of education suffer the
most from ‘‘under-placement’’ or low transferability of skills
following their entry into the US labor market. This implies that
SSA physicians from non-English speaking countries (i.e., Angola,
Benin, French-speaking Cameroon, DRC, Mali, Mozambique,
Senegal, etc) may be at greater risk of failing ECFMG certification
and experiencing brain waste upon immigrating to the US.
However, this was beyond the scope of our investigation, as was
any information about the skills of IMGs [73,74], their issues of
adjustment to US culture [75,76], and the competing claims on
the evolving shortage of the US physician workforce and the need
for IMGs [77–79].
Structural Adjustment Programs and the SSA PhysicianBrain Drain
Our study suggests that the physician brain drain from SSA to the
US began in earnest in the mid-1980s and accelerated in the 1990s
during the implementation years of the SAPs. Briefly, the SAPs were
a set of conditionalities for refinancing (i.e., taking new loans to service
outstanding debts) imposed by international financial institutions,
principally the International Monetary Fund (IMF) and the World
Bank, to debt-burdened developing countries at the outset of the
Third World debt crisis in the early 1980s [52–54]. Grounded in the
free market ethos of the Washington Consensus [80], these macro-
economic conditionalities included among other things, local
currency devaluation, desubsidization of public sector services (e.g.,
education, transportation, public works, health), privatization of state-
owned industries, and deregulation or market liberalization to
facilitate the free flow of commerce and promote more competition
within the private sector [81–86]. In Africa, this translated into deep
cuts to basic public sector health care services; imposition of fees for
health care provision and education; near obliteration of health
research budgets; extended freezes in public sector hiring, including
public education and public health sectors; unprecedented pauper-
ization of academic and public health sector staff; increases of social
inequalities and economic vulnerability; and the mushrooming of
international non-governmental organizations, often with minimal
accountability to the local authorities [53,54,81–85].
The human cost and socio-economic consequences of the SAPs
have been discussed extensively and widely criticized on both political
and moral grounds [86–95]. In Zimbabwe, the reductions in public
Figure 6. Emigration trends among Sub-Saharan African-trained medical graduates with complete birth country data in the 2011AMA Physician Masterfile. Data source: American Medical Association [115].doi:10.1371/journal.pmed.1001513.g006
Physician Emigration from Sub-Saharan Africa
PLOS Medicine | www.plosmedicine.org 16 September 2013 | Volume 10 | Issue 9 | e1001513

spending on health care in the 1990s triggered high health worker
attrition and expatriation, resulting in a 30% drop in the quality of
health care provision when compared to the achievements from the
post-independence period [92]. In the seminal Adjustment with a Human
Face, the UNICEF office in Ghana reported that Ghana ‘‘lost more
than 50 per cent of its physicians between 1981 and April 1984, and
about 8.5 per cent of nurses in 1982 alone’’ [94].
In sum, most SAPs failed because of poverty and the inability of
patients to pay, with a consequent deterioration of the public
sector health system due to poor financing and loss of personnel.
While the implementation of the SAPs may have ended officially
in the late 1999 with the adoption by international financial
institutions of a new Poverty Reduction Strategy Paper approach
[95], their effects, of which large-scale skilled migration is one,
have been pervasive.
Shortened Service and Heightened Emigration Trendsamong Recent Graduates
While migrant physicians who graduated in the 1980s and the
1990s may have left their native SSA countries in response to the
low salaries and poor working conditions exacerbated by
dysfunctional SAPs, emigration trends observed among SSA
physicians who graduated in the new millennium reflect different
dynamics. We found that earlier emigres arrived in the US 8 y
after graduation, on average, compared to 2.4 y for the later
emigres. The sharp decline in the number of years served prior to
emigration reflects the increasingly fast pace of medical migration
among newly graduated SSA-IMGs and foretells the challenges of
stemming the medical brain drain in an era of increased
globalization.
Using 1985–1994 University of Ghana graduation records,
Dovlo and Nyonator [96] estimated that on average 50% of their
medical graduates emigrated within 4.5 y and 75% within 9.5 y.
In a 2009 study of the financial consequences of African medical
migration, Clemens [97] surveyed a sample of 1,159 migrant
physicians from Africa located in Canada and the US, and
estimated that, on average, African-trained physicians immigrated
to North America 7.2 y after receiving their medical degrees.
However, the author conflated arrival data of North African IMGs
with those of SSA-IMGs, thus making it difficult to determine
Figure 7. Trends in primary specialty among Sub-Saharan African-trained medical graduates with complete birth country data inthe 2011 AMA Physician Masterfile. Data source: American Medical Association [115].doi:10.1371/journal.pmed.1001513.g007
Physician Emigration from Sub-Saharan Africa
PLOS Medicine | www.plosmedicine.org 17 September 2013 | Volume 10 | Issue 9 | e1001513
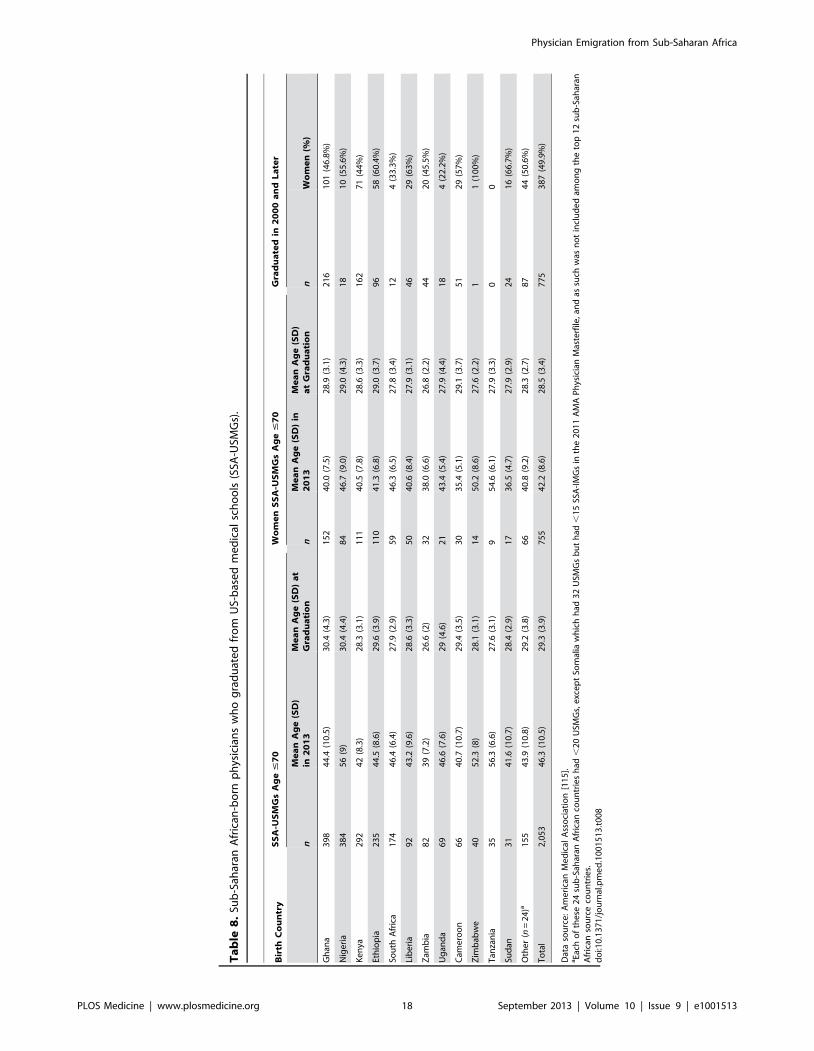
Ta
ble
8.
Sub
-Sah
aran
Afr
ican
-bo
rnp
hys
icia
ns
wh
og
rad
uat
ed
fro
mU
S-b
ase
dm
ed
ical
sch
oo
ls(S
SA-U
SMG
s).
Bir
thC
ou
ntr
yS
SA
-US
MG
sA
ge
#7
0W
om
en
SS
A-U
SM
Gs
Ag
e#
70
Gra
du
ate
din
20
00
an
dL
ate
r
nM
ea
nA
ge
(SD
)in
20
13
Me
an
Ag
e(S
D)
at
Gra
du
ati
on
nM
ea
nA
ge
(SD
)in
20
13
Me
an
Ag
e(S
D)
at
Gra
du
ati
on
nW
om
en
(%)
Gh
ana
39
84
4.4
(10
.5)
30
.4(4
.3)
15
24
0.0
(7.5
)2
8.9
(3.1
)2
16
10
1(4
6.8
%)
Nig
eri
a3
84
56
(9)
30
.4(4
.4)
84
46
.7(9
.0)
29
.0(4
.3)
18
10
(55
.6%
)
Ke
nya
29
24
2(8
.3)
28
.3(3
.1)
11
14
0.5
(7.8
)2
8.6
(3.3
)1
62
71
(44
%)
Eth
iop
ia2
35
44
.5(8
.6)
29
.6(3
.9)
11
04
1.3
(6.8
)2
9.0
(3.7
)9
65
8(6
0.4
%)
Sou
thA
fric
a1
74
46
.4(6
.4)
27
.9(2
.9)
59
46
.3(6
.5)
27
.8(3
.4)
12
4(3
3.3
%)
Lib
eri
a9
24
3.2
(9.6
)2
8.6
(3.3
)5
04
0.6
(8.4
)2
7.9
(3.1
)4
62
9(6
3%
)
Zam
bia
82
39
(7.2
)2
6.6
(2)
32
38
.0(6
.6)
26
.8(2
.2)
44
20
(45
.5%
)
Ug
and
a6
94
6.6
(7.6
)2
9(4
.6)
21
43
.4(5
.4)
27
.9(4
.4)
18
4(2
2.2
%)
Cam
ero
on
66
40
.7(1
0.7
)2
9.4
(3.5
)3
03
5.4
(5.1
)2
9.1
(3.7
)5
12
9(5
7%
)
Zim
bab
we
40
52
.3(8
)2
8.1
(3.1
)1
45
0.2
(8.6
)2
7.6
(2.2
)1
1(1
00
%)
Tan
zan
ia3
55
6.3
(6.6
)2
7.6
(3.1
)9
54
.6(6
.1)
27
.9(3
.3)
00
Sud
an3
14
1.6
(10
.7)
28
.4(2
.9)
17
36
.5(4
.7)
27
.9(2
.9)
24
16
(66
.7%
)
Oth
er
(n=
24
)a1
55
43
.9(1
0.8
)2
9.2
(3.8
)6
64
0.8
(9.2
)2
8.3
(2.7
)8
74
4(5
0.6
%)
To
tal
2,0
53
46
.3(1
0.5
)2
9.3
(3.9
)7
55
42
.2(8
.6)
28
.5(3
.4)
77
53
87
(49
.9%
)
Dat
aso
urc
e:
Am
eri
can
Me
dic
alA
sso
ciat
ion
[11
5].
aEa
cho
fth
ese
24
sub
-Sah
aran
Afr
ican
cou
ntr
ies
had
,2
0U
SMG
s,e
xce
pt
Som
alia
wh
ich
had
32
USM
Gs
bu
th
ad,
15
SSA
-IM
Gs
inth
e2
01
1A
MA
Ph
ysic
ian
Mas
terf
ile,
and
assu
chw
asn
ot
incl
ud
ed
amo
ng
the
top
12
sub
-Sah
aran
Afr
ican
sou
rce
cou
ntr
ies.
do
i:10
.13
71
/jo
urn
al.p
me
d.1
00
15
13
.t0
08
Physician Emigration from Sub-Saharan Africa
PLOS Medicine | www.plosmedicine.org 18 September 2013 | Volume 10 | Issue 9 | e1001513

SSA-IMGs’ mean year of service prior to emigration. Neverthe-
less, Clemens’ and Dovlo’s studies further underscore the
importance of the length of service by physicians in their home
countries before emigration.
Our estimations suggest that, on average, SSA-IMGs graduate
from medical school at age 25 and immigrate to the US at age
31.5, suggesting a potential length of service of 6.5 y prior to
emigration. However, if current trends from West Africa and East
Africa are sustained, it is expected that migrant physicians’ mean
year of graduation and mean year of emigration will continue to
converge, portending an even grimmer health worker crisis in SSA
in the near future. In fact, this trend of shortened service and
heightened immigration is likely to be extended to other technical
experts (e.g., engineers and scientists) if the arguments in the US
for visa liberalization for highly educated persons are translated
into law as fervently advocated in a new book [98] and in a recent
testimony in front of the US House Committee Judiciary [99].
These arguments are epitomized by the US-centric views of a
columnist for The New York Times: ‘‘Right now we have thousands
of foreign students in America and one million engineers, scientists
and other highly skilled workers here on H-1B temporary visas,
which require them to return home when the visas expire. That’s
nuts’’ [100].
The view that the US should expand immigration to address its
shortages of highly trained professionals and innovators is
already codified in the current ease with which foreign physicians
can secure visas and permanent residency if they pass
ECFMG examinations and agree to provide care in a US
physician-shortage area. Such initiatives as the General Agree-
ment on Trade in Services (GATS), a global treaty within the
World Trade Organization, have viewed the service sector much
as the General Agreement on Tariffs and Trade (GATT) views
merchandise trade, breaking down visa barriers (as with tariffs on
goods) to smooth globalization and cross-border economic
integration [101–103]. With continued globalization, we expect
increased SSA physician emigration unless we can improve SSA
physician numbers and job satisfaction substantially in their home
countries. Such programs as the PEPFAR and NIH-supported
Medical Education Partnership Initiative (MEPI) [14], and the
smaller Consortium of New Southern African Medical Schools
[104], are designed to do both and should be sustained and
expanded.
However, in allocating funds to support medical education in
SSA, close attention should be paid not only to medical schools with
the institutional capability to manage scarce resources efficiently,
but also with the commitment to serve the local community. To that
end, it is critical to identify SSA-based medical schools that may
have an institutional incentive to promote the emigration of their
graduates. Hagopian et al. [105] observed a ‘‘culture’’ of medical
migration in several Nigerian and Ghanaian university campuses.
In these institutions, which included the University of Ibadan, a
major recipient of MEPI funds and the top SSA doctor-exporting
institution to the US (see Figure 3), medical faculty members did not
only fail to discourage migration, they actively encouraged it, using
their personal stories of emigration and return to exemplify the
potential benefits of medical migration.
Figure 8. Graduation trends among Sub-Saharan African-born graduates of medical schools located in the United States. Datasource: American Medical Association [115]. As reflected by the exponential equation and the determination coefficient (R2) of the smoothed linedisplayed on the chart, the distribution of the data approaches an exponential curve, reflecting a rapid numerical increase of sub-Saharan Africannatives graduating from medical school in the US.doi:10.1371/journal.pmed.1001513.g008
Physician Emigration from Sub-Saharan Africa
PLOS Medicine | www.plosmedicine.org 19 September 2013 | Volume 10 | Issue 9 | e1001513

Figure 9. American medical schools with the highest number of Sub-Saharan African-born graduates practicing in the UnitedStates. *Note: No information was provided as to which campus of the University of Illinois these sub-Saharan African-born medical graduatesattended. Data source: American Medical Association [115].doi:10.1371/journal.pmed.1001513.g009
Figure 10. Foreign medical schools located outside Sub-Saharan Africa with the highest number of Sub-Saharan African-bornmedical graduates practicing in the United States. Data source: American Medical Association [115].doi:10.1371/journal.pmed.1001513.g010
Physician Emigration from Sub-Saharan Africa
PLOS Medicine | www.plosmedicine.org 20 September 2013 | Volume 10 | Issue 9 | e1001513

Ta
ble
9.
Sub
-Sah
aran
Afr
ican
-bo
rnin
tern
atio
nal
me
dic
alg
rad
uat
es
wh
og
rad
uat
ed
fro
msc
ho
ols
ou
tsid
eSu
b-S
ahar
anA
fric
a.
Bir
thC
ou
ntr
yIM
Gs
Ag
e#
70
Gra
du
ate
din
20
00
an
dL
ate
r
nP
erc
en
tM
ea
nA
ge
(SD
)in
20
13
Me
an
Ag
e(S
D)
at
Gra
du
ati
on
Me
an
Ag
e(S
D)
at
Re
sid
en
cyC
om
ple
tio
nn
Me
an
Ag
e(S
D)
at
Gra
du
ati
on
Wo
me
n(%
)
Ke
nya
36
53
0.6
%5
7.7
(10
.1)
25
.7(3
)3
6.2
(9.2
)3
72
9.3
(6.0
)1
9(5
1.4
%)
Nig
eri
a1
27
10
.6%
56
.5(7
)2
8.5
(4.2
03
8.4
(8.6
)0
0
Ug
and
a1
13
9.5
%5
7.9
(10
.1)
25
.8(2
.4)
37
.1(1
0.1
)8
27
.1(1
.7)
7(8
7.5
%)
Gh
ana
10
79
%4
8.8
(11
.1)
29
.7(3
.7)
38
.5(7
.6)
37
30
.6(4
.5)
19
(51
.4%
)
Tan
zan
ia8
26
.9%
61
.7(7
.7)
25
.6(2
.3)
37
.7(1
0.9
)0
0
Eth
iop
ia7
96
.6%
52
.9(8
.5)
28
(4.5
)3
8.6
(7.1
)1
43
3.4
(6.1
)5
(35
.7%
)
Cam
ero
on
70
5.9
%4
2(8
.5)
30
.4(4
.7)
37
.5(5
.2)
52
30
.7(4
.6)
30
(57
.7%
)
Zam
bia
58
4.9
%4
5.6
(12
.8)
26
.2(3
)3
6.2
(9.6
)2
62
7.2
(3.5
)1
0(3
8.5
%)
Sou
thA
fric
a3
83
.2%
52
.7(8
.5)
26
.8(3
)3
7.4
(7.8
)1
27
0
Sud
an3
12
.6%
51
.5(1
1.1
)2
6.6
(4.6
)3
9.3
(7.5
)6
31
.5(8
)1
(16
.7%
)
Lib
eri
a2
21
.8%
49
.6(1
2.5
)2
7.6
(3.4
)3
9.6
(10
.2)
72
6.1
(2.8
)3
(42
.9%
)
Oth
er
(n=
17
)a1
02
8.5
%4
9.4
(13
.3)
28
.2(4
.3)
36
.7(6
.7)
36
30
.9(5
.2)
15
(41
.7%
)
To
tal
1,1
94
10
0%
53
.1(1
1.1
)2
7.1
(3.9
)3
7.3
(8.7
)2
24
30
(5.2
)1
09
(48
.7%
)
Dat
aso
urc
e:
Am
eri
can
Me
dic
alA
sso
ciat
ion
[11
5].
aEa
cho
fth
ese
17
sub
-Sah
aran
Afr
ican
cou
ntr
ies
had
#1
5IM
Gs
trai
ne
do
uts
ide
sub
-Sah
aran
Afr
ica
inth
e2
01
1A
MA
Ph
ysic
ian
Mas
terf
ile.
do
i:10
.13
71
/jo
urn
al.p
me
d.1
00
15
13
.t0
09
Physician Emigration from Sub-Saharan Africa
PLOS Medicine | www.plosmedicine.org 21 September 2013 | Volume 10 | Issue 9 | e1001513

Given the implacability of human migration, and the fine line
between immigration restrictions and potential violations of health
workers’ freedom of movement, ‘‘circular migration’’ has been
recommended by the Institute of Medicine’s Committee on the
US Commitment to Global Health [106], and reiterated by the
recent WHO Global Code of Practice on the International
Recruitment of Health Personnel [3] as a means to facilitate the
temporary return of emigre physicians to their homelands without
losing re-entry privileges in the medical workforce of their host
countries. A similar concept advocating the extended deployment
of emigre medical staff to their home countries as well as specialists
from the host countries via ‘‘health exchange programs’’ funded
by the foreign entities benefiting from emigre physicians’ services
has been suggested [107]. However, the high institutional cost
associated with such health exchange programs may be a major
disincentive. This is equally the case for the Global Health Service
Partnership, launched in 2013 as a diplomacy-influenced deploy-
ment of US health care professionals in Malawi, Tanzania, and
Uganda [108,109].
Effect of September 11, 2001 on the US Immigration ofSSA-IMGs
Our study provides some evidence of the resiliency of medical
migration against restrictive US immigration policies in the
aftermath of September 11, 2001. Among SSA countries with
large stocks of migrant physicians in the US, only the number of
South African physicians has decreased in the last decade, and
there is no evidence that this decrease is associated with post-9/11
immigration restrictions. For several African countries such as
Ghana, Ethiopia, Nigeria, and Sudan, physician emigration rate
and migrant physician stocks in the US have increased signifi-
cantly in the last decade. Indeed, the steep drop of medical
graduation observed among SSA natives attending medical
schools in the US during the first half of 2000–2010 is offset by
a swift increase in medical graduations during the second half, and
both trends appear consistent with post 9/11 enrollment decreases
and increases reported among foreign students attending US
universities [110–113].
Strengths, Limitations, and ImplicationsOur study helps expand and update previous studies on this
important and controversial issue [16,19–22]. Our study sought
to filter possible ‘‘outliers,’’ that is, potential retirees or inactive
physicians, unlike these earlier studies. Our study further
complements recent findings from Tankwanchi [34] who
reports a critical physician age when migration is most likely
among SSA-IMGs. If the number of SSA-IMGs immigrating to
the US peaks between ages 28–31, that is, 3–6 y after SSA
medical school graduation, and wanes at age 38, at which time
.90% of SSA-IMGs have already settled in the US, then
policies aimed at incentivizing SSA physicians to stay in their
home countries should put a particular focus on early-career
physicians age #38 y [34].
Our study has limitations. First, the .10,000 SSA born or
trained physicians whom we identified in the 2011 AMA-PM do
not represent the entire universe of SSA physicians who migrated
to the US. It is reasonable to believe that a significant number of
SSA physicians are present in the US, but they are employed in
other occupations aside from medicine because of not qualifying
for a US residency position. Thus, our emigration data are
minimum estimates of the true magnitude of the physician ‘‘brain
drain’’ from SSA to the US; if future research can include these
‘‘wasted brains’’ [72] in the calculation of the physician brain
drain, the true burden on SSA can be better assessed. Second, we
cannot fully account for physicians who are born in SSA but were
trained outside Africa since only a fraction of this group actually
Figure 11. Graduation and residency trends among Sub-Saharan African-born international medical graduates educated outsideSub-Saharan Africa. Data source: American Medical Association [115].doi:10.1371/journal.pmed.1001513.g011
Physician Emigration from Sub-Saharan Africa
PLOS Medicine | www.plosmedicine.org 22 September 2013 | Volume 10 | Issue 9 | e1001513
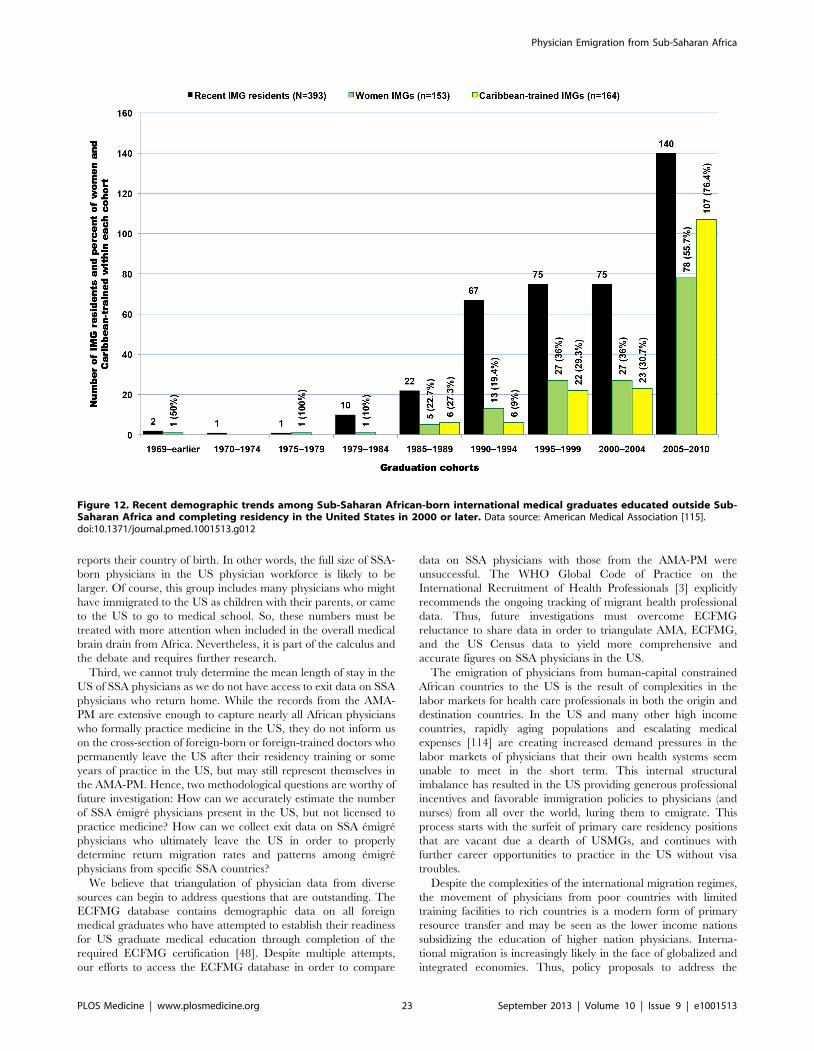
reports their country of birth. In other words, the full size of SSA-
born physicians in the US physician workforce is likely to be
larger. Of course, this group includes many physicians who might
have immigrated to the US as children with their parents, or came
to the US to go to medical school. So, these numbers must be
treated with more attention when included in the overall medical
brain drain from Africa. Nevertheless, it is part of the calculus and
the debate and requires further research.
Third, we cannot truly determine the mean length of stay in the
US of SSA physicians as we do not have access to exit data on SSA
physicians who return home. While the records from the AMA-
PM are extensive enough to capture nearly all African physicians
who formally practice medicine in the US, they do not inform us
on the cross-section of foreign-born or foreign-trained doctors who
permanently leave the US after their residency training or some
years of practice in the US, but may still represent themselves in
the AMA-PM. Hence, two methodological questions are worthy of
future investigation: How can we accurately estimate the number
of SSA emigre physicians present in the US, but not licensed to
practice medicine? How can we collect exit data on SSA emigre
physicians who ultimately leave the US in order to properly
determine return migration rates and patterns among emigre
physicians from specific SSA countries?
We believe that triangulation of physician data from diverse
sources can begin to address questions that are outstanding. The
ECFMG database contains demographic data on all foreign
medical graduates who have attempted to establish their readiness
for US graduate medical education through completion of the
required ECFMG certification [48]. Despite multiple attempts,
our efforts to access the ECFMG database in order to compare
data on SSA physicians with those from the AMA-PM were
unsuccessful. The WHO Global Code of Practice on the
International Recruitment of Health Professionals [3] explicitly
recommends the ongoing tracking of migrant health professional
data. Thus, future investigations must overcome ECFMG
reluctance to share data in order to triangulate AMA, ECFMG,
and the US Census data to yield more comprehensive and
accurate figures on SSA physicians in the US.
The emigration of physicians from human-capital constrained
African countries to the US is the result of complexities in the
labor markets for health care professionals in both the origin and
destination countries. In the US and many other high income
countries, rapidly aging populations and escalating medical
expenses [114] are creating increased demand pressures in the
labor markets of physicians that their own health systems seem
unable to meet in the short term. This internal structural
imbalance has resulted in the US providing generous professional
incentives and favorable immigration policies to physicians (and
nurses) from all over the world, luring them to emigrate. This
process starts with the surfeit of primary care residency positions
that are vacant due a dearth of USMGs, and continues with
further career opportunities to practice in the US without visa
troubles.
Despite the complexities of the international migration regimes,
the movement of physicians from poor countries with limited
training facilities to rich countries is a modern form of primary
resource transfer and may be seen as the lower income nations
subsidizing the education of higher nation physicians. Interna-
tional migration is increasingly likely in the face of globalized and
integrated economies. Thus, policy proposals to address the
Figure 12. Recent demographic trends among Sub-Saharan African-born international medical graduates educated outside Sub-Saharan Africa and completing residency in the United States in 2000 or later. Data source: American Medical Association [115].doi:10.1371/journal.pmed.1001513.g012
Physician Emigration from Sub-Saharan Africa
PLOS Medicine | www.plosmedicine.org 23 September 2013 | Volume 10 | Issue 9 | e1001513
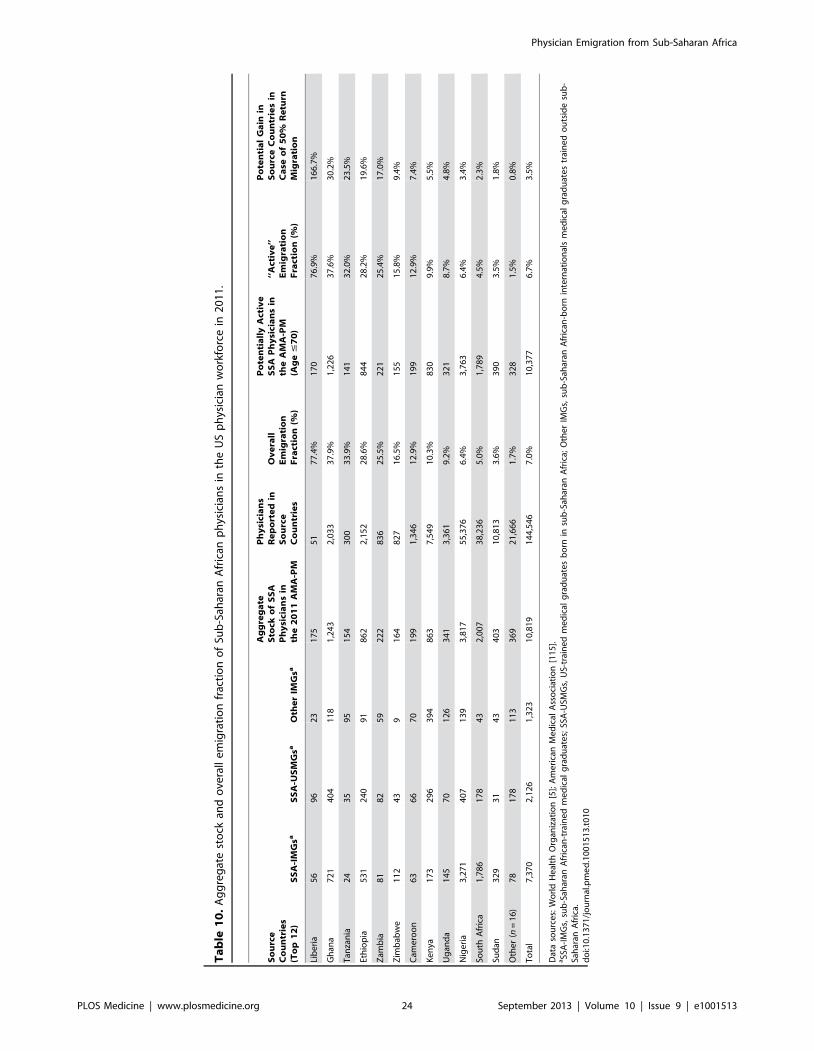
Ta
ble
10
.A
gg
reg
ate
sto
ckan
do
vera
lle
mig
rati
on
frac
tio
no
fSu
b-S
ahar
anA
fric
anp
hys
icia
ns
inth
eU
Sp
hys
icia
nw
ork
forc
ein
20
11
.
So
urc
eC
ou
ntr
ies
(To
p1
2)
SS
A-I
MG
saS
SA
-US
MG
saO
the
rIM
Gsa
Ag
gre
ga
teS
tock
of
SS
AP
hy
sici
an
sin
the
20
11
AM
A-P
M
Ph
ysi
cia
ns
Re
po
rte
din
So
urc
eC
ou
ntr
ies
Ov
era
llE
mig
rati
on
Fra
ctio
n(%
)
Po
ten
tia
lly
Act
ive
SS
AP
hy
sici
an
sin
the
AM
A-P
M(A
ge
#7
0)
‘‘A
ctiv
e’’
Em
igra
tio
nF
ract
ion
(%)
Po
ten
tia
lG
ain
inS
ou
rce
Co
un
trie
sin
Ca
seo
f5
0%
Re
turn
Mig
rati
on
Lib
eri
a5
69
62
31
75
51
77
.4%
17
07
6.9
%1
66
.7%
Gh
ana
72
14
04
11
81
,24
32
,03
33
7.9
%1
,22
63
7.6
%3
0.2
%
Tan
zan
ia2
43
59
51
54
30
03
3.9
%1
41
32
.0%
23
.5%
Eth
iop
ia5
31
24
09
18
62
2,1
52
28
.6%
84
42
8.2
%1
9.6
%
Zam
bia
81
82
59
22
28
36
25
.5%
22
12
5.4
%1
7.0
%
Zim
bab
we
11
24
39
16
48
27
16
.5%
15
51
5.8
%9
.4%
Cam
ero
on
63
66
70
19
91
,34
61
2.9
%1
99
12
.9%
7.4
%
Ke
nya
17
32
96
39
48
63
7,5
49
10
.3%
83
09
.9%
5.5
%
Ug
and
a1
45
70
12
63
41
3,3
61
9.2
%3
21
8.7
%4
.8%
Nig
eri
a3
,27
14
07
13
93
,81
75
5,3
76
6.4
%3
,76
36
.4%
3.4
%
Sou
thA
fric
a1
,78
61
78
43
2,0
07
38
,23
65
.0%
1,7
89
4.5
%2
.3%
Sud
an3
29
31
43
40
31
0,8
13
3.6
%3
90
3.5
%1
.8%
Oth
er
(n=
16
)7
81
78
11
33
69
21
,66
61
.7%
32
81
.5%
0.8
%
To
tal
7,3
70
2,1
26
1,3
23
10
,81
91
44
,54
67
.0%
10
,37
76
.7%
3.5
%
Dat
aso
urc
es:
Wo
rld
He
alth
Org
aniz
atio
n[5
];A
me
rica
nM
ed
ical
Ass
oci
atio
n[1
15
].aSS
A-I
MG
s,su
b-S
ahar
anA
fric
an-t
rain
ed
me
dic
alg
rad
uat
es;
SSA
-USM
Gs,
US-
trai
ne
dm
ed
ical
gra
du
ate
sb
orn
insu
b-S
ahar
anA
fric
a;O
the
rIM
Gs,
sub
-Sah
aran
Afr
ican
-bo
rnin
tern
atio
nal
sm
ed
ical
gra
du
ate
str
ain
ed
ou
tsid
esu
b-
Sah
aran
Afr
ica.
do
i:10
.13
71
/jo
urn
al.p
me
d.1
00
15
13
.t0
10
Physician Emigration from Sub-Saharan Africa
PLOS Medicine | www.plosmedicine.org 24 September 2013 | Volume 10 | Issue 9 | e1001513

inequities of global physician distribution will depend not only on
credible data to influence the US and other doctor-importing
high-income OECD countries to train larger number of physicians
to meet their own workforce needs, but also on a social justice
agenda and global health initiatives that promote the creation of
opportunity structures necessary to enhance career development,
improve workplace conditions, and encourage the recruitment,
training, and retention of resources, talents, and skills in SSA and
other LMIC source countries.
Supporting Information
Alternative Language Abstract S1 Abstract Translatedinto French by ABST.(DOC)
Alternative Language Abstract S2 Abstract Translatedinto Arabic by Sherif O. Elhassan.(DOC)
Alternative Language Abstract S3 Abstract Translatedinto Portuguese by Olivia C. Manders.(DOC)
Alternative Language Abstract S4 Abstract Translatedinto Spanish by Elizabeth C. Prom-Wormley.(DOC)
Figure S1 Age correlation between Sub-Saharan Afri-can-trained medical graduates with missing and com-plete birth country data.(XLS)
Figure S2 Graduation age correlation between Sub-Saharan African-trained medical graduates with miss-ing and complete birth country data.(XLS)
Figure S3 Emigration age correlation between Sub-Saharan African-trained medical graduates with miss-ing and complete birth country data.(XLS)
Figure S4 Primary specialty correlation between Sub-Saharan African-trained medical graduates with miss-ing and complete birth country data.(XLS)
Figure S5 Linear relationship between the number ofSub-Saharan African-trained medical graduates and thenumber of Sub-Saharan African-born US medical grad-uates.(XLS)
Figure S6 Linear relationship between the number ofSub-Saharan African-trained medical graduates and thenumber of Sub-Saharan African-born internationalmedical graduates educated outside Sub-SaharanAfrica.(XLS)
Figure S7 Linear relationship between the number ofSub-Saharan African-born US medical graduates and thenumber of Sub-Saharan African-born internationalmedical graduates educated outside Sub-SaharanAfrica.
(XLS)
Figure S8 Linear relationship between the primaryspecialty choices of Sub-Saharan African-trained medi-cal graduates and Sub-Saharan African-born US medicalgraduates.
(XLS)
Figure S9 Linear relationship between the primaryspecialty choices of Sub-Saharan African-trained inter-national medical graduates and Sub-Saharan African-born international medical graduates educated outsideSub-Saharan Africa.
(XLS)
Figure S10 Linear relationship between the primaryspecialty choices of Sub-Saharan African-born US med-ical graduates and Sub-Saharan African-born interna-tional medical graduates educated outside Sub-SaharanAfrica.
(XLS)
Table S1 Group statistics for comparing Sub-SaharanAfrican-trained medical graduates with missing andcomplete birth country data.
(DOC)
Table S2 Independent samples test comparing Sub-Saharan African-trained medical graduates with miss-ing and complete birth country data.
(DOC)
Table S3 Countries of birth and countries of educationof Sub-Saharan-trained medical graduates with com-plete birth country data in the 2011 AMA PhysicianMasterfile.
(DOC)
Acknowledgments
We thank Helena Dagadu, Olivia Drake, and Megan Pask for editing
earlier versions of the figures. We are equally grateful to Sherif O.
Elhassan, Olivia C. Manders, and Elizabeth C. Prom-Wormley for
translating the abstract into Arabic, Portuguese, and Spanish respectively,
and to Jean-Marc Soboth for proofreading the French translation of the
abstract.
Author Contributions
Conceived and designed the study: ABST. Analyzed the data: ABST.
Wrote the first draft of the manuscript: ABST. Contributed to the writing
of the manuscript: ABST CO SHV. ICMJE criteria for authorship read
and met: ABST CO SHV. Agree with manuscript results and conclusions:
ABST CO SHV.
References
1. World Health Organization (2003) The world health report 2003: shaping the
future. Available: http://www.who.int/whr/2003/en/whr03_en.pdf. Accessed
14 February 2013.
2. World Health Organization (2006) Working together for health: the world
health report 2006. Available: http://whqlibdoc.who.int/publications/2006/
9241563176_eng.pdf. Accessed 14 February 2013.
3. World Health Organization (2010) The WHO global code of practice on the
international recruitment of health personnel. Available: http://www.who.int/
hrh/migration/code/code_en.pdf. Accessed 15 February 2013.
4. Lee J-W (2006). Message from the Director-General. World Health
Organization, editor. Working together for health: the world health report
2006. Geneva: World Health Organization. p. xiii.
5. World Health Organization (2013) Global health workforce statistics.
Available: http://www.who.int/hrh/statistics/hwfstats/en/ Accessed 30 July
2013.
6. World Health Organization (1976) Health personnel and hospital establish-
ments: Volume III. World Health Stat Annual 1973–1976. Geneva: World
Health Organization.
Physician Emigration from Sub-Saharan Africa
PLOS Medicine | www.plosmedicine.org 25 September 2013 | Volume 10 | Issue 9 | e1001513

7. Mullan F, Frehywot S, Chen C, Greysen R, Wassermann T, et al (n.d.) The
Sub-Saharan African medical school study: data, observation, and opportunity.
Available: http://samss.org/samss.upload/documents/126.pdf. Accessed 14
February 2013.
8. Foundation for Advancement of International Medical Education and Research
– Region: ‘Africa.’ Available: https://imed.faimer.org/results.asp?country =
&school = &currpage = 1&cname = &city = ®ion = AF&rname = Africa&psize =
25. Accessed 17 February 2013.
9. University of Copenhagen and World Health Organization – AVICENNA
Directories of medical schools. Available: http://avicenna.ku.dk/database/
medicine. Accessed 14 May 2013.
10. Redi-Med Data – Redi-med data interactive medical database system:
American Medical Association and American Osteopathic Association Counts.
Available: http://www.redimeddata.com/RediCounts.asp. Accessed 14 June
2013.
11. United States Census Bureau – International Data Base. Available: http://
www.census.gov/population/international/data/idb/informationGateway.
php. Accessed 19 February 2013.
12. Barclay A (2002) The political economy of brain drain at institutions of higher
learning in conflict countries: Case of the University of Liberia. Afr Issues 30:
42–46.
13. The Economist online (2011) Africa’s impressive growth. Available: http://
www.economist.com/blogs/dailychart/2011/01/daily_chart. Accessed 23
April 2013.
14. Mullan F, Frehywot S, Omaswa F, Sewankambo N, Talib Z, et al. (2012) The
Medical Education Partnership Initiative: PEPFAR’s effort to boost health
worker education to strengthen health systems. Health Aff (Millwood) 31:1561–
72.
15. Mullan F, Frehywot S, Omaswa F, Buch E, Chen C, et al. (2011) Medical
schools in Sub-Saharan Africa. Lancet 377: 1113–1121.
16. Clemens MA, Pettersson G (2008) New data on African health professionals
abroad. Hum Resour Health 6: 1. Available: http://www.human-resources-
health.com/content/6/1/1. Accessed 14 February 2013.
17. Clemens MA (2007) Do visas kill? Health effects of African health professional
emigration (Working paper No 114). Washington (D.C.): Center for Global
Development. Available: http://www.cgdev.org/files/13123_file_Clemens_
Do_visas_kill_3_.pdf. Accessed 14 February 2013.
18. Clemens MA (2011) The financial consequences of high-skill emigration:
lessons from African doctors abroad. Plaza S, Ratha D, editors. Diaspora for
development in Africa. Washington: The World Bank. pp. 165–182.
19. Hagopian A, Thompson M, Fordyce M, Karin E, Johnson KE, et al. (2004)
The migration of physicians from sub-Saharan Africa to the United States of
America: measures of the African brain drain. Hum Resour Health 2: 17.
Available: http://www.human-resources-health.com/content/2/1/17. Ac-
cessed 14 February 2013.
20. Mullan F (2005) The metrics of the physician brain drain. N Engl J Med 353:
1810–1818.
21. Docquier F, Barghava A (2007) A new panel dataset on physicians’ emigration
rates (1991–2004). Available: http://perso.uclouvain.be/frederic.docquier/
filePDF/MBD1_Description.pdf. Accessed 14 February 2013.
22. Dumont JC, Zurn P (2007) Immigrant health workers in OECD countries in
the broader context of highly skilled migration. Int Migr Outlook. doi:10.1787/
migr_outlook-2007-5-en
23. Alkire S, Chen L (2005) Medical exceptionalism in international migration:
should doctors and nurses be treated differently? Tamas K, Palme J, editors.
Globalizing migration regimes: new challenges to transnational cooperation.
Burlington: Ashgate Publishing Company. pp. 100–117.
24. Castles S, Miller JM (2009) The age of migration: international population
movements in the modern world. New York & London: Guilford Press.
25. Buchan J, Sochalski J (2004) The migration of nurses: trends and policies. Bull
World Health Organ 82(8): 587–594.
26. Dovlo D (2005) Taking more than a fair share? The migration of health
professionals from poor to rich countries. PLoS Med 2: e109. doi:10.1371/
journal.pmed.0020109.
27. Bundred PE, Levitt C (2000) Medical migration: who are the real losers?
Lancet 356: 245–246.
28. Eastwood JB, Conroy RE, Naicker S, West PA, Tutt RC, et al. (2005) Loss of
health professionals from sub-Saharan Africa: the pivotal role of the UK.
Lancet 365: 1893–1900.
29. Murray CL, Vos T, Lozano R, Naghavi M, Flaxman AD, et al. (2012)
Disability-adjusted life years (DALYs) for 291 diseases and injuries in 21
regions, 1990–2010: a systematic analysis for the Global Burden of Disease
Study 2010. Lancet 380: 2197–2223.
30. Omoleke SA (2013) Chronic non-communicable disease as a new epidemic in
Africa: focus on the Gambia. Pan Afr Med J. doi:10.11604/
pamj.2013.14.87.1899. Available: http://www.panafrican-med-journal.com/
content/14/87/full/. Accessed 1 May 2013.
31. Holmes MD, Dalal S, Volmink J, Adebamowo CA, Njelekela M, et al. (2010)
Non-communicable diseases in Sub-Saharan Africa: the case for cohort studies.
PLoS Med 7: e1000244. doi:10.1371/journal.pmed.1000244.
32. Educational Commission on Foreign Medical Graduates - About ECFMG
certification. Available: http://www.ecfmg.org/certification/index.html. Ac-
cessed 14 February 2013.
33. Ratha D, Mohapatra S, Ozden C, Plaza S, Shaw W, et al. (2011) Leveraging
migration Africa: remittances, skills, and investments. Washington (D.C.: The
World Bank. 212 p.
34. Tankwanchi SBA (2012) Doctors beyond borders: data trends and medical
migration dynamics from Sub-Saharan Africa to the United States (doctoral
dissertation). Nashville: Vanderbilt University.
35. Mills AJ, Kanters S, Hagopian A, Bansbak N, Nachega J, et al. (2011) The
financial cost of doctors emigrating from Sub-Saharan Africa: human capital
analysis. BMJ 343:d7031.
36. American Medical Association - How the data elements of the AMA physician
Masterfile are collected, maintained, and verified. Available: http://www.ama-
assn.org/ama1/pub/upload/mm/eProfiles/mm/primarysource.pdf. Accessed
14 February 2013.
37. McLafferty S (2012) Spatial error in geocoding physician location data from the
AMA Physician Masterfile: implications for spatial accessibility analysis. Spat
Spatiotemporal Epidemiol 3:3–38.
38. Williams PT (1996) Quality of the family physician component of AMA
Masterfile. J Am Board Fam Pract 9:94–99.
39. American Medical Association – More about AMA database licensing.
Available: http://www.ama-assn.org/ama/pub/about-ama/physician-data-
resources/ama-database-licensing/more-about-ama-database-licensing.page?
Accessed 17 February 2013.
40. Foundation for Advancement of International Medical Education and Research
– Kigezi International School of Medicine. Available: https://imed.faimer.org/
details.asp?country = 905&school = &currpage = 1&cname = UGANDA&city =
®ion = &rname = &mcode = 905020&psize = 25. Accessed 14 February
2013.
41. Department of Higher Education, State of Maine – Non accredited colleges &
universities list: ST – SY. Available: http://www.maine.gov/education/
highered/Non-Accredited/st-sy.htm. Accessed 1 May 2013.
42. Senegalaisement.com - Noms et prenoms Senegalais. Available: http://www.
senegalaisement.com/senegal/noms_et_prenoms.html. Accessed 4 June 2013.
43. Chapman M (2005) Some medical degrees are ‘worthless’. BBC News
November 5. Available: http://news.bbc.co.uk/2/hi/uk_news/4410020.stm.
Accessed 5 June 2013.
44. Curtis P (2005 November 7) GMC launches inquiries into private medical
schools. The Guardian. Available: http://www.guardian.co.uk/education/
2005/nov/07/highereducation.uk2. Accessed 5 June 2013.
45. St. Luke School of Medicine – SLSOM is open for learning. Available: http://
www.stluke.edu/#Open. Accessed 1 May 2013.
46. West J (2005) NTLA orders ‘bogus’ St. Luke University closed. Liberian
Observer. Available: http://quackfiles.blogspot.com/2005/05/ntla-orders-
bogus-st-luke-university.html. Accessed 1 May 2013.
47. allAfrica (2010) Liberia: bribes deal backfires on fake medical school. Available:
http://allafrica.com/stories/201003240965.html. Accessed 14 February 2013.
48. Boulet RJ, Norcini JJ, Whelan PG, Hallock AJ, Seeling SS (2006) The
international medical graduate pipeline: recent trends in certification and
residency training. Health Aff (Millwood) 25: 469–477. doi:10.1377/
hlthaff.25.2.469.
49. O’Brien RH (1958) The dawn of medical education in tropical Africa. J Med
Educ 33: 553–563.
50. O’Brien RH (1962) Medical education in tropical Africa progresses. J Negro
Educ 33: 536–541.
51. Lewinshon DE, Arnold PC (2010) Motives for migration of South African
doctors to Australia since 1948. Med J Aust 192: 288–290.
52. Adepoju A (2004) Trends in international migration in and from Africa.
Massey DS, Taylor JE editors. International migration: prospects and policies
in a global market. New York: Oxford University Press. pp. 59–76.
53. Cheru F (1992) Structural adjustment, primary resource trade, and sustainable
development in sub-Saharan Africa. World Dev 20: 497–512.
54. Loewenson R (1993) Structural adjustment and health policy in Africa.
Int J Health Serv 23: 717–730.
55. National Center for Health Statistics (2012) Health, United States, 2011: with
special feature on socioeconomic status and health. Available: http://www.cdc.
gov/nchs/data/hus/hus11.pdf. Accessed 14 February 2013.
56. Elliott J (2012) India considers allowing expatriate doctors to practise back
home. BMJ 344:e3235. doi: 10.1136/bmj.e3235.
57. Scheffler MR, Liu X J, Kinfu Y, Dal Poz RM, (2008) Forecasting the global
shortage of physicians: an economic-and needs-based approach. Bull World
Health Organ 86: 516–523.
58. Joint United Nations Programme on HIV/AIDS (UNAIDS) Global report:
UNAIDS report on the global AIDS epidemic 2012. Available: http://www.
unaids.org/en/media/unaids/contentassets/documents/epidemiology/2012/
gr2012/20121120_UNAIDS_Global_Report_2012_en.pdf. Accessed 14 Feb-
ruary 2013.
59. Association of American Medical Colleges (2010) Diversity in the physician
workforce: facts & figures 2010. Available: https://members.aamc.org/eweb/
upload/Diversity%20in%20the%20Physician%20Workforce%20Facts%
20and%20Figures%202010.pdf. Accessed 14 February 2013.
60. Howard DL, Bunch CD, Mundia WO, Konrad TR, Edwards LJ, et al. (2006).
Comparing United States versus international medical school graduate
physicians who serve African- American and White elderly. Health Serv Res
41: 2155–2181.
Physician Emigration from Sub-Saharan Africa
PLOS Medicine | www.plosmedicine.org 26 September 2013 | Volume 10 | Issue 9 | e1001513

61. Mick SS, Lee SY (1999) Are there need-based geographical differences between
international medical graduates and U.S. medical graduates in rural U.S.counties? J Rural Health, 15: 26–43.
62. Mick SS, Lee SY, Wodchis WP (2000) Variations in geographical distribution
of foreign and domestically trained physicians in the United States: ‘safety nets’or ‘surplus exacerbation’? Soc Sci Med 50: 185–202.
63. Thompson MJ, Hagopian A, Fordyce M, Hart LG (2009) Do internationalmedical graduates (IMGs) ‘‘fill the gap’’ in rural primary care in the United
States? A national study. J Rural Health 25: 124–134.
64. Brotherton SE, Stoddard JJ, Tang SS (2000) Minority and nonminoritypediatricians’ care of minority and poor children. Arch Pediatr Adolesc Med
154: 912–7.65. Cantor JC, Miles EL, Baker LC, Barker DC (1996) Physician service to the
underserved: Implications for affirmative action in medical education. Inquiry33: 167–80.
66. Grumbach K, Hart LG, Mertz E, Coffman J, Palazzo L (2003) Who is caring
for the underserved? A comparison of primary care physicians andnonphysician clinicians in California and Washington. Ann Fam Med 1: 97–
104.67. Komaromy M, Grumbach K, Drake M, Vranizan K, Lurie N, et al. (1996)
The role of Black and Hispanic physicians in providing health care for
underserved populations. N Engl J Med 334: 1305–1310.68. Moy E, Bartman BA (1995) Physician race and care of minority and medically
indigent patients. JAMA 273: 1515–1520.69. Saha S, Komaromy M, Koepsell TD, Bindman AB (1999) Patient-physician
racial concordance and the perceived quality and use of health care. ArchIntern Med 159: 997–1004.
70. Xu G, Fields SK, Laine C, Veloski JJ, Barzansky B, et al. (1997) The
relationship between the race/ethnicity of generalist physicians and their carefor underserved populations. Am J Pub Health 87: 817–822.
71. Walker KO, Moreno G, Grumbach K (2012) The association among specialty,race, ethnicity, and practice location among California physicians in diverse
specialties. J Natl Med Assoc 104: 46–52.
72. Mattoo A, Neagu CI, Ozden C (2008) Brain waste? Educated immigrants inthe US labor market. J Econ Dev 87: 255–269.
73. Norcini JJ, Boulet JR, Dauphinee WD, Opalek A, Krantz ID, and AndersonST (2010) Evaluating the quality of care provided by graduates of international
medical schools. Health Aff (Millwood) 29: 1461–1468.74. Blonski J, Rahm S (2003) The relationship of residency performance to match
status and US versus international graduate status. Fam Med 35: 100–104.
75. Meghani SH, Rajput V (2011) Perspective: the need for practice socialization ofinternational medical graduates–an exemplar from pain medicine. Acad Med
86: 571–574.76. Morris AL, Phillips RL, Fryer GE, Green LA, Mullan F (2006) International
medical graduates in family medicine in the United States of America: an
exploration of professional characteristics and attitudes. Hum Res Health 4: 17.Available: http://www.human-resources-health.com/content/4/1/17. Ac-
cessed 14 February 2013.77. Goodman DC, Grumbach K (2008) Does having more physicians lead to
better health system performance? JAMA 299: 335–337.78. Cooper RA (2004) Weighing the evidence for expanding physician supply. Ann
Intern Med 141: 705–714.
79. Salsberg E, Rockey PH, River KL, Brotherton SE, Jackson RG (2008) USresidency training before and after the 1997 Balanced Budget Act. JAMA 300:
1174–1180.80. Williamson J (1993) Democracy and the Washington consensus. World Dev 21:
1329–1336.
81. Pfeiffer J, Chapman R (2010) Anthropological perspectives on structuraladjustment and public health. Annu Rev Anthropol 39: 149–165.
82. Moyo D (2009) Dead aid: why aid is not working and why there is a better wayfor Africa. New York: Farrar, Straus, & Giroux. 188 p.
83. Maclean SJ, Quadir F, Shaw TM (1997) Structural adjustment and the
response of civil society in Bangladesh and Zimbabwe: A comparative Analysis.N Polit Econ 2: 149–164.
84. Moghadam V (2007) Gender and the global economy. Roberts JT, Hite AB,editors. The globalization and development reader: perspectives on develop-
ment and global change. Malden: Blackwell Publishing. pp. 135––151.85. Brand H (1994) The World Bank, the Monetary Fund, and poverty. Int J Health
Serv 24: 567–578.
86. Lewis S (2006). Race against time. Toronto: Anansi. 216 p.87. Kolko G (1999) Ravaging the poor: The International Monetary Fund indicted
by its own data. Int J Health Serv 29: 51–57.88. Logie DE, Woodroffe J (1993) Structural adjustment: the wrong prescription
for Africa? BMJ 307: 41. Available: http://www.bmj.com/content/307/6895/
41. Accessed 14 February 2013.89. Lugalla JL (1995) The impact of structural adjustment policies on women’s and
children’s health in Tanzania. Rev Afr Polit Econ 22: 43–53.
90. Mullan F (2007) Health, equity, and political economy: A conversation with
Paul Farmer. Health Aff (Millwood) 26: 1062–1068.
91. Cheru F (2002) Debt, adjustment and the politics of effective response to HIV/
AIDS in Africa. Third World Q 23: 299–312.
92. The Structural Adjustment Participatory Review International Network (2004)
Structural adjustment: The SAPRI report. The policy roots of economic crisis,
poverty and inequality. London & New York: Zed Books. 242 p.
93. Cornia AG, Jolly R, Stewart F (1987) Adjustment with a human face:
protecting the vulnerable and promoting growth. Oxford: Clarendon Press.
344 p.
94. Cornia AG, Jolly R, Stewart F (1987) Adjustment with a human face: country
case studies. Oxford: Clarendon Press. 328 p.
95. International Monetary Fund, International Development Association (2002)
Review of the poverty reduction strategy paper (PRSP) approach: early
experience with interim PRSPs and full PRSPs. Washington (D.C.): IMF/
World Bank. 102 p.
96. Dovlo D, Nyonator F (2001) Migration by graduates of the University of
Ghana medical school: A preliminary rapid appraisal. Available: http://www.
who.int/hrh/en/HRDJ_3_1_03.pdf. Accessed 14 February 2013. Accessed 16
February 2013.
97. Clemens MA (2009) The financial consequences of high-skill emigration: New
data on African doctors abroad. Available: http://siteresources.worldbank.
org/INTPROSPECTS/Resources/334934-1110315015165/Clemens.pdf.
Accessed 14 February 2013.
98. Wadhwa V (2012) The Immigrant exodus: why America is losing the global
race to capture entrepreneurial talent. Philadelphia: Wharton Digital Press. 101
p.
99. C-Span Video Library – Immigration Policy, February 5, 2013: Witnesses
testify on immigration reform proposals on what needs to be included in a
comprehensive immigration bill. Available: http://www.c-spanvideo.org/
event/214127. Accessed 18 February 2013.
100. Friedman TL (2010) Start-ups, not bailouts. The New York Times. Available:
http://www.nytimes.com/2010/04/04/opinion/04friedman.html. Accessed 4
February 4 2013.
101. Adlung R, Carzaniga A (2001) Health services under the General Agreement
on Trade in Services. Bull World Health Organ 79(4): 352–364.
102. Aginam O (2007) ‘‘Predatory globalization?’’: the World Trade Organization,
General Agreement on Trade in Services, and migration of African health
professionals to the West. Falola T, Afolabi N, editors. The human cost of
African migration. New York: Routledge. pp. 65–77.
103. Schaffer RE, Waitzkin H, Brenner J, Jasso-Aguilar R (2005) Global trade and
public health. Am J Public Health 95: 23–34.
104. Eichbaum Q, Nyarango P, Bowa K, Odonkor P, Ferrao J, et al. (2012) ‘‘Global
networks, alliances and consortia’’ in global health education-the case for
south-to-south partnerships. J Acquir Immune Defic Syndr 61: 263–4.
105. Hagopian A, Ofosu A, Fatusi A, Biritwum R, Essel A, et al. (2005) The flight of
physicians from West Africa: views of African physicians and implications for
policy. Soc Sci Med 61: 1750–1760.
106. Committee on the US Commitment to Global Health, Board on Global Health
(2009) The US commitment to global health: recommendations for the public
and private sectors. Washington (D.C.): The National Academies Press. 298 p.
107. Mackey TK, Liang BA (2012) Rebalancing brain drain: Exploring resource
reallocation to address health worker migration and promote global health.
Health Policy 107: 66–73.
108. SEED Global Health – The joint program. Available: http://seedglobalhealth.
org/joint-program/. Accessed 19 May 2013.
109. Kerry VB, Auld S, Farmer P (2010) An international service corps for health—
an unconventional prescription for diplomacy. N Engl J Med 363:1199–1201.
110. Goodall H (2008) More foreign science and engineering grad students flock to
U.S., new survey finds. Chron High Educ Available: http://chronicle.com/
article/More-Foreign-Science-and/449/. Accessed 14 February 2013.
111. Jacobson J (2003) Foreign-student enrollment stagnates. Chron High Educ
Available: http://chronicle.com/article/Foreign-Student-Enrollment/19236/.
Accessed 14 February 2013.
112. McCormack E (2005) Enrollment of foreign students fall for a 2nd year. Chron
High Educ: A1–A45. Available: http://chronicle.com/article/Enrollment-of-
Foreign-Students/30801/. Accessed 14 February 2013.
113. McMurtrie B (2008) Foreign students pour back into the U.S. Chron High
Educ 55: A1–A25. Available: http://chronicle.com/article/Foreign-Students-
Pour-Back/15377/. Accessed 14 February 2013.
114. Brill S (2013 March 4) Bitter pill: why medical bills are killing us. Time
Magazine. Available: http://www.time.com/time/magazine/article/
0,9171,2136864,00.html. Accessed 7 June 2013.
115. American Medical Association (2011) AMA Physician Masterfile. Chicago:
American Medical Association.
Physician Emigration from Sub-Saharan Africa
PLOS Medicine | www.plosmedicine.org 27 September 2013 | Volume 10 | Issue 9 | e1001513

Editors’ Summary
Background. Population growth and aging and increas-ingly complex health care interventions, as well as existingpolicies and market forces, mean that many countries arefacing a shortage of health care professionals. High-incomecountries are addressing this problem in part by encouragingthe immigration of foreign health care professionals fromlow- and middle-income countries. In the US, for example,international medical graduates (IMGs) can secure visas andpermanent residency by passing examinations provided bythe Educational Commission of Foreign Medical Graduatesand by agreeing to provide care in areas that areunderserved by US physicians. Inevitably, the emigration ofphysicians from low- and middle-income countries under-mines health service delivery in the emigrating physicians’country of origin because physician supply is alreadyinadequate in those countries. Physician emigration fromsub-Saharan Africa, which has only 2% of the globalphysician workforce but a quarter of the global burden ofdisease, is particularly worrying. Since 1970, as a result oflarge-scale emigration and limited medical education, therehas been negligible or negative growth in the density ofphysicians in many countries in sub-Saharan Africa. In Liberia,for example, in 1973, there were 7.76 physicians per 100,000people but by 2008 there were only 1.37 physicians per100,000 people; in the US, there are 250 physicians per100,000 people.
Why Was This Study Done? Before policy proposals canbe formulated to address global inequities in physiciandistribution, a clear picture of the patterns of physicianemigration from resource-limited countries is needed. In thisstudy, the researchers use data from the 2011 AmericanMedical Association Physician Masterfile (AMA-PM) to inves-tigate the ‘‘brain drain’’ of physicians from sub-Saharan Africato the US. The AMA-PM collects annual demographic,academic, and professional data on all residents (physiciansundergoing training in a medical specialty) and licensedphysicians who practice in the US.
What Did the Researchers Do and Find? The researchersused data from the World Health Organization (WHO) GlobalHealth Workforce Statistics and graduation and residencydata from the 2011 AMA-PM to estimate physician emigra-tion rates from sub-Saharan African countries, year of USentry, years of service provided before emigration to the US,and length of time in the US. There were 10,819 physicianswho were born or trained in 28 sub-Saharan Africancountries in the 2011 AMA-PM. By using a published analysisof the 2002 AMA-PM, the researchers estimated that USimmigration among sub-Saharan African-trained physicianshad increased over the past decade for all the countriesexamined except South Africa, where physician emigrationhad decreased by 8%. Overall, the number of sub-SaharanAfrican IMGs in the US had increased by 38% since 2002.More than half of this increase was accounted for by NigerianIMGs. Liberia was the country most affected by migration ofits physicians to the US—77% of its estimated 226 physicianswere in the 2011 AMA-PM. On average, sub-Saharan AfricanIMGs had been in the US for 18 years and had practiced for6.5 years before emigration. Finally, nearly half of the sub-Saharan African IMGs had migrated to US between 1984 and1995, years during which structural adjustment programs,which resulted in deep cuts to public health care services,were implemented in developing countries by internationalfinancial institutions as conditions for refinancing.
What Do These Findings Mean? Although the sub-Saharan African IMGs in the 2011 AMA-PM only representabout 1% of all the physicians and less than 5% of the IMGsin the AMA-PM, these findings reveal a major loss ofphysicians from sub-Saharan Africa. They also suggest thatemigration of physicians from sub-Saharan Africa is agrowing problem and is likely to continue unless jobsatisfaction for physicians is improved in their country oforigin. Moreover, because the AMA-PM only lists physicianswho qualify for a US residency position, more physicians mayhave moved from sub-Saharan Africa to the US thanreported here and may be working in other jobs incom-mensurate with their medical degrees (‘‘brain waste’’). Theresearchers suggest that physician emigration from sub-Saharan Africa to the US reflects the complexities in the labormarkets for health care professionals in both Africa and theUS and can be seen as low- and middle-income nationssubsidizing the education of physicians in high-incomecountries. Policy proposals to address global inequities inphysician distribution will therefore need both to encouragethe recruitment, training, and retention of health careprofessionals in resource-limited countries and to persuadehigh-income countries to train more home-grown physiciansto meet the needs of their own populations.
Additional Information. Please access these websites viathe online version of this summary at http://dx.doi.org/10.1371/journal.pmed.1001513.
N The Foundation for Advancement of International MedicalEducation and Research is a non-profit foundationcommitted to improving world health through educationthat was established in 2000 by the EducationalCommission for Foreign Medical Graduates
N The Global Health Workforce Alliance is a partnership ofnational governments, civil society, international agencies,finance institutions, researchers, educators, and professionalassociations dedicated to identifying, implementing andadvocating for solutions to the chronic global shortage ofhealth care professionals (available in several languages)
N Information on the American Medical Association PhysicianMasterfile and the providers of physician data lists isavailable via the American Medical Association’s website
N The World Health Organization (WHO) annual World HealthStatistics reports present the most recent health statisticsfor the WHO Member States
N The Medical Education Partnership Initiative is a US-sponsoredinitiative that supports medical education and research in sub-Saharan African institutions, aiming to increase the quantity,quality, and retention of graduates with specific skillsaddressing the health needs of their national populations
N CapacityPlus is the USAID-funded global project uniquelyfocused on the health workforce needed to achieve theMillennium Development Goals
N Seed Global Health cultivates the next generation of healthprofessionals by allying medical and nursing volunteerswith their peers in resource-limited settings
N ‘‘America is Stealing the World’s Doctors’’, a 2012 New YorkTimes article by Matt McAllester, describes the personalexperience of a young doctor who emigrated from Zambiato the US
N ‘‘Path to United States Practice Is Long Slog to ForeignDoctors’’, a 2013 New York Times article by CatherineRampell, describes the hurdles that immigrant physiciansface in practicing in the US
Physician Emigration from Sub-Saharan Africa
PLOS Medicine | www.plosmedicine.org 28 September 2013 | Volume 10 | Issue 9 | e1001513