Physician Compensation Trends Paul Evans DO, FAAFP, FACOFP Dean and Professor of Family Medicine.
30
Physician Compensation Physician Compensation Trends Trends Paul Evans DO, FAAFP, FACOFP Paul Evans DO, FAAFP, FACOFP Dean and Professor of Family Medicine Dean and Professor of Family Medicine
-
Upload
avice-robinson -
Category
Documents
-
view
220 -
download
0
Transcript of Physician Compensation Trends Paul Evans DO, FAAFP, FACOFP Dean and Professor of Family Medicine.
Physician Compensation Physician Compensation TrendsTrends
Paul Evans DO, FAAFP, FACOFPPaul Evans DO, FAAFP, FACOFPDean and Professor of Family MedicineDean and Professor of Family Medicine
ObjectivesObjectives
• Review Compensation Trends 2002-2007Review Compensation Trends 2002-2007
o Primary Care Physician Primary Care Physician
o Specialty Care PhysiciansSpecialty Care Physicians
• Present Trends Impacting Physician PracticePresent Trends Impacting Physician Practiceo Physician ResponsesPhysician Responseso ““Hot” Specialties (now and long-term)Hot” Specialties (now and long-term)
• Discuss Physician Recruiters (friend or foe?)Discuss Physician Recruiters (friend or foe?)
ReferencesReferences
Compensation data and graphs Compensation data and graphs excerpted from 1.8.2009 SOMA excerpted from 1.8.2009 SOMA
GA-PCOM presentation by:GA-PCOM presentation by:
Douglas T. Cardinal, RN, FACHEDouglas T. Cardinal, RN, FACHEPresident, DT Cardinal ConsultingPresident, DT Cardinal Consulting
(770) 622-5799(770) [email protected]@dtcardinalconsulting.com
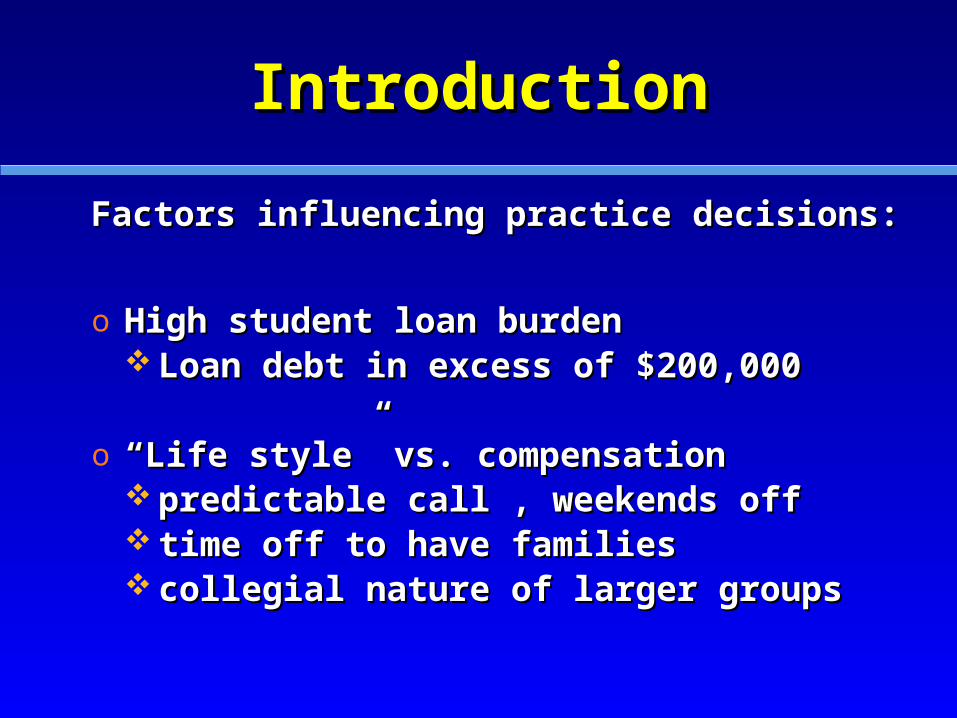
IntroductionIntroduction
Factors influencing practice decisions:Factors influencing practice decisions:
o High student loan burdenHigh student loan burden Loan debt in excess of $200,000Loan debt in excess of $200,000
o ““Life style” vs. compensationLife style” vs. compensation predictable call , weekends offpredictable call , weekends off time off to have familiestime off to have families collegial nature of larger groupscollegial nature of larger groups
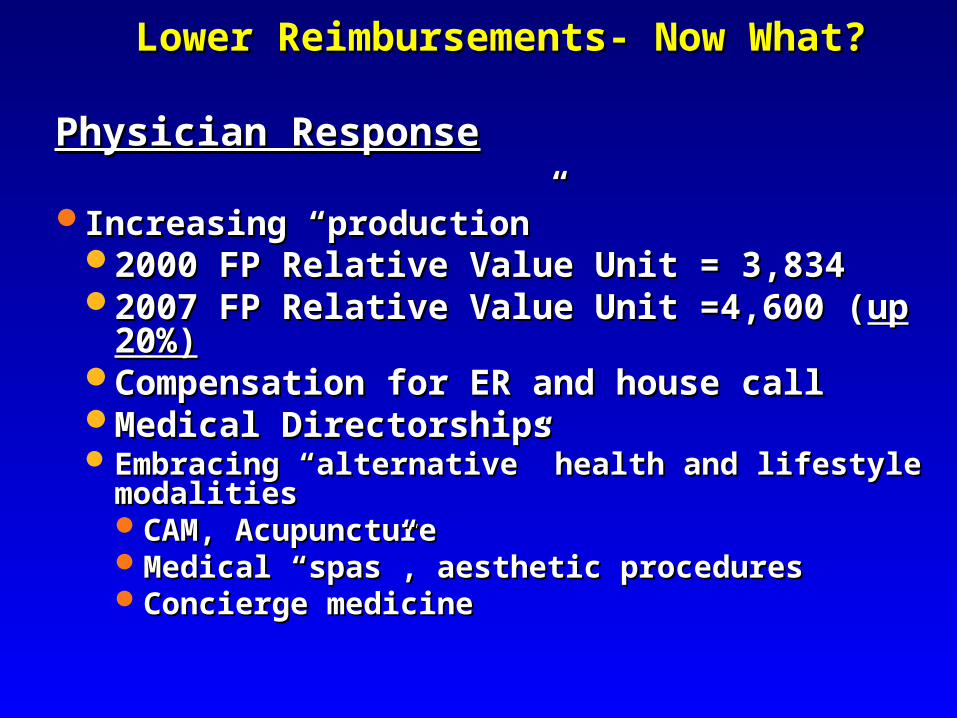
Lower Reimbursements- Now What?Lower Reimbursements- Now What?
Physician ResponsePhysician Response
Increasing “production”Increasing “production”2000 FP Relative Value Unit = 3,8342000 FP Relative Value Unit = 3,8342007 FP Relative Value Unit =4,600 (2007 FP Relative Value Unit =4,600 (up up
20%)20%)Compensation for ER and house callCompensation for ER and house callMedical DirectorshipsMedical DirectorshipsEmbracing “alternative” health and lifestyle Embracing “alternative” health and lifestyle
modalitiesmodalitiesCAM, AcupunctureCAM, AcupunctureMedical “spas”, aesthetic proceduresMedical “spas”, aesthetic proceduresConcierge medicineConcierge medicine
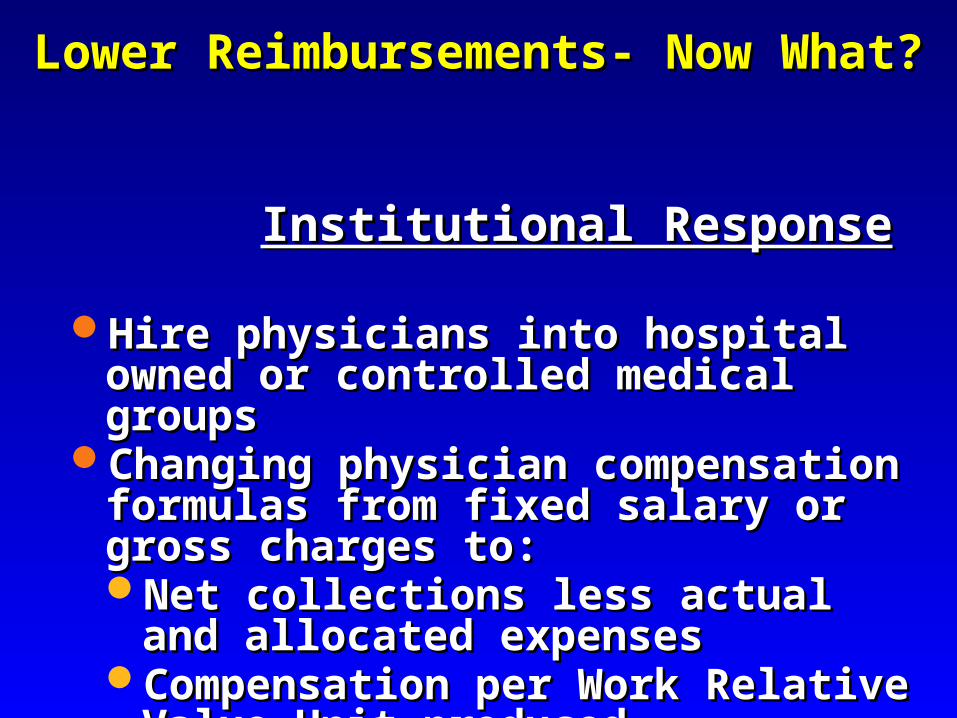
Lower Reimbursements- Now What?Lower Reimbursements- Now What?
Institutional ResponseInstitutional Response
Hire physicians into hospital Hire physicians into hospital owned or controlled medical owned or controlled medical groupsgroups
Changing physician Changing physician compensation formulas from compensation formulas from fixed salary or gross charges to:fixed salary or gross charges to:Net collections less actual and Net collections less actual and
allocated expensesallocated expensesCompensation per Work Compensation per Work
Relative Value Unit producedRelative Value Unit produced

Lower Reimbursements- Lower Reimbursements- Now What?Now What?
Government ResponseGovernment Response
AuditingAuditing physician-hospital compensation physician-hospital compensation relationships of all kinds – more denial paymentsrelationships of all kinds – more denial paymentsCMS OIGCMS OIG
Compensation must be “reasonable” and “fair Compensation must be “reasonable” and “fair market value”market value”
Physician Physician recruitment incentivesrecruitment incentivesPayments for relocation - actual move of Payments for relocation - actual move of
practicepracticePhysicians within the first two years of Physicians within the first two years of
practice exemptpractice exempt
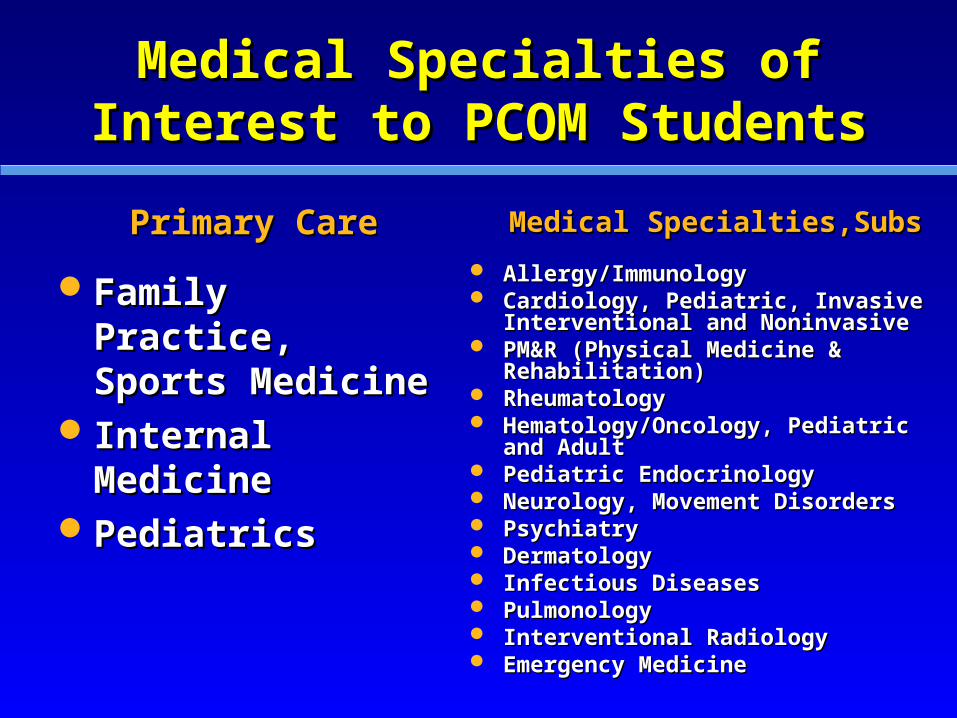
Medical Specialties of Medical Specialties of Interest to PCOM StudentsInterest to PCOM Students
Primary CarePrimary Care
Family Practice, Family Practice, Sports MedicineSports Medicine
Internal Internal MedicineMedicine
PediatricsPediatrics
Medical Specialties,SubsMedical Specialties,Subs
Allergy/ImmunologyAllergy/Immunology Cardiology, Pediatric, Invasive Cardiology, Pediatric, Invasive
Interventional and NoninvasiveInterventional and Noninvasive PM&R (Physical Medicine & PM&R (Physical Medicine &
Rehabilitation)Rehabilitation) RheumatologyRheumatology Hematology/Oncology, Pediatric Hematology/Oncology, Pediatric
and Adultand Adult Pediatric EndocrinologyPediatric Endocrinology Neurology, Movement DisordersNeurology, Movement Disorders PsychiatryPsychiatry DermatologyDermatology Infectious DiseasesInfectious Diseases PulmonologyPulmonology Interventional RadiologyInterventional Radiology Emergency MedicineEmergency Medicine
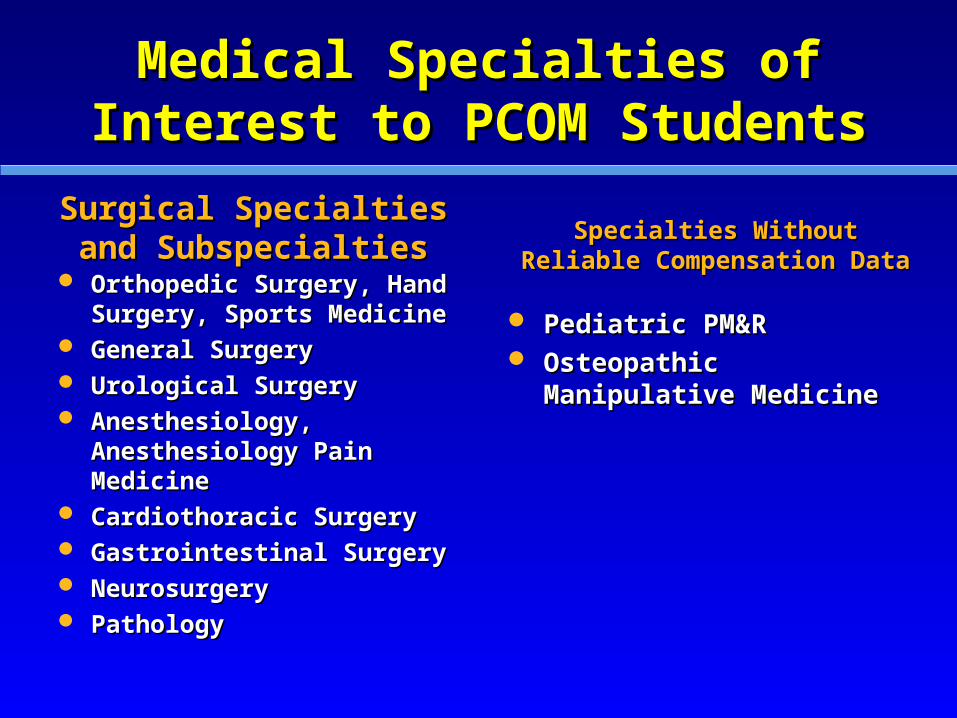
Medical Specialties of Medical Specialties of Interest to PCOM StudentsInterest to PCOM Students
Surgical Specialties Surgical Specialties and Subspecialtiesand Subspecialties
Orthopedic Surgery, Orthopedic Surgery, Hand Surgery, Sports Hand Surgery, Sports MedicineMedicine
General SurgeryGeneral Surgery Urological SurgeryUrological Surgery Anesthesiology, Anesthesiology,
Anesthesiology Pain Anesthesiology Pain MedicineMedicine
Cardiothoracic SurgeryCardiothoracic Surgery Gastrointestinal SurgeryGastrointestinal Surgery NeurosurgeryNeurosurgery PathologyPathology
Specialties Without Reliable Specialties Without Reliable Compensation DataCompensation Data
Pediatric PM&RPediatric PM&R Osteopathic Osteopathic
Manipulative MedicineManipulative Medicine
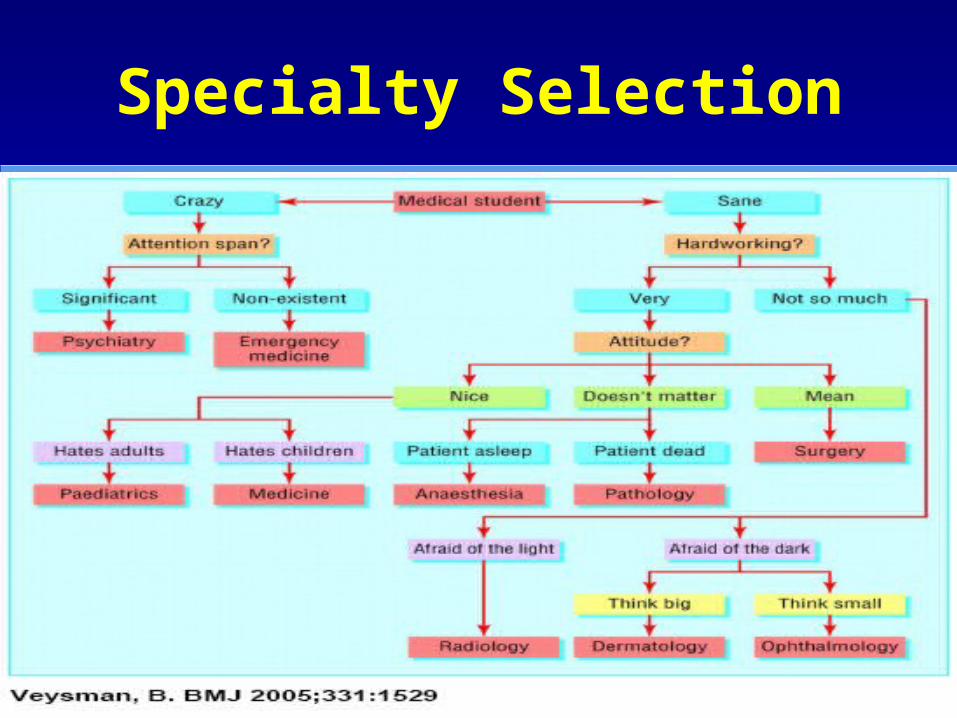
Specialty Selection
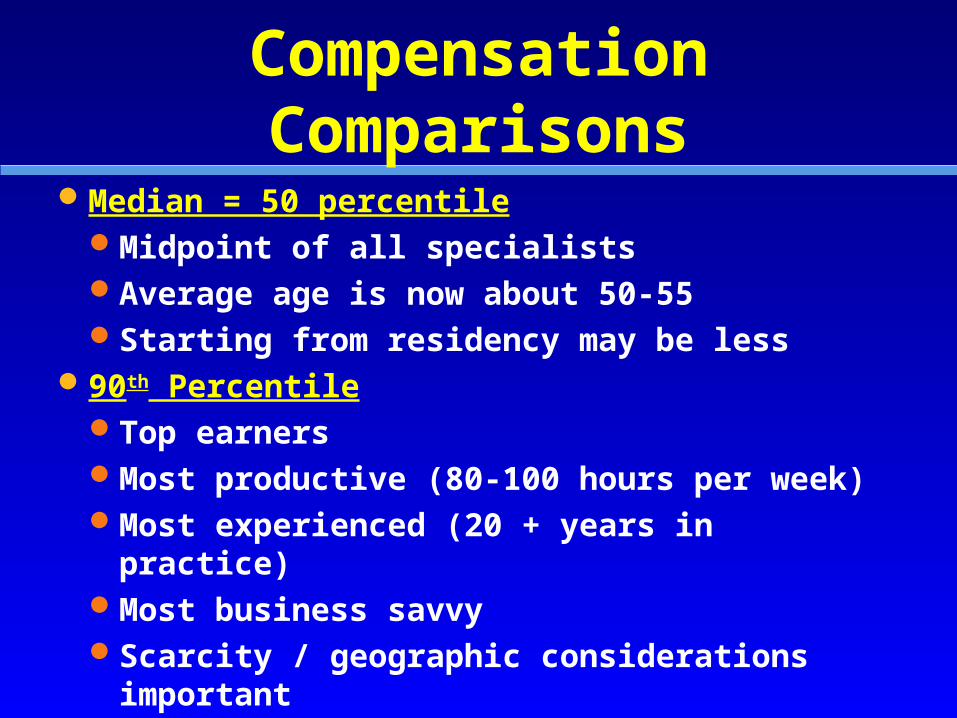
Compensation Comparisons
Median = 50 percentileMidpoint of all specialistsAverage age is now about 50-55 Starting from residency may be less
90th PercentileTop earnersMost productive (80-100 hours per week)Most experienced (20 + years in
practice)Most business savvyScarcity / geographic considerations
important

Primary Care TrendsPrimary Care Trends
Median Compensation 2003 through 2007Median Compensation 2003 through 2007
( 50( 50thth percentile)percentile)
2007 ($ 2007 ($ k)k)
% % changechange
Fam Med no Fam Med no OBOB
175175 +14.0+14.0
FM, SMFM, SM 201201 -2.4-2.4
IM generalIM general 191191 +15.4+15.4
PedsPeds 183183 +15.4+15.4
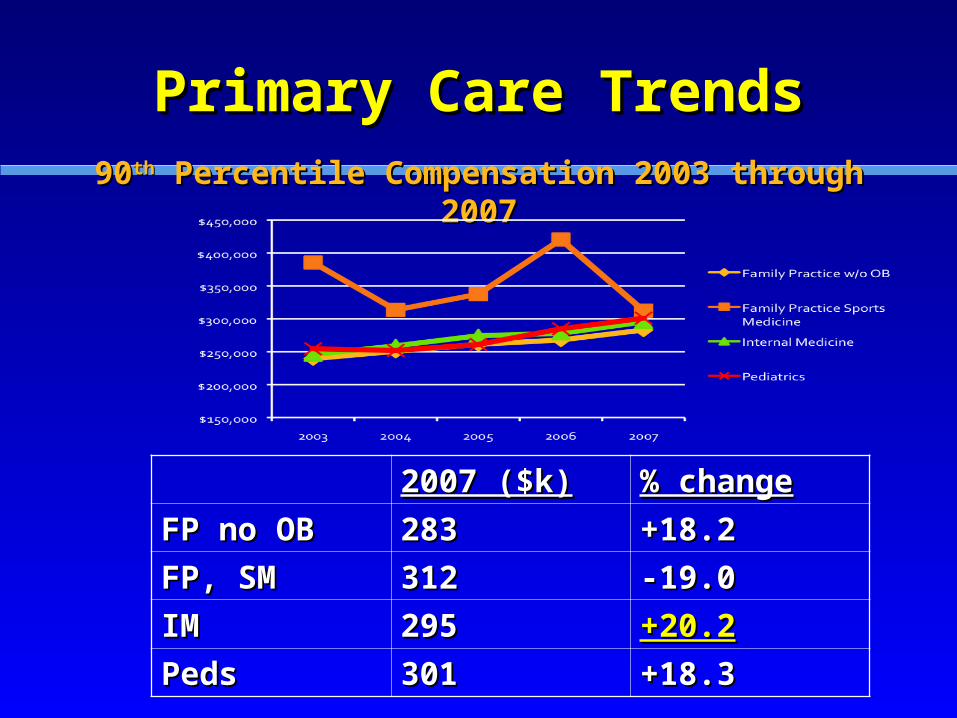
Primary Care TrendsPrimary Care Trends9090thth Percentile Compensation 2003 through Percentile Compensation 2003 through
20072007
2007 ($k)2007 ($k) % change% change
FP no OBFP no OB 283283 +18.2+18.2
FP, SMFP, SM 312312 -19.0-19.0
IMIM 295295 +20.2+20.2
PedsPeds 301301 +18.3+18.3
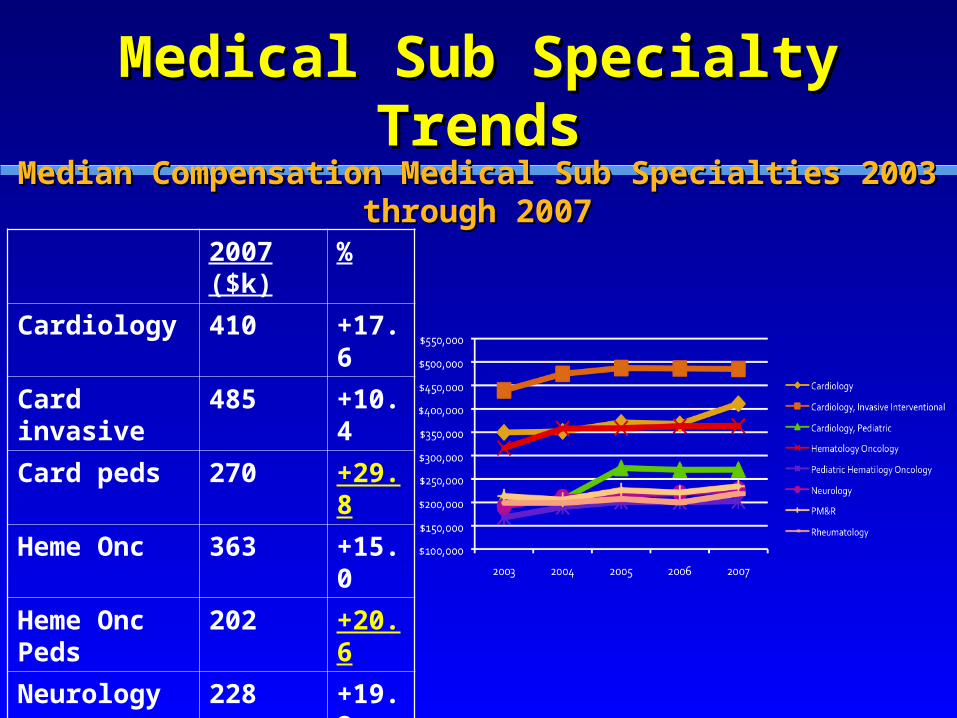
Medical Sub Specialty Medical Sub Specialty TrendsTrends
Median Compensation Medical Sub Specialties Median Compensation Medical Sub Specialties 2003 through 20072003 through 2007
2007 ($k)
%
Cardiology 410 +17.6
Card invasive
485 +10.4
Card peds 270 +29.8
Heme Onc 363 +15.0
Heme Onc Peds
202 +20.6
Neurology 228 +19.2
PMR 234 +9.8
Rheumatology
219 +9.9
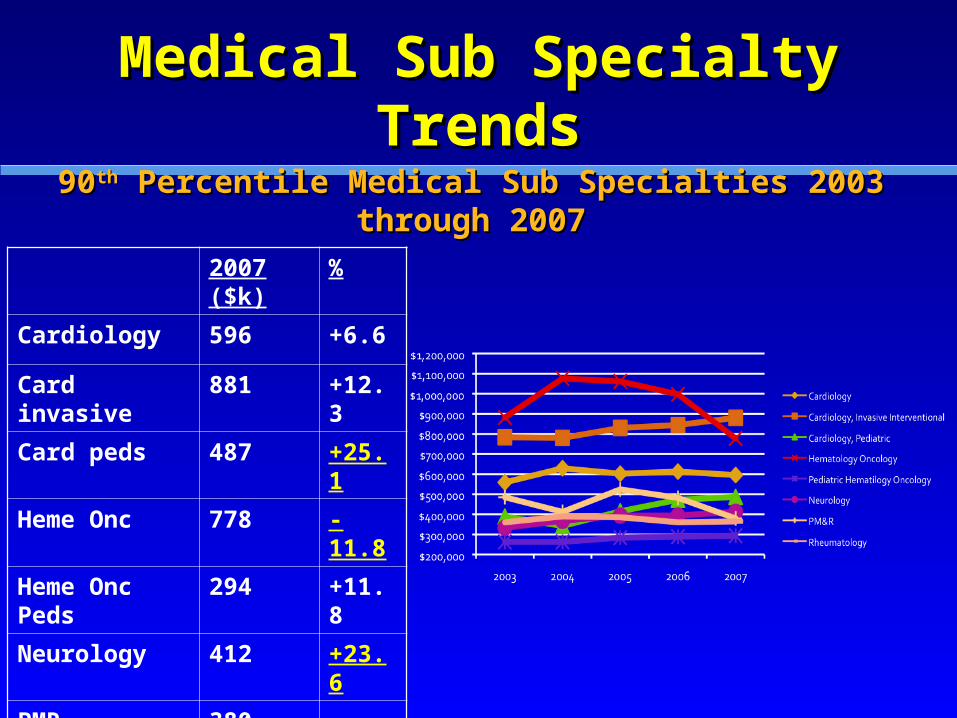
Medical Sub Specialty Medical Sub Specialty TrendsTrends
9090thth Percentile Medical Sub Specialties 2003 Percentile Medical Sub Specialties 2003 through 2007through 2007
2007 ($k)
%
Cardiology 596 +6.6
Card invasive
881 +12.3
Card peds 487 +25.1
Heme Onc 778 -11.8
Heme Onc Peds
294 +11.8
Neurology 412 +23.6
PMR 380 -21.8
Rheum 365 +1.2
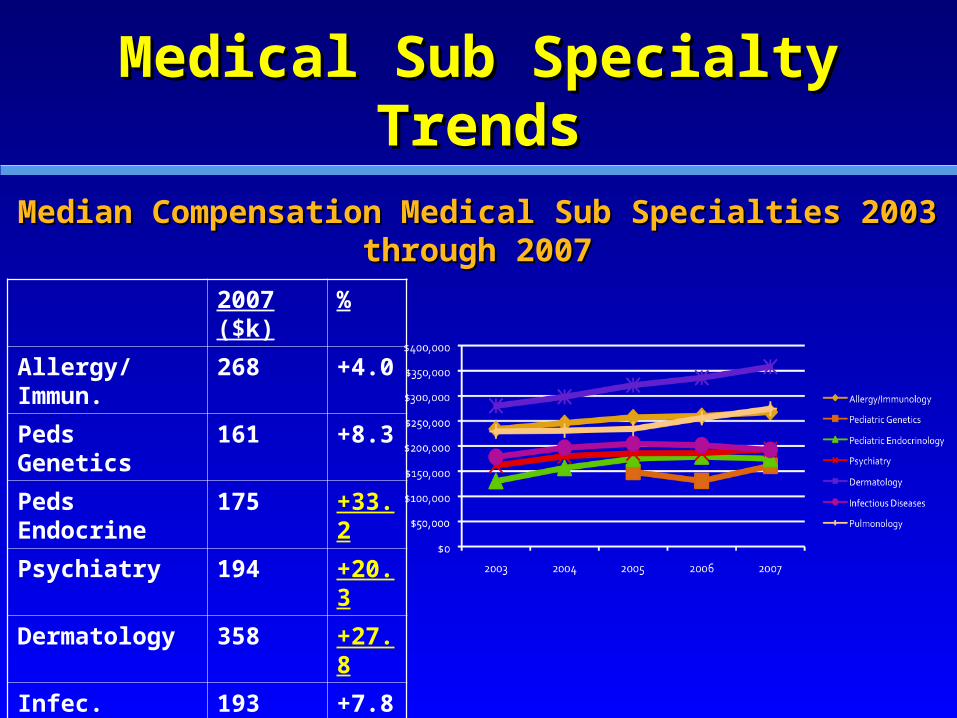
Medical Sub Specialty Medical Sub Specialty TrendsTrends
Median Compensation Medical Sub Specialties Median Compensation Medical Sub Specialties 2003 through 20072003 through 2007
2007 ($k)
%
Allergy/Immun.
268 +4.0
Peds Genetics
161 +8.3
Peds Endocrine
175 +33.2
Psychiatry 194 +20.3
Dermatology 358 +27.8
Infec. Disease
193 +7.8
Pulmonary 274 +19.7
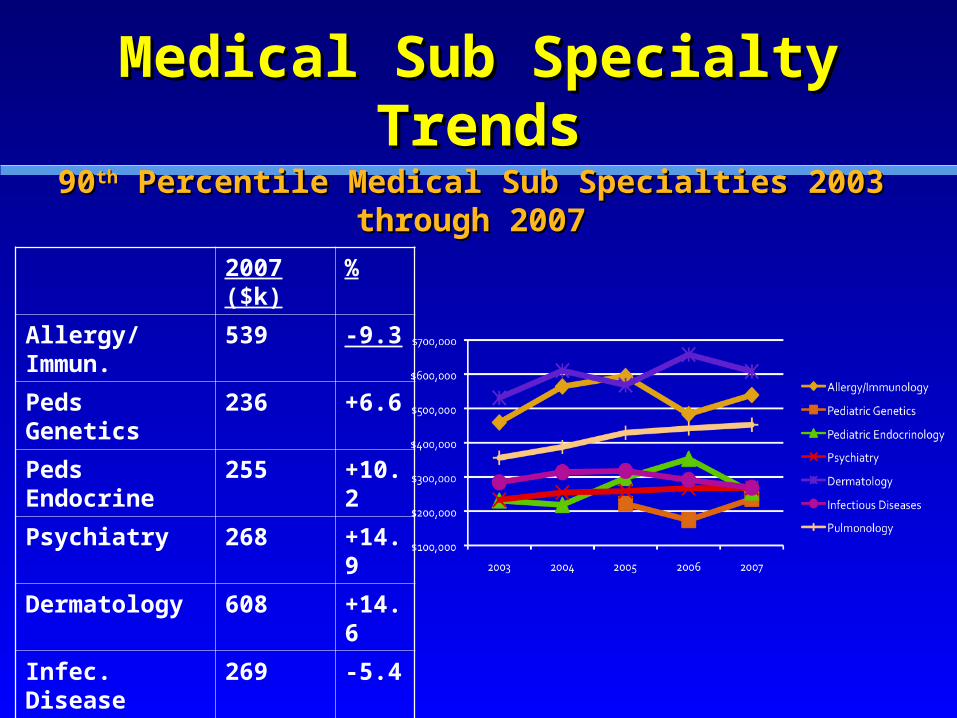
Medical Sub Specialty Medical Sub Specialty TrendsTrends
9090thth Percentile Medical Sub Specialties 2003 Percentile Medical Sub Specialties 2003 through 2007through 2007
2007 ($k)
%
Allergy/Immun.
539 -9.3
Peds Genetics
236 +6.6
Peds Endocrine
255 +10.2
Psychiatry 268 +14.9
Dermatology 608 +14.6
Infec. Disease
269 -5.4
Pulmonary 453 +27.1
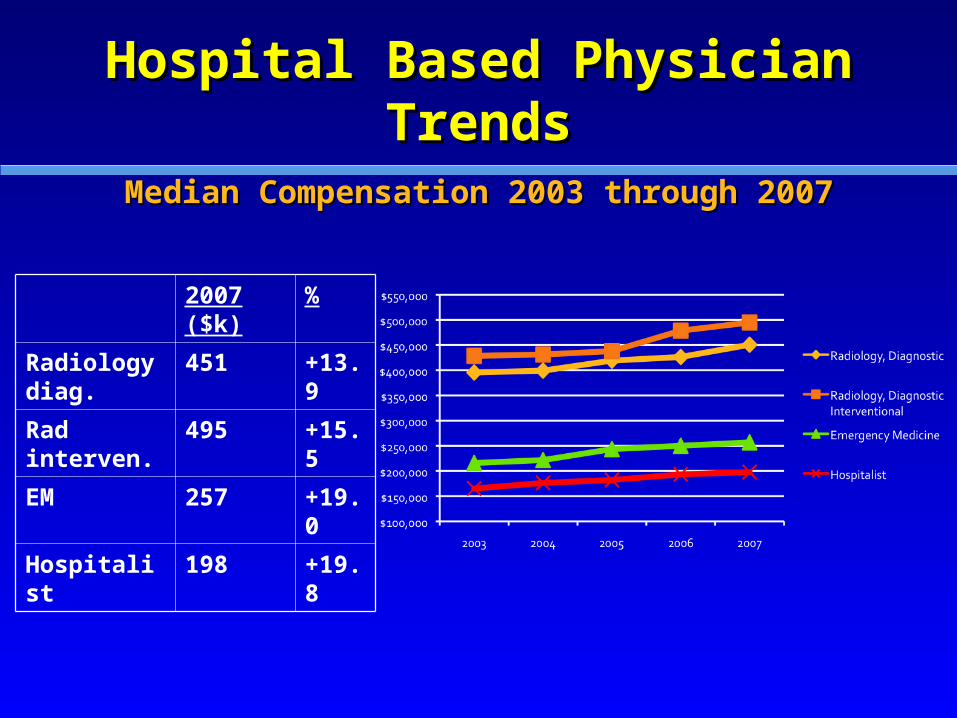
Hospital Based Physician Hospital Based Physician TrendsTrends
Median Compensation 2003 through 2007Median Compensation 2003 through 2007
2007 ($k)
%
Radiology diag.
451 +13.9
Rad interven.
495 +15.5
EM 257 +19.0
Hospitalist
198 +19.8

Hospital Based Physician Hospital Based Physician TrendsTrends
9090thth Percentile Compensation 2003 through Percentile Compensation 2003 through 20072007
2007 ($k)
%
Radiology diag.
687 +26.1
Rad interven.
715 +28.7
EM 353 +18.0
Hospitalist 275 +19.1
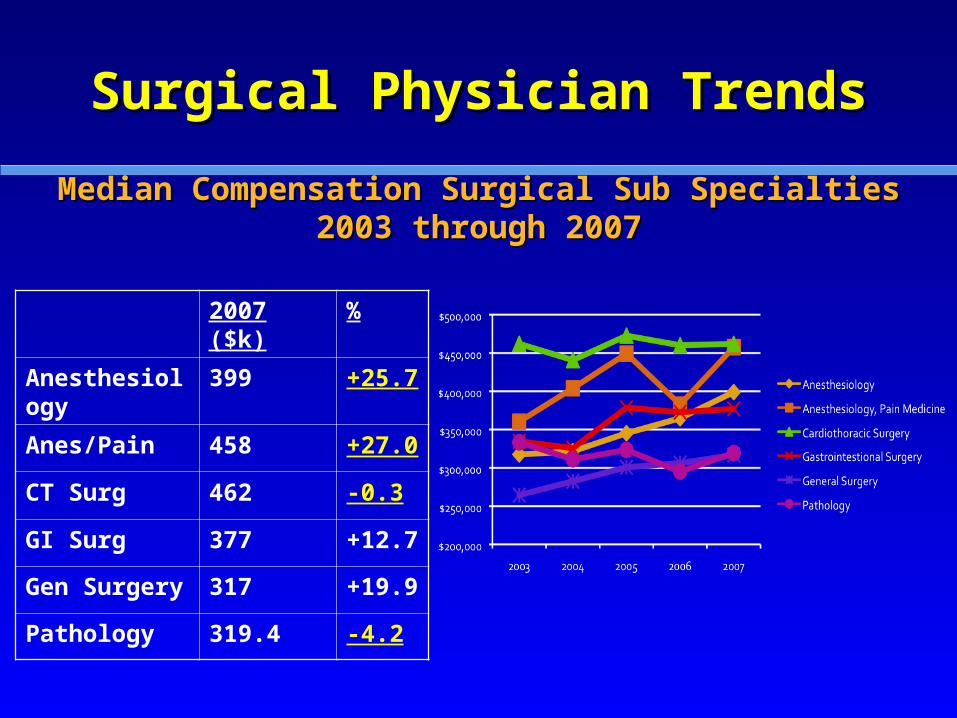
Surgical Physician TrendsSurgical Physician Trends
Median Compensation Surgical Sub Specialties Median Compensation Surgical Sub Specialties 2003 through 20072003 through 2007
2007 ($k)
%
Anesthesiology
399 +25.7
Anes/Pain 458 +27.0
CT Surg 462 -0.3
GI Surg 377 +12.7
Gen Surgery
317 +19.9
Pathology 319.4 -4.2
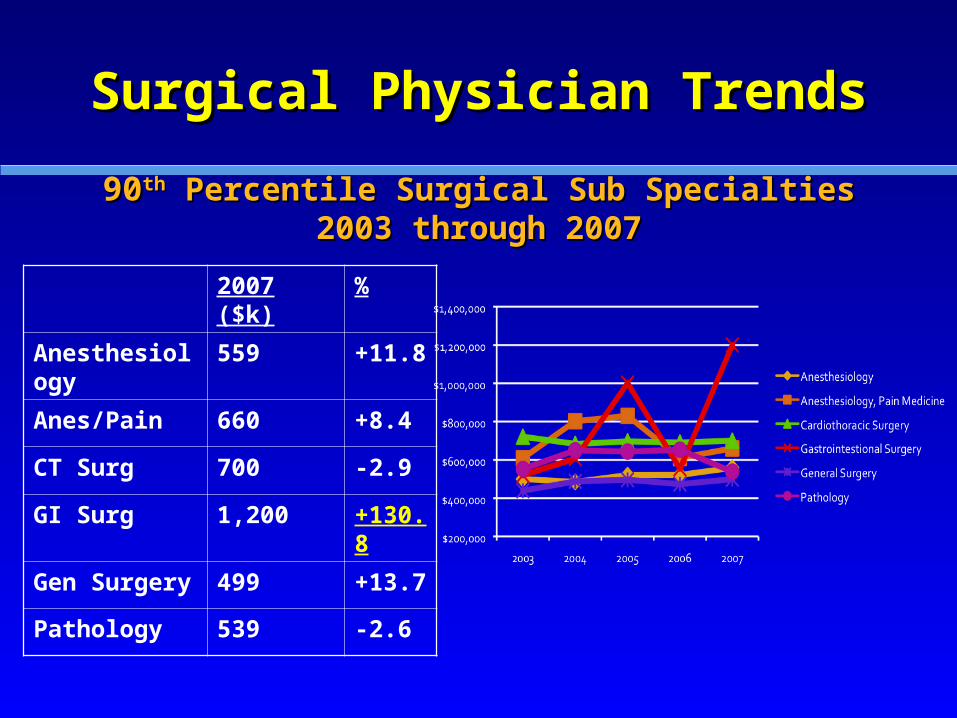
Surgical Physician TrendsSurgical Physician Trends
9090thth Percentile Surgical Sub Specialties 2003 Percentile Surgical Sub Specialties 2003 through 2007through 2007
2007 ($k)
%
Anesthesiology
559 +11.8
Anes/Pain 660 +8.4
CT Surg 700 -2.9
GI Surg 1,200 +130.8
Gen Surgery
499 +13.7
Pathology 539 -2.6
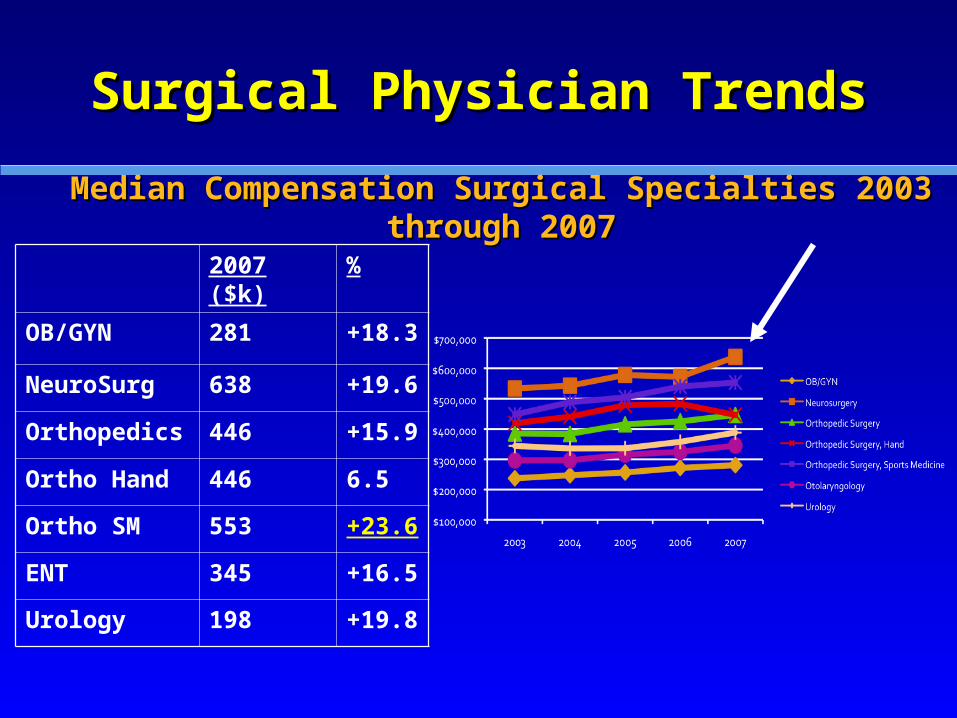
Surgical Physician TrendsSurgical Physician Trends
Median Compensation Surgical Specialties 2003 Median Compensation Surgical Specialties 2003 through 2007through 2007
2007 ($k)
%
OB/GYN 281 +18.3
NeuroSurg 638 +19.6
Orthopedics 446 +15.9
Ortho Hand 446 6.5
Ortho SM 553 +23.6
ENT 345 +16.5
Urology 198 +19.8
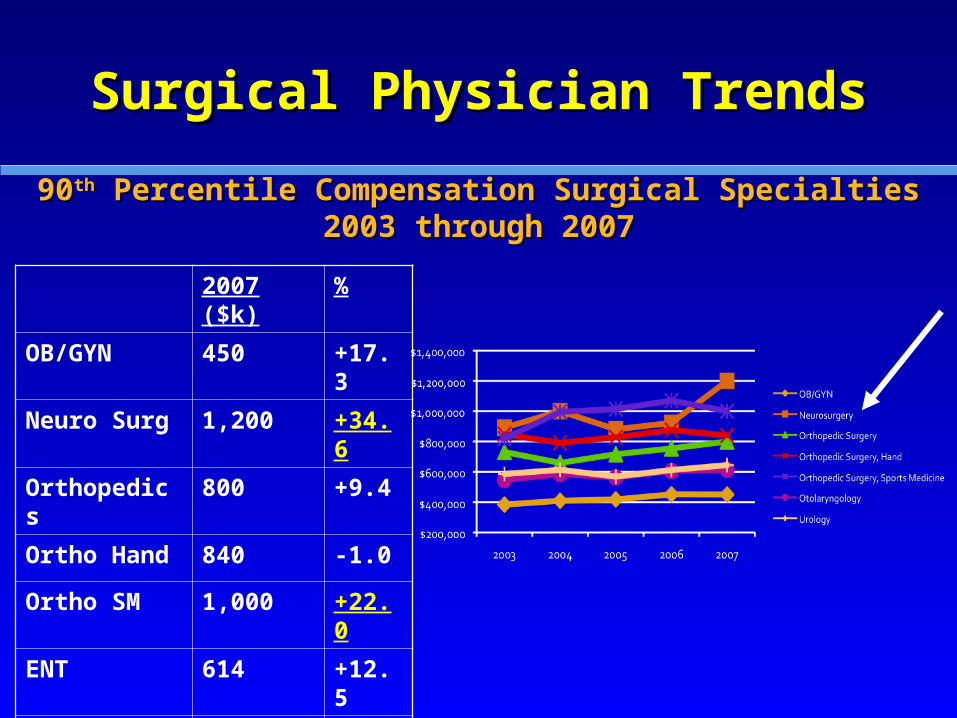
Surgical Physician TrendsSurgical Physician Trends
9090thth Percentile Compensation Surgical Specialties Percentile Compensation Surgical Specialties 2003 through 20072003 through 2007
2007 ($k)
%
OB/GYN 450 +17.3
Neuro Surg 1,200 +34.6
Orthopedics
800 +9.4
Ortho Hand 840 -1.0
Ortho SM 1,000 +22.0
ENT 614 +12.5
Urology 644 +10.0
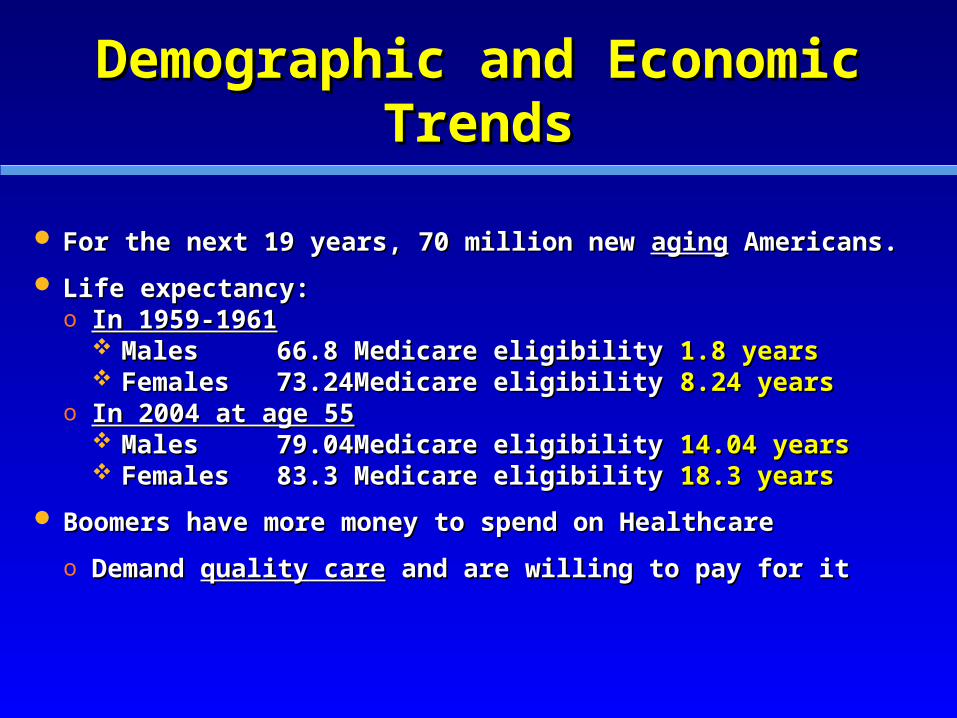
Demographic and Economic Demographic and Economic TrendsTrends
For the next 19 years, 70 million new For the next 19 years, 70 million new agingaging Americans. Americans.
Life expectancy:Life expectancy:o In 1959-1961In 1959-1961
MalesMales 66.866.8 Medicare eligibilityMedicare eligibility 1.8 years1.8 years FemalesFemales 73.2473.24 Medicare eligibilityMedicare eligibility 8.24 years8.24 years
o In 2004 at age 55In 2004 at age 55 MalesMales 79.0479.04 Medicare eligibilityMedicare eligibility 14.04 years14.04 years FemalesFemales 83.383.3 Medicare eligibilityMedicare eligibility 18.3 years18.3 years
Boomers have more money to spend on Healthcare Boomers have more money to spend on Healthcare
o Demand Demand quality carequality care and are willing to pay for it and are willing to pay for it
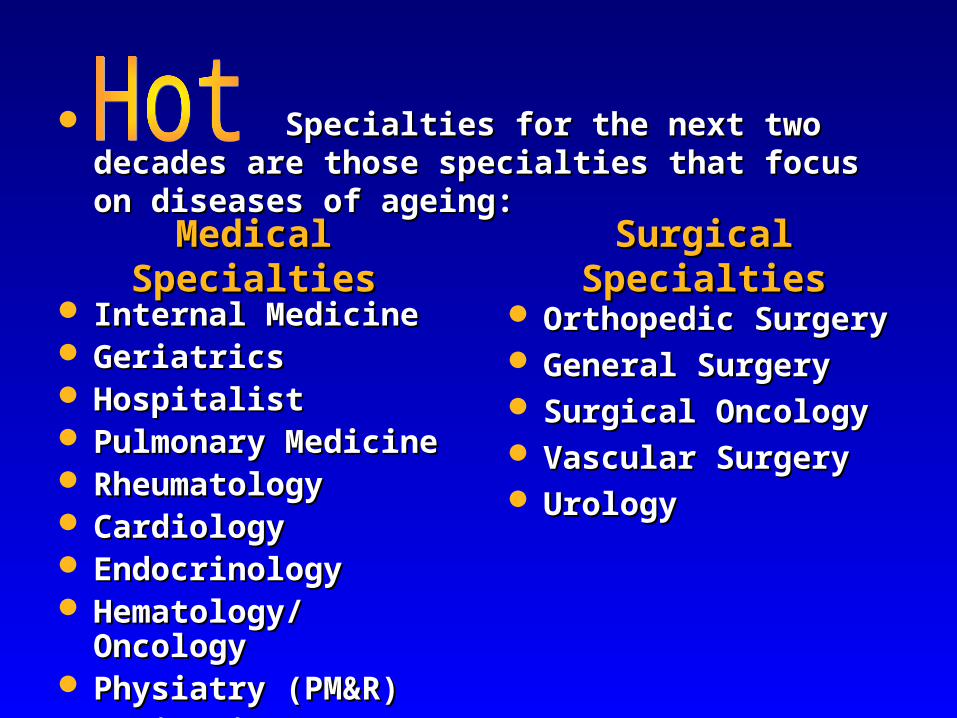
Medical Medical SpecialtiesSpecialties
Internal MedicineInternal Medicine GeriatricsGeriatrics HospitalistHospitalist Pulmonary Pulmonary
MedicineMedicine RheumatologyRheumatology CardiologyCardiology EndocrinologyEndocrinology Hematology/Hematology/
OncologyOncology Physiatry (PM&R)Physiatry (PM&R) Geriatric Geriatric
PsychiatryPsychiatry
Surgical Surgical SpecialtiesSpecialties
Orthopedic SurgeryOrthopedic Surgery General SurgeryGeneral Surgery Surgical OncologySurgical Oncology Vascular SurgeryVascular Surgery UrologyUrology
Specialties for the next two Specialties for the next two decades are those specialties that focus on decades are those specialties that focus on diseases of ageing:diseases of ageing:
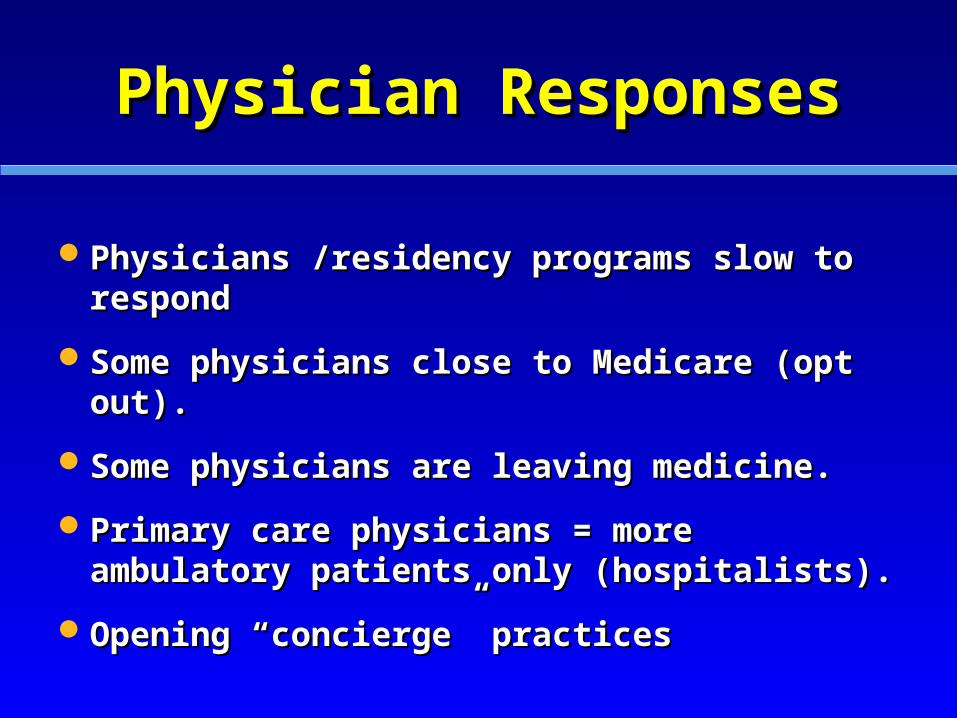
Physician ResponsesPhysician Responses
Physicians /residency programs slow to Physicians /residency programs slow to respond respond
Some physicians close to Medicare (opt out).Some physicians close to Medicare (opt out).
Some physicians are leaving medicine.Some physicians are leaving medicine.
Primary care physicians = more ambulatory Primary care physicians = more ambulatory patients only (hospitalists).patients only (hospitalists).
Opening “concierge” practicesOpening “concierge” practices
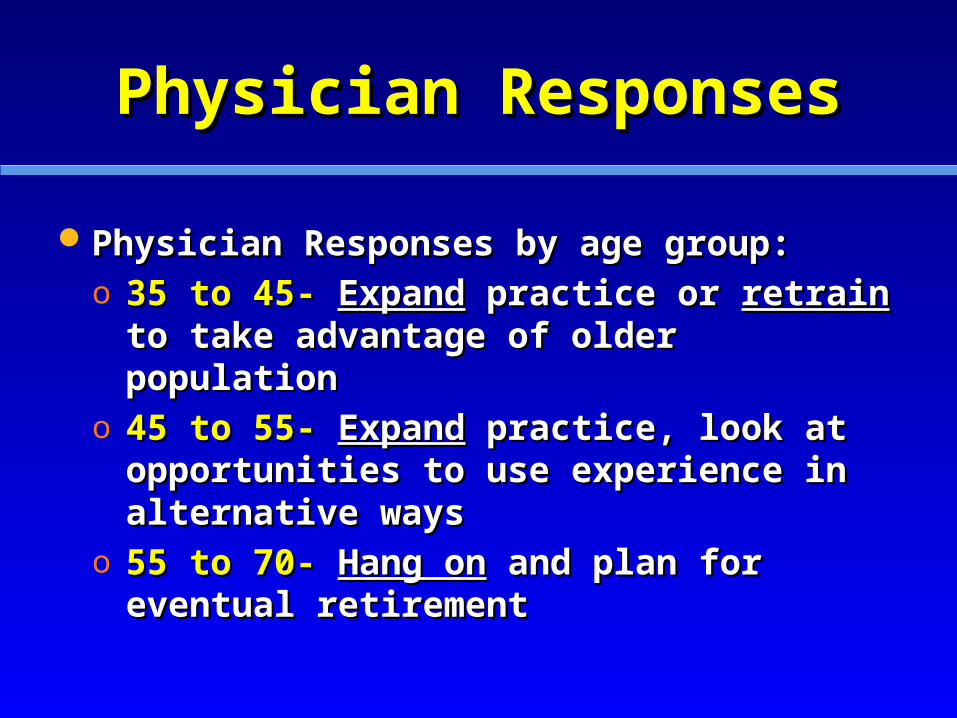
Physician ResponsesPhysician Responses
Physician Responses by age group:Physician Responses by age group:o 35 to 45-35 to 45- ExpandExpand practice or practice or retrainretrain to take to take
advantage of older populationadvantage of older populationo 45 to 55-45 to 55- ExpandExpand practice, look at practice, look at
opportunities to use experience in opportunities to use experience in alternative waysalternative ways
o 55 to 70-55 to 70- Hang onHang on and plan for eventual and plan for eventual retirementretirement
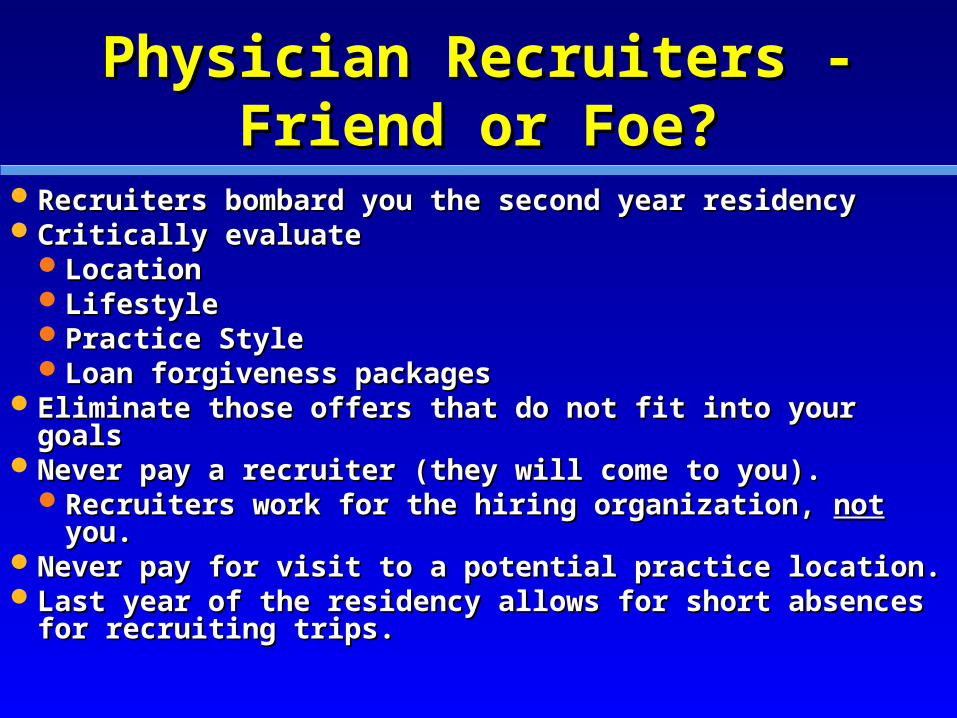
Physician Recruiters - Physician Recruiters - Friend or Foe?Friend or Foe?
Recruiters bombard you the second year residencyRecruiters bombard you the second year residencyCritically evaluate Critically evaluate
LocationLocationLifestyleLifestylePractice StylePractice StyleLoan forgiveness packagesLoan forgiveness packages
Eliminate those offers that do not fit into your goalsEliminate those offers that do not fit into your goalsNever pay a recruiter (they will come to you).Never pay a recruiter (they will come to you).
Recruiters work for the hiring organization, Recruiters work for the hiring organization, notnot you.you.
Never pay for visit to a potential practice location.Never pay for visit to a potential practice location.Last year of the residency allows for short absences Last year of the residency allows for short absences
for recruiting trips.for recruiting trips.
ConclusionConclusion
Physicians still make a good livingPhysicians still make a good living
Important day is the Residency Important day is the Residency Match Day (FEB/MAR in 4Match Day (FEB/MAR in 4thth year). year).
Know your goals, and make Know your goals, and make flexible decisions based on these flexible decisions based on these whenever possiblewhenever possible
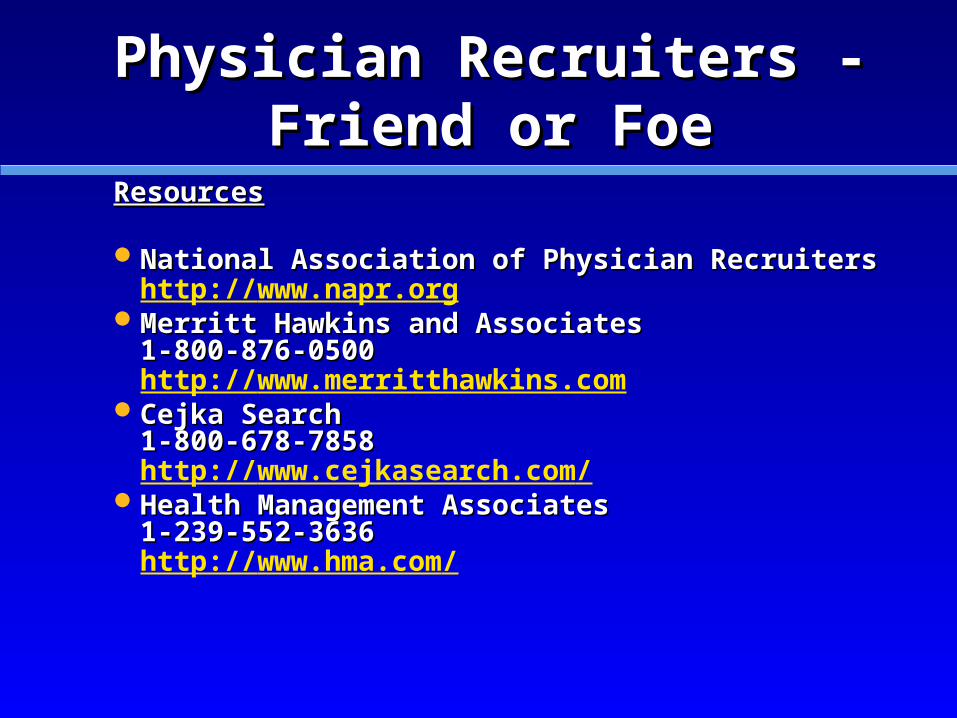
Physician Recruiters - Physician Recruiters - Friend or FoeFriend or Foe
ResourcesResources
National Association of Physician RecruitersNational Association of Physician Recruitershttp://www.napr.org
Merritt Hawkins and AssociatesMerritt Hawkins and Associates1-800-876-05001-800-876-0500http://www.merritthawkins.com
Cejka SearchCejka Search1-800-678-78581-800-678-7858http://www.cejkasearch.com/
Health Management AssociatesHealth Management Associates1-239-552-36361-239-552-3636http://www.hma.com/