Physically-based Finite Element Strength Prediction …epubs.surrey.ac.uk/805731/1/Plast Rub and...
18
Physically-based Finite Element Strength Prediction in Notched Woven Laminates under Quasi-static Loading H. Ahmad 1 , A D Crocombe 2 , and P A Smith 2 1 Department of Structures and Materials Engineering, Faculty of Civil and Environmental Engineering, Universiti Tun Hussein Onn Malaysia, 86400 Parit Raja, Batu Pahat, Johor Darul Tak’zim, MALAYSIA. 2 Division of Mechanical, Medical and Aerospace Engineering, Faculty of Engineering and Physical Sciences, University of Surrey, Guildford, Surrey, GU2 7XH, UNITED KINGDOM. Abstract The present paper is concerned with modelling damage and fracture in notched woven fabric composites. Previous experimental work has shown that, under tensile loading, damage at a notch in a variety of GFRP and CFRP composites based on woven fabric reinforcement comprises matrix damage and fibre tow fracture along the plane of maximum stress. It is these experimental observations that inform the failure modelling developed here, in which a cohesive zone approach is used within a two-dimensional extended finite element method (XFEM) framework. The traction-separation parameters used in the XFEM implementation are based on previously reported experimental measurements for the strength and toughness of the woven fabric materials under investigation. The approach is shown to provide predictions of notched strength that are in very good agreement with experimental results from the literature for a range of GFRP and CFRP woven fabric systems and also agree well with results obtained from closed-form analytical models, which require calibration. Keywords – Circular Hole, Notched Plate, Strength Prediction, Stress, Woven Composite, XFEM, 1. Introduction Woven fabric based composite materials are an attractive option for a range of engineering applications. Although the mechanical properties are not as good as those of their non-woven
Transcript of Physically-based Finite Element Strength Prediction …epubs.surrey.ac.uk/805731/1/Plast Rub and...
Physically-based Finite Element Strength Prediction in
Notched Woven Laminates under Quasi-static Loading
H. Ahmad1, A D Crocombe2, and P A Smith2
1Department of Structures and Materials Engineering,
Faculty of Civil and Environmental Engineering,
Universiti Tun Hussein Onn Malaysia,
86400 Parit Raja, Batu Pahat,
Johor Darul Tak’zim, MALAYSIA.
2Division of Mechanical, Medical and Aerospace Engineering,
Faculty of Engineering and Physical Sciences,
University of Surrey, Guildford,
Surrey, GU2 7XH,
UNITED KINGDOM.
Abstract
The present paper is concerned with modelling damage and fracture in notched woven fabric
composites. Previous experimental work has shown that, under tensile loading, damage at a notch in
a variety of GFRP and CFRP composites based on woven fabric reinforcement comprises matrix
damage and fibre tow fracture along the plane of maximum stress. It is these experimental
observations that inform the failure modelling developed here, in which a cohesive zone approach is
used within a two-dimensional extended finite element method (XFEM) framework. The
traction-separation parameters used in the XFEM implementation are based on previously reported
experimental measurements for the strength and toughness of the woven fabric materials under
investigation. The approach is shown to provide predictions of notched strength that are in very
good agreement with experimental results from the literature for a range of GFRP and CFRP woven
fabric systems and also agree well with results obtained from closed-form analytical models, which
require calibration.
Keywords – Circular Hole, Notched Plate, Strength Prediction, Stress, Woven Composite, XFEM,
1. Introduction
Woven fabric based composite materials are an attractive option for a range of engineering
applications. Although the mechanical properties are not as good as those of their non-woven
counterparts, they still offer reasonable specific stiffness and strength with particularly good impact
and energy absorption characteristics. Moreover they offer some economies and greater flexibility
in processing options. A particular problem with woven composites (as with other composites) is
their sensitivity to the presence of stress concentrations, such as those provided by an open hole and
bolted joint. Unlike many structural metallic materials, composite materials in general lack the
capability to deform plastically in the macroscopic sense and this means that failure at a stress raiser
in a composite occurs in a relatively brittle fashion. Notwithstanding this, composite materials have
the capability to sustain damage prior to fracture; this means that the notched strength is greater
than would be expected simply on the basis of the elastic stress concentration factor. The damage
mechanisms in notched woven composite plates differ from those in notched non-woven composite
plate and this has implications for the modelling approach.
The failure of composite materials from a stress raiser, particularly an open hole, has been
researched extensively over the years. Early closed-form models (of which the most well-known are
perhaps the point and average stress criteria of Whitney and Nuismer, [1]) have been followed by
finite element based approaches of varying degrees of complexity. Some of the latter models treat
the composite as a homogeneous material for the purpose of the stress analysis and then use
laminate theory and two-dimensional in-plane failure models to simulate progressive damage at the
ply level, followed by a degradation of the elastic properties to account for the stress redistribution
before ultimate failure e.g. Chang and Chang [2]. Other models use a quasi-two dimensional
approach, Kortshot et. al. [3], or a full three dimensional analysis, e.g. Hallet et. al. [4]. These
approaches represent the observed damage more realistically – in particular they incorporate
through-thickness damage (delamination) in addition to in-plane damage. Kortshot et. al. [3]
proposed a model for notched strength prediction which represents the effect of intra-ply damage
(local unidirectional ply splitting) and inter-ply (associated delamination) cracking on the stress
distribution near the notch tip in the longitudinal plies of notched cross-ply laminates and uses a
statistical Weibull-based failure criterion in 2D model to predict the failure of the 0º plies and hence
the notched strength. Hallet et. al. [4] modelled damage within a FE framework and used the
approach to investigate the effect of a number of parameters (hole diameter, ply thickness and
laminate thickness) on the strength of notched quasi-isotropic CFRP laminates subjected to tensile
stress. Another class of failure model (discussed further below) is based on modelling macroscopic
through-thickness crack growth from the notch, an approach which is perhaps not consistent with
the observed failure mechanism in laminates based on unidirectional layers of reinforcement such
as discussed above.
Many of the more widely-used approaches to predict notched strength are semi-empirical in nature
and this limits their general applicability. In particular the sub-critical damage that develops at
notches (and which needs to be represented in some way within any model) varies according to the
details of the composite under investigation. Hence it is only through the use of physically based
models that there is the possibility of a failure theory being applicable to more than one class of
problem without extensive recalibration of the model. In a notched woven fabric GFRP composite
subjected to tension, it has been shown experimentally using a model (transparent) GFRP system
that prior to failure an intense zone of damage develops in the region of maximum tensile stress
(Belmonte et. al [5]). Damage within that zone comprises matrix cracking and splitting, but also
fibre tow fracture. In that sense the damage resembles stable self-similar crack growth, suggesting
that a fracture mechanics-based model is a physically reasonable one to use. A similar study was
carried by Belmonte et al. [6] on woven quasi-isotropic and cross-ply CFRP. Although the opaque
nature of the CFRP means that direct observations of damage are less straightforward, there was
evidence of tow failure before specimen failure. Other valuable data concerning notched tensile
strength of woven composites had been presented previously by Kim et al., [7]. More recent work
by Zahari et al [8] has considered the notched compressive behaviour of woven GFRP.
The previous paragraph suggests that an appropriate failure model for notched woven fabric
composites under tensile loading would consider the damage growth from the notch explicitly.
There are a number of essentially similar techniques that treat the problem in this way. A particular
stress-displacement relation is assumed within the damage zone and the energy absorbed in
separating the crack faces corresponds to the material toughness, Gc. One of the first models to
adopt this method was that of Eriksson and Aronsson [9] who assumed a constant cohesive
stress-displacement relationship within the damage zone. An approximate analytical version of this
approach, a "critical damage growth" (CDG) model, was presented by Hitchen et. al [10], building
on earlier work by Soutis and Fleck [11], and this was applied subsequently to woven composites
[5,6]. Afaghi-Khatibi et. al. [12] presented an "equivalent crack growth model" (ECGM) which
assumed a linear decrease of cohesive stress with displacement in the damage zone, which they
applied successfully to the data of Kim et al. [7].
The present work explores further the applicability of this type of approach, which in the present
paper is incorporated within an extended finite element (XFEM) formulation. A limitation of the
previous studies is that the material parameters within the models have generally been calibrated
against experimental data rather than determined independently. Here we use independent
measurements of unnotched strength and toughness, where available, to develop numerical models
for the experimental studies on woven fabric systems conducted by Kim et. al. using GFRP [7] and
Belmonte et al. using GFRP [5] and CFRP [6]. In the next section details of the numerical
procedure are provided. XFEM predictions are compared with experiment and other closed-form
solutions in subsequent sections.
2. Finite Element Modelling
2.1 Notched Plate Geometry and Material Properties
The three experimental studies from the literature were modelled within a two – dimensional finite
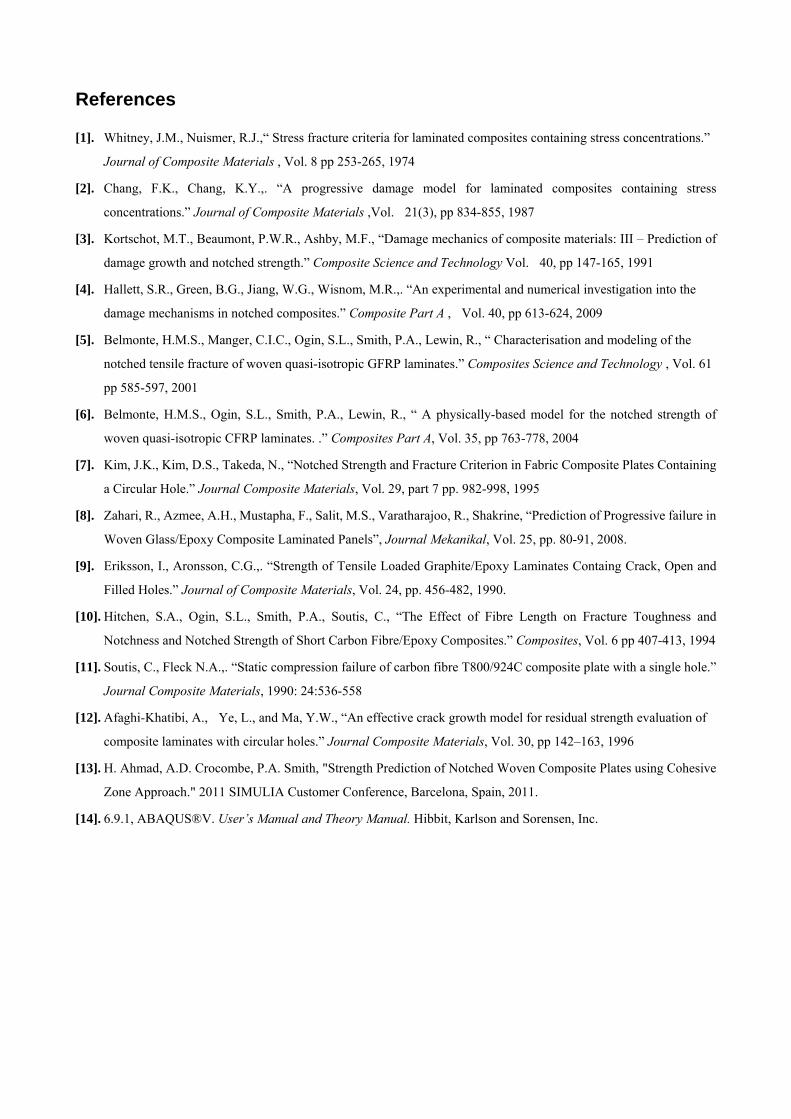
element framework using ABAQUS CAE Version 6.9.1 [15]. For all the models, the plate symmetry
means that only half of the coupon needed to be modelled, Figure 1, reducing computational cost
and time during the processing stage. The first data set is taken from the extensive experimental
work conducted by Kim et al. [7] using three types of woven fabric composite systems with various
combinations of notch sizes, laminate width and volume fraction. All plates have a length (L) of 200
mm with varying widths (W) and a circular hole of diameter (d) 5 mm. Table 1 shows the geometry
and material properties for all the woven fabric systems investigated experimentally by Kim et al.
[7] that are being modelled in current paper. The elastic properties are required for the stress
analysis while to implement the damage model the unnotched strength, σo and the fracture energy,
Gc are also required. Independently measured values for the latter were not reported by Kim et
al.[7]. Instead they derived their values from an analysis of the notched strength experimental data
and this is the origin of the notch size dependent data (strength and fracture energy) seen in Table 1,
apparent in the glass-epoxy in particular. In the absence of independently measured properties, these
fracture energy values are used in the current work as it enables comparison not only with the
experimental data from [7] but also with the ECGM approach, which has been applied to the same
data set [12].
The second and third data sets were taken from the work of Belmonte et al. for woven GFRP
laminates [5] and woven CFRP laminates [6] respectively. The plates were 130 mm gauge length
(GFRP) or 150 mm gauge length (CFRP) and constant width of 25 mm with notch sizes (hole
diameters), d, of 2.5, 5.0 and 10.0 mm giving d/W ratios of 0.1, 0.2 and 0.4 respectively. Belmonte
also included an additional series of larger CFRP specimens from the thickest plates that were of
gauge length 380 mm, width 120 mm and contained a 20 mm diameter hole corresponding to d/W =
0.17. Belmonte et al. [5, 6] carried out experiments on two different types of woven composite
systems, i.e., GFRP and CFRP. The material properties are shown in Tables 2 and 3. The GFRP
systems comprised two stacking sequences of a four-layer quasi-isotropic composite [Table 2]. The
woven CFRP systems investigated were of two types (a plain weave and a five harness satin weave,
two different lay-ups (cross-ply and quasi-isotropic) and three different plate thickness for each
giving 12 systems in total [Table 3]. In contrast with Kim et al. [7], Belmonte et al. [5, 6] reported
values of fracture energy that were measured independently for each lay-up using a
single-edge-notch fracture mechanics specimens in accordance with ASTM E 399-90.
2.2 Implementation of Constitutive Law in FE Modelling
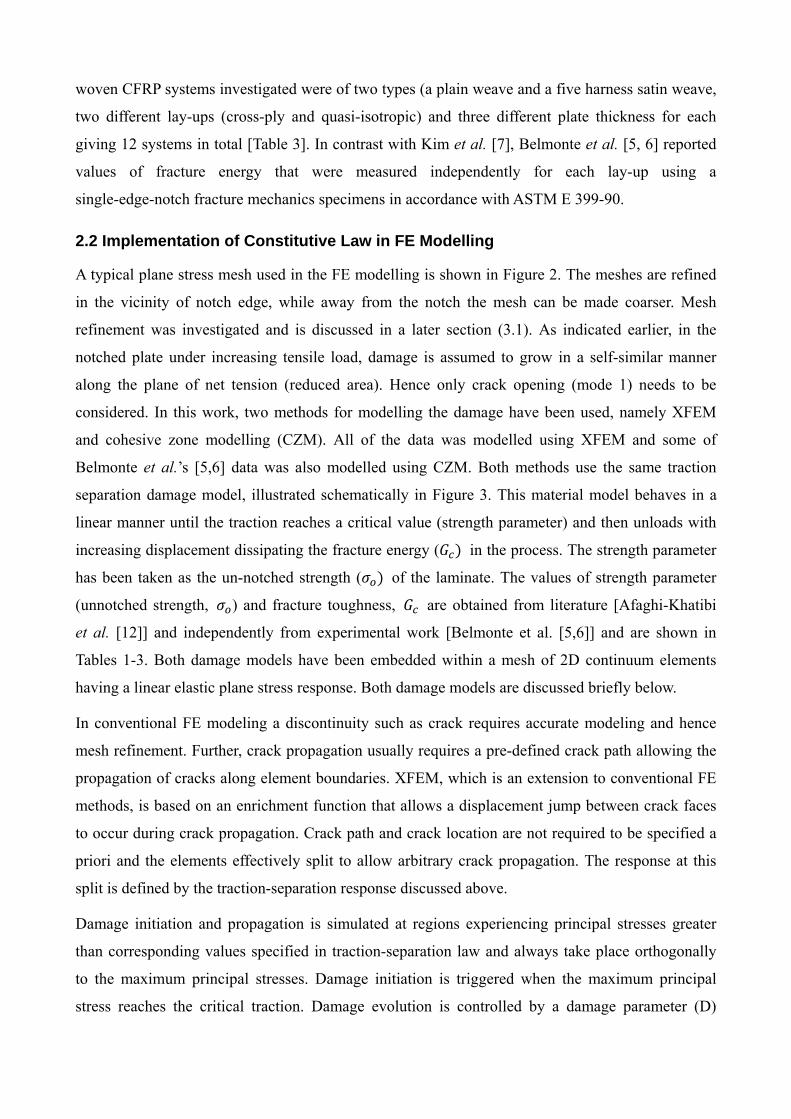
A typical plane stress mesh used in the FE modelling is shown in Figure 2. The meshes are refined
in the vicinity of notch edge, while away from the notch the mesh can be made coarser. Mesh
refinement was investigated and is discussed in a later section (3.1). As indicated earlier, in the
notched plate under increasing tensile load, damage is assumed to grow in a self-similar manner
along the plane of net tension (reduced area). Hence only crack opening (mode 1) needs to be
considered. In this work, two methods for modelling the damage have been used, namely XFEM
and cohesive zone modelling (CZM). All of the data was modelled using XFEM and some of
Belmonte et al.’s [5,6] data was also modelled using CZM. Both methods use the same traction
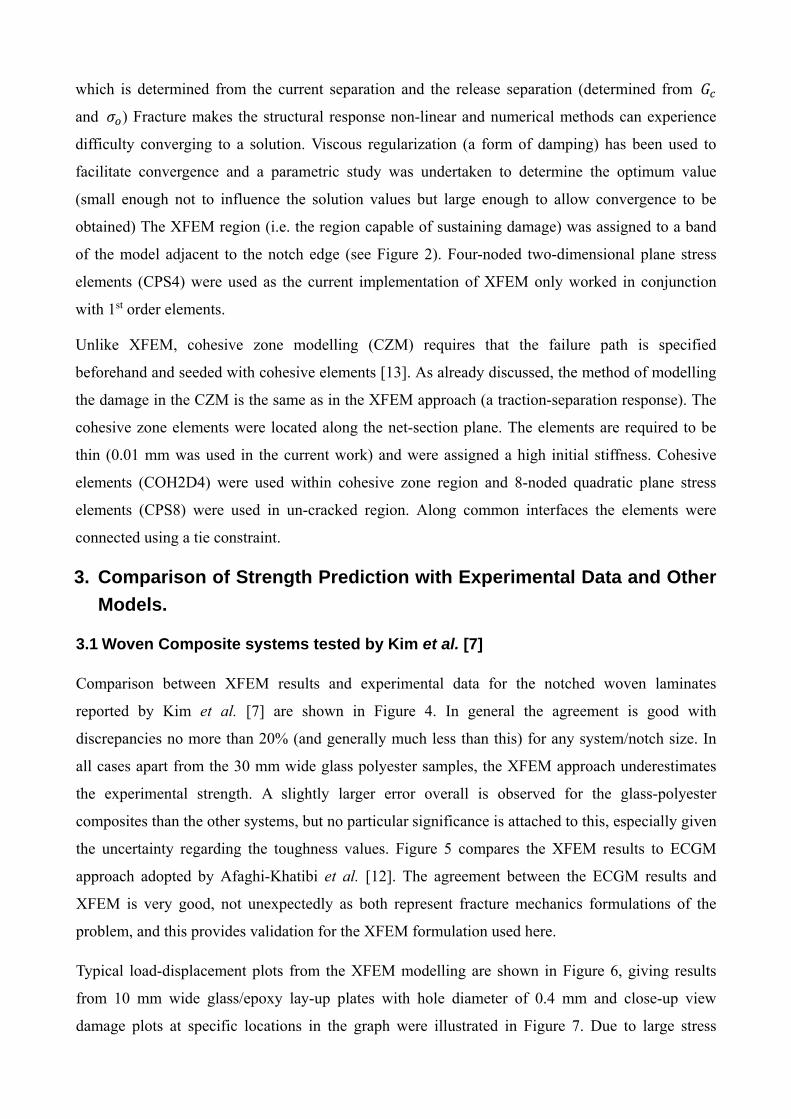
separation damage model, illustrated schematically in Figure 3. This material model behaves in a
linear manner until the traction reaches a critical value (strength parameter) and then unloads with
increasing displacement dissipating the fracture energy ( in the process. The strength parameter
has been taken as the un-notched strength ( of the laminate. The values of strength parameter
(unnotched strength, ) and fracture toughness, are obtained from literature [Afaghi-Khatibi
et al. [12]] and independently from experimental work [Belmonte et al. [5,6]] and are shown in
Tables 1-3. Both damage models have been embedded within a mesh of 2D continuum elements
having a linear elastic plane stress response. Both damage models are discussed briefly below.
In conventional FE modeling a discontinuity such as crack requires accurate modeling and hence
mesh refinement. Further, crack propagation usually requires a pre-defined crack path allowing the
propagation of cracks along element boundaries. XFEM, which is an extension to conventional FE
methods, is based on an enrichment function that allows a displacement jump between crack faces
to occur during crack propagation. Crack path and crack location are not required to be specified a
priori and the elements effectively split to allow arbitrary crack propagation. The response at this
split is defined by the traction-separation response discussed above.
Damage initiation and propagation is simulated at regions experiencing principal stresses greater
than corresponding values specified in traction-separation law and always take place orthogonally
to the maximum principal stresses. Damage initiation is triggered when the maximum principal
stress reaches the critical traction. Damage evolution is controlled by a damage parameter (D)
which is determined from the current separation and the release separation (determined from
and ) Fracture makes the structural response non-linear and numerical methods can experience
difficulty converging to a solution. Viscous regularization (a form of damping) has been used to
facilitate convergence and a parametric study was undertaken to determine the optimum value
(small enough not to influence the solution values but large enough to allow convergence to be
obtained) The XFEM region (i.e. the region capable of sustaining damage) was assigned to a band
of the model adjacent to the notch edge (see Figure 2). Four-noded two-dimensional plane stress
elements (CPS4) were used as the current implementation of XFEM only worked in conjunction
with 1st order elements.
Unlike XFEM, cohesive zone modelling (CZM) requires that the failure path is specified
beforehand and seeded with cohesive elements [13]. As already discussed, the method of modelling
the damage in the CZM is the same as in the XFEM approach (a traction-separation response). The
cohesive zone elements were located along the net-section plane. The elements are required to be
thin (0.01 mm was used in the current work) and were assigned a high initial stiffness. Cohesive
elements (COH2D4) were used within cohesive zone region and 8-noded quadratic plane stress
elements (CPS8) were used in un-cracked region. Along common interfaces the elements were
connected using a tie constraint.
3. Comparison of Strength Prediction with Experimental Data and Other
Models.
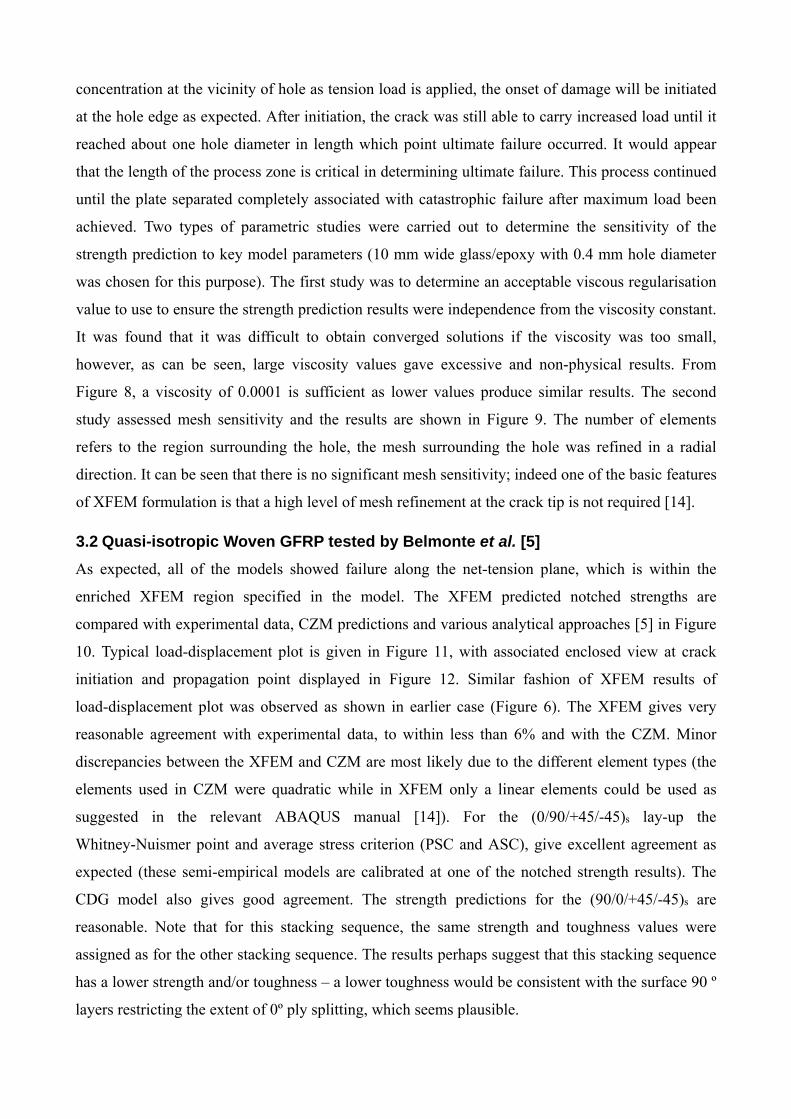
3.1 Woven Composite systems tested by Kim et al. [7]
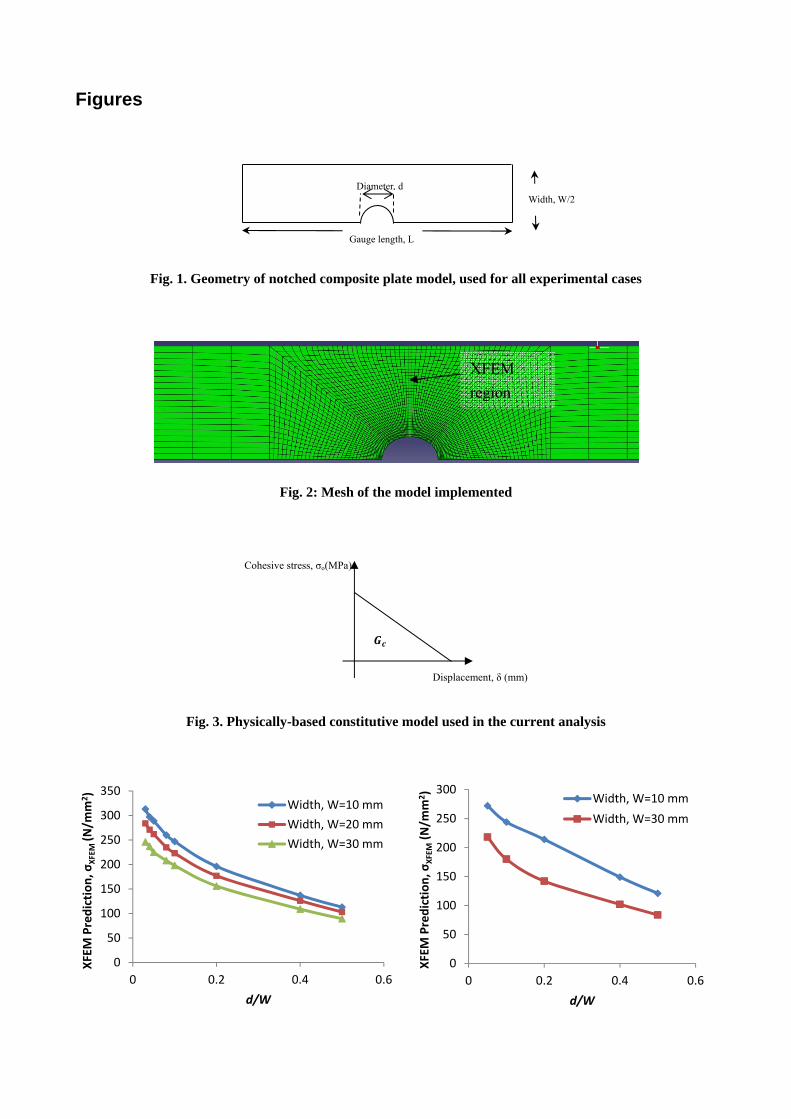
Comparison between XFEM results and experimental data for the notched woven laminates
reported by Kim et al. [7] are shown in Figure 4. In general the agreement is good with
discrepancies no more than 20% (and generally much less than this) for any system/notch size. In
all cases apart from the 30 mm wide glass polyester samples, the XFEM approach underestimates
the experimental strength. A slightly larger error overall is observed for the glass-polyester
composites than the other systems, but no particular significance is attached to this, especially given
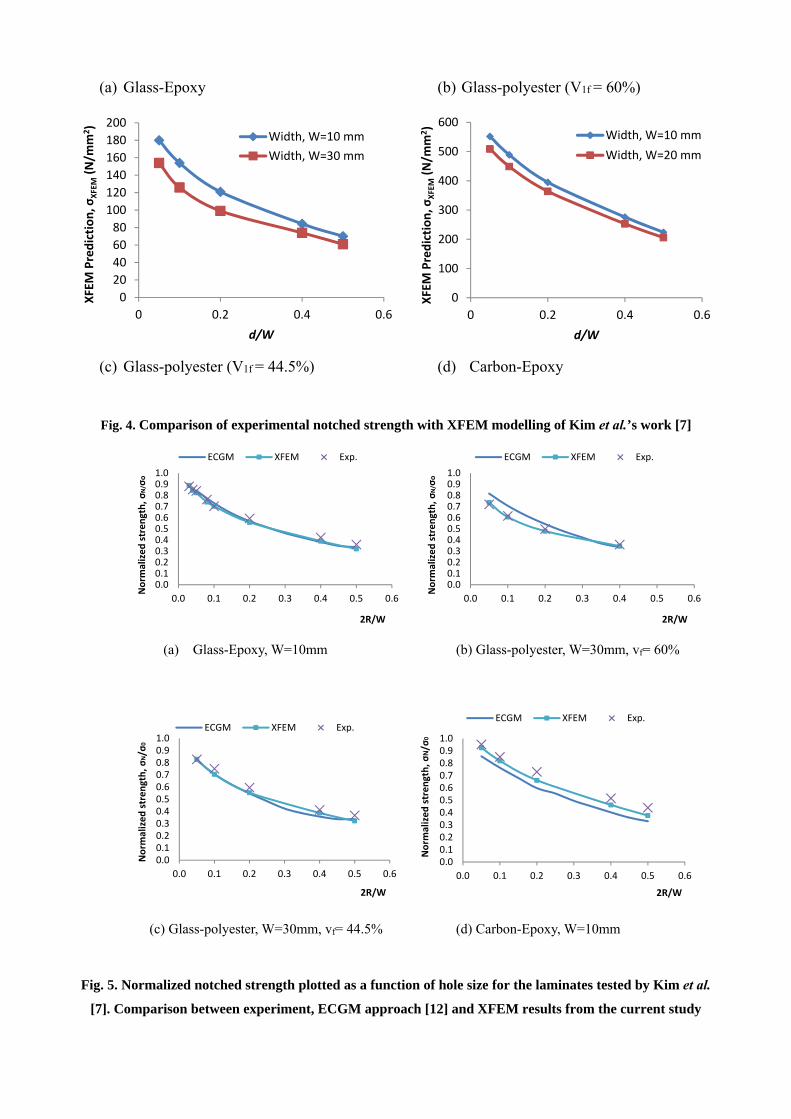
the uncertainty regarding the toughness values. Figure 5 compares the XFEM results to ECGM
approach adopted by Afaghi-Khatibi et al. [12]. The agreement between the ECGM results and
XFEM is very good, not unexpectedly as both represent fracture mechanics formulations of the
problem, and this provides validation for the XFEM formulation used here.
Typical load-displacement plots from the XFEM modelling are shown in Figure 6, giving results
from 10 mm wide glass/epoxy lay-up plates with hole diameter of 0.4 mm and close-up view
damage plots at specific locations in the graph were illustrated in Figure 7. Due to large stress
concentration at the vicinity of hole as tension load is applied, the onset of damage will be initiated
at the hole edge as expected. After initiation, the crack was still able to carry increased load until it
reached about one hole diameter in length which point ultimate failure occurred. It would appear
that the length of the process zone is critical in determining ultimate failure. This process continued
until the plate separated completely associated with catastrophic failure after maximum load been
achieved. Two types of parametric studies were carried out to determine the sensitivity of the
strength prediction to key model parameters (10 mm wide glass/epoxy with 0.4 mm hole diameter
was chosen for this purpose). The first study was to determine an acceptable viscous regularisation
value to use to ensure the strength prediction results were independence from the viscosity constant.
It was found that it was difficult to obtain converged solutions if the viscosity was too small,
however, as can be seen, large viscosity values gave excessive and non-physical results. From
Figure 8, a viscosity of 0.0001 is sufficient as lower values produce similar results. The second
study assessed mesh sensitivity and the results are shown in Figure 9. The number of elements
refers to the region surrounding the hole, the mesh surrounding the hole was refined in a radial
direction. It can be seen that there is no significant mesh sensitivity; indeed one of the basic features
of XFEM formulation is that a high level of mesh refinement at the crack tip is not required [14].
3.2 Quasi-isotropic Woven GFRP tested by Belmonte et al. [5]
As expected, all of the models showed failure along the net-tension plane, which is within the
enriched XFEM region specified in the model. The XFEM predicted notched strengths are
compared with experimental data, CZM predictions and various analytical approaches [5] in Figure
10. Typical load-displacement plot is given in Figure 11, with associated enclosed view at crack
initiation and propagation point displayed in Figure 12. Similar fashion of XFEM results of
load-displacement plot was observed as shown in earlier case (Figure 6). The XFEM gives very
reasonable agreement with experimental data, to within less than 6% and with the CZM. Minor
discrepancies between the XFEM and CZM are most likely due to the different element types (the
elements used in CZM were quadratic while in XFEM only a linear elements could be used as
suggested in the relevant ABAQUS manual [14]). For the (0/90/+45/-45)s lay-up the
Whitney-Nuismer point and average stress criterion (PSC and ASC), give excellent agreement as
expected (these semi-empirical models are calibrated at one of the notched strength results). The
CDG model also gives good agreement. The strength predictions for the (90/0/+45/-45)s are
reasonable. Note that for this stacking sequence, the same strength and toughness values were
assigned as for the other stacking sequence. The results perhaps suggest that this stacking sequence
has a lower strength and/or toughness – a lower toughness would be consistent with the surface 90 º
layers restricting the extent of 0º ply splitting, which seems plausible.
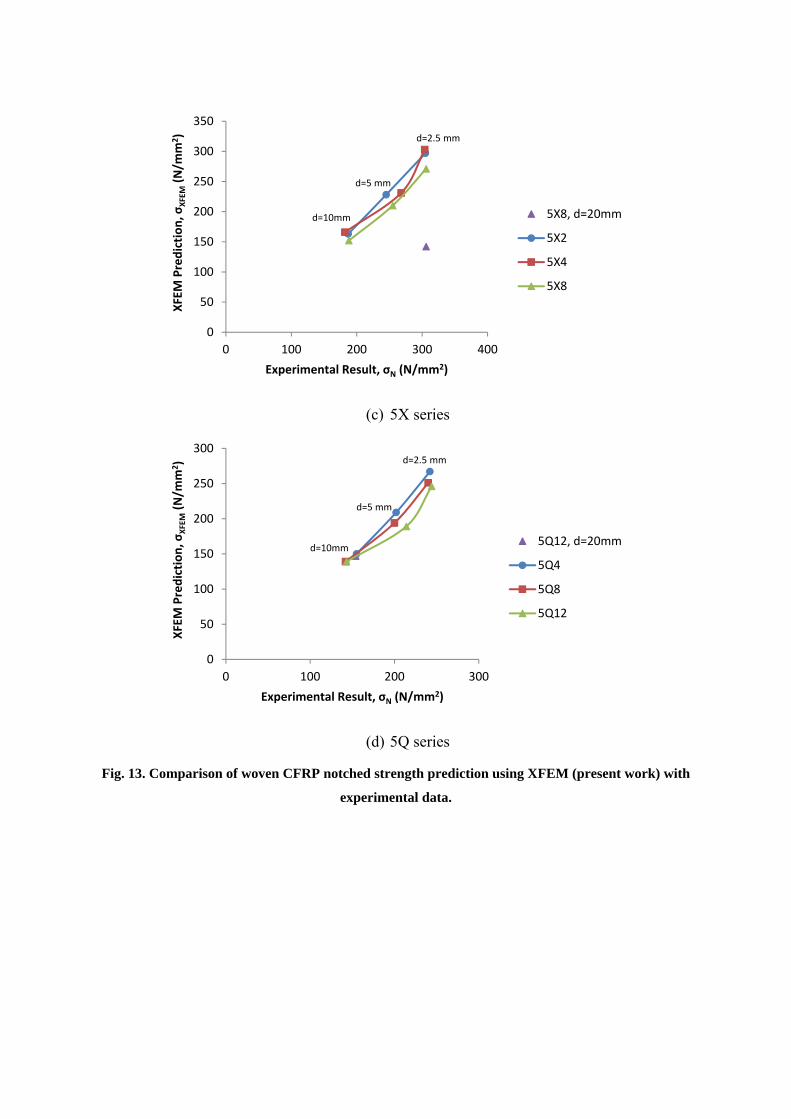
3.3 Cross-ply and Quasi-isotropic woven CFRP tested by Belmonte et al. [6]
The results for the cross-ply and quasi isotropic woven CFRP composite systems with different
notch sizes are presented in a similar way in Figure 13. Both CZM and XFEM modelling of failure
initiation and propagation in woven CFRP exhibited similar trends as shown in woven GFRP.
Overall agreement is very good, within 10% for most systems (the range of error is 0.09% -
19.41%). Similar size errors were found in large width (40 mm) and small width (25 mm)
specimens. In almost all cases the XFEM tends to underestimate the experimental strength, with a
higher discrepancy for the cross-ply systems than the quasi-isotropic systems. The underestimation
may be a result of the simplifying assumptions within the constitutive law. For instance the tow
fractures tend to follow the crimp regions and this means that the assumption of self-similar crack
growth is not entirely realistic.
As with the GFRP results, the PSC and ASC (the Whitney-Nuismer failure criteria) give the best
predictions compared to other approaches for the hole sizes of 10 mm or less, over which range
they were calibrated against the experimental data. As a result the PSC and ASC predictions are less
good for the larger hole size of 20 mm where the same characteristic distance values were used.
Overall the numerical results obtained here using XFEM show better prediction than the critical
damage growth (CDG) model implemented by Belmonte et. al [6], especially for the cross-ply
systems. The CDG model was formulated based on an isotropic analysis, which could only be
corrected partially for the orthotropic cross-ply systems and so the discrepancies are perhaps not
surprising.
4. Concluding Remarks
2-D modelling of notched woven GFRP and CFRP composites plates has been implemented within
an FE framework. XFEM and CZM approaches gave very reasonable agreement with the
experimental data for all the systems investigated. There was also good agreement with a range of
other modelling approaches. The advantages of the XFEM/CZM approach used in the present work
are that, unlike the other approaches, it is physically based (and consistent with experimental
observations of damage and fracture) and that it may be implemented using independently
measured material properties. In turn this offers the prospect that the approach may be applicable to
failure in other classes of problem (e.g., net-tension failure at a bolted joint) without extensive
recalibration of the model.
References
[1]. Whitney, J.M., Nuismer, R.J.,“ Stress fracture criteria for laminated composites containing stress concentrations.”
Journal of Composite Materials , Vol. 8 pp 253-265, 1974
[2]. Chang, F.K., Chang, K.Y.,. “A progressive damage model for laminated composites containing stress
concentrations.” Journal of Composite Materials ,Vol. 21(3), pp 834-855, 1987
[3]. Kortschot, M.T., Beaumont, P.W.R., Ashby, M.F., “Damage mechanics of composite materials: III – Prediction of
damage growth and notched strength.” Composite Science and Technology Vol. 40, pp 147-165, 1991
[4]. Hallett, S.R., Green, B.G., Jiang, W.G., Wisnom, M.R.,. “An experimental and numerical investigation into the
damage mechanisms in notched composites.” Composite Part A , Vol. 40, pp 613-624, 2009
[5]. Belmonte, H.M.S., Manger, C.I.C., Ogin, S.L., Smith, P.A., Lewin, R., “ Characterisation and modeling of the
notched tensile fracture of woven quasi-isotropic GFRP laminates.” Composites Science and Technology , Vol. 61
pp 585-597, 2001
[6]. Belmonte, H.M.S., Ogin, S.L., Smith, P.A., Lewin, R., “ A physically-based model for the notched strength of
woven quasi-isotropic CFRP laminates. .” Composites Part A, Vol. 35, pp 763-778, 2004
[7]. Kim, J.K., Kim, D.S., Takeda, N., “Notched Strength and Fracture Criterion in Fabric Composite Plates Containing
a Circular Hole.” Journal Composite Materials, Vol. 29, part 7 pp. 982-998, 1995
[8]. Zahari, R., Azmee, A.H., Mustapha, F., Salit, M.S., Varatharajoo, R., Shakrine, “Prediction of Progressive failure in
Woven Glass/Epoxy Composite Laminated Panels”, Journal Mekanikal, Vol. 25, pp. 80-91, 2008.
[9]. Eriksson, I., Aronsson, C.G.,. “Strength of Tensile Loaded Graphite/Epoxy Laminates Containg Crack, Open and
Filled Holes.” Journal of Composite Materials, Vol. 24, pp. 456-482, 1990.
[10]. Hitchen, S.A., Ogin, S.L., Smith, P.A., Soutis, C., “The Effect of Fibre Length on Fracture Toughness and
Notchness and Notched Strength of Short Carbon Fibre/Epoxy Composites.” Composites, Vol. 6 pp 407-413, 1994
[11]. Soutis, C., Fleck N.A.,. “Static compression failure of carbon fibre T800/924C composite plate with a single hole.”
Journal Composite Materials, 1990: 24:536-558
[12]. Afaghi-Khatibi, A., Ye, L., and Ma, Y.W., “An effective crack growth model for residual strength evaluation of
composite laminates with circular holes.” Journal Composite Materials, Vol. 30, pp 142–163, 1996
[13]. H. Ahmad, A.D. Crocombe, P.A. Smith, "Strength Prediction of Notched Woven Composite Plates using Cohesive
Zone Approach." 2011 SIMULIA Customer Conference, Barcelona, Spain, 2011.
[14]. 6.9.1, ABAQUS®V. User’s Manual and Theory Manual. Hibbit, Karlson and Sorensen, Inc.
Figures
Fig. 1. Geometry of notched composite plate model, used for all experimental cases
Fig. 2: Mesh of the model implemented
Fig. 3. Physically-based constitutive model used in the current analysis
0
50
100
150
200
250
300
350
0 0.2 0.4 0.6
XFEM Prediction, σ
XFEM (N
/mm
2)
d/W
Width, W=10 mm
Width, W=20 mm
Width, W=30 mm
0
50
100
150
200
250
300
0 0.2 0.4 0.6
XFEM Prediction, σ
XFEM(N/m
m2)
d/W
Width, W=10 mm
Width, W=30 mm
Cohesive stress, σo(MPa)
Displacement, δ (mm)
Gauge length, L
Width, W/2 Diameter, d
XFEM
region
(a) Glass-Epoxy (b) Glass-polyester (V1f = 60%)
(c) Glass-polyester (V1f = 44.5%) (d) Carbon-Epoxy
Fig. 4. Comparison of experimental notched strength with XFEM modelling of Kim et al.’s work [7]
(a) Glass-Epoxy, W=10mm (b) Glass-polyester, W=30mm, vf= 60%
(c) Glass-polyester, W=30mm, vf= 44.5% (d) Carbon-Epoxy, W=10mm
Fig. 5. Normalized notched strength plotted as a function of hole size for the laminates tested by Kim et al.
[7]. Comparison between experiment, ECGM approach [12] and XFEM results from the current study
0
20
40
60
80
100
120
140
160
180
200
0 0.2 0.4 0.6
XFEM Prediction, σ
XFEM(N/m
m2)
d/W
Width, W=10 mm
Width, W=30 mm
0
100
200
300
400
500
600
0 0.2 0.4 0.6
XFEM Prediction, σ
XFEM(N/m
m2)
d/W
Width, W=10 mm
Width, W=20 mm
0.00.10.20.30.40.50.60.70.80.91.0
0.0 0.1 0.2 0.3 0.4 0.5 0.6
Norm
alized strength, σN/σ
o
2R/W
ECGM XFEM Exp.
0.00.10.20.30.40.50.60.70.80.91.0
0.0 0.1 0.2 0.3 0.4 0.5 0.6
Norm
alized strength, σN/σ
o
2R/W
ECGM XFEM Exp.
0.00.10.20.30.40.50.60.70.80.91.0
0.0 0.1 0.2 0.3 0.4 0.5 0.6
Norm
alized strength, σN/σ
0
2R/W
ECGM XFEM Exp.
0.00.10.20.30.40.50.60.70.80.91.0
0.0 0.1 0.2 0.3 0.4 0.5 0.6
Norm
alized strength, σN/σ
0
2R/W
ECGM XFEM Exp.
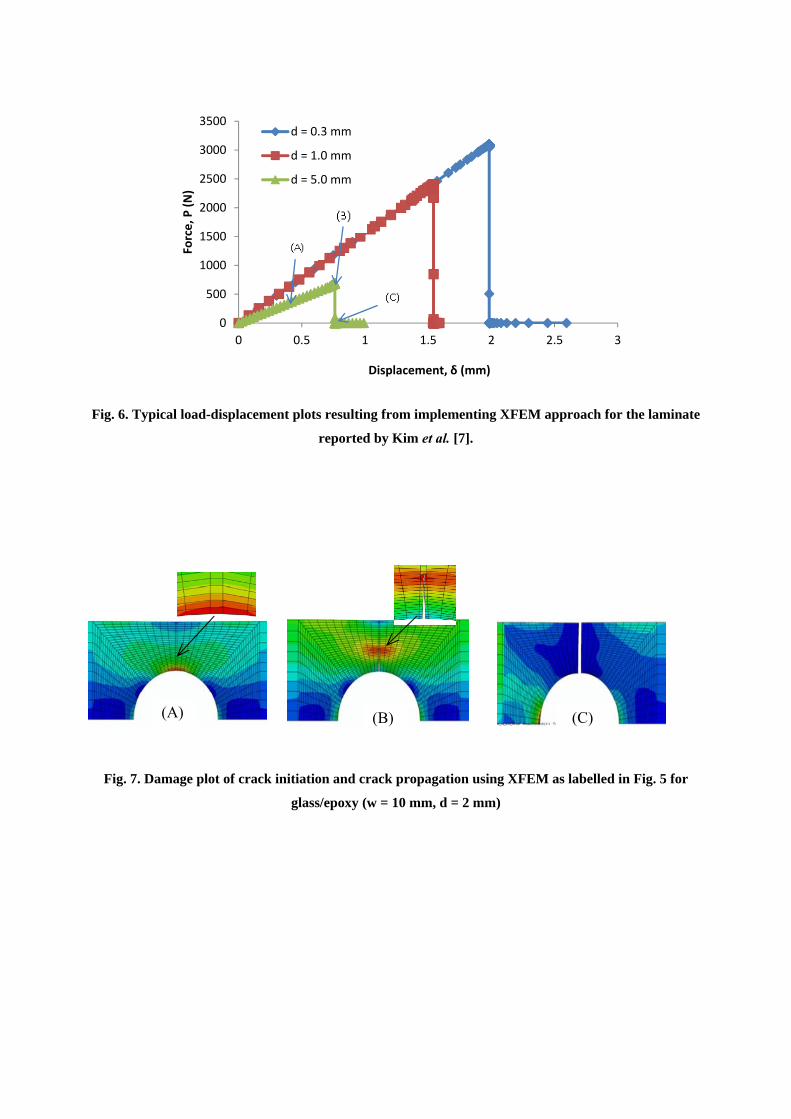
Fig. 6. Typical load-displacement plots resulting from implementing XFEM approach for the laminate
reported by Kim et al. [7].
Fig. 7. Damage plot of crack initiation and crack propagation using XFEM as labelled in Fig. 5 for
glass/epoxy (w = 10 mm, d = 2 mm)
0
500
1000
1500
2000
2500
3000
3500
0 0.5 1 1.5 2 2.5 3
Force, P
(N)
Displacement, δ (mm)
d = 0.3 mm
d = 1.0 mm
d = 5.0 mm
(C) (B) (A)
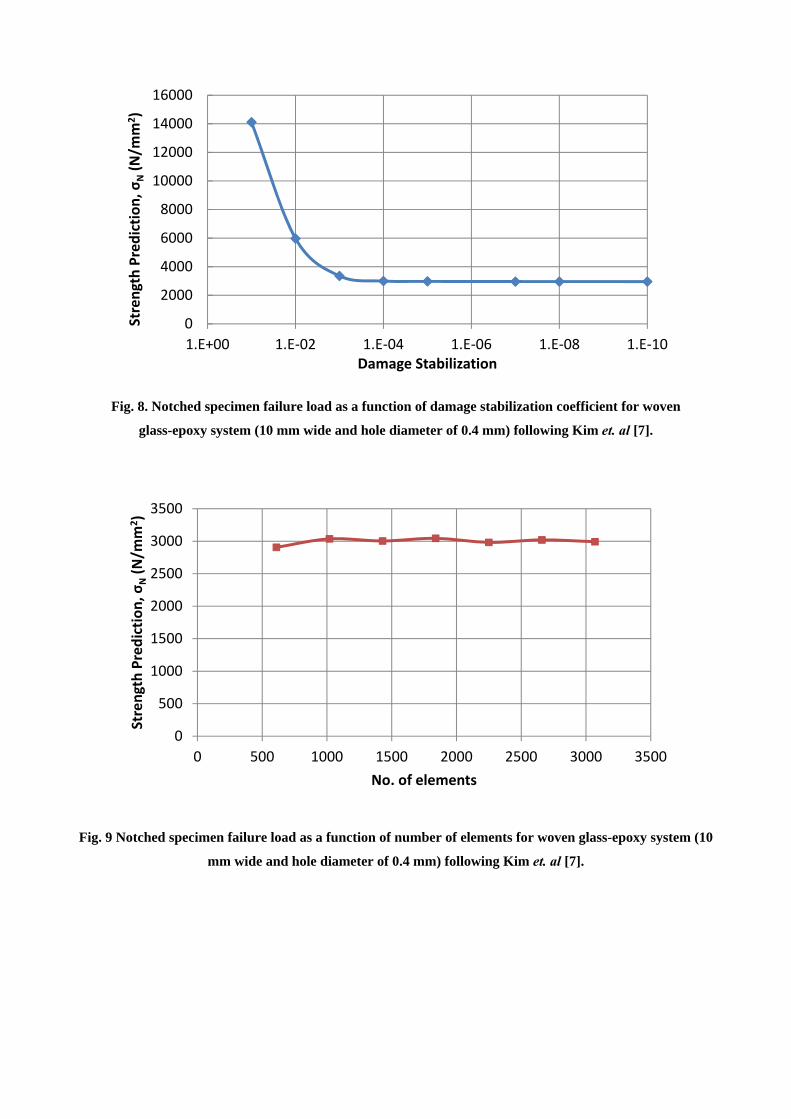
Fig. 8. Notched specimen failure load as a function of damage stabilization coefficient for woven
glass-epoxy system (10 mm wide and hole diameter of 0.4 mm) following Kim et. al [7].
Fig. 9 Notched specimen failure load as a function of number of elements for woven glass-epoxy system (10
mm wide and hole diameter of 0.4 mm) following Kim et. al [7].
0
2000
4000
6000
8000
10000
12000
14000
16000
1.E‐101.E‐081.E‐061.E‐041.E‐021.E+00
Strength Prediction, σ
N(N/m
m2)
Damage Stabilization
0
500
1000
1500
2000
2500
3000
3500
0 500 1000 1500 2000 2500 3000 3500
Strength Prediction, σ
N(N/m
m2)
No. of elements
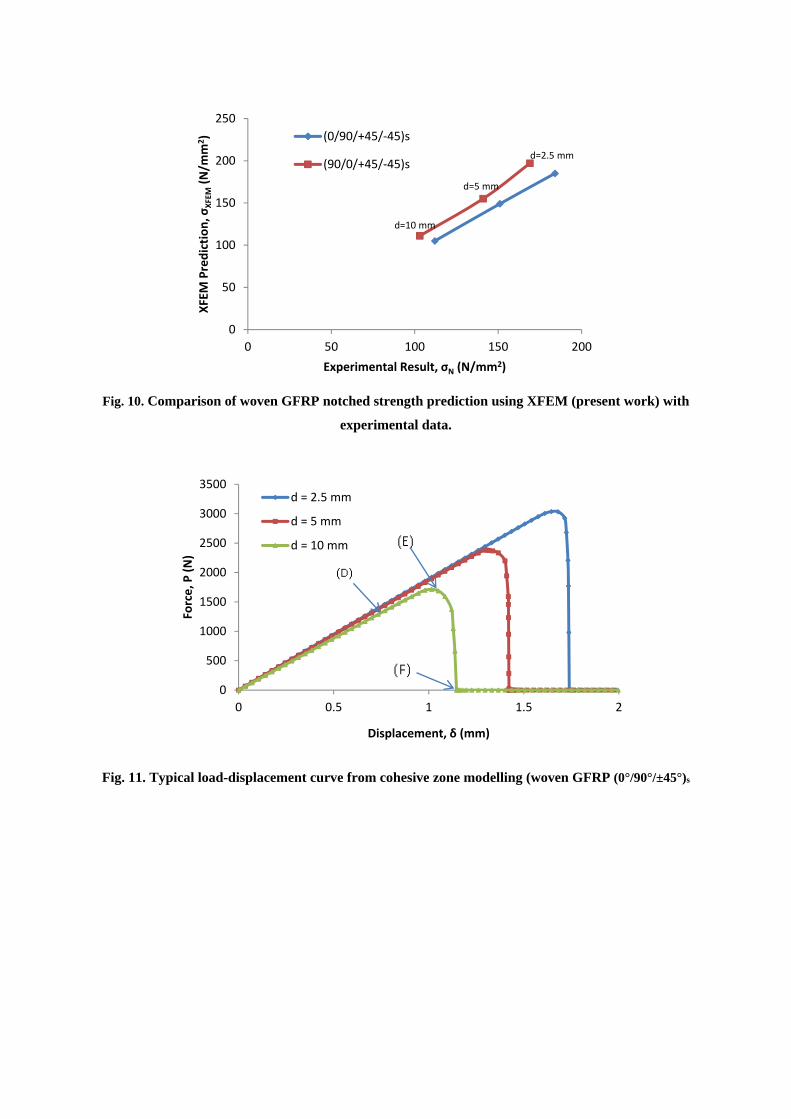
Fig. 10. Comparison of woven GFRP notched strength prediction using XFEM (present work) with
experimental data.
Fig. 11. Typical load-displacement curve from cohesive zone modelling (woven GFRP (0°/90°/±45°)s
0
50
100
150
200
250
0 50 100 150 200
XFEM Prediction, σ
XFEM(N/m
m2)
Experimental Result, σN (N/mm2)
(0/90/+45/‐45)s
(90/0/+45/‐45)sd=2.5 mm
d=5 mm
d=10 mm
0
500
1000
1500
2000
2500
3000
3500
0 0.5 1 1.5 2
Force, P
(N)
Displacement, δ (mm)
d = 2.5 mm
d = 5 mm
d = 10 mm
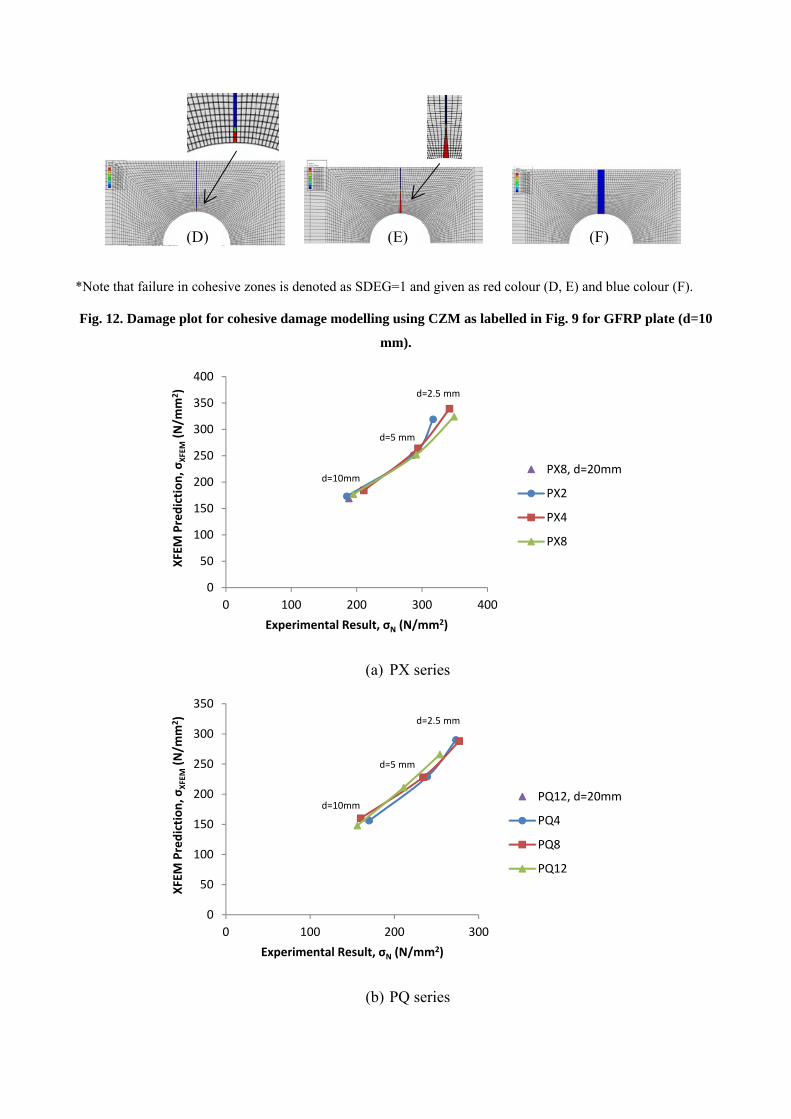
*Note that failure in cohesive zones is denoted as SDEG=1 and given as red colour (D, E) and blue colour (F).
Fig. 12. Damage plot for cohesive damage modelling using CZM as labelled in Fig. 9 for GFRP plate (d=10
mm).
(a) PX series
(b) PQ series
0
50
100
150
200
250
300
350
400
0 100 200 300 400
XFEM Prediction, σ
XFEM(N/m
m2)
Experimental Result, σN (N/mm2)
PX8, d=20mm
PX2
PX4
PX8
d=5 mm
d=10mm
d=2.5 mm
0
50
100
150
200
250
300
350
0 100 200 300
XFEM Prediction, σ
XFEM(N/m
m2)
Experimental Result, σN (N/mm2)
PQ12, d=20mm
PQ4
PQ8
PQ12
d=5 mm
d=10mm
d=2.5 mm
(F) (E)(D)
(c) 5X series
(d) 5Q series
Fig. 13. Comparison of woven CFRP notched strength prediction using XFEM (present work) with
experimental data.
0
50
100
150
200
250
300
350
0 100 200 300 400
XFEM Prediction, σ
XFEM(N/m
m2)
Experimental Result, σN (N/mm2)
5X8, d=20mm
5X2
5X4
5X8
d=5 mm
d=10mm
d=2.5 mm
0
50
100
150
200
250
300
0 100 200 300
XFEM Prediction, σ
XFEM(N/m
m2)
Experimental Result, σN (N/mm2)
5Q12, d=20mm
5Q4
5Q8
5Q12
d=5 mm
d=10mm
d=2.5 mm
Tables
Table 1: Material properties of woven fabric system conducted by Kim et. al [4]
Materials
type
Thickness,
t (mm)
vf
(%)
Exx
(GPa)
Eyy
(GPa)
Gxy
vxy Width
(mm)
Un-notched
strength, σo
(MPa)
Fracture
energy,
(kJ/m2)
Glass-
Epoxy
2.0 62 23.6 23.6 4.0 0.11 10 351 12.6
20
40
319
275
21.2
33.1
Glass-
Polyester
2.3 60 21.6 21.6 3.9 0.16 10
30
309
296
14.9
17.5
2.3 44.5 14.7 14.7 2.7 0.17 10
30
218
198
7.50
8.00
Carbon-
Epoxy
1.2 60 56.7 56.7 8.7 0.22 10
20
596
581
30.5
45.0
vf = fiber volume fraction
Exx =longitudinal Young’s modulus
Eyy= transverse Young’s modulus
vxy=Poisson’s ratio
t = laminate thickness
Table 2: Material properties for woven GFRP from Belmonte et. al [6]
Stacking
sequence
t
(mm)
Ex
(GPa)
Ey
(GPa)
vxy
Gxy
(GPa)
σo
(MPa)
Gc
(kJ/m2)
(0°/90°/±45°)s 1.25 15.9 15.9 0.3 6.10 291 20.3
(90°/0°/±45°)s 1.25 16.0 16.0 0.3 6.10 291 20.3
*The unnotched strength and toughness values for the (90°/0°/±45°)s stacking sequence was assumed to be the same
as for the (90°/0°/±45°)s stacking sequence
Table 3: Material properties all woven CFRP from Belmonte et. al [7]
Series Laminate
code
t
(mm)
Ex
(GPa)
Ey
(GPa)
vxy
Gxy
(GPa)
σo
(MPa)
Gc
(kJ/m2)
Plain weave
cross-ply (PX)
PX2 0.51 50.4 50.4 0.103 4.42 481 26.0
PX4 1.03 51.4 51.4 0.092 4.42 527 27.7
PX8 2.03 53.1 53.1 0.083 4.42 538 22.7
Plain weave
quasi-isotropic
(PQ)
PQ4 1.02 37.2 37.2 0.353 13.8 390 21.6
PQ8 2.03 36.8 36.8 0.328 13.9 428 17.9
PQ12 3.17 35.2 35.2 0.297 13.6 372 18.3
5 Harness satin
cross-ply (5X)
5X2 0.81 45.1 45.1 0.077 3.78 419 28.8
5X4 1.60 47.0 47.0 0.062 3.78 535 20.0
5X8 3.15 47.4 47.4 0.053 3.78 456 17.6
Plain weave
quasi-isotropic
(5Q)
5Q4 1.53 34.1 34.1 0.296 13.2 375 19.2
5Q8 3.17 33.5 33.5 0.320 12.7 347 16.8
5Q12 4.59 34.8 34.8 0.322 13.2 370 12.9