PHYSICAL REVIEW D 072009 (2017) … of the antineutrino to neutrino charged-current interaction...
14
Measurement of the antineutrino to neutrino charged-current interaction cross section ratio in MINERvA L. Ren, 1 L. Aliaga, 2,3,§ O. Altinok, 4 L. Bellantoni, 5 A. Bercellie, 6 M. Betancourt, 5 A. Bodek, 6 A. Bravar, 7 H. Budd, 6 T. Cai, 6 M. F. Carneiro, 8 H. da Motta, 9 J. Devan, 2 S. A. Dytman, 1 G. A. Díaz, 6,3 B. Eberly, 1,* E. Endress, 3 J. Felix, 10 L. Fields, 5,11 R. Fine, 6 A. M. Gago, 3 R. Galindo, 12 H. Gallagher, 4 A. Ghosh, 12,9 T. Golan, 6,5 R. Gran, 13 J. Y. Han, 1 D. A. Harris, 5 K. Hurtado, 9,14 M. Kiveni, 5 J. Kleykamp, 6 M. Kordosky, 2 T. Le, 4,15 E. Maher, 16 S. Manly, 6 W. A. Mann, 4 C. M. Marshall, 6,† D. A. Martinez Caicedo, 9,‡ K. S. McFarland, 6,5 C. L. McGivern, 1,§ A. M. McGowan, 6 B. Messerly, 1 J. Miller, 12 A. Mislivec, 6 J. G. Morfín, 5 J. Mousseau, 17,∥ D. Naples, 1 J. K. Nelson, 2 A. Norrick, 2 Nuruzzaman, 15,12 V. Paolone, 1 J. Park, 6 C. E. Patrick, 11 G. N. Perdue, 5,6 M. A. Ramírez, 10 R. D. Ransome, 15 H. Ray, 17 D. Rimal, 17 P. A. Rodrigues, 18,6 D. Ruterbories, 6 H. Schellman, 8,11 C. J. Solano Salinas, 14 M. Sultana, 6 S. Sánchez Falero, 3 E. Valencia, 2,10 T. Walton, 19,§ J. Wolcott, 6,¶ M. Wospakrik, 17 and B. Yaeggy 12 (MINERνA Collaboration) 1 Department of Physics and Astronomy, University of Pittsburgh, Pittsburgh, Pennsylvania 15260, USA 2 Department of Physics, College of William and Mary, Williamsburg, Virginia 23187, USA 3 Sección Física, Departamento de Ciencias, Pontificia Universidad Católica del Perú, Apartado 1761, Lima, Peru 4 Physics Department, Tufts University, Medford, Massachusetts 02155, USA 5 Fermi National Accelerator Laboratory, Batavia, Illinois 60510, USA 6 University of Rochester, Rochester, New York 14627 USA 7 University of Geneva, 1211 Geneva 4, Switzerland 8 Department of Physics, Oregon State University, Corvallis, Oregon 97331, USA 9 Centro Brasileiro de Pesquisas Físicas, Rua Dr. Xavier Sigaud 150, Urca, Rio de Janeiro, Rio de Janeiro 22290-180, Brazil 10 Campus León y Campus Guanajuato, Universidad de Guanajuato, Lascurain de Retana No. 5, Colonia Centro, Guanajuato 36000, Guanajuato México 11 Northwestern University, Evanston, Illinois 60208 12 Departamento de Física, Universidad Técnica Federico Santa María, Avenida Espańa 1680 Casilla 110-V, Valparaíso, Chile 13 Department of Physics, University of Minnesota—Duluth, Duluth, Minnesota 55812, USA 14 Universidad Nacional de Ingeniería, Apartado 31139, Lima, Peru 15 Rutgers, The State University of New Jersey, Piscataway, New Jersey 08854, USA 16 Massachusetts College of Liberal Arts, 375 Church Street, North Adams, Massachusetts 01247, USA 17 University of Florida, Department of Physics, Gainesville, Florida 32611, USA 18 University of Mississippi, Oxford, Mississippi 38677, USA 19 Hampton University, Department of Physics, Hampton, Virginia 23668, USA (Received 17 January 2017; published 14 April 2017) We present measurements of the neutrino and antineutrino total charged-current cross sections on carbon and their ratio using the MINERvA scintillator-tracker. The measurements span the energy range 2–22 GeV and were performed using forward and reversed horn focusing modes of the Fermilab low-energy NuMI beam to obtain large neutrino and antineutrino samples. The flux is obtained using a subsample of charged-current events at low hadronic energy transfer along with precise higher energy external neutrino cross section data overlapping with our energy range between 12–22 GeV. We also report on the antineutrino-neutrino cross section ratio, R CC , which does not rely on external normalization information. Our ratio measurement, obtained within the same experiment using the same technique, benefits from the cancellation of common sample systematic uncertainties and reaches a precision of ∼5% at low energy. Our results for the antineutrino- nucleus scattering cross section and for R CC are the most precise to date in the energy range E ν < 6 GeV. DOI: 10.1103/PhysRevD.95.072009 * Present address: SLAC National Accelerator Laboratory, Stanford, CA 94309, USA. † Present address: Lawrence Berkeley National Laboratory, Berkeley, CA 94720, USA. ‡ Present address: Illinois Institute of Technology, Chicago, IL 60616, USA. § Present address: Fermi National Accelerator Laboratory, Batavia, IL 60510, USA. ∥ Present address: University of Michigan, Ann Arbor, MI 48109, USA. ¶ Present address: Tufts University, Medford, MA 02155, USA. PHYSICAL REVIEW D 95, 072009 (2017) 2470-0010=2017=95(7)=072009(14) 072009-1 © 2017 American Physical Society
-
Upload
nguyenhanh -
Category
Documents
-
view
218 -
download
0
Transcript of PHYSICAL REVIEW D 072009 (2017) … of the antineutrino to neutrino charged-current interaction...
Measurement of the antineutrino to neutrino charged-current interactioncross section ratio in MINERvA
L. Ren,1 L. Aliaga,2,3,§ O. Altinok,4 L. Bellantoni,5 A. Bercellie,6 M. Betancourt,5 A. Bodek,6 A. Bravar,7 H. Budd,6
T. Cai,6 M. F. Carneiro,8 H. da Motta,9 J. Devan,2 S. A. Dytman,1 G. A. Díaz,6,3 B. Eberly,1,* E. Endress,3 J. Felix,10
L. Fields,5,11 R. Fine,6 A. M. Gago,3 R. Galindo,12 H. Gallagher,4 A. Ghosh,12,9 T. Golan,6,5 R. Gran,13 J. Y. Han,1
D. A. Harris,5 K. Hurtado,9,14 M. Kiveni,5 J. Kleykamp,6 M. Kordosky,2 T. Le,4,15 E. Maher,16 S. Manly,6 W. A. Mann,4
C. M. Marshall,6,† D. A. Martinez Caicedo,9,‡ K. S. McFarland,6,5 C. L. McGivern,1,§ A. M. McGowan,6 B. Messerly,1
J. Miller,12 A. Mislivec,6 J. G. Morfín,5 J. Mousseau,17,∥ D. Naples,1 J. K. Nelson,2 A. Norrick,2 Nuruzzaman,15,12
V. Paolone,1 J. Park,6 C. E. Patrick,11 G. N. Perdue,5,6 M. A. Ramírez,10 R. D. Ransome,15 H. Ray,17 D. Rimal,17
P. A. Rodrigues,18,6 D. Ruterbories,6 H. Schellman,8,11 C. J. Solano Salinas,14 M. Sultana,6 S. Sánchez Falero,3
E. Valencia,2,10 T. Walton,19,§ J. Wolcott,6,¶ M. Wospakrik,17 and B. Yaeggy12
(MINERνA Collaboration)
1Department of Physics and Astronomy, University of Pittsburgh, Pittsburgh, Pennsylvania 15260, USA2Department of Physics, College of William and Mary, Williamsburg, Virginia 23187, USA
3Sección Física, Departamento de Ciencias, Pontificia Universidad Católica del Perú,Apartado 1761, Lima, Peru
4Physics Department, Tufts University, Medford, Massachusetts 02155, USA5Fermi National Accelerator Laboratory, Batavia, Illinois 60510, USA
6University of Rochester, Rochester, New York 14627 USA7University of Geneva, 1211 Geneva 4, Switzerland
8Department of Physics, Oregon State University, Corvallis, Oregon 97331, USA9Centro Brasileiro de Pesquisas Físicas, Rua Dr. Xavier Sigaud 150,
Urca, Rio de Janeiro, Rio de Janeiro 22290-180, Brazil10Campus León y Campus Guanajuato, Universidad de Guanajuato, Lascurain de Retana No. 5,
Colonia Centro, Guanajuato 36000, Guanajuato México11Northwestern University, Evanston, Illinois 60208
12Departamento de Física, Universidad Técnica Federico Santa María,Avenida Espańa 1680 Casilla 110-V, Valparaíso, Chile
13Department of Physics, University of Minnesota—Duluth, Duluth, Minnesota 55812, USA14Universidad Nacional de Ingeniería, Apartado 31139, Lima, Peru
15Rutgers, The State University of New Jersey, Piscataway, New Jersey 08854, USA16Massachusetts College of Liberal Arts, 375 Church Street, North Adams, Massachusetts 01247, USA
17University of Florida, Department of Physics, Gainesville, Florida 32611, USA18University of Mississippi, Oxford, Mississippi 38677, USA
19Hampton University, Department of Physics, Hampton, Virginia 23668, USA(Received 17 January 2017; published 14 April 2017)
We present measurements of the neutrino and antineutrino total charged-current cross sections oncarbon and their ratio using the MINERvA scintillator-tracker. The measurements span the energy range2–22 GeVand were performed using forward and reversed horn focusing modes of the Fermilab low-energyNuMI beam to obtain large neutrino and antineutrino samples. The flux is obtained using a subsample ofcharged-current events at low hadronic energy transfer alongwith precise higher energy external neutrino crosssection dataoverlappingwith our energy range between12–22GeV.Wealso report on the antineutrino-neutrinocross section ratio, RCC, which does not rely on external normalization information. Our ratio measurement,obtained within the same experiment using the same technique, benefits from the cancellation of commonsample systematic uncertainties and reaches a precision of∼5% at low energy. Our results for the antineutrino-nucleus scattering cross section and for RCC are the most precise to date in the energy range Eν < 6 GeV.
DOI: 10.1103/PhysRevD.95.072009
*Present address: SLAC National Accelerator Laboratory, Stanford, CA 94309, USA.†Present address: Lawrence Berkeley National Laboratory, Berkeley, CA 94720, USA.‡Present address: Illinois Institute of Technology, Chicago, IL 60616, USA.§Present address: Fermi National Accelerator Laboratory, Batavia, IL 60510, USA.∥Present address: University of Michigan, Ann Arbor, MI 48109, USA.¶Present address: Tufts University, Medford, MA 02155, USA.
PHYSICAL REVIEW D 95, 072009 (2017)
2470-0010=2017=95(7)=072009(14) 072009-1 © 2017 American Physical Society

I. INTRODUCTION
Long-baseline oscillation experiments [1,2], which aimto precisely measure neutrino oscillation parameters andconstrain CP violation, will make use of neutrino andantineutrino beams in the few-GeV neutrino energy (Eν)range. For appropriate baselines and energies, neutrinooscillation phenomena produce distinct shape signatureson either νμ → νe or ν̄μ → ν̄e appearance probabilities,which, in matter, depend on the CP violating phase(δCP) and the (unknown) sign of the mass splitting term,Δm2
31. Variations of oscillation parameters over theirallowed ranges produce degenerate effects on the appear-ance probabilities, complicating these measurements.Uncertainties in poorly constrained cross section compo-nents in this energy range produce further competing shapeeffects on the measured visible energy spectra used toextract the oscillation probabilities. Utilizing beams of bothneutrinos and antineutrinos allows a measurement of theCP asymmetry [3], ACP, defined as,
ACP ¼ Pðνμ → νeÞ − Pðν̄μ → ν̄eÞPðνμ → νeÞ þ Pðν̄μ → ν̄eÞ
; ð1Þ
which can be written in terms of probability ratios.Reducing uncertainties on the cross sections, and inparticular their ratio, RCC ¼ σν̄=σν, to which ACP isprimarily sensitive, is essential to achieving ultimatesensitivity in oscillation measurements.The results presented here use neutrino and antineutrino
events analyzed in the MINERvA scintillator (CH) detectorexposed to the NuMI (Neutrinos at the Main Injector)beam. Total cross sections are extracted from selectedcharged-current (CC) event samples, and incident fluxesare measured in situ using a subsample of these events atlow-ν (ν is the energy transferred to the hadronic system) asin our previous result [4]. The ratio, RCC, is obtained byforming ratios of measured event rates in the two beammodes. Since the measurements are performed using thesame apparatus and flux measurement technique, commondetector and model related systematic uncertainties cancelin the ratio, resulting in a precise measurable quantity thatcan be leveraged to tune models and improve knowledgeof interaction cross sections.While knowledge of neutrino cross sections has recently
been improved in the low-energy region, there is a dearthof precise antineutrino cross section measurements at lowenergies (below 10 GeV) [5]. The cross section ratio, RCC,has recently been measured by MINOS [6] on iron with aprecision of ∼7% at 6 GeV. At lower energies, only onededicated measurement [7] (on CF3Br) has been per-formed, with a precision of ∼20%. Measurements on arange of nuclear targets are needed to constrain nucleardependence which currently contributes significantly tomodeling uncertainty. While much of the existing data is on
an iron nucleus, this result provides data on a light nucleartarget (carbon). We improve on the precision of both theantineutrino cross section and RCC (by nearly a factor of 4)at low energies (2–6 GeV).Systematic uncertainties in our measured cross sections
are dominated at the lowest energies by the limited knowl-edge of cross section model components at low hadronicenergy transfer (≲1 GeV). The current suite of neutrinogenerators [8–14] are known to be deficient in modelingnuclear effects and detailed exclusive process rates at lowenergy transfer. To allow our measurement to be updatedwith future models, we also present the measured rates(corrected for detector effects and backgrounds) with theprimary model-dependent terms factorized.We have previously reported an inclusive CC cross
section measurement [4] using the same data sample andmethod to constrain the flux shape with energy. The resultspresented here use an updated cross sectionmodelwhich hasbeen tuned to improve agreement with our data in the low-νregion [15] as described in Sec. III. The current work alsoprovides a precise measurement of the ratio, RCC, as well asthe measured model-independent rates for re-extractingcross sections with alternative generator-level models. Inaddition, the antineutrino flux normalization methodemployed here improves the antineutrino cross sectionprecision by a factor of 1.5–1.9, which for the previousresult was dominated by the large uncertainty (∼10%) on themodel-based antineutrino normalization constraint.
II. MINERVA EXPERIMENT
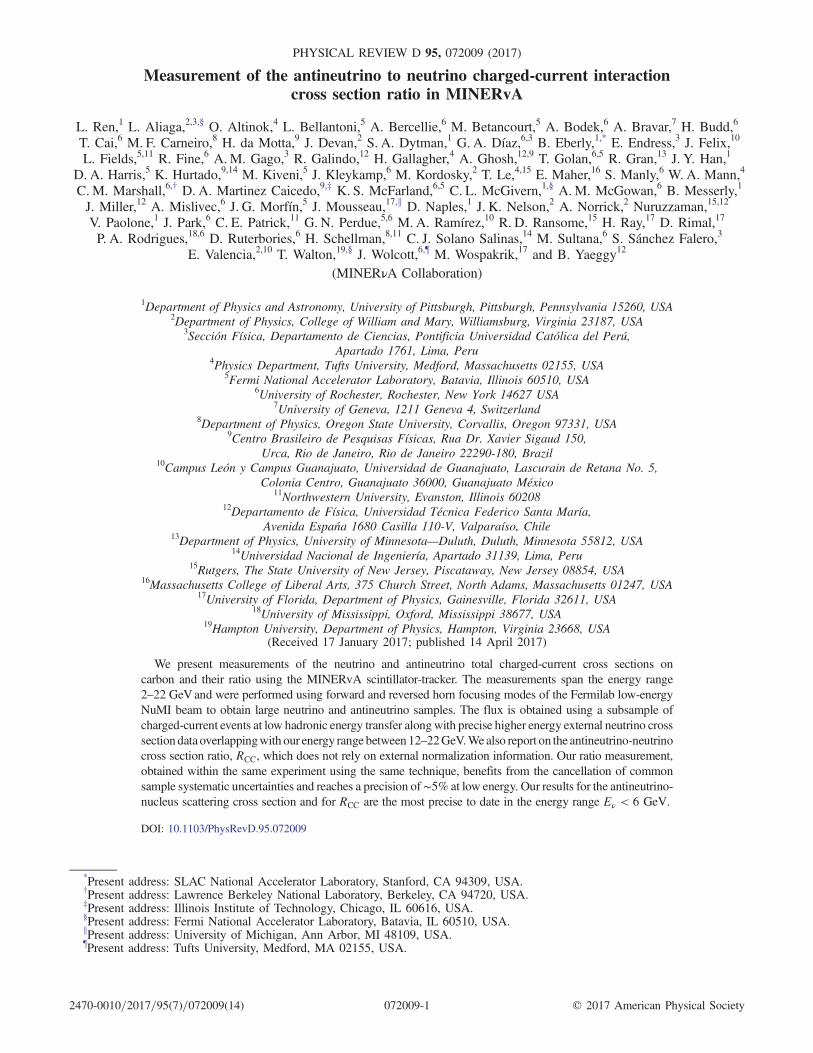
Muon neutrinos and antineutrinos are produced in NuMIwhen 120 GeV protons from the Fermilab Main Injectorstrike a graphite target. Details of the NuMI beam line canbe found in Ref. [16]. A system of two magnetic horns isused to focus emerging secondary pions and kaons, whichare allowed to decay in the 675 m space immediatelydownstream of the target. We analyze exposures in twolow-energy NuMI beam modes. The forward horn current(FHC) mode sets the horn polarity to focus positivelycharged secondary beam particles, which results in aprimarily muon neutrino beam (10.4% muon antineutrinocomponent) with 3 GeV peak energy. If the polarity of bothhorns is reversed (RHC mode) the resulting beam has alarge fraction of muon antineutrinos with the same peakbeam energy and a sizable muon neutrino component(17.7%) that extends to high energies. Figure 1 showsthe simulated fluxes [17] for muon neutrinos and antineu-trinos in each mode. We use samples collected betweenMarch 2010 and April 2012 corresponding to exposuresof 3.20 × 10²⁰ protons on target (POT) in FHC and1.03 × 1020 POT in RHC beam modes.TheMINERvA fine-grained scintillator tracking detector
[18] is situated approximately 1 km downstream of theNuMI target. The active detector consists of triangularscintillator strips with height 1.7 cm and base 3.3 cm
L. REN et al. PHYSICAL REVIEW D 95, 072009 (2017)
072009-2
arranged into hexagonal X, U and V planes (at 60° withrespect to one another) and giving single-plane positionresolution of about 2.5 mm. We use events originating inthe 6 ton fully active scintillator region that is primarilycomposed of carbon nuclei (88.5% carbon, 8.2% hydrogen,2.5% oxygen and a number of other nuclei that make up theremaining fraction, by mass). We report results on a carbontarget by correcting for the MINERvA target proton excess(see Sec. VI).The downstream most plane of MINERvA is positioned
2 m upstream of the magnetized MINOS Near Detector[19] (MINOS ND), which is used to contain and momen-tum analyze muons exiting the MINERvA active detectorvolume. The detector geometry changes from samplingafter every iron plane (2.54 cm thickness) to samplingevery five iron-scintillator units after the first 7.2 m. Thisproduces features in the measured muon momentumdistribution and acceptance which will be discussedbelow. For the FHC (RHC) beam mode the MINOS NDtoroidal magnetic field is set to focus negatively (positively)charged muons. Measurement of the direction of trackcurvature is used to tag the charge-sign of tracks, which iscrucial to reducing the large wrong-sign beam backgroundin the RHC mode.
III. MONTE CARLO SIMULATION
We use a custom MINERvA -tuned modification ofGENIE 2.8.4 [20,21] referred to here as “GENIE-Hybrid”as input to simulated event samples as well as for the modelcorrection terms needed to obtain our default cross sectionresults. This model incorporates improvedmodeling of low-ν cross section components and is similar to that describedin Ref. [15]. GENIE 2.8.4 uses a modified version of therelativistic Fermi gas model of the nucleus, which isinadequate to precisely describe neutrino scattering dataat low three-momentum transfer such as quasielastic (QE)and Δð1232Þ resonance production. For QE events, we usethe random phase approximation (RPA) [22] model, whichincludes long-range nucleon-nucleon correlations to more
accurately characterize scattering from a nucleon boundin a nucleus. We also include the Valencia “2p2h” modelcontribution [23] of the neutrino interactingwith a correlatednucleon pair that populates the energy transfer regionbetween the QE and Δ-resonance events. Since even thisdoes not adequately cover the observed signal excess in thisregion [15], we include additional modeling uncertaintiesfrom this contribution. In addition, we reduce the GENIEsingle pion nonresonant component1 with initial state νþ n(or ν̄þ p) by 57%, which has been shown to improveagreement with observed deuterium data [24].
IV. TECHNIQUE OVERVIEW
Events studied in this analysis are categorized ascharged-current events by the presence of a long trackoriginating from the primary interaction vertex whichextrapolates into the MINOS ND. The inclusive sample,
Nνðν̄ÞCC ðEÞ, is the number of measured charged current events
in a neutrino energy bin E. We define Rνðν̄ÞðEÞ, which isrelated to the fiducial cross section, as
Rνðν̄ÞðEÞ ¼ ðNνðν̄ÞCC ðEÞ − Bνðν̄Þ
CC ðEÞÞ × Aνðν̄Þ;DETCC ðEÞ
ðFνðν̄ÞðEÞ − Bνðν̄ÞΦ ðEÞÞ × Aνðν̄Þ
Φ ðEÞ; ð2Þ
where superscript ν (ν̄) refers to neutrino (antineutrino).Fνðν̄ÞðEÞ is the “flux sample” obtained from a subset of
Nνðν̄ÞCC ðEÞ with low hadronic energy (discussed below). The
terms Bνðν̄ÞCC ðEÞ and Bνðν̄Þ
Φ ðEÞ are backgrounds due to neutralcurrent and wrong-sign beam contamination in the inclu-
sive and flux samples, respectively. Terms Aνðν̄Þ;DETCC ðEÞ and
Aνðν̄ÞΦ ðEÞ correct the cross section and flux respective
samples for detector resolution and bin-migration effects.
The numerator of Eq. (2), Γνðν̄ÞCC ðEÞ,
Neutrino Energy (GeV)0 5 10 15 20 25 30
PO
T6
/GeV
/10
2N
eutr
inos
/m
-210
-110
1
10
210 FHCNeutrino
Antineutrino
Neutrino Energy (GeV)0 5 10 15 20 25 30
PO
T6
/GeV
/10
2N
eutr
inos
/m
-210
-110
1
10
210 RHCAntineutrino
Neutrino
FIG. 1. Predicted incident neutrino fluxes at the MINERvA detector in FHC (left) and RHC (right) beam modes from Ref. [17].
1The corresponding GENIE parameter is RνnCC1πbkg for neutrino
and Rν̄pCC1πbkg for antineutrino [21].
MEASUREMENT OF THE ANTINEUTRINO TO NEUTRINO … PHYSICAL REVIEW D 95, 072009 (2017)
072009-3

Γνðν̄ÞCC ðEÞ ¼ ðNνðν̄Þ
CC ðEÞ − Bνðν̄ÞCC ðEÞÞ × Aνðν̄Þ;DET
CC ðEÞ; ð3Þ
is the fiducial event rate and is tabulated below. To obtainthe incident beam flux, we employ the “low-ν” methoddescribed previously [4,6,25,26]. In brief, the differentialdependence of the cross section in terms of ν is expandedin ν=E as
dσν;ν̄
dν¼ A
�1þ Bν;ν̄
Aν
E−Cν;ν̄
Aν2
2E2
�; ð4Þ
where E is the incident neutrino energy. The coefficients A,Bν;ν̄, and Cν;ν̄ depend on integrals over structure functions(or form factors, in the low energy limit).
A ¼ G2FMπ
ZF2ðxÞdx; ð5Þ
Bν;ν̄ ¼ −G2
FMπ
ZðF2ðxÞ ∓ xF3ðxÞÞdx; ð6Þ
and
Cν;ν̄ ¼ Bν;ν̄ −G2
FMπ
ZF2ðxÞ
�1þ 2Mx
ν
1þ RL−Mxν
− 1
�dx: ð7Þ
In the limit of ν=E → 0, the B and C terms vanish andboth cross sections approach A [defined in Eq. (5)], whichis the same for neutrino and antineutrino probes scatteringoff an isoscalar target (up to a small correction for quarkmixing). We count events below a maximum ν value (ν0)and apply a model-based correction
Sνðν̄Þ;ν0ðEÞ ¼ σνðν̄Þðν0; EÞσνðν̄Þðν0; E → ∞Þ ; ð8Þ
to account for ν=E and ðν=EÞ2 terms in Eq. (4). Thenumerator in Eq. (8) is the value of the integrated crosssection below our chosen ν0 cut at energy E, and thedenominator is its value in the high energy limit. Forantineutrinos, the structure functions inEq. (6) add, resultingin a larger energy dependent correction term than for theneutrino casewhere they are subtracted and partially cancel.The flux is then proportional to the corrected low-ν rate
Φνðν̄ÞðEÞ ∝ ðFνðν̄ÞðEÞ − Bνðν̄ÞΦ ðEÞÞ × Aνðν̄Þ
Φ ðEÞSνðν̄Þðν0; EÞ
: ð9Þ
We obtain a quantity that is proportional to the total CCcross section,
σνðν̄ÞCC ðEÞ ∝ Rνðν̄Þ × Sνðν̄Þðν0; EÞ × Aνðν̄Þ;KINCC ðEÞ; ð10Þ
by applying a correction, Aνðν̄Þ;KIN, for regions outside ofour experimental acceptance. The term Aνðν̄Þ;KIN (discussedin Sec. VA) is computed from a generator level
Monte Carlo model. The rates, Rν and Rν̄, in each beammode are used to obtain the ratio
RCCðEÞ¼σν̄CCðEÞσνCCðEÞ
¼Rν̄
Rν
�Aν̄;KINCC ðEÞ×Sν̄ðν0;EÞ×Hν̄ðν0Þ
Aν;KINCC ðEÞ×Sνðν0;EÞ×Hνðν0Þ
�:
ð11Þ
The termsHν̄ðν0Þ andHνðν0Þ, which supply the absoluteflux normalization in the low-ν method for neutrinos andantineutrinos, respectively, are related in the StandardModel and nearly cancel in this ratio. The measurementsare performed using the same detector and beam line,which reduces the effect of some experimental uncertain-ties. The ratio measured in this technique also benefits fromcancellation of correlated model terms; this cancellationreduces the modeling component of the systematic uncer-tainty relative to that for either neutrino or antineutrinomeasured cross section.
V. EVENT RECONSTRUCTION AND SELECTION
Neutrino events are reconstructed using timing andspatial information of energy deposited in the MINERvAscintillator. Hits are grouped in time into “slices” and withina slice, spatially into “clusters” which are used along withpattern recognition to identify tracks. The CC-inclusive
event sample, denoted Nνðν̄ÞCC ðEÞ, is selected by requiring a
primary track matched into the MINOS ND. MINOS-matched track momentum, Eμ, is reconstructed using eitherrange, for tracks that stop and deposit all of their energy intheMINOSND, or the measured curvature of the trajectory,for tracks which exit the MINOS ND. Tracks measuredfrom range in MINOS have a momentum resolution oforder 5% while those measured from curvature typicallyhave a resolution of order 10%. Clusters not associated withthe MINOS-matched muon track form the recoil systemand are calorimetrically summed to obtain the hadronicenergy, ν. Neutrino energy is constructed from the sumEν ¼ Eμ þ ν. An event vertex is assigned by tracking themuon upstream through the interaction region until noenergy is seen in an upstream cone around the track. Thevertex is required to be within the fiducial region of thescintillator.Additional track requirements are applied to improve
energy resolution and acceptance. The track fitting pro-cedure in the MINOS spectrometer yields a measurementof the momentum with an associated fractional uncertainty,which is required to be less than 30%. The charge-sign isdetermined by measuring the track curvature and isrequired to be negative for tracks in FHC mode andpositive for those in RHC mode. We also require the muontrack candidate to have a minimum energy Eμ > 1.8 GeVand a maximum angle θμ < 0.35 rad (20°) with respect tothe beam direction in the lab frame. The portion of the track
L. REN et al. PHYSICAL REVIEW D 95, 072009 (2017)
072009-4
in MINOS is required to not pass through the uninstru-mented coil hole region. Events in which the muon trackends less than 80 cm from the center of the coil hole arealso removed. This removes 0.8% (0.4%) events from theneutrino (antineutrino) CC-inclusive sample.The flux-extraction technique uses Fνðν̄ÞðEÞ, the number
of CC-inclusive events in an energy bin below a maximumν value. We choose this maximum value (ν0) to vary withenergy, keeping the energy dependent contributions inEq. (4) small (≲0.1 for neutrinos and ≲0.2 for antineu-trinos) in the region where modeling uncertainties aresizable (Eν < 7 GeV), while at higher energies wherewe normalize to external data (12–22 GeV), it is increasedto improve statistical precision. The values are ν0¼0.3GeVfor Eν < 3 GeV, ν0 ¼ 0.5 GeV for 3 < Eν < 7 GeV,ν0 ¼ 1 GeV for 7 < Eν < 12 GeV and ν0 ¼ 2 GeV forEν > 12 GeV. The inclusive and flux sample overlap isless than 50% (60%) for neutrinos (antineutrinos).
A. Event rates
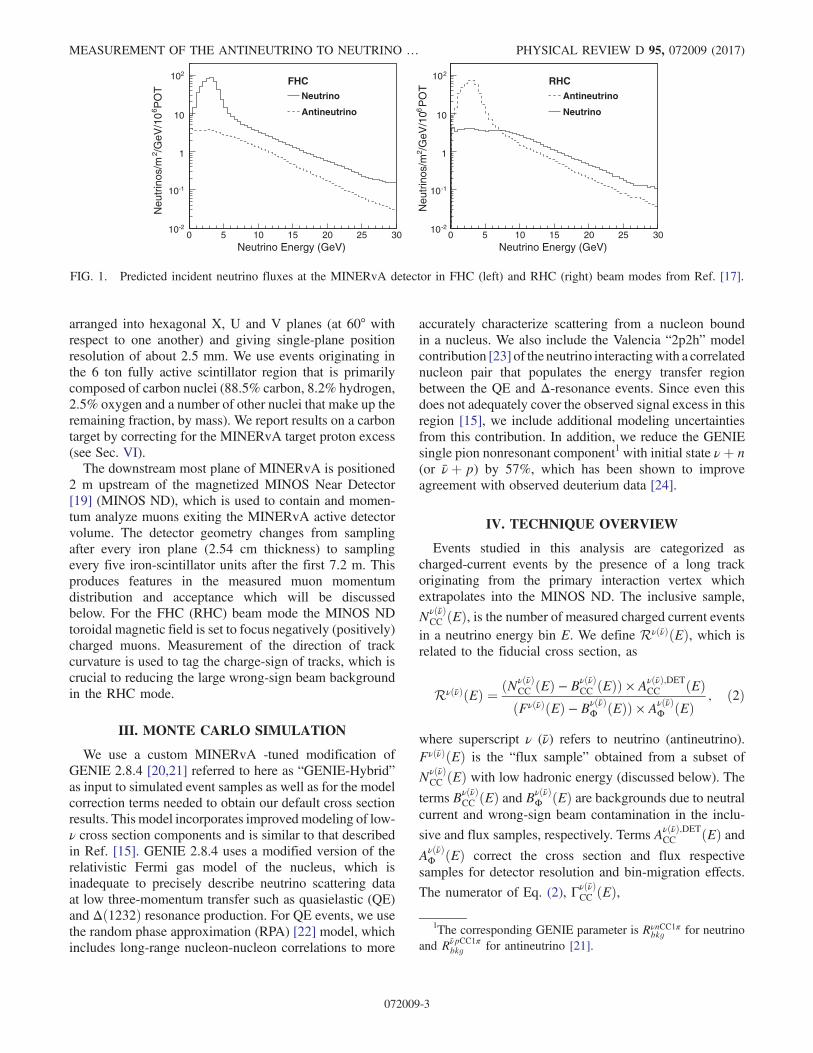
Figure 2 shows the measured inclusive and flux samplerates in the two beam modes. The fiducial event rate,
Γνðν̄ÞCC ðEÞ, [Eq. (3)] is determined by removing sample
backgrounds and applying corrections for experimental
acceptance. The components are described below andtabulated in Table I.Backgrounds are dominated by the contribution from
tracks with misidentified charge-sign which arise from thewrong-sign beam flux component (wrong-sign contamina-tion). The background peaks at high energies in the RHCmode (about 4% above 10 GeV in the inclusive sample).The charge-sign and track quality requirements effectivelyreduce the wrong-sign contamination. The remaining back-ground is estimated using the simulated wrong-sign beamflux shown in Fig. 1. The neutral current contribution isnegligible (≪ 1%) in both beam modes.We correct for the experimental acceptance effects using
a full detector simulation along with a tuned version ofGENIE Monte Carlo (GENIE-Hybrid) which is describedin Sec. III. We separate experimental acceptance terms into
two contributions. The term Aνðν̄Þ;DETCC , which represents the
ratio of the number of events generated in a given neutrinoenergy bin to the number reconstructed in our event sample,accounts for detector resolution smearing and bin migrationeffects. Final state interaction (FSI) effects, which arisefrom reinteractions of emerging final state particles in thetarget nucleus, change the measured hadronic energy and
also affect Aνðν̄Þ;DETCC . This bin migration effect is included
Neutrino Energy (GeV)0 2 4 6 8 10 12 14 16 18 20 22
Eve
nts
/ GeV
0
10000
20000
30000
40000
50000
Inclusive sample
Flux sample
FHC Neutrino
Neutrino Energy (GeV)0 2 4 6 8 10 12 14 16 18 20 22
Eve
nts
/ GeV
0
2000
4000
6000
8000
10000
12000
Inclusive sample
Flux sample
RHC Antineutrino
FIG. 2. Neutrino inclusive (Nνðν̄ÞCC ) and low-ν flux sample (Fνðν̄Þ) yields for FHC neutrino (left) and RHC antineutrino (right) modes.
The dashed lines are plotted at the values where the flux sample ν0 is changed. Statistical errors are too small to be visible on the points.
TABLE I. Neutrino and antineutrino inclusive, Nνðν̄ÞCC , and flux sample, Fνðν̄Þ, yields along with corresponding background
contributions (Bνðν̄ÞCC and Bνðν̄Þ
Φ , respectively). The acceptance term, Aνðν̄Þ;DETCC , is applied to obtain the fiducial event rate, Γνðν̄Þ
CC ðEÞ,from Eq. (3).
ν0 (GeV) E (GeV) NνCC Bν
CC Aν;DETCC Fν Bν
Φ Aνϕ N ν̄
CC Bν̄CC Aν̄;DET
CC Fν̄ Bν̄Φ Aν̄
ϕ
0.3 2–3 20660 53 2.38 11493 29 1.94 5359 18 1.99 3673 6 1.603–4 44360 61 2.30 25530 19 1.76 10133 25 1.94 6560 4 1.56
0.5 4–5 29586 65 1.92 11765 13 1.45 5955 24 1.65 2871 2 1.365–7 32026 170 1.70 8046 29 1.34 5284 74 1.47 1764 4 1.27
1.0 7–9 23750 171 1.86 6980 32 1.59 3261 102 1.58 1224 6 1.509–12 29161 207 1.95 6165 31 1.60 3400 141 1.66 1007 9 1.5312–15 24093 158 1.94 7438 39 1.42 2496 115 1.63 1033 9 1.42
2.0 15–18 19011 104 1.85 5041 17 1.28 1690 77 1.48 595 6 1.2318–22 18475 98 1.78 3826 14 1.25 1418 72 1.44 427 5 1.23
MEASUREMENT OF THE ANTINEUTRINO TO NEUTRINO … PHYSICAL REVIEW D 95, 072009 (2017)
072009-5

in our Monte Carlo simulation model. The term Aνðν̄ÞΦ ðEÞ is
defined similarly with an additional maximum ν require-
ment. The fiducial event rate depends only on Aνðν̄Þ;DETCC and
Aνðν̄ÞΦ ðEÞ and is nearly generator model independent. The
kinematic acceptance, AKINCC , defined as the ratio of all
generated events in a given bin to those with muon energyEμ > 1.8 GeV and angle θμ < 0.35 rad, must be applied toobtain a total cross section from the fiducial event rate. Thisterm is computed directly from a generator level model. It istabulated for our default model along with other model-dependent corrections in Table III. Nearly all muons in theselected flux sample automatically pass the kinematic cuts(except for a small fraction in the first energy bin which iscomputed to be 5.1% using the GENIE-Hybrid model and4.9% using NuWro [14]). We therefore only report oneacceptance, AΦ, which includes the kinematic contributionin the flux sample.Figure 3 shows the size of the acceptance correction terms
for each sample. Kinematic acceptance is most important atlowest energies (primarily below 3 GeV), which have thelargest fraction of events belowmuon energy threshold. Thekinematic thresholds result in poorer overall acceptance atall energies for neutrinos compared with antineutrinos. This
is a consequence of the different inelasticity (y ¼ ν=Eν)dependence of the two cross sections, which produce aharder muon energy distribution for antineutrinos withcorrespondingly more forward-going muons. The fluxsample with the ν < ν0 requirement also selects a hardermuon spectrum and results in better corresponding accep-tance relative to the inclusive sample in both modes. Thedetector acceptance is above 50% for neutrino energiesgreater than 5 GeV. The shapes of 1=ADET
CC and 1=AΦ areaffected by the MINOS ND sampling geometry as well asthe two methods of measuring momentum (from range andfrom curvature), which have different resolution. The dip inthe 6–10 GeV region results from the contained (range)momentum sample decreasing while the curvature sample,which has poorer resolution, is becoming dominant.
VI. LOW-ν FLUX EXTRACTION
We obtain the shape of the flux with energy from thecorrected flux yield using Eq. (9). The low-ν correctionterm is computed from Eq. (8) using the GENIE-Hybridmodel as shown in Fig. 4 (also in Table III).The neutrino flux is normalized using external
neutrino cross section data overlapping our sample in thenormalization bin, EN , (neutrino energies 12–22 GeV).
Neutrino Energy (GeV)0 2 4 6 8 10 12 14 16 18 20 22
1/A
0
0.2
0.4
0.6
0.8
1
CCDET 1/A
CCKIN 1/A
φ 1/A
FHC Neutrino
Neutrino Energy (GeV)0 2 4 6 8 10 12 14 16 18 20 22
1/A
0
0.2
0.4
0.6
0.8
1
CCDET 1/A
CCKIN 1/A
φ 1/A
RHC Antineutrino
FIG. 3. Reciprocal of acceptance components (1=ADETCC ,1=AKIN) for cross section and (1=AΦ) for flux samples of FHC neutrinos (left)
and RHC antineutrinos (right).
Neutrino Energy (GeV)0 2 4 6 8 10 12 14 16 18 20 22
(E)
νS
0.95
1.00
1.05
1.10
1.15Neutrino
<0.3 GeVν<0.5 GeVν<1 GeVν<2 GeVν
Neutrino Energy (GeV)0 2 4 6 8 10 12 14 16 18 20 22
(E)
νS
0.7
0.8
0.9
1
Antineutrino
<0.3 GeVν<0.5 GeVν<1 GeVν<2 GeVν
FIG. 4. GENIE-hybrid based low-ν corrections, Sνðν̄Þðν0; EÞ, for neutrinos (left) and antineutrinos (right).
L. REN et al. PHYSICAL REVIEW D 95, 072009 (2017)
072009-6

The NOMAD [27] measurement is singled out because itis the only independent result on the same nuclear target(carbon) in this range. The weighted average value of theNOMAD from 12–22 GeV is σνN=EN ¼ ð0.699� 0.025Þ×10−38 cm2=GeV. We compute a weighted average valuefor our measured unnormalized neutrino cross section,σν;ν0ðENÞ, from our points (E ¼ 13.5, 16.5, and 20 GeV)in the normalization bin from Eq. (10). We obtain anormalization constant for each ν0 subsample,Hνðν0Þ, using
Hνðν0Þ ¼σν;ν0ðENÞ × IνisoðENÞ
σνN; ð12Þ
where the isoscalar correction, Iiso, accounts for the protonexcess (fp ¼ 54%, fn ¼ 1 − fp) in the MINERvA targetmaterial obtained from
Iνðν̄Þiso ðEÞ ¼�
σνðν̄Þp ðEÞ þ σνðν̄Þn ðEÞfpσ
νðν̄Þp ðEÞ þ fnσ
νðν̄Þn ðEÞ
�
×
�fpσ
νðν̄Þp ðν0; EÞ þ fnσ
νðν̄Þn ðν0; EÞ
σνðν̄Þp ðν0; EÞ þ σνðν̄Þn ðν0; EÞ
�: ð13Þ
Here, σνðν̄ÞpðnÞðEÞ is the neutrino (antineutrino) cross sectionon a proton (neutron) in carbon and σνðν̄ÞpðnÞðν0; EÞ is its valuefor ν < ν0. This correction, (see Table III), is negligibleabove 6 GeV and increases up to 4.2% in the lowestenergy bin.In the low-ν flux extraction method, neutrino and
antineutrino cross sections in the low inelasticity limity → 0 are related, and approach the same constant value[Eq. (4)] for an isoscalar target in the absence of quarkmixing. We make use of this to link the normalization ofour low-ν antineutrino flux sample to that for neutrinos andtherefore do not require external antineutrino cross sectionvalues. The weighted average (isoscalar corrected) unnor-malized antineutrino cross section, σν̄;ν0ðENÞ × Iν̄isoðENÞ, iscomputed in the normalization bin for each ν0 value. It islinked to that for neutrinos by applying a small correctiondue to quark mixing, which is computed from a generatormodel
Gðν0Þ ¼σν̄ðν0; E → ∞Þσνðν0; E → ∞Þ : ð14Þ
TABLE II. Neutrino and antineutrino flux data and corrections needed to apply the normalization technique described in the text. The
flux sample yield, Fνðν̄Þ, along with corresponding background contribution, Bνðν̄ÞΦ , and acceptance correction, Aνðν̄Þ
ϕ , are ν0 dependentand are used to compute the unnormalized cross section.
ν0 (GeV) E (GeV) FνðEÞ BνΦðEÞ Aν
ϕðEÞ Hνðν0Þ Fν̄ðEÞ Bν̄ΦðEÞ Aν̄
ϕðEÞ αðν0Þ0.3 13.50 1315 10 1.18 247 1 1.040.3 16.50 863 4 1.12 3.83� 0.091 147 1 0.94 1.126� 0.0670.3 20.00 662 4 1.05 110 1 0.960.5 13.50 2415 15 1.28 385 2 1.210.5 16.50 1613 7 1.19 1.96� 0.035 224 1 1.09 1.056� 0.0510.5 20.00 1190 4 1.16 159 2 1.121.0 13.50 4419 25 1.36 636 5 1.331.0 16.50 2967 12 1.25 1.02� 0.014 373 3 1.18 1.005� 0.0391.0 20.00 2235 8 1.21 260 3 1.192.0 13.50 7438 39 1.42 1033 9 1.422.0 16.50 5041 17 1.28 0.574� 0.006 595 6 1.23 12.0 20.00 3826 14 1.25 427 5 1.23
TABLE III. Neutrino and antineutrino cross section model dependent corrections computed using the GENIE-Hybrid model.
Sνðν̄Þðν0; EÞ is defined in Eq. (8), and Iνðν̄Þiso ðν0; EÞ is defined in Eq. (13).
E(GeV) Aν;KINCC ðEÞ Sνðν0; EÞ Iνisoðν0; EÞ Aν̄;KIN
CC ðEÞ Sν̄ðν0; EÞ Iν̄isoðν0; EÞ2.5 3.094 1.096 0.954 1.883 0.801 1.0423.5 1.981 1.040 0.982 1.293 0.809 1.0164.5 1.746 1.032 0.983 1.185 0.850 1.0166 1.559 1.023 0.984 1.118 0.884 1.0168 1.423 1.007 0.998 1.076 0.869 1.00510.5 1.326 1.005 0.998 1.060 0.899 1.00513.5 1.253 0.995 0.999 1.044 0.875 1.00416.5 1.207 0.992 0.999 1.035 0.893 1.00420 1.171 0.995 0.999 1.032 0.912 1.004
MEASUREMENT OF THE ANTINEUTRINO TO NEUTRINO … PHYSICAL REVIEW D 95, 072009 (2017)
072009-7

This correction, which is dominated by a term that isproportional to V2
us≈0.05, is negligible for ν0<0.5GeV,1.5% for ν0 < 1 GeV and 2.6% for ν0 < 2 GeV. We obtaina normalization factor for the ν0 ¼ 2 GeV subsample fromthe corrected neutrino normalization, Hν̄ ¼ Hν=G. Ratherthan treating each low-ν subsample independently, wetake the ν0 ¼ 2 GeV value as a standard and relativelynormalize among different flux samples to make themmatch the same value in the normalization bin. We obtainthe normalization for each ν0 sample from Hν̄ðν0Þ ¼Hνðν0Þ=Gðν0Þ=αðν0Þ, where αðν0Þ is the factor neededto adjust the measured antineutrino cross section at EN toour measured value for ν0 ¼ 2 GeV. This technique makesuse of additional information in our low-ν data to com-pensate for unmodeled cross section contributions orenergy dependent systematic uncertainties in that region.The values of α (given in Table II) range from 1.0 to 1.126.The size of the correction in the lowest energy bin iscomparable to the size of the 1σ systematic error in the bin(9%). The additional statistical error from α is includedin the result, and it dominates the statistical error in theantineutrino flux and RCC below 7 GeV.
VII. SYSTEMATIC UNCERTAINTIES
We consider systematic uncertainties that arise frommany sources including muon and hadron energy scales,reconstruction-related effects, cross section modeling,backgrounds, and normalization uncertainties. In eachcase, we evaluate the effect by propagating it through allthe steps of the analysis, including a recalculation of theabsolute normalization. The normalization techniquemakes the results insensitive to effects that change theoverall rates.The muon energy scale uncertainty is evaluated by
adding the 2% range uncertainty [19] in quadrature withthe uncertainty in momentum measured from curvature(2.5% for Pμ < 1 GeV and 0.6% for Pμ > 1 GeV), whichis dominated by knowledge of the MINOS ND magneticfield [18]. A small component of energy loss uncertaintyin MINERvA is also taken into account. The hadronicresponse uncertainty is studied by incorporating an indi-vidual response uncertainty for each final state particleproduced at the hadronic vertex in the neutrino interaction.A small-scale functionally equivalent detector in a testbeam [28] was used to assess energy responses and theiruncertainties, which are found to be 3.5% for protons,and 5% for π� and K. In addition to the test beam study,information from an in situMichel electron and π0 samplesis used to determine the 3% uncertainty in electromagneticresponse. Low-energy neutrons have the largest uncertain-ties (25% for kinetic energies < 50 MeV and 10%–20%for > 50 MeV), which are estimated by benchmarkingGEANT4 [29] neutron cross sections against nA → pXmeasurements in this energy range. The energy scaleuncertainties are the most important components of the
flux shape measurement, but these largely cancel in crosssections and RCC, resulting in a smaller overall effect.Two reconstruction-related sources of uncertainty that
affect measured shower energies were considered. Theeffect of PMT channel cross talk is studied by injectingcross talk noise into the simulation, and its uncertainty isestimated by varying the amount by 20%. The resultinguncertainty is small and is added in quadrature with thehadronic energy scale uncertainty. Muon track-relatedenergy depositions (from δ rays or bremsstrahlung) aredifficult to isolate within the shower region. We use dataand simulation samples of beam-associated muons passingthrough the detector to model these and tune our hadronenergy distribution in data and simulation. We compare twoalgorithms to separate muon-associated energy from theshower region and take their difference as the uncertaintyfrom this source, which is also found to be small.The effect of accidental activity from beam-associated
muons is simulated by overlaying events from data withinour reconstruction timing windows. We study overallreconstruction efficiency as a function of neutrino energyby projecting track segments reconstructed using only theMINERvA detector and searching for the track in MINOSND, and vice versa. Track reconstruction efficiency, whichagrees well between data and Monte Carlo simulations, isabove 99.5% for MINERvA and above 96% for MINOSND and is found to be nearly constant with energy. Weadjust the simulated efficiency accordingly, although thenormalization procedure makes the results insensitive tothese effects.Cross section model uncertainties enter into the meas-
urement directly through the model-dependent correctionas well as through bin migration effects at the boundaries ofour experimental acceptance. Our default model (GENIE-Hybrid) is based on GENIE 2.8.4; we therefore use theprescription in Ref. [21] to evaluate uncertainties on all ofthe corresponding model parameters. The largest GENIEmodel uncertainties arise from final state interactions (FSI)and the resonance model parameters. We account foruncertainties in the resonance contribution by varyingthe axial mass parameters, MRES
A and MRESV , in our model
by �20% and �10%, respectively. The resulting effect onthe cross section is up to 4%. The GENIE parameters thatcontrol FSI effects include mean free path, reactionprobabilities, nuclear size, formation time and hadroniza-tion model variation. The largest FSI uncertainty, due to thepion mean free path within the nucleus, is up to 2% (3%)for cross sections (fluxes). We separately evaluate theuncertainties from the tuned model components (RPA,single pion nonresonant, and 2p2h) discussed in Sec. III.We include half the difference between the default GENIE2.8.4 and the implemented RPA model in quadrature intothe total model uncertainty. We assume a 15% uncertaintyin the retuned nonresonant single pion productioncomponent. After incorporating the 2p2h model, a sizable
L. REN et al. PHYSICAL REVIEW D 95, 072009 (2017)
072009-8
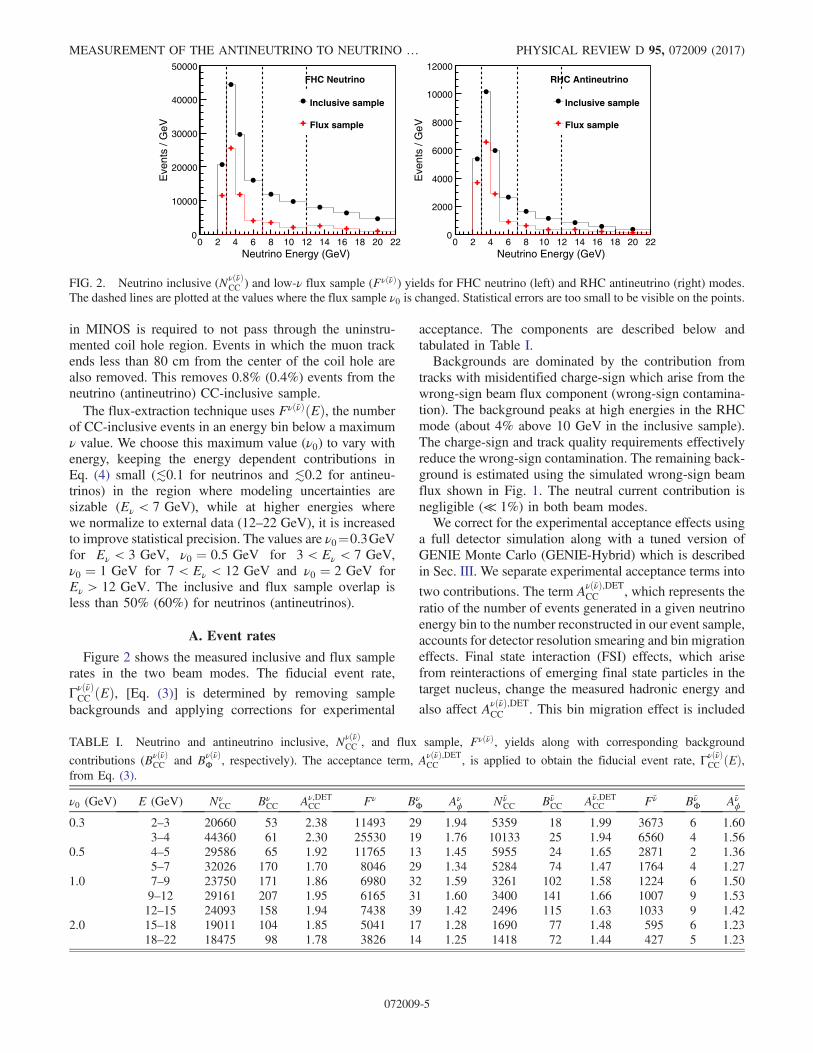
discrepancy in the hadronic energy distribution with thedata remains. To assess an additional uncertainty from thisunmodeled contribution, we fit the data excess at lowhadronic energy described in Ref. [15] in the neutrinoenergy range 2 < Eν < 6 GeV (taking into account sepa-rately proton-proton and proton-neutron initial states)to obtain a corrected model [30,31]. We take the uncer-tainty as the difference of the result obtained with this data-driven model, from the nominal result. The MINERvAantineutrino data also show an excess in the same region.We apply the corrected model from neutrino describedabove and then fit the remaining antineutrino excess toobtain a data-driven antineutrino 2p2h model uncertainty.The primary effect of varying the size of this contribution isto shift the overall level of the cross section. The normali-zation procedure removes most of the effect and theremaining uncertainty is less than 1.5% (2%) on the crosssection (flux).The contamination from wrong-sign events is significant
only for the antineutrino sample (about 4% above 15 GeV).
Neutrino Energy (GeV)0 2 4 6 8 10 12 14 16 18 20 22
Fra
ctio
nal U
ncer
tain
ty
0.00
0.02
0.04
0.06
0.08
0.10
0.12TotalEnergy scalesNormalizationCross section modelFSI
Neutrino Energy (GeV)0 2 4 6 8 10 12 14 16 18 20 22
Fra
ctio
nal U
ncer
tain
ty
0.00
0.02
0.04
0.06
0.08
0.10
0.12TotalEnergy scalesNormalizationCross section modelFSI
FIG. 5. Measurement uncertainties for neutrino (left) and antineutrino (right) low-ν fluxes. The total uncertainty (sys.+stat.) is the solidline. Components from the cross section model (dashed red), FSI (dot-dash blue), and energy scales (dotted) are shown. The 3.6%uncertainty in the external normalization (dashed black) is the error of the NOMAD data in the normalization region.
Neutrino Energy (GeV)0 2 4 6 8 10 12 14 16 18 20 22
Fra
ctio
nal U
ncer
tain
ty
0.00
0.02
0.04
0.06
0.08
0.10
0.12TotalCross section model NormalizationEnergy scalesFSI
Neutrino Energy (GeV)0 2 4 6 8 10 12 14 16 18 20 22
Fra
ctio
nal U
ncer
tain
ty
0.00
0.02
0.04
0.06
0.08
0.10
0.12TotalCross section model NormalizationEnergy scalesFSI
FIG. 6. Measurement uncertainties for neutrino (left) and antineutrino (right) total cross sections. The total uncertainty (sys.+stat.) isthe solid line. Components from the cross section model (dashed red), FSI (dot-dash blue), and energy scales (dotted) are shown. The3.6% uncertainty in the external normalization (dashed black) is the error of the NOMAD data in the normalization region. Statisticalerror dominates the measurement in the antineutrino result.
Neutrino Energy (GeV)0 2 4 6 8 10 12 14 16 18 20 22
Fra
ctio
nal U
ncer
tain
ty
0.00
0.02
0.04
0.06
0.08
0.10
0.12Total
Cross section model Energy scales
FSI
FIG. 7. Measurement uncertainties for the cross section ratio,RCC. The total uncertainty (sys.+stat.) is the solid line. Compo-nents from the cross section model (dashed red), FSI (dot-dashblue), and energy scales (dotted) are shown. Normalizationuncertainty is very small (<1%) and is included in the totalerror curve. The uncertainty is dominated by the statisticalprecision of the antineutrino sample.
MEASUREMENT OF THE ANTINEUTRINO TO NEUTRINO … PHYSICAL REVIEW D 95, 072009 (2017)
072009-9

To evaluate the uncertainty from this source we recomputethe antineutrino cross section with wrong-sign events in theRHC mode reweighted by the extracted neutrino low-νflux. The difference is taken as the wrong-sign contami-nation uncertainty, which is less than 0.5% (0.2%) for theextracted antineutrino cross section (flux).The overall 3.6% normalization uncertainty arises from
the precision of the NOMAD data set in the energy range12–22 GeV. We have assumed NOMAD data points in thisregion to have 100% correlated point-to-point systematicuncertainties in computing the weighted average error fromtheir data. For antineutrinos and RCC we assess an addi-tional contribution to the uncertainty from the correctionterm, Gðν0Þ, by varying the GENIE-Hybrid cross sectionmodel parameters within their uncertainties prescribed byGENIE. The resulting uncertainty is negligible (less than0.5% for all energies).An error summary for the fluxes is shown in Fig. 5.
The dominant systematic uncertainties on the shape forboth the neutrino and antineutrino fluxes arise from limited
Neutrino Energy (GeV)0 2 4 6 8 10 12 14 16 18 20 22
Rat
io to
Mod
elν σ
0.8
0.9
1
1.1
1.2FHC Neutrino
Data (GENIE Hybrid)
Data (NuWro)
NuWro model
Neutrino Energy (GeV)0 2 4 6 8 10 12 14 16 18 20 22
Rat
io to
Mod
elν σ
0.8
0.9
1
1.1
1.2
Data (GENIE Hybrid)
Data (NuWro)
NuWro model
RHC Antineutrino
FIG. 9. Ratio of the measured neutrino (left) and antineutrino (right) cross sections to the GENIE-Hybrid model. Points are MINERvAdata with default GENIE-Hybrid (circles) and alternative NuWro model (squares) used to compute model-based correction terms.GENIE-Hybrid data points are plotted with total error (sys.+stat.). The dashed line shows the NuWro model. The shaded band give thesize of the cross section model systematic uncertainty.
Neutrino Energy (GeV)0 2 4 6 8 10 12 14 16 18 20 22
PO
T6
/GeV
/10
2N
eutr
inos
/m
0
20
40
60
80Simulation
Data
FHC Neutrino
10 15 200
2
4
6
Neutrino Energy (GeV)0 2 4 6 8 10 12 14 16 18 20 22
PO
T6
/GeV
/10
2N
eutr
inos
/m
0
20
40
60
80Simulation
Data
RHC Antineutrino
10 15 200
1
2
3
FIG. 8. Extracted low-ν flux (points) for a FHC neutrino (left) and RHC antineutrino (right). The histogram shows the Monte Carlosimulated fluxes from Ref. [17] and one sigma error band (shaded bars). The insets show a zoom-in of the 7–22 GeV energy range.
0.6
0.8
1
1.2Neutrino
Neutrino energy (GeV)0 2 4 6 8 10 12 14 16 18 20 22
0.25
0.3
0.35
0.4Antineutrino
MINERvA 2017
MINERvA 2016
T2K 2015
T2K 2014
T2K 2013
ArgoNeuT 2012, 2014
SciBooNE 2011
MINOS 2009
NOMAD 2008
JINR 1996
BNL 1980
SKAT 1979
GGM 1979
BEBC 1979
ITEP 1979
/GeV
)2
cm-3
8/E
(10
σ
FIG. 10. MINERvA measured neutrino and antineutrinocharged-current inclusive cross sections (red circles and previousresult from Ref. [4] shown with blue squares) compared withother measurements for neutrinos [6,7,27,34–46] (upper plot) andantineutrinos [6,40,47,48] (lower plot) on various nuclei in thesame energy range. The reference curve shows the prediction ofGENIE 2.8.4.
L. REN et al. PHYSICAL REVIEW D 95, 072009 (2017)
072009-10
knowledge of muon and hadron energy scales. Thisuncertainty peaks at low energies and has a nontrivialenergy dependence that is due to the combined effects fromsubcomponents having different precisions, as well as tothe flux shape itself. The FSI uncertainty gives an effect thatis also important, 3.5%, and nearly constant with energy.For antineutrinos, the statistical precision is poorer and iscomparable to the systematic precision over most of theenergy range. The statistical error in the data-based crossnormalization factor αðν0Þ (Table II), dominates the stat-istical precision below 12 GeV and is responsible for thedetailed shape features in the uncertainty band.2
Neutrino and antineutrino cross section uncertaintycomponents are summarized in Fig. 6. Many systematiceffects cause changes that are similar in the cross sectionand flux samples and partially cancel in the measured crosssection. The dominant uncertainty is from the cross sectionmodel at low energy, while normalization dominates at highenergies. Neutrino and antineutrino cross sections havecomparable systematic errors but the statistical precision ispoorer for antineutrinos, and it dominates the error in all butthe lowest energy bin.The uncertainties on the cross section ratio, RCC, are
summarized in Fig. 7. Energy scale uncertainties nearlycancel in this ratio, and the sizes of effects from FSIand many model uncertainties are reduced. The dominantremaining uncertainties are from the MRES
A cross sectionmodel parameter and the effect of implementing the RPAmodel in GENIE 2.8.4. The corresponding cross sectioncomponents produce sizable shape effects on the visibleenergy in the low-ν region. Different final states in neutrinoversus antineutrino interactions reduce cancellation effectsin these components for the ratio. The overall uncertainty in
RCC is dominated by statistical uncertainty in the antineu-trino sample.
VIII. FLUX AND CROSS SECTION RESULTS
The extracted low-ν flux (Table IV) is shown in Fig. 8where it is compared to the MINERvA simulated flux ofRef. [17]. The latter flux is constrained using hadronproduction data and a detailed GEANT4 [29] beam linesimulation. The extracted flux low-ν is in reasonableagreement with the simulation for both modes.3 Thelow-ν measurement prefers a smaller neutrino flux below7 GeV (approximately 5%) while a larger flux is preferredfor both neutrinos and antineutrinos (2%–12% for neutri-nos, up to 16% for antineutrinos) in the >7 GeV range.The low-ν flux compared to the flux of the tunedproduction-based simulation achieves better precision forneutrinos (by 30% for Eν above 3 GeV) and comparable forantineutrinos.The measured cross sections (Table IV) are shown in
Fig. 9 compared with the GENIE-Hybrid model. The data(red points), extracted using GENIE-Hybrid for modelcorrections, favor a lower total cross section in the region2–9 GeV, where data lie below the curves (by up to ∼2σ)for neutrinos. Antineutrino data also favor a lower crosssection in the same region, but agree with models within theprecision of the data, which have larger statistical uncer-tainties. For comparison, we also extract results usingEqs. (10) and (11) and NuWro (squares) to computeexplicit model correction terms.4 We omit error bars from
Neutrino Energy (GeV)0 2 4 6 8 10 12 14 16 18 20 22
Rat
io to
Mod
elν σ/ν σ
0.8
0.9
1
1.1
1.2
Data (GENIE Hybrid)
Data (NuWro)
NuWro model
Neutrino energy (GeV)2 4 6 8 10 12 14 16 18 20 22
ν σ/ν σ
0.2
0.3
0.4
0.5
0.6
GENIE 2.8.4MINERvAGGM 1973ITEP 1979MINOS 2009
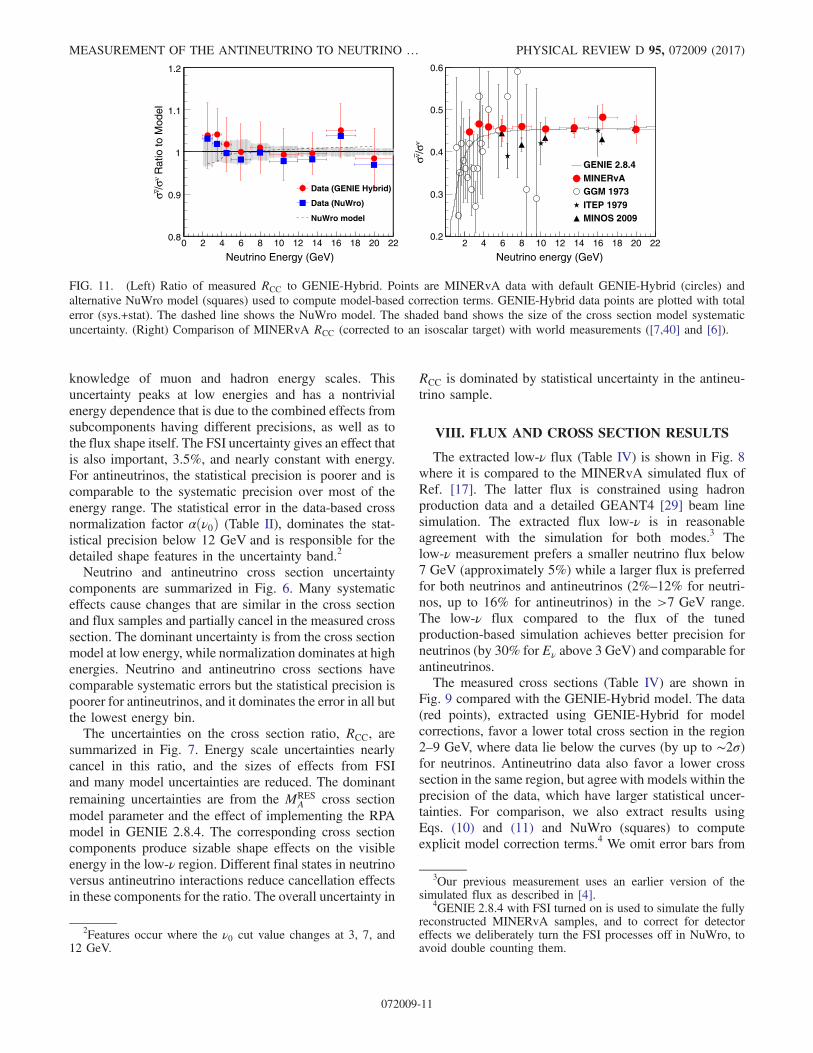
FIG. 11. (Left) Ratio of measured RCC to GENIE-Hybrid. Points are MINERvA data with default GENIE-Hybrid (circles) andalternative NuWro model (squares) used to compute model-based correction terms. GENIE-Hybrid data points are plotted with totalerror (sys.+stat). The dashed line shows the NuWro model. The shaded band shows the size of the cross section model systematicuncertainty. (Right) Comparison of MINERvA RCC (corrected to an isoscalar target) with world measurements ([7,40] and [6]).
2Features occur where the ν0 cut value changes at 3, 7, and12 GeV.
3Our previous measurement uses an earlier version of thesimulated flux as described in [4].
4GENIE 2.8.4 with FSI turned on is used to simulate the fullyreconstructed MINERvA samples, and to correct for detectoreffects we deliberately turn the FSI processes off in NuWro, toavoid double counting them.
MEASUREMENT OF THE ANTINEUTRINO TO NEUTRINO … PHYSICAL REVIEW D 95, 072009 (2017)
072009-11

NuWro-based points, which use the same raw binned data,and therefore have the same (correlated) statistical anddetector-related systematic uncertainties. The shaded bandshows the size of the estimated model systematic uncer-tainty (computed from the GENIE-Hybrid model) whichspans the differences between the extracted cross sectionvalues. The NuWro model has a different treatment ofthe low-ν region than GENIE, including a different axialmass parameter (MA¼1.2GeV), a transverse enhancementmodel (TEM) [32]) to account for the meson exchangecurrent (MEC) scattering contribution, and a duality-basedtreatment in the resonance region [33]. The two sets ofextracted cross sections show significant differences atlow energies that reflect different modeling of the kine-matic acceptance correction (AKIN
CC ), which is large forEν < 7 GeV. QE and MEC components, which dominatethe lowest energy bin, have a harder muon spectrumresulting in better acceptance in the NuWro model.GENIE kinematic acceptance is better in the 3–7 GeVenergy range for the resonance and deep inelastic scattering(DIS) components, which become dominant above 3 GeV.At high energies, the normalization method removes theeffect of correction differences between the two models forthe neutrino data points. For antineutrinos, the GENIE-Hybrid results are systematically above those for theNuWro model by a few percent at high energies. We haveapplied the GENIE-Hybrid quark mixing correction Gðν0Þto the NuWro data points (NuWro does not include quarkmixing by default). Figure 10 shows a comparison of themeasured charged-current total cross sections with worldneutrino data [6,7,27,34–46]. We apply a nonisoscalaritycorrection5 to other data sets to compare with our isoscalar-corrected carbon measurement. The neutrino cross sectionis in good agreement with other measurements that overlapin this energy range and is among the most precise in theresonance-dominated region (2–7 GeV). Comparisons withworld antineutrino data [6,40,47,48] are also shown. Ourdata add information in the region below 10 GeV whereprevious antineutrino data are sparse and improve precisionand coverage, especially in the region below 6 GeV. Ourresults are in agreement with precise data on other nuclei[6] in the neutrino energy region of overlap (>6 GeV) andprovide the most precise measurement of the antineutrinocross section below 5 GeV to date.The measured cross section ratio, RCC, is shown in
Fig. 11 compared with GENIE and NuWro models andwith world data [6,7,40]. Measured points are extractedusing GENIE-Hybrid (circles) and NuWro (squares) formodel corrections. The measured RCC lies above the model
TABLEIV.
Summaryof
measuredquantities.Neutrinoflux
ΦνðE
Þand
antin
eutrinoflux
Φν̄ðE
Þand
theirerrors(colum
ns1and3)
arein
units
ofneutrinos=m
2=G
eV=1
06pot.
NeutrinocrosssectionσνðE
Þ=Eandantin
eutrinocrosssectionσν̄ðE
Þ=Eandtheirerrors(colum
ns2and4)
areinunits
of10−38cm
2=G
eV.C
olum
nslabeledσstat,σ
sys,andσtotgive
thestatistical
(stat),system
atic
(sys),andtotal(tot)errors,respectiv
ely.
ΦνðE
Þneutrinos=m
2=G
eV=1
06PO
TσνðE
Þ=E
10−38cm
2=G
eVΦ
ν̄ðE
Þneutrinos=m
2=G
eV=1
06PO
Tσν̄ðE
Þ=E
10−38cm
2=G
eVRCC
EGeV
Φν
σstat
σsys
σtot
σν=E
σstat
σsys
σtot
Φν̄
σstat
σsys
σtot
σν̄=E
σstat
σsys
σtot
RCC
σstat
σsys
σtot
2.5
70.290
1.837
6.446
6.702
0.746
0.020
0.072
0.075
68.851
4.589
6.155
7.678
0.333
0.023
0.026
0.035
0.4470.0290.0170.033
3.5
78.716
1.508
4.534
4.778
0.671
0.013
0.036
0.038
66.833
3.562
3.743
5.167
0.313
0.017
0.016
0.024
0.4660.0240.0120.027
4.5
30.052
0.624
1.842
1.945
0.670
0.015
0.031
0.034
24.171
1.348
1.472
1.996
0.308
0.018
0.013
0.022
0.4590.0260.0130.029
6.0
9.557
0.212
0.550
0.590
0.678
0.016
0.032
0.036
6.676
0.392
0.385
0.550
0.308
0.019
0.013
0.023
0.4550.0270.0140.030
8.0
5.269
0.103
0.258
0.278
0.697
0.015
0.029
0.032
3.017
0.160
0.143
0.214
0.321
0.018
0.013
0.022
0.4600.0270.0100.028
10.5
3.136
0.064
0.158
0.170
0.716
0.015
0.029
0.033
1.625
0.090
0.080
0.120
0.325
0.019
0.013
0.023
0.4540.0270.0070.028
13.5
1.916
0.034
0.099
0.104
0.708
0.014
0.027
0.031
0.895
0.035
0.044
0.056
0.324
0.015
0.013
0.020
0.4570.0220.0070.023
16.5
1.173
0.024
0.059
0.063
0.687
0.015
0.026
0.030
0.437
0.022
0.025
0.033
0.331
0.020
0.013
0.024
0.4820.0290.0070.030
20.0
0.651
0.014
0.034
0.037
0.698
0.017
0.027
0.032
0.229
0.014
0.014
0.019
0.316
0.022
0.013
0.025
0.4530.0320.0060.032
5Corrections for SciBooNE CH target points with energies inthe range 0.38–2.47 GeV are 1.085, 1.06, 1.038, 1.033, 1.028,1.028, respectively. We correct T2K 2013 (CH target atE ¼ 0.85 GeV) by 1.04, T2K 2014 (iron at E ¼ 1.5 GeV) by0.977, T2K 2015 (iron at E ¼ 1 GeV, 2 GeV, and 3 GeV) by0.971, 0.976 and 0.977, respectively.
L. REN et al. PHYSICAL REVIEW D 95, 072009 (2017)
072009-12
predictions at low energies and favors a flatter extrapolationinto that region than do the models, which fall off below5 GeV. The NuWro results are systematically below theGENIE-Hybrid results by a few percent, tracking thedifferences seen in the antineutrino cross section level inthe numerator (discussed above). The differences betweenGENIE-Hybrid-based and NuWro-based RCC measure-ments at lower energies are less significant than differencesseen in the cross sections from the two models. The shadedband, which spans the NuWro versus GENIE-Hybridpoint differences, shows the size of the estimated system-atic uncertainty from model sources. Our result is ingood agreement with the recent measurement fromMINOS on an iron target in the region where they overlap(Eν > 6 GeV). This measurement is the only precisedetermination of RCC in the Eν < 6 GeV region. It spansneutrino energies from 2 to 22 GeV, a range which is highlyrelevant to ongoing and future oscillation experiments.
IX. CONCLUSION
We present the first precise measurement of the ratio ofantineutrino to neutrino cross sections, RCC, in the regionbelow 6 GeV, which is important for future long baselineneutrino oscillation experiments. Our measurement, withprecision in the range of 5.0%–7.5%, represents animprovement by nearly a factor of 4 over the previousmeasurements in this region [7]. We measure neutrino andantineutrino cross sections that extend the reach for anti-neutrino data to low energies and are among the mostprecise in the few GeVenergy range. Two leading neutrinogenerators, GENIE and NuWro, both overestimate themeasured inclusive CC cross sections at the level of4%–10% as energy decreases from 9 GeV to 2 GeV. Wealso present measured total and low-ν fiducial rates that can
be used to obtain the cross sections and their ratio withother models. In the near future, this will allow our datato be used with new models that will have improvedtreatments of nuclear effects and low energy scatteringprocesses.The cross section ratio RCC is found to have systematic
uncertainties that are significantly smaller than thoseassociated with either of the CC inclusive cross sections,due to the cancellation of common systematic uncertain-ties. We demonstrate the robustness of RCC by comparingresults using two different models (GENIE-Hybrid andNuWro). The differences are found to be smaller than inthe individual cross section measurements and are com-parable with the size of estimated model systematicuncertainties.
ACKNOWLEDGMENTS
This work was supported by the Fermi NationalAccelerator Laboratory under U.S. Department ofEnergy Contract No. DE-AC02-07CH11359 whichincluded the MINERvA construction project.Construction support was also granted by the UnitedStates National Science Foundation under GrantNo. PHY-0619727 and by the University of Rochester.Support for participating scientists was provided by NSFand DOE (USA), by CAPES and CNPq (Brazil), byCoNaCyT (Mexico), by CONICYT programs includingFONDECYT (Chile), by CONCYTEC, DGI-PUCP, andIDI/IGI-UNI (Peru). We thank the MINOS Collaborationfor use of its near detector data. We acknowledge thededicated work of the Fermilab staff responsible for theoperation and maintenance of the beam line and detectorand the Fermilab Computing Division for support of dataprocessing.
[1] R. Acciarri et al. (DUNE Collaboration), arXiv:1512.06148.[2] K. Abe et al. (Hyper-Kamiokande Proto-Collaboration),
Prog. Theor. Exp. Phys. 2015, 53C02 (2015).[3] W. Marciano and Z. Parsa, Nucl. Phys. B, Proc. Suppl. 221,
166 (2011).[4] J. Devan et al. (MINERvA Collaboration), Phys. Rev. D 94,
112007 (2016).[5] K. A. Olive et al. (Particle Data Group Collaboration),
Chin. Phys. C 38, 090001 (2014).[6] P. Adamson et al. (MINOS Collaboration), Phys. Rev. D 81,
072002 (2010).[7] T. Eichten et al., Phys. Lett. B 46B, 274 (1973).[8] A. Gazizov and M. P. Kowalski, Comput. Phys. Commun.
172, 203 (2005).[9] C. Andreopoulos et al., Nucl. Instrum. Methods Phys. Res.,
Sect. A 614, 87 (2010).
[10] O. Buss, T. Gaitanos, K. Gallmeister, H. van Hees, M.Kaskulov, O. Lalakulich, A. B. Larionov, T. Leitner, J. Weil,and U. Mosel, Phys. Rep. 512, 1 (2012).
[11] D. Autiero, Nucl. Phys. B, Proc. Suppl. 139, 253(2005).
[12] D. Casper, Nucl. Phys. B, Proc. Suppl. 112, 161 (2002).[13] G. Battistoni, P. R. Sala, M. Lantz, A. Ferrari, and G.
Smirnov, Acta Phys. Pol. B 40, 2491 (2009).[14] T. Golan, C. Juszczak, and J. T. Sobczyk, Phys. Rev. C 86,
015505 (2012).[15] P. A. Rodrigues et al. (MINERvA Collaboration), Phys.
Rev. Lett. 116, 071802 (2016).[16] P. Adamson et al., Nucl. Instrum. Methods Phys. Res., Sect.
A 806, 279 (2016).[17] L. Aliaga et al. (MINERvACollaboration), Phys. Rev. D 94,
092005 (2016).
MEASUREMENT OF THE ANTINEUTRINO TO NEUTRINO … PHYSICAL REVIEW D 95, 072009 (2017)
072009-13
[18] L. Aliaga et al. (MINERvA Collaboration), Nucl. Instrum.Methods Phys. Res., Sect. A 743, 130 (2014).
[19] D. G. Michael et al. (MINOS Collaboration), Nucl. Instrum.Methods Phys. Res., Sect. A 596, 190 (2008).
[20] C. Andreopoulos et al., Nucl. Instrum. Methods Phys. Res.,Sect. A 614, 87 (2010).
[21] C. Andreopoulos, C. Barry, S. Dytman, H. Gallagher,T. Golan, R. Hatcher, G. Perdue, and J. Yarba, arXiv:1510.05494.
[22] J. Nieves, J. E. Amaro, and M. Valverde, Phys. Rev. C 70,055503 (2004); 72, 019902(E) (2005).
[23] J. Nieves, I. Ruiz Simo, and M. J. Vicente Vacas, Phys. Rev.C 83, 045501 (2011).
[24] P. Rodrigues, C. Wilkinson, and K. McFarland, Eur. Phys. J.C 76, 474 (2016).
[25] S. R. Mishra, in Proceedings of the Workshop on HadronStructure Functions and Parton Distributions, edited by D.Geesaman et al. (World Scientific, Batavia, IL, 1990), p. 84.
[26] W. Seligman, Ph.D. thesis, Columbia University, 1997,Nevis 292.
[27] Q. Wu et al. (NOMAD Collaboration), Phys. Lett. B 660, 19(2008).
[28] L. Aliaga et al. (MINERvA Collaboration), Nucl. Instrum.Methods Phys. Res., Sect. A 789, 28 (2015).
[29] S. Agostinelli et al. (GEANT4 Collaboration), Nucl. Ins-trum. Methods Phys. Res., Sect. A 506, 250 (2003).
[30] L. Ren, Ph.D. thesis, University of Pittsburgh, 2017.[31] P. A. Rodrigues et al. (MINERvA Collaboration) (to be
published).[32] A. Bodek, H. S. Budd, and M. E. Christy, Eur. Phys. J. C 71,
1726 (2011).
[33] K. M. Graczyk, C. Juszczak, and J. T. Sobczyk, Nucl. Phys.A781, 227 (2007).
[34] S. J. Barish et al., Phys. Lett. 66B, 291 (1977).[35] S. J. Barish et al., Phys. Rev. D 19, 2521 (1979).[36] C. Baltay et al., Phys. Rev. Lett. 44, 916 (1980).[37] N. J. Baker, P. L. Connolly, S. A. Kahn, M. J. Murtagh, R. B.
Palmer, N. P. Samios, and M. Tanaka, Phys. Rev. D 25, 617(1982).
[38] S. Ciampolillo et al. (Aachen-Brussels-CERN-Ecole Poly-Orsay-Padua, Gargamelle Neutrino Propane), Phys. Lett.84B, 281 (1979).
[39] D. S. Baranov et al., Phys. Lett. 81B, 255 (1979).[40] A. I. Mukhin, V. F. Perelygin, K. E. Shestermanov, A. A.
Volkov, A. S. Vovenko, and V. P. Zhigunov, Yad. Fiz. 30,1014 (1979) [Sov. J. Nucl. Phys. 30, 528 (1979)].
[41] V. B. Anikeev et al., Z. Phys. C 70, 39 (1996).[42] Y. Nakajima et al. (SciBooNE Collaboration), Phys. Rev. D
83, 012005 (2011).[43] C. Anderson et al. (ArgoNeuT Collaboration), Phys. Rev.
Lett. 108, 161802 (2012).[44] K. Abe et al. (T2K Collaboration), Phys. Rev. D 87, 092003
(2013).[45] K. Abe et al. (T2K Collaboration), Phys. Rev. D 93, 072002
(2016).[46] R. Acciarri et al. (ArgoNeuT Collaboration), Phys. Rev. D
89, 112003 (2014).[47] A. E. Asratian et al., Phys. Lett. 76B, 239 (1978).[48] G. Fanourakis, L. K. Resvanis, G. Grammatikakis, P.
Tsilimigras, A. Vayaki, U. Camerini, W. F. Fry, R. J.Loveless, J. H. Mapp, and D. D. Reeder, Phys. Rev. D21, 562 (1980).
L. REN et al. PHYSICAL REVIEW D 95, 072009 (2017)
072009-14


![Ch 5: ARIMA model · 1.1 Non-Stationary Data [ToC] Dow Jones Index From Aug. 28 to Dec. 18, 1972 l l l l l ll l l l l l l l l l l l l l l l l l l l l l l l l l l l l l l l l l l l](https://static.fdocuments.us/doc/165x107/5ee0213ead6a402d666b5f8b/ch-5-arima-model-11-non-stationary-data-toc-dow-jones-index-from-aug-28-to.jpg)