Physical Education Trends in Our Nation's Schools - AAHPERD
39
RRG Roslow Research Group 14 Vanderventer Avenue, Suite 215, Port Washington, NY 11050 (516) 883 – 1110 fax (516) 883 – 4130 www.roslowresearch.com e-mail: [email protected] Physical Education Trends in Our Nation’s Schools A Survey of Practicing K-12 Physical Education Teachers Prepared For: Polar Electro Inc. National Association for Sport and Physical Education (NASPE) July 2009
Transcript of Physical Education Trends in Our Nation's Schools - AAHPERD

RRG Roslow Research Group
14 Vanderventer Avenue, Suite 215, Port Washington, NY 11050 (516) 883 – 1110 fax (516) 883 – 4130
www.roslowresearch.com e-mail: [email protected]
Physical Education Trends in Our Nation’s Schools
A Survey of Practicing K-12 Physical Education Teachers
Prepared For:
Polar Electro Inc. National Association for Sport and Physical Education (NASPE)
July 2009

RRG 1
CONTENTS
SECTION Page I BACKGROUND .................................................. 2 II SPECIAL NOTES ............................................... 3 III OVERVIEW OF RESULTS ................................. 4 IV SUMMARY OF RESULTS .................................. 8
A Primary Focus of Physical Education Programs .............................................. 8
B Specific Physical Activities Offered .......... 12
C Use of Technology in Physical Education Programs .............................................. 14
D Professional Development for Physical Education Teachers ............................. 18
E Professional Organizations ....................... 20
F The Principal’s knowledge & Involvement 22
G Student & Parent Interest in Physical Education .............................................. 25
H Funding for Physical Education Programs 29 APPENDIX A Student & Parent Interest – Detailed Tables ........................ 32
B Respondent Profile ........................ 38

RRG 2
I BACKGROUND
This report highlights the findings from an online survey conducted among physical education teachers in elementary, middle and high schools across the United States. Conducted on behalf of Polar Electro Inc. and the National Association for Sport and Physical Education (NASPE), the survey was designed to explore a number of key aspects of physical education programs in our nation’s schools. Questions covered instructional content, the use of technology in physical education programs, professional development for physical education teachers, principals’ knowledge and support for physical education programs, physical education teachers’ perceptions of student and parent interest and involvement and funding for physical education programs. In addition to generating this “profile of physical education” the intent is to replicate the survey periodically in the future; so that trends can be tracked/documented over time. A total of 1,375 physical education teachers participated in the survey between May 28 and June 15, 2009. Of this, 1,164 K-12 physical education teachers completed the survey. The survey was sent via e-mail to members of NASPE/AAHPERD who identify themselves as elementary, middle, or high school physical education teachers. Recipients of the e-mail were encouraged to forward the survey link to other practicing K-12 physical education teachers.
RRG 3
II SPECIAL NOTES
For the tables comparing results among elementary school, middle school and high school PE teachers, differences were tested for statistical significance, at a 95% level of confidence. When results were found to be significantly different: A small postscript/letter is inserted immediately to the right of the
significantly higher of the two numbers. These postscripts are “e” for elementary school, “m” for middle school and “h” for high school. So, for example, if the letter “m” appears to the right of a number in the “elementary school” column; that indicates that the elementary school percent/result was significantly higher than the middle school percent.
For the tables comparing results between more frequent users of technology and less frequent + non-users of technology, differences were tested for statistical significance, at a 95% level of confidence. When results were found to be significantly different:
A small arrow is inserted between the two numbers, pointing in the
direction of the significantly higher number.
Sample size/bases vary somewhat from question-to-question. Maximum error ranges for the bases shown in the tables (at a 95% level of confidence) are as follows:
Sample Size Maximum error range 1150 (Approx. – Total) ....................................... +/- 2.9 points
480 (Approx – Elementary School teachers) .... +/- 4.5 points
290 (Approx. – Middle School teachers) ......... +/- 5.8 points
270 (Approx. – High School teachers) ............ +/- 6.0 points
484 (“Very” or “somewhat frequent” users of technology for student instruction) ............ +/- 4.5 points
RRG 4
III OVERVIEW OF RESULTS
Primary Focus of Physical Education Programs For nearly 50% of these educators, the primary focus of the physical education program is “health-related fitness,” followed by “motor skills and movement forms” (33%), “personal and social responsibility/character development” (12%), and “preparation for sport participation” (6%). Not surprisingly, however, this focus varies dramatically by school level:
Among those teaching in elementary schools, the focus is more likely to be on “motor skills and movement;” while for those middle and high school educators, the emphasis is more likely to be on “health-related fitness.”
Physical Activities Offered The most common activity taught/offered by schools: basketball. 93% of the programs teach/offer basketball; followed by “personal fitness” (88%), volleyball (88%), jump rope (86%), soccer (83%), baseball/softball (75%) and football (74%).
Most of the incidence differences by school level might be predicted based on child age and development. For example, jump rope is significantly more likely to be taught/offered in elementary schools; while baseball, football and golf are significantly less likely to be offered in elementary schools.
Interestingly, football, hockey, track & field and kickboxing are significantly more likely to be taught/offered in middle school than in high school …and such sports/activities as baseball, disc sports, bowling, golf, exergames, lacrosse and rock climbing are as likely to be offered in middle schools as in high schools.
Use of Technology in Physical Education Programs 44% of physical education teachers use technology as part of student instruction “very” or “somewhat frequently.” Only 10% do not use technology at all.
These incidences vary little, regardless of school level. Over three-quarters use technology as a management tool “very” or “somewhat frequently” (such as for recording assessment scores or grading).

RRG 5
What specific technologies are being used?
72% cite “computers/the internet;” 70% are using pedometers; 51% are using fitness assessment technologies/equipment (such as TriFIT and Tanita scales); and 39% are using heart rate monitors.
o Heart rate monitors are more likely to be used in middle schools vs.
elementary schools; and more likely to be used in high schools than in either elementary or middle schools.
Nearly two-thirds cite “technology” as enhancing their physical education program as a function of its ability to enhance teacher/parent communication. Over half of the teachers also cite other ways that technology enhances their physical education programs, including:
…Providing data for assessment and grading,
…Enhancing instruction,
…Enhancing communication with school and district administrators about student performance and achievement,
…And increasing student motivation. One of the more notable findings herein: Those teachers who are more likely to incorporate technology into their student instruction perceive increasing interest among students and parents in physical activity and physical education. For example:
38% of physical education teachers perceive increased interest among students in physical education over the past three years. Among those teachers using technology more frequently, 46% perceive increased interest; while among those using technology less frequently or not at all, 32% perceive increased interest.
46% of teachers who use technology more frequently perceive that students’ health-related fitness levels have increased over the past three years; vs. 28% of teachers who use technology less frequently or not at all.
38% of teachers who use technology more frequently perceive that parents’ interest in students’ physical activity has increased in the past three years…vs. 26% of teachers who use technology less frequently/not at all.
RRG 6
Professional Development for Physical Education Teachers
65% of these educators are required to attend professional development classes;
64% of schools/districts provide funding for physical education teachers to attend professional classes/workshops/conferences;
And over 70% of schools/districts provide time-off for attending. Professional Organizations 50% of the physical education teachers are members of the national American Alliance for Health, Physical Education, Recreation and Dance (AAHPERD); and two-thirds are members of their state’s AAHPERD. Just under half have attended their state’s AAHPERD conference in the last three years…and 25% have attended the national AAHPERD convention.
Elementary school teachers are more likely to have attended these conferences than have middle or high school teachers.
The Principal’s Knowledge and Involvement When it comes to physical education programs, 58% rate their principal as “very supportive” of the physical education program; and another 35% rate the principal as “somewhat supportive.” Only 7% consider their principal “not supportive.”
Despite this, only 27% rate their principal as “very knowledgeable” of physical education as an instructional program…and in one-fifth of schools, the principal never observes a physical education class.
Student & Parent Interest in Physical Education In the last three years, 38% of the physical education teachers perceive that their students’ attention/interest in physical education class “has increased.”
Interestingly, this incidence was significantly stronger among middle school teachers vs. those teaching in high school; and significantly stronger among elementary school teachers, vs. either middle or high school teachers.

RRG 7
And as highlighted earlier: Incidence perceiving increased student interest in physical education class is significantly higher among more frequent users of technology: For example, among those teachers using technology for student instruction more frequently, 46% perceive increased interest among their students in physical education class.
31% of the physical education instructors perceive increased interest and support from parents regarding students’ physical activity; and 27% perceive increased interest/support from parents regarding students’ physical education.
…And – echoing the earlier observation regarding the use of technology in student instruction – here too parent interest is significantly stronger when the teacher is a frequent user of technology. For example, 34% of more-frequent users of technology perceive increased interest from parents regarding students’ physical education; vs. 21% of those teachers who are less frequent or non-users of technology.
Funding for Physical Education Programs
The median funding amount for physical education programs is $764. For over 60% of programs, annual funding is under $1,000. Only 15% have funding of $2,000 or more.
o Among high school programs, 32% have funding of $2,000 or more
…with the median being $1,370.
“School budget” is the most-cited source for program funding (for 64%), followed by school district budget (38%), PTA/PTO (34%), and grant programs (28%).
Most have seen budgets for physical education programs remain the same or shrink in recent years: 45% say that their budgets have remained about the same since 2006; and 36% say that budgets have decreased.

RRG 8
IV SUMMARY OF RESULTS
A Primary Focus of Physical Education Programs
For nearly 50% of these educators, the primary focus of the physical education program is “health-related fitness,” followed by “motor skills and movement forms” (33%), “personal and social responsibility/character development” (12%), and “preparation for sport participation” (6%). Not surprisingly, however, this focus varies dramatically by school level:
Among those teaching in elementary schools, the focus is more likely to be on “motor skills and movement;” while for those middle school and high school educators, the emphasis is more likely to be on “health-related fitness.” Versus elementary school, there is also relatively greater focus on “preparation for sports participation” in middle and high school (Table 1).
Table 1 Primary Focus of the Physical Education Program
School Level Total Elementary Middle High School Area (%) (%) (%) (%) Health-related fitness 49 33 63 e 67 e Motor skills and movement forms 33 53 mh 17 13 Personal and social responsibility/ character development 12 12 12 12 Preparation for sport participation 6 2 9 e 8 e Base (#) 1211 522 308 302
Question: What is the primary focus of the physical education program at your school?

RRG 9
When asked to rate each on importance, 86% rate “health-related fitness” as “very important,” 81% rate “personal and social responsibility/character development” as “very important,” and 69% rate “motor skills and movement forms” as very important” (Table 1a). Here again, note the considerable variation based on school level.
Table 1a Importance of Different Areas of Physical Education Programs –
Top-Box Ratings*
School Level Total Elementary Middle High School Area (%) (%) (%) (%) Health-related fitness 86 86 87 85 Personal and social responsibility/ character development 81 87 h 82 h 71 Motor skills and movement forms 69 92 mh 57 h 40 Preparation for sport participation 20 16 25 e 23 e Base (#) 1211 522 308 302
Question: Please rate the importance of the following areas in the physical education program at your school.
*Top-Box = % rating area as “very important”
RRG 10
When it comes to NASPE Standards, 94% of physical education programs incorporate Standard #3 (Regular participation in physical activity), 92% Standard #7 (Valuing of physical activity for health, enjoyment, challenge, self expression and/or social interaction), and 91% Standard #5 (Responsible personal and social behavior). As shown in Table 2 on the following page, there are some incidence differences by school level:
For example NASPE Standard #1 (Competency in motor skills and movement patterns) is significantly more likely to be addressed in elementary schools than in middle or high schools. The same is true for Standards #2 and #5. However, despite these differences, it’s noteworthy that – across all school levels – no less than three-quarters of programs are addressing each of the seven NASPE Standards.

RRG 11
Table 2 National Standards Addressed in Physical Education Program
School Level Total Elementary Middle High School Standard (%) (%) (%) (%) NASPE Standard #1 (Competency in motor skills and movement patterns) 89 97 mh 85 80 NASPE Standard #2 (Understanding of movement concepts, principles, strategies and tactics) 86 93 mh 84 h 76 NASPE Standard #3 (Regular participation in physical activity) 94 94 96 93 NASPE Standard #4 (Achievement and maintenance of a health- enhancing level of physical fitness) 90 90 91 88 NASPE Standard #5 (Responsible personal and social behavior) 91 94 mh 90 87 NASPE Standard #6 (Valuing of physical activity for health, enjoyment, challenge, self- expression and/or social interaction) 92 94 h 91 88 Base (#) 1211 522 308 302
Question: Which of the national standards does the physical education program at your school address?

RRG 12
B Specific Physical Activities Offered
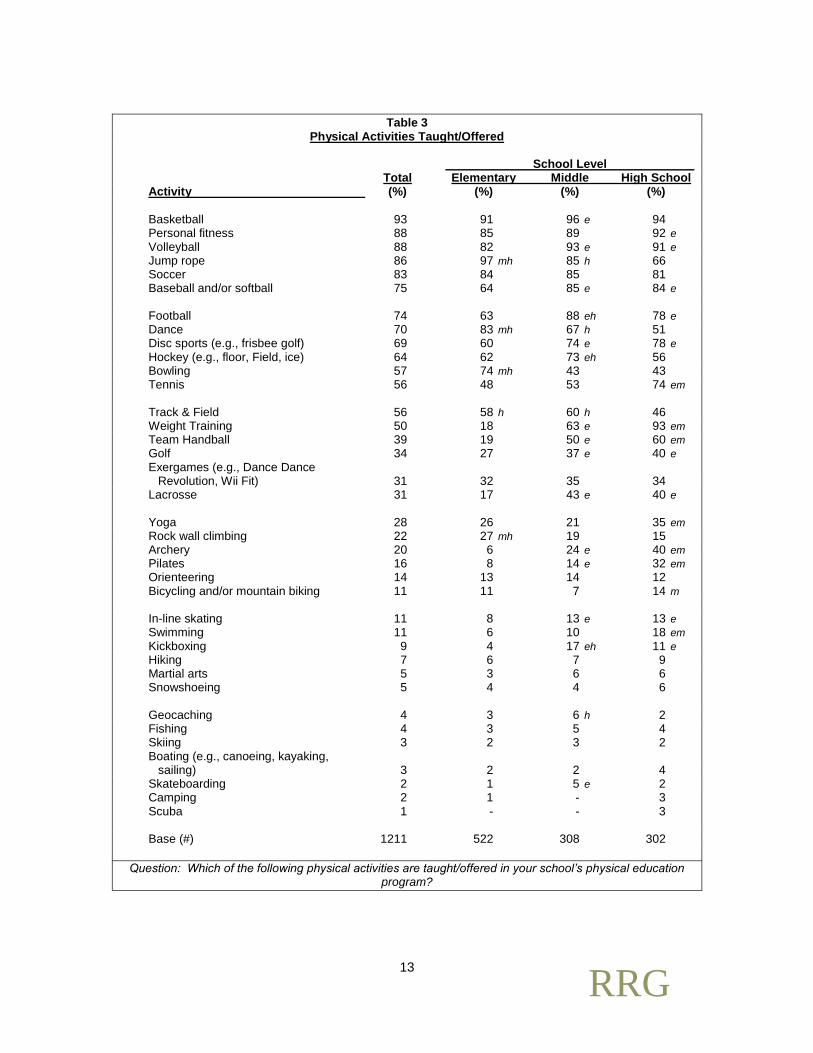
As shown in Table 3 on the following page, the most common sport/physical activity taught and/or offered by schools: basketball. 93% of the programs teach/offer basketball; followed by “personal fitness” and volleyball (each at 88%), jump rope (86%), soccer (83%), baseball/softball (75%) and football (74%). Based on child age/development, most of the incidence differences by school level might be predicted. For example, jump rope is significantly more likely to be taught/offered in elementary schools…and conversely; baseball, football and golf are significantly less likely to be offered in elementary schools. But a few of the middle vs. high school patterns are noteworthy:
Football is significantly more likely to be taught/offered in middle school than in high school,
Similarly, hockey, track & field and kickboxing are significantly more likely to be taught/offered in middle school vs. high school,
And such sports/activities as baseball, disc sports, bowling, golf, exergames, lacrosse and rock climbing are as likely to be offered in middle schools as in high schools.
RRG 13
Table 3
Physical Activities Taught/Offered
School Level Total Elementary Middle High School Activity (%) (%) (%) (%)
Basketball 93 91 96 e 94 Personal fitness 88 85 89 92 e Volleyball 88 82 93 e 91 e Jump rope 86 97 mh 85 h 66 Soccer 83 84 85 81 Baseball and/or softball 75 64 85 e 84 e Football 74 63 88 eh 78 e Dance 70 83 mh 67 h 51 Disc sports (e.g., frisbee golf) 69 60 74 e 78 e Hockey (e.g., floor, Field, ice) 64 62 73 eh 56 Bowling 57 74 mh 43 43 Tennis 56 48 53 74 em Track & Field 56 58 h 60 h 46 Weight Training 50 18 63 e 93 em Team Handball 39 19 50 e 60 em Golf 34 27 37 e 40 e Exergames (e.g., Dance Dance Revolution, Wii Fit) 31 32 35 34 Lacrosse 31 17 43 e 40 e Yoga 28 26 21 35 em Rock wall climbing 22 27 mh 19 15 Archery 20 6 24 e 40 em Pilates 16 8 14 e 32 em Orienteering 14 13 14 12 Bicycling and/or mountain biking 11 11 7 14 m In-line skating 11 8 13 e 13 e Swimming 11 6 10 18 em Kickboxing 9 4 17 eh 11 e Hiking 7 6 7 9 Martial arts 5 3 6 6 Snowshoeing 5 4 4 6 Geocaching 4 3 6 h 2 Fishing 4 3 5 4 Skiing 3 2 3 2 Boating (e.g., canoeing, kayaking, sailing) 3 2 2 4 Skateboarding 2 1 5 e 2 Camping 2 1 - 3 Scuba 1 - - 3 Base (#) 1211 522 308 302
Question: Which of the following physical activities are taught/offered in your school’s physical education program?

RRG 14
C Use of Technology in Physical Education Programs
Respondents were asked how often they use technology in their programs as part of student instruction; and 44% responded that they use technology “very frequently” or “somewhat frequently.” Only 10% do not use technology at all. And these incidences varied little, regardless of school level (Table 4a).
Table 4a Frequency of Use of Technology in
Physical Education Program for Student Instruction School Level Total Elementary Middle High School Frequency Used (%) (%) (%) (%) Very frequently 11 11 11 10 Somewhat frequently 33 30 34 36 Somewhat infrequently 47 48 47 46 Not at all 10 11 8 8 Base (#) 1147 500 294 280
Question: How frequently is technology used in your school’s physical education program for student instruction/learning?

RRG 15
Technology is even more pervasive when it comes to its use as a management tool by teachers (such as recording assessment scores or grading). As per Table 4b, over three-quarters use such technology “very frequently” or “somewhat frequently.”
Table 4b Frequency of Use of Technology in Physical
Education Program for Management by Teachers School Level Total Elementary Middle High School Frequency Used (%) (%) (%) (%) Very frequently 43 39 45 51 e Somewhat frequently 33 35 35 28 Somewhat infrequently 19 20 17 18 Not at all 5 6 4 4 Base (#) 1147 500 294 280
Question: How frequently is technology used in your school’s physical education program for
management by teachers (e.g., recording assessment scores, grading)?

RRG 16
What specific technologies are being used by these educators? 72% cite “computers/the internet;” 70% are using pedometers; 51% are using fitness assessment technologies/equipment (such as TriFIT and Tanita scales); and 39% are using heart rate monitors.
Note that pedometers are significantly more likely to be used in elementary schools than in middle or high schools; heart rate monitors are more likely to be used in middle schools vs. elementary schools; and heart rate monitors are significantly more likely to be used in high schools than in either elementary or middle schools (see Table 5)
Table 5 Technology Used in the Physical Education Program
School Level Total Elementary Middle High School Technology/Equipment (%) (%) (%) (%) Computer/Internet 72 70 74 73 Pedometers 70 74 mh 67 64 Fitness Assessment (e.g., TriFIT, Tanita scales) 51 48 55 53 Heart rate monitors 39 30 40 e 53 em Exergames/video games (e.g., Dance Dance Revolution, Wii Fit) 32 31 39 eh 26 Stationary fitness equipment (e.g., treadmill, elliptical) 28 6 35 e 55 em Video recording 19 19 19 20 Smart board 12 11 12 14 Video projection system (e.g., HOPSports) 12 10 15 e 12 Handheld computers 7 7 9 6 Global positioning systems (GPS) 4 3 5 3 Distance Learning 3 2 3 4 Accelerometers 2 1 1 3 Motion analysis system (e.g., Dartfish) 1 - - - Base (#) 1147 500 294 280
Question: Which of the following types of technology are used in your school’s physical education program?

RRG 17
Technology enhances a physical education program in many ways. As per Table 6, nearly two-thirds acknowledge that technology “enhances communication with parents,” 60% feel that it “provides data for assessment and grading,” 59% feel it “enhances instruction,” and 51% feel it “increases student motivation.”
Table 6 Ways Technology Enhances the Physical Education Program
School Level Ways Technology Total Elementary Middle High School Enhances PE Program (%) (%) (%) (%) Enhances communication with parents 64 61 67 67 Provides data for assessment and grading 60 57 65 e 64 Enhances instruction 59 57 57 63 Enhances communication with school/district administrators about student performance/achievement 52 51 54 49 Increases student motivation 51 52 51 48 Increases student accountability for performance/achievement 47 41 49 e 55 e Enhances physical education 45 42 48 45 Provides objective data about student performance 44 45 46 42 Expands physical activity offerings 30 29 34 26 Enables teachers to determine the amount of physical education class time that students spend in moderate to vigorous physical activity 27 23 30 e 29 Increases students’ skills and confidence in using technology 25 22 26 28 Increases support from stakeholders (e.g., parents, administrators) 24 23 25 24 Frees time for teachers to provide students w/ individualized feedback 17 15 19 19 Technology is not used in my
school’s PE program 12 10 13 13
Base (#) 1147 500 294 280
Question: How does technology enhance your school’s physical education program?

RRG 18
D Professional Development for Physical Education Teachers
65% of these educators are required to attend professional development classes. Indeed, for one-third, the school district requires a minimum of three days per year for such classes (Table 7).
Table 7 Days Per Year School District Requires Professional Development Classes Specific to Physical Education
School Level Total Elementary Middle High School Days per school year (%) (%) (%) (%) 0 days 27 27 25 27 1 day 14 14 16 11 2 days 18 19 14 24 m 3 days 12 9 16 e 13 4 days 7 8 6 9 5 or more days 14 15 16 11 Don’t know 9 8 8 10 Base (#) 1131 492 291 271
Question: How many days per school year does your school district require physical education teachers to attend school district provided professional development specific to physical
education?

RRG 19
As shown below, 64% of schools/districts provide funding for physical education teachers to attend professional classes/workshops/conferences…and over 70% provide time-off for attending. Elementary schools are significantly more likely to provide these than are either middle schools or high schools.
Table 8 Incidence of Schools/Districts Providing
Funding and Time-off for Professional Development Classes
School Level Total Elementary Middle High School Incidence (%) (%) (%) (%) School District provides funding to attend professional development classes 64 70 mh 62 h 53 School/District provides release days to attend professional development classes 71 78 mh 64 62 Base (#) 1131 492 291 271
Question: Since 2006, did your school and/or school district provide you with any funding to attend a professional development class/workshop/conference/convention provided by an entity
other than your school district?
Question: Since 2006, did your school and/or school district provide you with any release days (and/or substitute teacher) to attend a professional development class/workshop/conference/
convention provided by an entity other than your school district?

RRG 20
E Professional Organizations
50% of the physical education teachers are members of national AAHPERD; and two-thirds are members of their state’s AAHPERD. In both cases, elementary school instructors are more likely to be members than are their middle school or high school counterparts (Table 9).
75% belong to at least one of the three associations included in the table (national AAHPERD, state AAHPERD or state interscholastic coaches association).
Table 9 Membership in Professional Organizations
School Level Total Elementary Middle High School Organization (%) (%) (%) (%) American Alliance for Health, Physical Education, Recreation & Dance (national AAHPERD) 50 54 mh 45 44 State association for Health, Physical Education, Recreation & Dance (state AAHPERD) 57 68 mh 47 45 State interscholastic coaches association 18 7 17 e 38 em Not a current member of these org’s 25 23 33 e 26 Base (#) 1131 492 291 271
Question: Are you a current member of any of the following professional organizations?
RRG 21
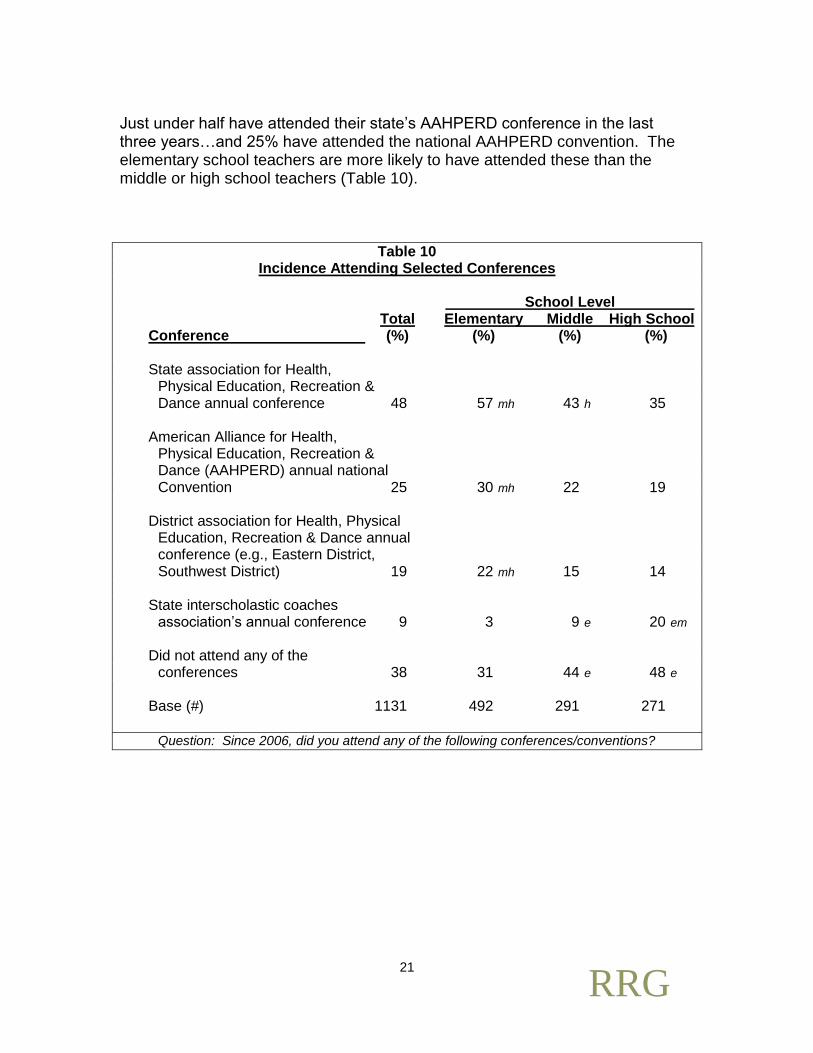
Just under half have attended their state’s AAHPERD conference in the last three years…and 25% have attended the national AAHPERD convention. The elementary school teachers are more likely to have attended these than the middle or high school teachers (Table 10).
Table 10 Incidence Attending Selected Conferences
School Level Total Elementary Middle High School Conference (%) (%) (%) (%) State association for Health, Physical Education, Recreation & Dance annual conference 48 57 mh 43 h 35 American Alliance for Health, Physical Education, Recreation & Dance (AAHPERD) annual national Convention 25 30 mh 22 19 District association for Health, Physical Education, Recreation & Dance annual conference (e.g., Eastern District, Southwest District) 19 22 mh 15 14 State interscholastic coaches association’s annual conference 9 3 9 e 20 em Did not attend any of the conferences 38 31 44 e 48 e Base (#) 1131 492 291 271
Question: Since 2006, did you attend any of the following conferences/conventions?

RRG 22
F The Principal’s Knowledge and Involvement
When it comes to physical education programs – regardless of school level – roughly one-quarter rate their principal as “very knowledgeable” (Table 11). And, as per Table 12, 58% of the teachers rate their principal as “very supportive” of the physical education program (67% of elementary school physical education teachers, vs. 54% of those teaching in middle school and 49% of those teaching in high school).
Table 11 Rating The Principal’s Knowledge About Physical Education
School Level Total Elementary Middle High School Principal’s Level of Knowledge (%) (%) (%) (%) Very knowledgeable 27 28 29 27 Somewhat knowledgeable 55 57 52 52 Not knowledgeable 18 15 20 21 Base (#) 1125 490 291 271
Question: How would you rate your principal’s knowledge about physical education as an
instructional program?
Table 12 Rating The Principal’s Support for Physical Education Program
School Level Principal’s Support for Total Elementary Middle High School Physical Education Program (%) (%) (%) (%) Very supportive 58 67 mh 54 49 Somewhat supportive 35 29 35 e 39 e Not supportive 7 4 10 11 e Base (#) 1125 490 291 271
Question: How would you rate your principal’s support for your school’s physical education program?

RRG 23
How often do principals conduct formal evaluations of instructors? 45% report that their principal conducts such an evaluation once a year…for 37% it’s two or more times a year…and for 18% it’s “never” (Table 13).
Table 13 Frequency with Which Principal Conducts a Teacher Evaluation
School Level Total Elementary Middle High School Frequency (%) (%) (%) (%) One time during the school year 45 48 41 42 Two times during the school year 26 31 h 25 19 Three or more times during the school year 11 10 16 h 10 Never 18 11 18 e 29 e Base (#) 1125 490 291 271
Question: During one school year, how often does your school principal conduct a formal evaluation of you (the teacher)?
RRG 24
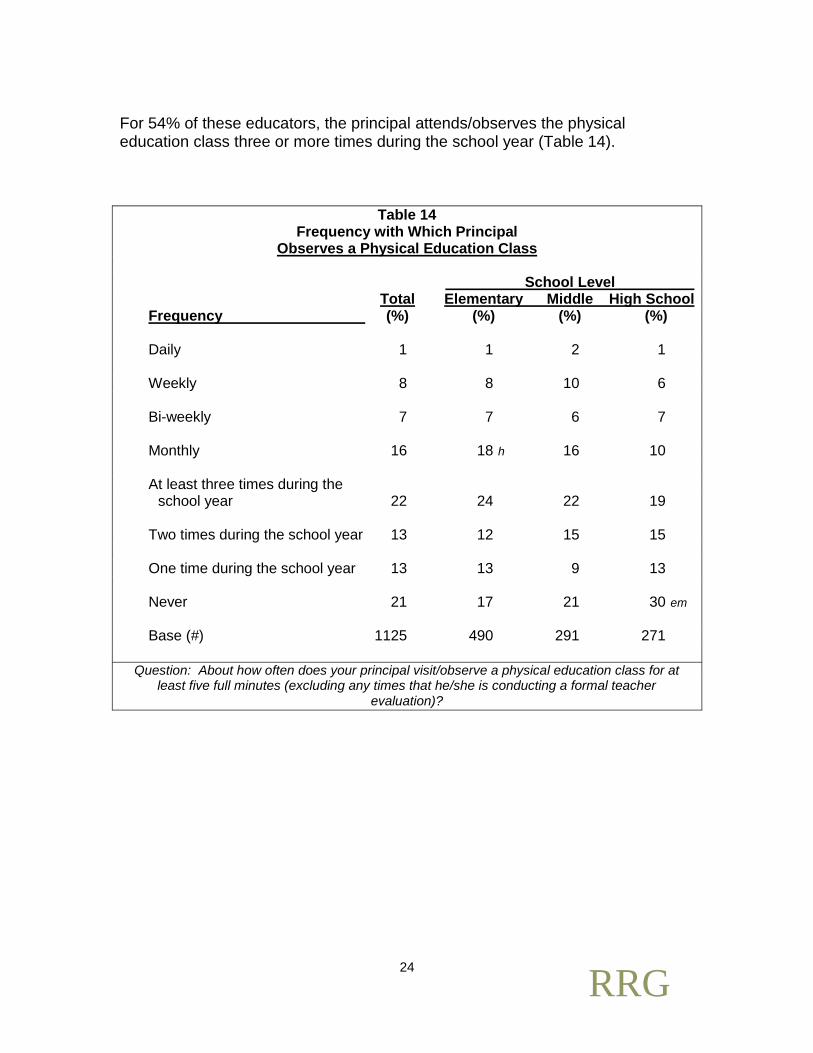
For 54% of these educators, the principal attends/observes the physical education class three or more times during the school year (Table 14).
Table 14 Frequency with Which Principal
Observes a Physical Education Class
School Level Total Elementary Middle High School Frequency (%) (%) (%) (%) Daily 1 1 2 1 Weekly 8 8 10 6 Bi-weekly 7 7 6 7 Monthly 16 18 h 16 10 At least three times during the school year 22 24 22 19 Two times during the school year 13 12 15 15 One time during the school year 13 13 9 13 Never 21 17 21 30 em Base (#) 1125 490 291 271
Question: About how often does your principal visit/observe a physical education class for at least five full minutes (excluding any times that he/she is conducting a formal teacher
evaluation)?
RRG 25
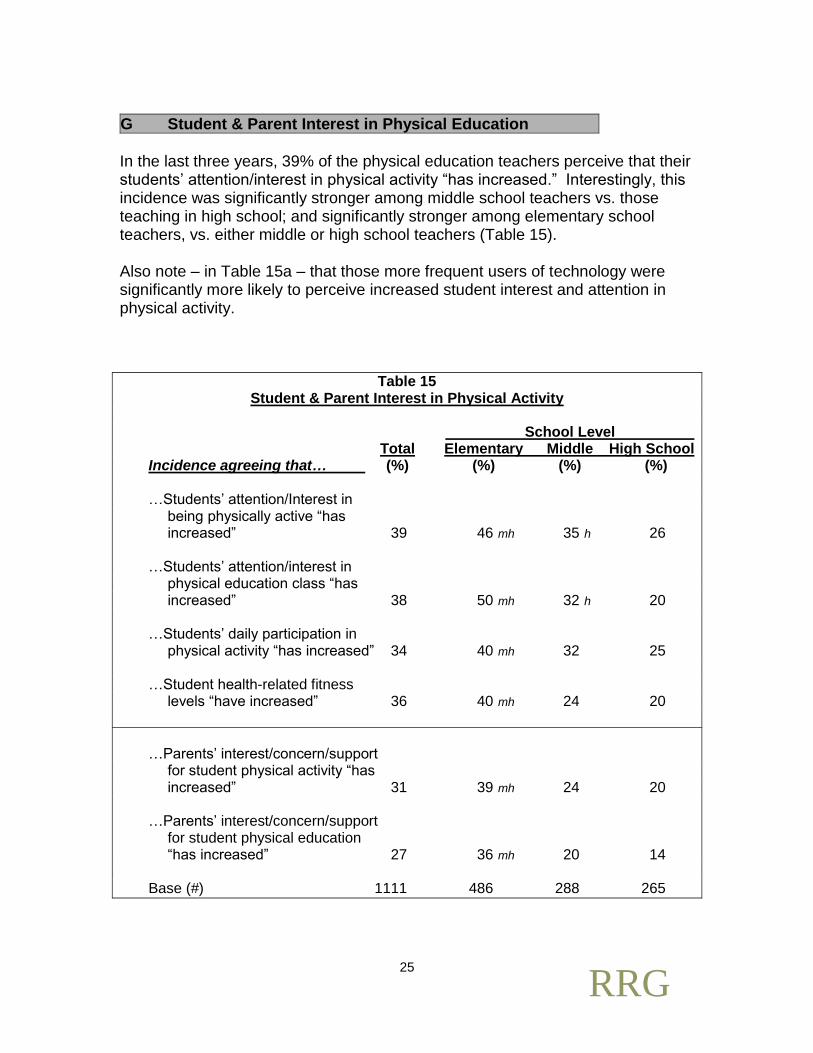
G Student & Parent Interest in Physical Education
In the last three years, 39% of the physical education teachers perceive that their students’ attention/interest in physical activity “has increased.” Interestingly, this incidence was significantly stronger among middle school teachers vs. those teaching in high school; and significantly stronger among elementary school teachers, vs. either middle or high school teachers (Table 15). Also note – in Table 15a – that those more frequent users of technology were significantly more likely to perceive increased student interest and attention in physical activity.
Table 15 Student & Parent Interest in Physical Activity
School Level Total Elementary Middle High School Incidence agreeing that… (%) (%) (%) (%) …Students’ attention/Interest in being physically active “has increased” 39 46 mh 35 h 26 …Students’ attention/interest in physical education class “has increased” 38 50 mh 32 h 20 …Students’ daily participation in physical activity “has increased” 34 40 mh 32 25 …Student health-related fitness levels “have increased” 36 40 mh 24 20
…Parents’ interest/concern/support for student physical activity “has increased” 31 39 mh 24 20 …Parents’ interest/concern/support for student physical education “has increased” 27 36 mh 20 14 Base (#) 1111 486 288 265

RRG 26
Table 15a
Recent Change in Students’ Daily Participation in Physical Activity (Among more frequent users of technology for student instruction)
Among … …More frequent …Less frequent users of & non-users technology of technology Incidence agreeing that… (%) (%) …Students’ attention/interest in being physically active “has increased” 47 33 …Students’ attention/interest in physical education class “has increased” 46 32 …Students’ daily participation in physical activity “has increased” 42 28 …Students’ health-related fitness levels “have increased” 46 28
…Parents’ interest/concern/support for student physical activity “has increased” 38 26 …Parents’ interest/concern/support for student physical education “has increased” 34 21 Base (#) 484 627
As one might expect, the pattern for “interest in physical education class” is near-identical to the pattern for “interest in physical activity:”
38% of teachers perceive increased interest from students in physical education class; significantly more among the middle school teachers vs. the high school teachers; and significantly more among the elementary school teachers vs. those in middle or high school…
…And incidence perceiving increased interest is significantly higher among more frequent users of technology vs. those who never or rarely use technology.
And the pattern roughly parallels the aforesaid for “students’ daily participation in physical activity” and for “students’ health-related fitness levels.”
RRG 27
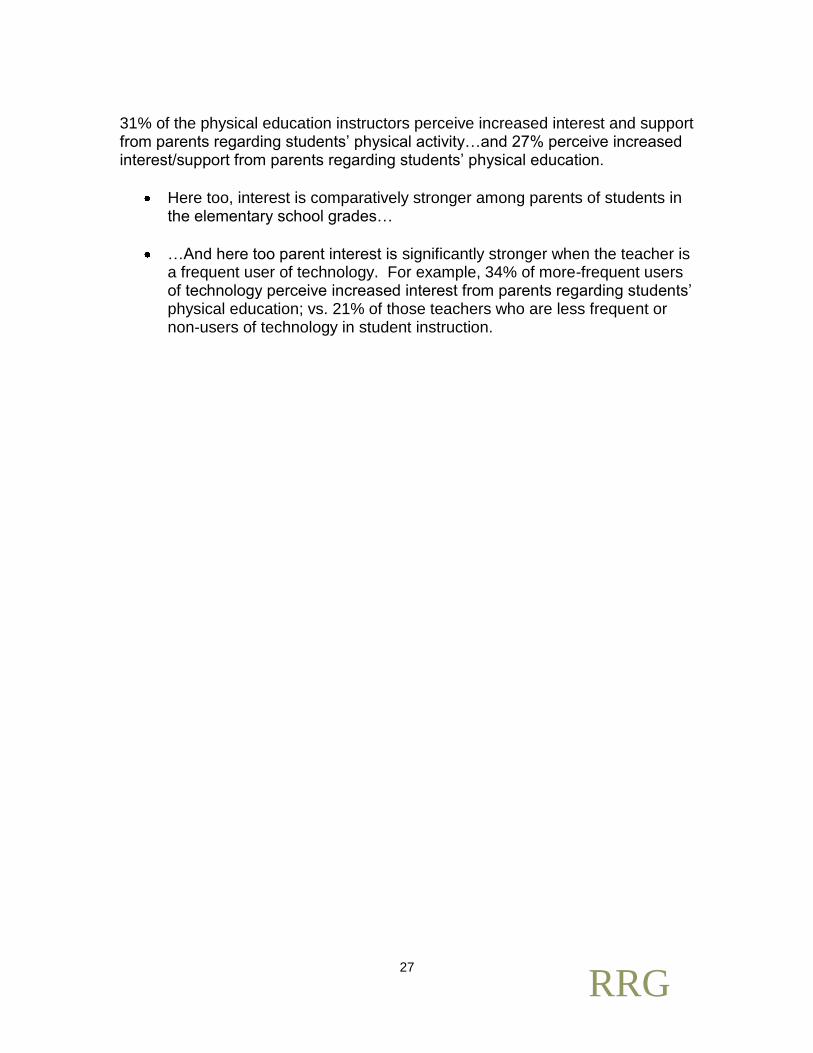
31% of the physical education instructors perceive increased interest and support from parents regarding students’ physical activity…and 27% perceive increased interest/support from parents regarding students’ physical education.
Here too, interest is comparatively stronger among parents of students in the elementary school grades…
…And here too parent interest is significantly stronger when the teacher is a frequent user of technology. For example, 34% of more-frequent users of technology perceive increased interest from parents regarding students’ physical education; vs. 21% of those teachers who are less frequent or non-users of technology in student instruction.

RRG 28
41% have formally surveyed their students about their satisfaction and/or ideas vis-a-vis the physical education program; and 13% have surveyed parents (Table 16).
Table 16 Incidence Who have Formally Surveyed
Students or Parents Regarding the Physical Education Program School Level Total Elementary Middle High School Incidence (%) (%) (%) (%) Have surveyed students 41 38 42 43 Have surveyed parents 13 16 m 9 11 Base (#) 1111 486 288 265
Question: Since 2006, have you ever formally surveyed your students about their satisfaction with and/or ideas for your school’s physical education program?
Question: Since 2006, have you ever formally surveyed your students’ parents about their
satisfaction with and/or ideas for your school’s physical education program?

RRG 29
H Funding for Physical Education Programs
For over 60% of programs – and for 80% of elementary school programs – annual funding is under $1,000. Indeed, the median for physical education programs is $764. Only 15% have funding of $2,000 or more. Among high school programs, 32% have funding of $2,000 or more…with the median being $1,370.
Table 17 Funding from School/School Districts for Physical Education Programs
School Level Total Elementary Middle High School Average Funds (%) (%) (%) (%) $0 7 7 7 7 $1-$499 31 47 mh 23 h 10 $500-$999 23 26 h 25 19 $1,000-$1,499 14 11 15 19 e $1,500-$1,999 10 5 13 e 15 e $2,000-$2,499 4 1 6 e 8 e $2,500 or more 11 4 11 e 24 em Median ($) $764 $460 $900 $1,370 Base (#) 1102 483 287 260
Question: Since 2006, what has been the approximate average funding for your school’s physical education program from only your school’s and/ or school district’s budgets?

RRG 30
Table 18 displays the various sources of funds for physical education programs. Specifically school budget is the most-cited source (for 64%), followed by school district budget, PTA/PTO, and grant programs. Note that the district is more likely to be a source as school level increases…and PTA/PTO and school fundraisers are less likely to be sources as school level increases.
Table 18 Sources of Funds for Physical Education Program
School Level Total Elementary Middle High School
Source (%) (%) (%) (%) School budget 64 66 64 64 School district budget 38 35 36 h 45 e School’s parent/teacher assn. or org. (PTA, PTO) 34 53 mh 22 h 9 Grant program 28 31 h 27 20 School fundraiser 27 36 mh 25 h 12 Financial donation from a local (community) corporate partner 3 3 5 h 1 Financial donation from a local (community) foundation 3 4 3 1 Financial donation from a local (community) org. other than a corporation or foundation 3 2 2 2 None of the above 2 1 3 3 Don’t know 4 1 5 9 Base (#) 1102 483 287 260
Question: Since 2006, what have been the sources of funding for your school’s physical education program?

RRG 31
Most have seen their budgets for physical education programs remain the same or shrink in recent years: 45% say that their budgets have remained about the same since 2006; and 36% say that budgets have decreased.
Table 19 Recent Changes in Funding for Physical Education Program
School Level Total Elementary Middle High School Recent changes in funding (%) (%) (%) (%) Funding has increased substantially 3 3 2 3 Funding has increased slightly 8 8 8 7 Funding has stayed about the same 45 51 h 47 h 37 Funding has decreased slightly 21 21 19 25 Funding has decreased substantially 15 13 16 14 Don’t know 8 5 7 14 Base (#) 1102 483 287 260
Question: Since 2006, what has been the status of funding for your school’s physical education program?
RRG 32
APPENDIX A – Student & Parent Interest – Detailed Tables
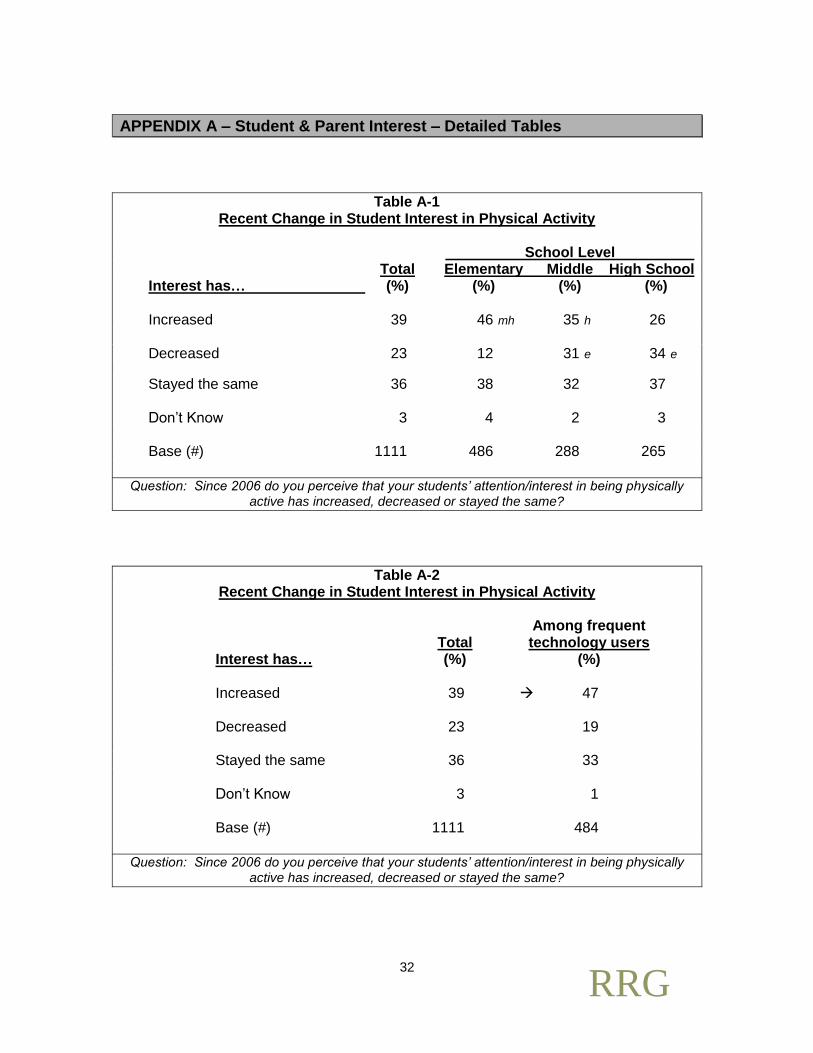
Table A-1 Recent Change in Student Interest in Physical Activity
School Level Total Elementary Middle High School Interest has… (%) (%) (%) (%) Increased 39 46 mh 35 h 26 Decreased 23 12 31 e 34 e
Stayed the same 36 38 32 37 Don’t Know 3 4 2 3 Base (#) 1111 486 288 265
Question: Since 2006 do you perceive that your students’ attention/interest in being physically active has increased, decreased or stayed the same?
Table A-2 Recent Change in Student Interest in Physical Activity
Among frequent Total technology users Interest has… (%) (%) Increased 39 47 Decreased 23 19 Stayed the same 36 33 Don’t Know 3 1 Base (#) 1111 484
Question: Since 2006 do you perceive that your students’ attention/interest in being physically active has increased, decreased or stayed the same?

RRG 33
Table A-3
Recent Change in Student Interest in Physical Education Class
School Level Total Elementary Middle High School Interest has… (%) (%) (%) (%) Increased 38 50 mh 32 h 20 Decreased 17 7 23 e 33 em
Stayed the same 42 41 42 43 Don’t Know 3 3 4 3 Base (#) 1111 486 288 265
Question: Since 2006 do you perceive that your students’ attention/interest in physical education class has increased, decreased or stayed the same?
Table A-4 Recent Change in Student Interest in Physical Education Class
Among frequent Total technology users Interest has… (%) (%) Increased 38 46 Decreased 17 13 Stayed the same 42 39 Don’t Know 3 2 Base (#) 1111 484
Question: Since 2006 do you perceive that your students’ attention/interest in physical education class has increased, decreased or stayed the same?
RRG 34
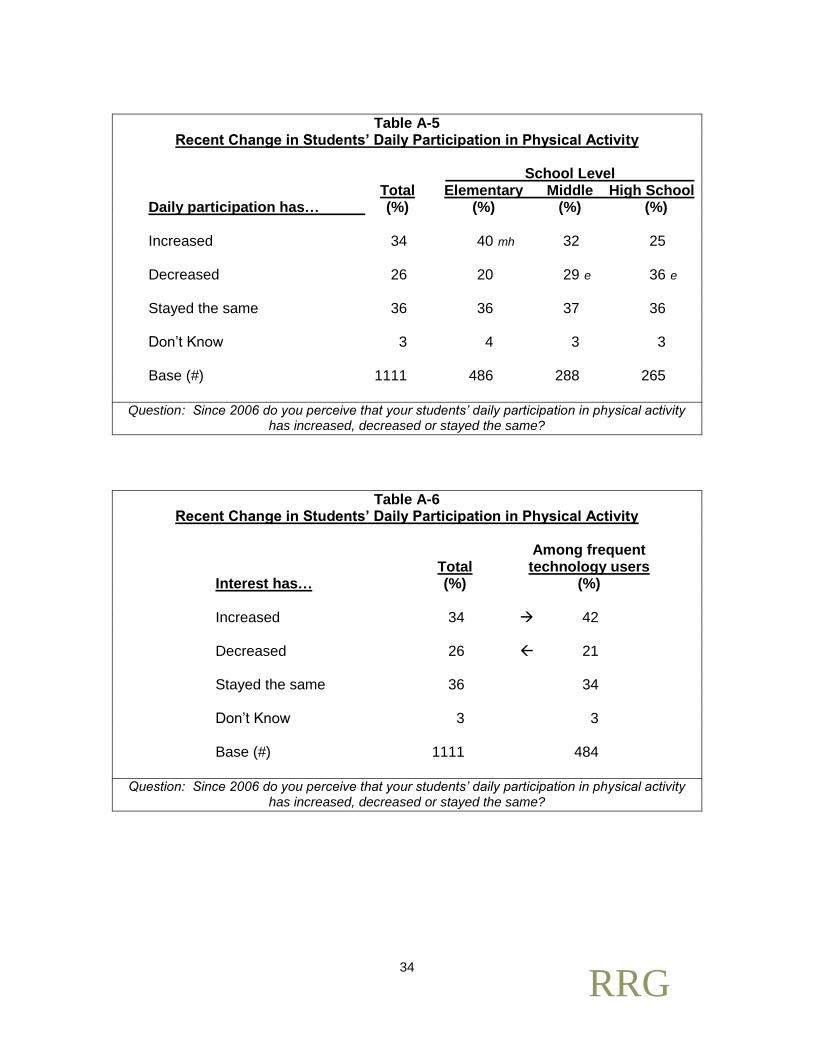
Table A-5
Recent Change in Students’ Daily Participation in Physical Activity
School Level Total Elementary Middle High School Daily participation has… (%) (%) (%) (%) Increased 34 40 mh 32 25 Decreased 26 20 29 e 36 e
Stayed the same 36 36 37 36 Don’t Know 3 4 3 3 Base (#) 1111 486 288 265
Question: Since 2006 do you perceive that your students’ daily participation in physical activity has increased, decreased or stayed the same?
Table A-6 Recent Change in Students’ Daily Participation in Physical Activity
Among frequent Total technology users Interest has… (%) (%) Increased 34 42 Decreased 26 21 Stayed the same 36 34 Don’t Know 3 3 Base (#) 1111 484
Question: Since 2006 do you perceive that your students’ daily participation in physical activity
has increased, decreased or stayed the same?
RRG 35
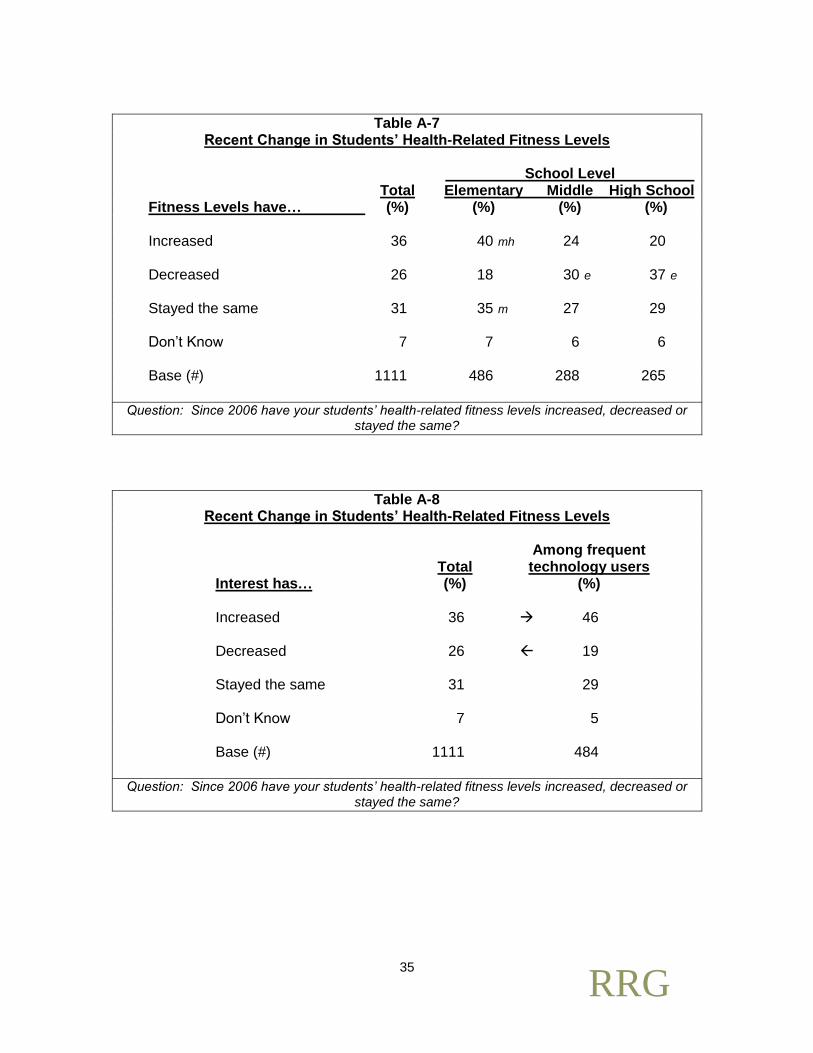
Table A-7
Recent Change in Students’ Health-Related Fitness Levels
School Level Total Elementary Middle High School Fitness Levels have… (%) (%) (%) (%) Increased 36 40 mh 24 20 Decreased 26 18 30 e 37 e
Stayed the same 31 35 m 27 29 Don’t Know 7 7 6 6 Base (#) 1111 486 288 265
Question: Since 2006 have your students’ health-related fitness levels increased, decreased or stayed the same?
Table A-8 Recent Change in Students’ Health-Related Fitness Levels
Among frequent Total technology users Interest has… (%) (%) Increased 36 46 Decreased 26 19 Stayed the same 31 29 Don’t Know 7 5 Base (#) 1111 484
Question: Since 2006 have your students’ health-related fitness levels increased, decreased or
stayed the same?

RRG 36
Table A-9
Recent Change in Parents’ Interest and Support for Students’ Physical Activity
School Level Total Elementary Middle High School Parents’ Interest Levels have… (%) (%) (%) (%) Increased 31 39 mh 24 20 Decreased 17 10 23 e 26 e
Stayed the same 41 41 44 40 Don’t Know 12 11 9 14 Base (#) 1111 486 288 265
Question: Since 2006 do you perceive that interest/concern/support for student physical activity among your students’ parents has increased, decreased or stayed the same?
Table A-10 Recent Change in Parents’ Interest and Support for Students’ Physical Activity
Among frequent Total technology users Interest has… (%) (%) Increased 31 38 Decreased 17 15 Stayed the same 41 38 Don’t Know 12 9 Base (#) 1111 484
Question: Since 2006 do you perceive that interest/concern/support for student physical activity
among your students’ parents has increased, decreased or stayed the same?

RRG 37
Table A-11
Recent Change in Parents’ Interest and Support for Students’ Physical Education
School Level Total Elementary Middle High School Parents’ Interest Levels have… (%) (%) (%) (%) Increased 27 36 mh 20 14 Decreased 15 6 20 e 25 e
Stayed the same 48 47 50 46 Don’t Know 12 11 11 14 Base (#) 1111 486 288 265
Question: Since 2006, do you perceive that interest/concern/support for physical education among your students’ parents has increased, decreased or stayed the same?
Table A-12 Recent Change in Parents’ Interest and Support for Students’ Physical Education
Among frequent Total technology users Interest has… (%) (%) Increased 27 34 Decreased 15 13 Stayed the same 48 44 Don’t Know 12 9 Base (#) 1111 484
Question: Since 2006, do you perceive that interest/concern/support for physical education
among your students’ parents has increased, decreased or stayed the same?

RRG 38
APPENDIX B -- Respondent Profile
# of yrs as Physical Education teacher (avg. #) 15.2 Community Where School Is Situated (%) Urban 28% Suburban 48% Rural 24% School Level (%) Elementary school 44% Middle school 25% High school 25% Other 6% School Type (%) Public 95% Private 4% Charter -