PHYS TOC F15 - Coastal Carolina University TABLE OF CONTENTS ... *Note: Institutions required to use...
16
FALL 2015 College of Science PHYSICS
Transcript of PHYS TOC F15 - Coastal Carolina University TABLE OF CONTENTS ... *Note: Institutions required to use...
FALL 2015
College of Science
PHYSICS
185
PHYSICS
TABLE OF CONTENTS
Fall and Spring Enrollment Trends .................................................................... 187 Summer Enrollment Trends .............................................................................. 188 Fall Enrollment Trends by Race ........................................................................ 189 Fall Enrollment Trends by Gender .................................................................... 190 Fall Enrollment Trends by Class Level .............................................................. 191 Residency Classification of Students for Fee Payment Purposes .................... 192 Geographic Distribution by State ...................................................................... 193 Geographic Distribution by Country .................................................................. 194 Migration of Transfer Students to Coastal Carolina University ......................... 195 First-Time Full-Time Freshmen SAT Scores ..................................................... 196 First-Time Full-Time Freshmen ACT Scores .................................................... 197 First-Time Full-Time Freshmen High School GPA ............................................ 198 First-Time Full-Time Freshmen Retention ........................................................ 199 First-Time Full-Time Transfer Retention ........................................................... 200

Year Headcount Year Headcount2006 4 2007 32007 9 2008 142008 22 2009 202009 28 2010 262010 28 2011 252011 27 2012 282012 38 2013 322013 34 2014 362014 60 2015 582015 73
Fall Semester Spring Semester
College of ScienceFall and Spring Semester
Enrollment Trends2006-2015
Physics
0
10
20
30
40
50
60
70
80
06-07 07-08 08-09 09-10 10-11 11-12 12-13 13-14 14-15 15-16
Hea
dco
un
t
Fall Semester Spring Semester
187

May Summer I Summer IISemester Semester Semester Total
Year # Students # Students # Students # Students2006 0 2 2 42007 0 0 0 02008 1 4 3 82009 1 4 2 72010 1 3 5 92011 1 1 5 72012 0 2 3 52013 1 1 2 42014 1 2 2 52015 3 6 7 16
2006-2015Enrollment TrendsSummer SemestersCollege of Science
Physics
0
1
2
3
4
5
6
7
2006 2007 2008 2009 2010 2011 2012 2013 2014 2015
Head
count
May Summer I Summer II
188
#%
#%
#%
#%
#%
#%
#%
#%
#%
#%
ETH
NIC
ITY
His
pani
c/La
tino
00.
0%0
0.0%
00.
0%0
0.0%
00.
0%0
0.0%
12.
6%0
0.0%
58.
3%5
6.8%
RAC
EAm
eric
an I
ndia
n/
Ala
skan
Nat
ive
00.
0%0
0.0%
00.
0%0
0.0%
00.
0%0
0.0%
00.
0%0
0.0%
00.
0%0
0.0%
Asi
an0
0.0%
00.
0%0
0.0%
00.
0%0
0.0%
00.
0%0
0.0%
00.
0%0
0.0%
11.
4%Bla
ck/
Afr
ican
Am
eric
an0
0.0%
111
.1%
14.
5%2
7.1%
517
.9%
414
.8%
615
.8%
514
.7%
610
.0%
1520
.5%
Nat
ive
Haw
aiia
n/
Paci
fic I
slan
der
---
N/A
---
N/A
---
N/A
00.
0%0
0.0%
00.
0%0
0.0%
00.
0%0
0.0%
00.
0%W
hite
410
0.0%
888
.9%
2090
.9%
2589
.3%
2278
.6%
2385
.2%
3181
.6%
2985
.3%
4575
.0%
4663
.0%
Two
or M
ore
Rac
es--
-N
/A--
-N
/A--
-N
/A1
3.6%
13.
6%0
0.0%
00.
0%0
0.0%
46.
7%5
6.8%
Non
-Res
iden
t Alie
n0
0.0%
00.
0%0
0.0%
00.
0%0
0.0%
00.
0%0
0.0%
00.
0%0
0.0%
11.
4%U
nkno
wn
00.
0%0
0.0%
14.
5%0
0.0%
00.
0%0
0.0%
00.
0%0
0.0%
00.
0%0
0.0%
TOTA
L4
10
0.0
%9
10
0.0
%2
21
00
.0%
28
10
0.0
%2
81
00
.0%
27
10
0.0
%3
81
00
.0%
34
10
0.0
%6
01
00
.0%
73
10
0.0
%
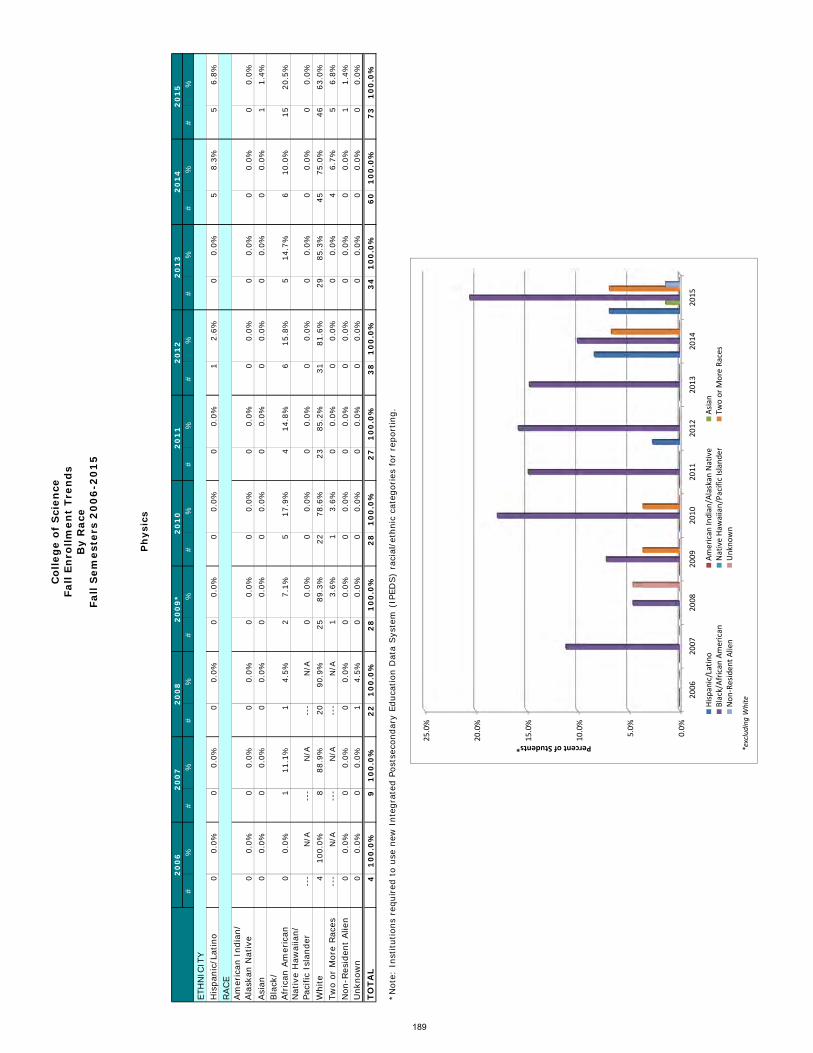
*Not
e: I
nstit
utio
ns r
equi
red
to u
se n
ew I
nteg
rate
d Po
stse
cond
ary
Educ
atio
n D
ata
Sys
tem
(IP
EDS)
raci
al/e
thni
c ca
tego
ries
for
rep
ortin
g.
189
Co
lleg
e o
f S
cien
ceFa
ll En
rollm
ent
Tren
ds
By
Rac
eFa
ll S
emes
ters
20
06
-20
15
Ph
ysic
s
20
06
20
07
20
08
20
15
20
09
*2
01
02
01
12
01
22
01
32
01
4
0.0%
5.0%
10.0%
15.0%
20.0%
25.0%
2006
2007
2008
2009
2010
2011
2012
2013
2014
2015
Percent of Students*
Hispanic/Latino
American In
dian/Alaskan
Native
Asian
Black/African
American
Native Haw
aiian/Pacific Islander
Two or More Races
Non‐Resident Alien
Unknown
*excluding
White
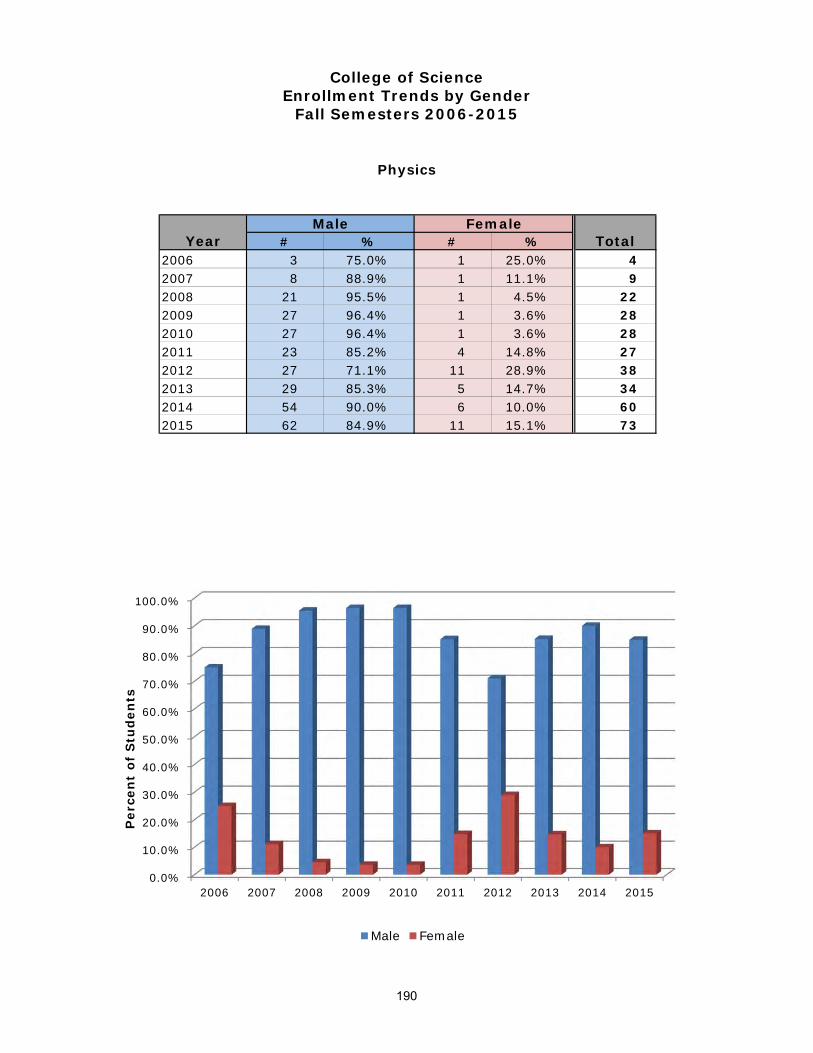
2006 3 75.0% 1 25.0% 42007 8 88.9% 1 11.1% 92008 21 95.5% 1 4.5% 222009 27 96.4% 1 3.6% 282010 27 96.4% 1 3.6% 282011 23 85.2% 4 14.8% 272012 27 71.1% 11 28.9% 382013 29 85.3% 5 14.7% 342014 54 90.0% 6 10.0% 602015 62 84.9% 11 15.1% 73
College of ScienceEnrollment Trends by Gender
Fall Semesters 2006-2015
Physics
% # %#Male Female
TotalYear
0.0%
10.0%
20.0%
30.0%
40.0%
50.0%
60.0%
70.0%
80.0%
90.0%
100.0%
2006 2007 2008 2009 2010 2011 2012 2013 2014 2015
Per
cen
t of
Stu
den
ts
Male Female
190

Year Total2006 0 2 1 1 42007 6 0 2 1 92008 10 8 1 3 222009 8 9 9 2 282010 11 5 6 6 282011 9 7 5 6 272012 15 9 7 7 382013 13 9 5 7 342014 31 15 6 8 602015 28 26 12 7 73
Freshman Sophomore Junior Senior
College of ScienceEnrollment Trends by Class Level
Fall Semesters 2006-2015
Physics
0
5
10
15
20
25
30
35
2006 2007 2008 2009 2010 2011 2012 2013 2014 2015
Hea
dco
un
t
Freshman Sophomore Junior Senior
191

Year % % Total2006 4 100.0% 0 0.0% 4 2007 8 88.9% 1 11.1% 9 2008 20 90.9% 2 9.1% 22 2009 22 78.6% 6 21.4% 28 2010 25 89.3% 3 10.7% 28 2011 22 81.5% 5 18.5% 27 2012 33 86.8% 5 13.2% 38 2013 28 82.4% 6 17.6% 34 2014 53 88.3% 7 11.7% 60 2015 65 89.0% 8 11.0% 73
*Residency classification for fee payment purposes is defined by South Carolina statute.
College of ScienceResidency Classification of Students
For Fee Payment Purposes*Fall Semesters 2006-2015
#In-State Out-of-State#
Physics
0.0%
10.0%
20.0%
30.0%
40.0%
50.0%
60.0%
70.0%
80.0%
90.0%
100.0%
2006 2007 2008 2009 2010 2011 2012 2013 2014 2015
Per
cen
t of
Stu
den
ts
In-State Out-of-State
192

StateSouth Carolina 20 30 27 44 55Virginia 0 1 0 4 5New York 1 2 3 5 3Connecticut 1 0 0 0 2New Jersey 2 1 2 2 2Pennsylvania 1 0 0 0 2California 0 0 0 0 1New Hampshire 0 0 0 0 1North Carolina 0 0 0 0 1Delaware 1 1 1 2 0Other States 1 3 1 3 0
College of Science
2015
Physics
Fall Semesters 2011-2015Enrollment by State
Geographic Distribution of
2011 2012 2013 2014
0
10
20
30
40
50
60
SC VA NY CT NJ PA CA NH NC
55
5 3 2 2 2 1 1 1
Hea
dco
un
t
Fall 2015
193

CountryGhana 0 0 0 0 1Other Countries 0 0 0 0 0
Total 0 0.0% 0 0.0% 0 0.0% 0 0.0% 1 1.4%
College of Science
2015
Physics
Fall Semesters 2011-2015Enrollment by Country
Geographic Distribution of
2011 2012 2013 2014
194

Transfers From:The Citadel 0 0 0 0 0Clemson University 0 0 0 0 0College of Charleston 0 0 0 0 0Francis Marion University 0 0 0 0 0Lander University 0 0 0 0 0S.C. State University 0 0 0 0 0USC-Columbia 0 0 0 0 0USC-Aiken 0 0 0 0 0USC-Beaufort 0 0 0 0 0USC-Upstate 0 0 0 0 0Winthrop University 0 0 0 0 0Medical University of South Carolina 0 0 0 0 0
Two-year USC Campuses 0 0 0 0 0
Horry-Georgetown Technical College 0 0 1 1 6Other SC Technical Colleges 0 1 0 1 2
Private Senior Institutions 0 0 0 0 0Private Two-year Colleges 0 0 0 0 0
Total SC Transfers 0 1 1 2 8
Out-of-State Colleges 0 2 0 3 1Foreign Colleges 0 0 0 1 0
Total Transfers 0 3 1 6 9
toMigration of Transfer Students
College of Science
20152012
Fall Semesters 2011-2015Coastal Carolina University
2011
Physics
2013 2014
195

Year N N2010 2 1290 1250 1330 2 975 950 10002011 3 1133 960 1240 1 1170 1170 11702012 7 977 770 1140 2 985 980 9902013 4 918 840 970 2 940 920 9602014 11 1051 830 1370 9 1103 940 12402015 9 1042 890 1210 4 1053 880 1280
SAT Total Score0 01 13 11 12 02 10 0
9 4
Out-of-State
1200-1299>1299
Total
<800800-899900-9991000-10991100-1199
In-StateFall 2015
In-State
College of ScienceFirst-Time Full-Time Freshmen
SAT ScoresFall Semesters 2010-2015
Mean Min MaxOut-of-State
Mean Min Max
Physics
0100200300400500600700800900
100011001200
2010 2011 2012 2013 2014 2015
12901133
977918
10511042
975
1170
985940
11031053
Ave
rag
e S
AT
Sco
re
In-State Out-of-State
196

Year N N2010 2 19.5 19 20 1 20.0 20 202011 2 19.0 17 21 0 N/A N/A N/A2012 4 25.5 22 28 1 28.0 28 282013 2 22.0 19 25 0 N/A N/A N/A2014 9 23.7 18 31 0 N/A N/A N/A2015 6 19.8 18 24 1 26.0 26 26
0 03 01 00 00 01 01 1
6 1
College of ScienceFirst-Time Full-Time Freshmen
ACT ScoresFall Semesters 2010-2015
In-State Out-of-StateFall 2015
Mean Min MaxIn-State Out-of-State
Mean Min Max
Physics
< 1818
Total
ACT Total Score
19202122> 22
123456789
101112131415161718192021222324252627282930
2010 2011 2012 2013 2014 2015
19.5 19.0
25.5
22.023.7
19.820.0
28.026.0
Ave
rag
e A
CT
Sco
res
In-State Out-of-State
197

Year N N2010 4 3.73 3.13 4.30 3 3.08 3.00 3.232011 5 3.89 2.90 4.29 1 3.87 3.87 3.872012 11 3.81 3.01 4.56 3 3.78 2.60 4.602013 6 3.31 3.09 3.67 2 2.81 2.61 3.002014 20 3.82 2.53 4.66 9 3.40 2.97 3.802015 16 3.56 3.06 4.21 5 3.20 2.31 4.37
0 00 00 10 19 17 2
16 5
College of Science
Min MaxOut-of-State
Mean Min Max
First-Time Full-Time FreshmenHigh School GPA
Fall Semesters 2010-2015
In-StateMean
Physics
Total
High School GPA
2.00 - 2.492.50 - 2.993.00 - 3.49>= 3.50
Fall 2015In-State Out-of-State
< 1.751.75 - 1.99
0.000.250.500.751.001.251.501.752.002.252.502.753.003.253.503.754.00
2010 2011 2012 2013 2014 2015
3.733.89 3.81
3.31
3.82
3.56
3.08
3.87 3.78
2.81
3.403.20
Ave
rag
e H
igh
Sch
ool
GP
A
In-State Out-of-State
198

# N
ew F
ull-
tim
e
PH
YS
Fre
shm
en
Ret
urne
d 2n
d Ye
ar4
54
104
23
Ret
urne
d 3r
d Ye
ar3
54
84
Ret
urne
d 4t
h Ye
ar2
42
7
AFT
ER 4
TH Y
EAR
Gra
duat
ed2
32
Ret
urne
d1
11
Tota
l Ret
entio
n3
43
AFT
ER 5
TH Y
EAR
Gra
duat
ed2
4
Ret
urne
d1
0
Tota
l Ret
entio
n3
4
AFT
ER 6
TH Y
EAR
Gra
duat
ed2
Ret
urne
d1
Tota
l Ret
entio
n3
Six
-yea
r G
rad
uat
ion
Rat
es
Col
leg
e of
Sci
ence
87
614
829
21
20
15
Firs
t-Ti
me
Full-
Tim
e Fr
esh
men
Ret
enti
onFa
ll S
emes
ters
20
09
-20
15
25.0
%
25.0
%
57.1
%
66.7
%
57.1
%
37.5
%
12.5
%
25.0
%
50.0
%
37.5
%
50.0
%
57.1
%
71.4
%
71.4
%
66.7
%
33.3
%
37.5
%
12.5
%
25.0
%
57.1
%
0.0%
20
13
20
12
20
11
20
10
16.7
%
33.3
%
50.0
%
50.0
%
57.1
%
71.4
%
20
14
25.0
%20
09
14.3
%20
08
40.0
%20
0779.3
%
199
Ph
ysic
s
0.0%
2006
Perc
ent
Coh
ort
2005
N/A
20
09
14.3
%
42.9
%
37.5
%
12.5
%
50.0
%

# N
ew F
ull-
tim
e
PH
YS
Tra
nsf
ers
AFT
ER 1
ST
YEA
R
Gra
duat
ed0
00
00
0
Ret
urne
d1
10
21
3
Tota
l Ret
entio
n1
10
21
3
AFT
ER 2
ND
YEA
R
Gra
duat
ed0
00
00
Ret
urne
d0
00
10
Tota
l Ret
entio
n0
00
10
AFT
ER 3
RD
YEA
R
Gra
duat
ed0
00
0
Ret
urne
d0
00
0
Tota
l Ret
entio
n0
00
0
AFT
ER 4
TH Y
EAR
Gra
duat
ed0
00
Ret
urne
d0
00
Tota
l Ret
entio
n0
00
AFT
ER 5
TH Y
EAR
Gra
duat
ed0
0
Ret
urne
d0
0
Tota
l Ret
entio
n0
0
AFT
ER 6
TH Y
EAR
Gra
duat
ed0
Ret
urne
d0
Tota
l Ret
entio
n0
0.0%
0.0%
0.0%
0.0%
0.0%
0.0%
0.0%
0.0%
0.0%
0.0%
0.0%
0.0%
0.0%
0.0%
0.0%
0.0%
0.0%
0.0%
0.0%
0.0%
0.0%
0.0%
0.0%
0.0%
50.0
%
50.0
%0.
0%
0.0%
0.0%
0.0%
0.0%
0.0%
0.0%
0.0%
0.0%
0.0%
0.0%
50.0
%0.
0%
0.0%
100.
0%
100.
0%10
0.0%
0.0%
60.0
%
60.0
%
2009
0.0%
0.0%
0.0%
0.0%
33.3
%50
.0%
0.0%
33.3
%
0.0%
2007
0.0%
0.0%
2008
0.0%
0.0%
2005
N/A
2006
N/A
0.0%
Six
-yea
r G
rad
uat
ion
Rat
es
0.0%
0.0%
Coh
ort
Perc
ent
0.0%
0.0%
93
20
21
5
200
Col
leg
e of
Sci
ence
New
Tra
nsf
er R
eten
tion
Fall
Sem
este
r 2
00
9-2
01
5
20
09
20
10
20
11
20
12
20
13
20
14
20
15
Ph
ysic
s
0.0%
100.
0%