Phylogeny and molecular biology in amphibian ecotoxicology · implicados na resposta de defesa a...
123
Phylogeny and molecular biology in amphibian ecotoxicology Nina Guerra Serén Mestrado em Biodiversidade, Genética e Evolução Departamento de Biologia 2013 Orientadora Ylenia Chiari, Post-Doctoral Researcher, CIBIO, Centro de Investigação em Biodiversidade e Recursos Genéticos Coorientadores Miguel Carretero, Associate Researcher, CIBIO, Centro de Investigação em Biodiversidade e Recursos Genéticos Enrique García-Muñoz, Post-Doctoral Researcher, CESAM (Centro de Estudos do Ambiente e do Mar) of Universidade de Aveiro e CIBIO Centro de Investigação em Biodiversidade e Recursos Genéticos
Transcript of Phylogeny and molecular biology in amphibian ecotoxicology · implicados na resposta de defesa a...
Phylogeny and
molecular biology
in amphibian
ecotoxicology
Nina Guerra Serén Mestrado em Biodiversidade, Genética e Evolução Departamento de Biologia
2013
Orientadora Ylenia Chiari, Post-Doctoral Researcher, CIBIO, Centro de Investigação
em Biodiversidade e Recursos Genéticos
Coorientadores Miguel Carretero, Associate Researcher, CIBIO, Centro de
Investigação em Biodiversidade e Recursos Genéticos
Enrique García-Muñoz, Post-Doctoral Researcher, CESAM
(Centro de Estudos do Ambiente e do Mar) of Universidade
de Aveiro e CIBIO Centro de Investigação em Biodiversidade
e Recursos Genéticos


Todas as correções determinadas
pelo júri, e só essas, foram efetuadas.
O Presidente do Júri,
Porto, ______/______/_________


FCUP Phylogeny and molecular biology in amphibian ecotoxicology
i
Acknowledgements
I want to thank to my supervisor Ylenia Chiari for support at every single moment I
needed, in teaching, guiding, by finding together the solution on several software dilemmas
that we faced together, by helping to deal with stressful situations that we could not control or
foreseen during the year, by cheering me up after some arising problems with the work, by
giving me valuable advices that I will never forget during life, and finally, I want to thank her
for seeing me as her student and friend, listening, accepting and sometimes hoping to hear
more my opinions or doubts.
I also want to thank Miguel Carretero for all the confidence and support he gave me
ever since I met him, for the discussion of the most interesting scientific topics related to our,
his or other people’s work, for all support he provided to my research, and for being such a
good friend. Additional thanks to Enrique García-Muñoz (Kike) for his crucial work providing
the sampling material needed for the experiments in very unusual and difficult climatic
scenarios in Spain (very dry winter), and for all the laboratory ecotoxicological tests in the
tadpoles, essential for our work, showing a great dedication and persistence towards the
project and my thesis subject.
Concerning the article submission to Journal of Molecular Evolution with Miguel and
Ylenia during the thesis progression, we want to give special thanks to Jean-Paul Doyon for
his useful help with the reconciliation analysis and comments on and early version of the
manuscript, and to Miguel Fonseca, João Lourenço, Benoit Nabholz, Diane Salvi and Ziheng
Yang for feedback on this work.
Thanks also to Liliana Farelo for her incredible availability to help us at last-hour
laboratory analyses in CIBIO, to Pedro Cardoso for his assistance in the preparation of early
lab work (primer design, verify endogenous control genes, etc.) and sampling work in Aveiro,
and to Bárbara Santos and Isabel Lopes for providing the assistance needed by the time of
the sampling of Aveiro mesocosms and also collection of some samples for analysis; to
Eduardo Lopes of Bio-RAD for helping setting up the RT-qPCR experiments and feedback on
the cDNA and gene characterization, to Scott Glaberman for all the help obtaining the LC50
data for the study on phylogenetic signal in amphibian sensitivity to copper sulfate, to
Isabella Capellini for helping with the analyses for this study, and to Inês Cunha for the
wonderful drawing of the front page. To FCT, thanks for partial financial support to the study.
Finally I want to express my deep thanks to my family and friends which gave me a
lot of support, and to my dearest friend of all and boyfriend Pedro Andrade, the one person
capable of brighten my thoughts, and life.

ii FCUP 2013
FCUP Phylogeny and molecular biology in amphibian ecotoxicology
iii
Abstract
Amphibian ecotoxicology is one of the crucial scientific fields necessary to understand
the underlying mechanisms behind the rapid decline of this animal group and to what extent
anthropogenic actions are responsible for it. Pollution and contaminants in natural
environments are seriously threatening biodiversity. The molecular response of organisms at
cellular level (e.g. gene expression) is the first sign of defense to react to harsh polluted
conditions. This may therefore serve to illustrate the type of genetic or chemical responses
that evolved to prevent species decline. In this context, to gather a better understanding on
how amphibians may respond to contaminants, we focused our study on the metallothionein
superfamily. In vertebrates, these metal binding proteins are involved in various metal-
detoxification mechanisms and can therefore be considered as candidate genes involved in
the organisms reaction of detoxification from heavy metal contamination in the environment.
As a first task of our study, we carried out a phylogenetic and functional diverge analysis to
study the evolution of this multigene family in vertebrates. The aim of our study was to
estimate gene gain and loss events as well as to uncover gene sites correlated with
functional divergence among taxa and paralog genes. This approach will also permit to
design cost-effective metallothionein protein functional studies in non-model vertebrates for
which little is known. We focused our work on the effects of pollution due to the heavy metal
copper (used as a component of commonly used pesticides in agriculture, such as copper
sulfate). The second goal of this thesis was to assess the phylogenetic signal (if any) in the
sensitivity of amphibians to copper sulfate (measured as LC50) and to temperature variation.
We wanted to estimate the influence of temperature on amphibian LC50 to copper sulfate to
gain further understanding on how future raising in environmental temperature could affect
this parameter, and therefore organism survival. Our results show a strong influence of
temperature on amphibian LC50 to copper sulfate. Once this influence is taken into account,
our data show a phylogenetic signal in LC50. This result, if confirmed on a larger taxon
sampling, can be used as a predictive tool in amphibian conservation and ecotoxicology. We
then concentrated on developing methods to study the molecular response to copper sulfate
on a target European amphibian species, the Natterjack toad Epidalea calamita (Laurenti,
1768). We choose this species since the symptoms, (developmental and behavioral effects)
due to exposure to copper sulfate are well known. For this study, we collected genetically
similar individuals belonging to a single clutch (obtained by one couple mating in a controlled
environment). Eggs from the clutch were raised separately in different aquaria (laboratory
conditions) and mesocosms (semi-natural environment) and treated either with no
iv FCUP 2013
contaminant or with a range of copper sulfate concentrations that are commonly found in the
environment with known effects (see above). The treatment includes also two different
temperature to test. The samples were collected at the tadpole stage and flash frozen in
liquid nitrogen to preserve optimal gene expression. RNA was extracted from these samples
and retro - transcripted to cDNA. The goal of this part of our work was to isolate the
metallothionein gene (one gene was expected based on previous and our works) in the study
species and to develop samples and tools to study metallothionein gene expression following
treatment with copper sulfate and different temperature in E. calamita. One of the cDNA
samples treated with copper sulfate was used to isolate the single metallothionein gene by a
pair of non-specific primers. Finally, as one of the outcomes of this work is to develop tools to
study metallothionein gene expression following treatment with copper sulfate, the last goal
of the project was to develop and test optimal endogenous controls (constitutive genes) to be
used for future gene expression experiments using qRT-PCR. The qRT-PCR permits a
quantification of the genetic expression changes. This technique requires a proper selection
of reference genes to be used as endogenous control, fulfilling the characteristic of showing
a constant expression for the tested situation and species. Therefore, from an initial list of 28
known reference genes, we selected six candidate genes for which we could design
degenerate primers to characterize them from cDNA and test their stability of expression in
E. calamita and in the experimental settings.
Keywords: Ecotoxicology, Amphibian, Molecular phylogenetics, Metallothionein,
Endogenous control
FCUP Phylogeny and molecular biology in amphibian ecotoxicology
v
Resumo
A ecotoxicologia de anfíbios é um dos ramos científicos fulcrais para compreender
quais os mecanismos subjacentes ao rápido declínio deste grupo taxonómico, e em que
medida a acção antropogénica é responsável por isso. A poluição e contaminantes em
meios naturais estão a ameaçar seriamente a biodiversidade. A resposta molecular a nível
celular (p.e. expressão génica) é o primeiro sinal de reação de defesa à poluição. Esta
reação pode portanto ilustrar o tipo de resposta genética ou química que pode ter evoluído
de forma a prevenir o desaparecimento da espécie. Neste contexto, para melhor
compreender de que forma os anfíbios podem reagir a poluentes, focamos este estudo na
superfamília das metalotioninas. Estas proteínas de ligação a metais estão envolvidas nos
mais diversos mecanismos de detoxificação em vertebrados, podendo então os genes estar
implicados na resposta de defesa a uma contaminação do meio ambiente por metais
pesados. Como primeiro passo neste estudo, efetuámos análises filogenéticas e de
divergência funcional para estudar a evolução desta família de genes, em vertebrados. O
objetivo deste projeto foi estimar o número de eventos de ganho ou perda de genes assim
como revelar posições do gene correlacionadas com a divergência funcional entre taxa e
genes parálogos. Esta abordagem vai de igual forma permitir projetar estudos sobre a
funcionalidade das metalotioninas em vertebrados não-modelo, ainda debilmente estudados.
Centramos este estudo nos efeitos da poluição devido ao cobre (metal pesado constituinte
de pesticidas comumente usados na agricultura, tais como o sulfato de cobre). O segundo
objetivo trata da avaliação do sinal filogenético (se existente) à sensibilidade dos anfíbios ao
sulfato de cobre (medida como LC50) e à variação de temperatura. Pretendemos estimar a
influência da temperatura na LC50 de anfíbios ao sulfato de cobre para obter maior
conhecimento sobre como o futuro aumento de temperatura no meio ambiente pode afetar
este parâmetro e, desta forma, comprometer a sobrevivência dos organismos. Os nossos
resultados mostram uma forte influência da temperatura na LC50 de anfíbios em relação ao
sulfato de cobre. Assim que esta influência é considerada, os resultados evidenciam um
sinal filogenético para a LC50. Este resultado, se confirmado numa maior amostragem de
taxa, pode ser utilizado como uma ferramenta de previsão em conservação e ecotoxicologia
de anfíbios. Focamos também o desenvolvimento de métodos para poder estudar a
resposta molecular da espécie-alvo europeia, o Sapo-corredor (Epidalea calamita), ao
sulfato de cobre. Escolhemos esta espécie dado que os sintomas devido à contaminação de
sulfato de cobre (efeitos no desenvolvimento e comportamento) são já bem conhecidos.
Para este estudo adquirimos indivíduos geneticamente semelhantes pertencentes a uma
vi FCUP 2013
única massa de ovos, obtida após acasalamento do casal em ambiente controlado. Os ovos
desenvolveram-se separadamente em aquários distintos (condições laboratoriais) e
mesocosmos (condições semi-naturais) e foram tratados na ausência de contaminante ou
com um gradiente de concentrações de sulfato de cobre frequentemente encontradas no
meio ambiente e com efeitos já conhecidos. O tratamento incluiu também duas temperaturas
diferentes a testar. As amostras foram obtidas em estado de desenvolvimento de girino e
vitrificadas em azoto líquido para preservar a expressão génica. O RNA foi extraído destas
amostras e retro-transcrito para cDNA. O objetivo deste passo foi isolar o gene da
metalotionina (apenas um gene era esperado, baseado no nosso estudo e anteriores) na
espécie-alvo e desenvolver amostras e ferramentas para estudar a expressão génica deste
gene seguida do tratamento com sulfato de cobre a diferentes temperaturas. Uma das
amostras de cDNA proveniente de tratamento com o contaminante foi utilizada para isolar a
única metalotionina por intermédio de primers não-específicos. Finalmente, como um dos
objetivos desta investigação é desenvolver ferramentas para estudar a expressão génica
seguida do tratamento com sulfato de cobre, o último ponto a atingir neste projeto é
desenvolver e testar genes de referência para controlos endógenos optimizados para uso
futuro em experiências de expressão génica usando qRT-PCR. O qRT-PCR permite a
quantificação das variações de expressão génica. Esta técnica requer a selecção cuidada
de genes de referência a usar no contolo endógeno, refletindo uma expressão constante
para a situação e espécie testadas. Portanto, de uma lista inicial de 28 genes de referência
conhecidos, seleccionamos seis genes candidatos para os quais pudemos desenhar primers
degenerados para caracterizá-los a partir do cDNA e testar a sua estabilidade em E.
calamita e nas configurações experimentais.
Palavras-chave: Ecotoxicologia, Anfíbios, Filogenética Molecular, Metalotionina, Controlo
endógeno
FCUP Phylogeny and molecular biology in amphibian ecotoxicology
vii
Index
Abstract ..................................................................................................................... iii
List of figures ............................................................................................................ ix
List of tables ........................................................................................................... xiii
Abbreviations ........................................................................................................... xv
Introduction ............................................................................................................... 1
Ecotoxicology .......................................................................................................... 1
Classical amphibian ecotoxicology ......................................................................... 1
Molecular Biology in Ecotoxicology ......................................................................... 4
Amphibians, Genetics and Ecotoxicogenomics ...................................................... 5
Ecotoxicological tests: Natural, semi-natural and artificial conditions ..................... 5
Experimental Design - Study species, contaminant and temperature effect, and gene of study .......................................................................................................... 6
1. Molecular evolution and functional divergence of the metallothionein gene family in vertebrates ................................................................................................ 11
Abstract .................................................................................................................. 11
Introduction ........................................................................................................... 13
Materials and Methods .......................................................................................... 16
Dataset assembly and characteristics ........................................................................ 16
Phylogenetic analyses .................................................................................................. 17
Reconciliation analysis ................................................................................................. 19
Analysis of variation in selective pressure among lineages ................................... 20
Functional analyses ....................................................................................................... 21
Putative pseudogene inference ................................................................................... 23
Results and Discussion ......................................................................................... 24
Dataset assembly and characteristics ........................................................................ 24
Phylogenetic analyses .................................................................................................. 27
Reconciliation analysis ................................................................................................. 30
Analysis of variation in selective pressure among lineages ................................... 31
Functional analyses ....................................................................................................... 35
Putative pseudogene inference ................................................................................... 40
Conclusions .......................................................................................................... 41
2. Phylogenetic signal in amphibian sensitivity (LC50) to copper sulfate ......... 45
Abstract ................................................................................................................. 45
Introduction ........................................................................................................... 47
viii FCUP 2013
Materials and Methods .......................................................................................... 48
Results and Discussion ......................................................................................... 50
3. Isolation of the metallothionein gene in E. calamita........................................ 53
Abstract ................................................................................................................. 53
Introduction ........................................................................................................... 55
Materials and Methods .......................................................................................... 55
Lab settings .................................................................................................................... 55
RNA extraction ............................................................................................................... 56
Reverse transcription of RNA ...................................................................................... 57
Primer design and gene isolation ................................................................................ 57
Results and Discussion ......................................................................................... 59
4. Development and test of endogenous control genes for qRT-PCR experiments in E. calamita following treatment with copper sulfate and temperature variation ............................................................................................. 62
Abstract ................................................................................................................. 63
Introduction ........................................................................................................... 65
Materials and Methods .......................................................................................... 66
Primer design ................................................................................................................. 66
Isolation of reference genes ......................................................................................... 68
Results and Discussion ......................................................................................... 69
Future work developed from this study ................................................................ 73
General conclusions .............................................................................................. 77
Supplementary Materials ....................................................................................... 93

FCUP Phylogeny and molecular biology in amphibian ecotoxicology
ix
List of figures
Figure 1 – Amphibian families and respective species with rapid declining status classified
as being caused by overexploitation, habitat loss or enigmatic decline. Percentages of
species under decline are referenced in each family, depending both on the high number of
species under rapid decline (see also right section of the figure) but also on the on the
number of species that constitute each family. Adapted from Stuart et al. (2004).
Figure 2 – Recognized major threats associated with the worldwide amphibian decline.
Habitat loss is considered the uppermost concern to amphibian conservation, followed by
pollution. Almost every threat in this plot is based on anthropogenic disturbances. Adapted
from IUCN.
Figure 3 – Laboratory and mesocosm settings used in our study. Photos: Enrique García-
Muñoz.
Figure 4 - Natural pond containing amphibian species (including E. calamita) showing high
levels of copper sulfate contamination. Fungicide containing this toxic compound is used
across vast areas of olive grove monocultures, affecting dramatically aquatic ecosystems
and biodiversity in every stream or nearby ponds. Photo: Enrique García-Muñoz.
Figure 5 - Natural pond where eggs from E. calamita were collected for the study. Photo:
Enrique García-Muñoz.
Figure 6 - Adult specimen of E. calamita represented in right photo. Photo: Matthieu
Berroneau.
Figure 7 - Three-dimensional models of MT proteins from three distant species (A – rat; B –
sea urchin; C – blue crab). Adapted from Blindauer and Leszczyszyn (2010).
Figure 8 - Unrooted Bayesian consensus tree (50% majority-rule) based on one single
model of evolution. Bootstrap for ML (in %) and Posterior Probability values are given for
specific clades in the following order: ML nucleotide/ML amino acid/Bayesian nucleotide no
partition/Bayesian nucleotide partition/Bayesian amino acid. Values replaced by “-” when
below 60% bootstrap or 0.70 pp. When a clade is not recovered by the analysis it is indicated
with “#”. Clade A (eutherian MT1/2) 78/-/0.79/1/#; Clade B (eutherian MT3) 99/94/1/1/1;
Clade D (bird+reptile+amphibian MT) -/#/-/0.75/#; Clade F (fish MT) 93/99/1/1/1; Clade G
(mammalian MT4) 99/100/1/1/1; Clade H (eutherian MT1/2/3) #/#/0.85/0.96/#.

x FCUP 2013
Figure 9 - Rooted gene tree resulting from the optimal reconciliation. Gene duplications are
indicated with (D), while gene loss is indicated by a dashed line.
Figure 10 - Hydrophobicity plots using consensus amino acid sequences obtained for the
following clades: a) Eutherian MT1/2; b) Eutherian MT3; c) Mammalian MT4; d) Potential
amniote MT4; e) Amphibian, bird, and reptile MT; and f) Fish MT. Y-axes indicates
hydrophobicity values, whereas x-axes indicates amino acid positions.
Figure 11 - Metallothionein three-dimensional structure as obtained from DIVERGE using
the RatMT2 three-dimensional protein as a model. Colored circles on the protein structure
indicate Type I divergent amino acids (cut-off value = 0.9) between MT1/2 versus MT3
clades (A) and MT1/2/3 versus MT4 clades (B). Colored rectangles under the figure
correspond to the distinct colored amino acids and indicate the type of amino acid change at
that position for the compared clades. Amino acid code: “A” – alanine, “R” – arginine, “N” –
asparagine, “C” – cysteine, “E” – glutamic acid, “I” – isoleucine, “K” – lysine, “P” – proline, “S”
– serine, “T” - threonine, “V”- valine.
Figure 12 - LC50 correlated with temperature.
Figure 13 - ML ʎ of the regression of LC50 on temperature.
Figure 14 - Evaluation of the model settings: top left, density plot, top right Q-Q plots, bottom
left analysis of residuals corrected for phylogeny, and bottom right, fitted values.
Figure 15 - Alignment performed on the CDS of amphibian and bird species used to design
primers to isolate the MT gene in E. calamita. The location of the designed primers is
highlighted in grey.
Figure 16 Agilent profile obtained from two samples tests, one with degraded RNA (in the
left, Endgen12) and the other containing good RNA quality. A good RNA quality is indicated
by two clear 18S and 28S peaks. Indication of no degradation of large mRNA is represented
with a 28S peak higher than 18S.
Figure 17 - Electrophoresis gel run with 1 µl of cDNA from sample 23G30H for MT
amplification. (Ta of 53.2 and 56.8ºC). A clear MT band is shown for one of the temperatures
tested (56.8ºC).
Figure 18 - Electrophoresis gel run with PCR template obtained from 1:10 cDNA dilution
(Figure 19) and wiith PCR template obtained with no dilution (Figure 18) with clear MT band
in all dilutions of PCR templates (1:10; 1:50; 1:100 and 1:1000). Ta used are 53.2 and 56.8

FCUP Phylogeny and molecular biology in amphibian ecotoxicology
xi
ºC. A clear MT band is shown for all loaded wells with amplified cDNA. Arrow indicates the
band for which corresponding sample was selected for sequencing.
Figure 19 - Electrophoresis gel run with 1:10 dilution of cDNA from sample 23G30H for MT
amplification, highlighted (Ta of 53.2 and 56.8 ºC). No MT bands appeared in the gel.
Figure 20 - Electrophoresis gel run with 1:10 dilution of cDNA from sample 23G30H for all
endogenous genes (two Ta tested). Clear bands only visible for 18S and β-Actin (Ta of 52ºC
for 18S and 55.6 and 60ºC for β-Actin). Arrows indicate the band for which corresponding
sample was selected for sequencing.
Figure 21 – Electrophoresis gel run with no dilution of 1.5 µl of cDNA from sample 12G30H
for ANXA2, and 23G30H for rpL8 and eef1a1 (three Ta tested). Clear bands only visible for
ANXA2 in the three temperatures (51, 53.2, 55.6 ºC). Two fading bands appear in the lower
tested Ta of eef1a1 (see thin arrows). The only sample to sequence (ANXA2 gene) is
indicated by the red arrow.
Figure 22 – Electrophoresis gel run of PCR from PCR result on GAPDH (no dilutions) with 1
µl cDNA from sample 23G30H (Ta from the initial PCR is 55.1ºC, no bands appeared). A
band of small bp appeared for all tested temperatures in the new PCR (55.1 and 58,2ºC).
Arrow indicates the band for which corresponding sample was selected for sequencing.
Figure 23 – (see thin arrows). The only sample to sequence (ANXA2 gene) is indicated by
the red arrow.
Figure 24 – Electrophoresis gel run with no dilution of 2 µl of cDNA from sample 12G30H
with PCR, for MT and GAPDH amplification. MT bands are absent, and GAPDH presents
one band above 500 base pair.

xii FCUP 2013
FCUP Phylogeny and molecular biology in amphibian ecotoxicology
xiii
List of tables
Table 1 - Test of selective pressure. 1a) Models chosen to test variability of selective
pressure (H0 – H4) for the following tree topologies: unrooted Bayesian consensus
tree/unrooted gene tree obtained after reconciliation/unrooted Bayesian consensus tree with
inclusion of a tetrapod MT3 clade (see Materials and Methods for additional information). “ω”
indicates dN/dS. “A0, B0, C0 and E0” indicate branches corresponding to a duplication
event, while “A1, B1, C1 and E1” indicate main MT branches (Supplementary Material 3).
“H0” represents the null hypothesis with equal ω across the tree; “H1” indicates that ω is
different between the branches A0, B0 and different from all the remaining branches
(indicated as “others”), which have instead equal ω ; “H2” indicates that ω is different
between D0, E0 and different from all the remaining branches (indicated as “others”), which
have instead equal ω ; “H3” indicates that ω is different between A (A0+A1) and B (B0+B1)
branches and different from all the remaining branches (indicated as “others”), which have
instead equal ω ; “H4” indicates that ω is different between C (C0+C1) and E (E0+E1)
branches and different from all the remaining branches (indicated as “others”), which have
instead equal ω. 1b) Results on variable selective pressures among main MT clades
according to the different hypotheses listed above. Values are given as results using
Bayesian tree topology/results using gene tree topology after reconciliation. “|l|” indicates the
Likelihood absolute value; “np” indicates the number of parameters; “LRT” indicates the
Likelihood Ratio Test value standing for significant when LRT < 0.05 (significant values
indicated in bold).
Table 2 - Hydropathic value results. 2a) GRAVY index calculated for main MT clades (see
Materials and Methods for additional information). “Max”, “Min”, “Average”, “SD” indicate
respectively the maximum, minimum, average, standard deviation GRAVY indices obtained
for sequences within a given clade; “GRAVY +/- 2SD” represents the higher and lower
boundaries respectively, limiting the 95% area of the normal distribution of the GRAVY index
for all sequences within the main MT clades. b) GRAVY index for potential pseudogenes,
sequences used for comparison (see Materials and Methods), and clade to which they
belong to. For M. domestica and O. anatinus sequences, the GRAVY index was not
calculated because these sequences do not belong to any clade for which other sequences
could be used for comparison. 2b) GRAVY index for potential pseudogenes, sequences used
for comparison (see Materials and Methods), and clade to which they belong to. For M.
domestica and O. anatinus sequences, the GRAVY index was not calculated because these
xiv FCUP 2013
sequences do not belong to any clade for which other sequences could be used for
comparison
Table 3 - Type I and II divergence test results. “θ I” indicates the coeffient of functional
divergence; “SE” indicates the standard error; “LRT” corresponds to the 2 log-likelihood-ratio
against the null hypothesis of θ I = 0; “p” indicates the p value; “Pp cut-off” represents the
posterior probability cut-off for specific amino acid sites. Significant p-values (p < 0.05) are
indicated in bold.
Table 4 - List of eleven species for which the effect of temperature and phylogenetic signal
on LC50 was calculated.
Table 5 - Total sample list after RNA extraction procedure. Light grey rows represent samples
showing RNA degradation, small RNA concentration recovery or sample lost. First column on
the left indicates the sample code we attributed to each sample. “Treatment” indicates the
copper sulfate concentration, time and temperature variables in the experiments. “Regime”
indicates the experimental conditions from which the samples were obtained (laboratory or
mesocosm). Concentration and quality of RNA were determined by Agilent 2100 Bioanalyzer.
Table 6 - Table 6 - Endogenous control selected primers sequences and characteristics. GC
content represents the percentage of guanines and cytosines in the sequence (40-60% GC
content ensures stable binding of primer/template). “Bp” stands for base pair and “Tm”
represents the melting temperature of the primers.
Table 7 - Samples selected for endogenous control tests
Table 8 - Sample selection for MT gene expression future studies
Table 9 - Samples currently being extracted for mesocosm and laboratory settings.

FCUP Phylogeny and molecular biology in amphibian ecotoxicology
xv
Abbreviations
AICc – Akaike’s information criterion corrected for finite sample size
CDS - Coding sequence
CCDS - Consensus coding sequence
dN - Non-synonymous substitution rate
dS - Synonymous substitution rate
ERA – Ecological risk assessment
fd - degrees of freedom
GRAVY - Grand average of hydropathicity
ISS - index of substitution saturation
ISS.c - index of substitution saturation critical value
K - Bayes factor value
LC50 – Lethal Concentration 50
LR - Likelihood Ratio
LRT - Likelihood Ratio Test
ML - Maximum Likelihood
MT - Metallothionein
nst - number of substitutions
pinvar - proportion of invariable sites
PGLS – Phylogenetic least-squares models
pp - posterior probability
qRT-PCR – quantitative Real-Time PCR
t - time
T - temperature
Ta - annealing temperature
ω - ratio between dS and dN

xvi FCUP 2013

FCUP Phylogeny and molecular biology in amphibian ecotoxicology
1
Introduction
Ecotoxicology
Ecotoxicology is a scientific field studying the effects that toxic compounds have
on organisms, their community or the ecosystem in which they live in. Ecotoxicological
approaches are increasingly relying on the integration of distinct scientific fields in an
attempt to improve the understanding of the mechanisms underlying the impacts of
contaminants across all levels of biological organization. The multidisciplinary essence
of Ecotoxicology, combining Toxicology and Ecology, is essential to characterize,
comprehend, and predict the effects of contaminants on biological systems (Moriarty
1983). This methodology line is believed to be relatively accurate tracing environmental
demands, which is highly important in an accelerating “humanized world”. In fact, the
scientific community accepts that anthropogenic effects are increasingly endangering
biodiversity (reviewed in Barnosky et al. 2011). Among the human-driven impacts on
environment, pollution and climate change are of great concern (Vitousek 1994; Botkin
et al. 2007).
Classical amphibian ecotoxicology
Amphibians are highly susceptible to the impact of human activities that cause
environmental changes (Beebee and Griffiths 2005; Hopkins 2007; Blaustein et al.
2010, 2011) in ecosystems. In fact, amphibians have been facing a global declining in
the last decades at unprecedented rates (Stuart et al. 2004; Wake and Vredenburg
2008, see also Figure 1).

2 FCUP
2013
Figure 1 - Amphibian families and respective species with rapid declining status classified as being caused by
overexploitation, habitat loss or enigmatic decline. Percentages of species under decline are referenced in each family,
depending both on the high number of species under rapid decline (see right section of the figure) but also on the on the
number of species that constitute each family. Adapted from Stuart et al. (2004).
Numerous possible causes for this rapid decline have been highly debated in
the scientific community (reviewed in Hopkins 2007). There is now a widely accepted
agreement that the forthcoming extinction of many amphibian species was and is being
caused mostly by extremely complex interactions driven by anthropogenic effects
(Collins and Storfer 2003; Pounds et al. 2006; Hopkins 2007; Blaustein et al. 2011) –
see also related Figure 2.
Percentage of all declining species in family

FCUP Phylogeny and molecular biology in amphibian ecotoxicology
3
Figure 2 - Recognized major threats associated with the worldwide amphibian decline. Habitat loss is considered the
uppermost concern to amphibian conservation, followed by pollution. Almost every threat in this plot is based on
anthropogenic disturbances. Adapted from IUCN (2009).
Among the factors more strongly correlated with this decline are habitat
destruction and alteration, human exploitation, introduction of invasive species, climate
change and disease outbreak (Blaustein and Kiesecker 2002; Beebee and Griffiths
2005; Blaustein et al. 2011). Amphibians are known to play an important role in
ecosystems for their different life stages (tadpoles and adults) that range from
herbivorous to carnivorous regimes in trophic webs (Hopkins 2007), and for their high
contribution to the transfer of energy and nutrients through food webs (Wyman 1998;
Colón-Gaud et al. 2009). Due to their trophic role, high sensitivity to environmental
changes (as direct consequence of a great variety of factors including the permeable
skin to pollutants or for many species the use of aquatic and terrestrial habitats during
their life stages) and their alarming decline, amphibian ecotoxicology has become an
essential field of study to investigate and characterize the level of ecological
disturbances in ecosystems (Hopkins 2007).
Habitat loss
Invasive species
Utilisation
Accidental mortality
Persecution
Pollution
Natural disasters
Disease
Human disturbance
Changes in native sp. dynamics
Fires
Unknown
None
Non-threatened Threatened
0 1000 2000 3000 4000
Number of species

4 FCUP
2013
Amphibian larvae often occupy stream ecosystems, facing major pollution risks
since agricultural and industrial contaminants from various sources are accumulated in
most freshwater habitats. Numerous studies have already quantified and demonstrated
a great number of morphological and behavioral changes on larvae under contaminant
exposure (e.g. Bridges 1997; García-Muñoz et al. 2011a, b, Yu et al. 2013). However,
the described negative effects have not been fully evaluated or used for quantitative
assessments of risk, remaining unable to clarify their role in amphibian decline (see
Hayes et al .2006 and references therein). In vertebrates, most ecotoxicological tests
are usually related to the status of the populations: survival, growth and measures of
reproductive success (e.g. Miracle and Ankley 2005). Such standard ecotoxicological
studies have proved to be of valuable help in current risk assessments in several life
forms (Fedorenkova et al. 2010). However, the use of molecular techniques could
provide important information on contamination sub-lethal effects with no visible
phenotypic manifestation and improve the risk assessment process and (be used as an
early warning sign of occurring contamination) (reviewed in Robbens et al. 2007).
Efficient risk assessment studies on amphibians already used molecular approaches
(Veldhoen and Helbing 2001). Molecular biology methods can therefore provide a
helpful tool in identifying unknown cellular/genetic effects due to contaminants in the
environment that could eventually help to clarify the role of pollution on amphibian
global decline.
Molecular Biology in Ecotoxicology
Knowledge on the inter and intra-specific genetic variation together with
phylogenetic relationships among taxa can largely contribute to further analyze toxic
implications in biological systems (Coutellec and Barata 2011). In some cases,
phylogenetic knowledge on the studied group may allow the detection of strong
phylogenetic signals for pollution responses, possibly giving further indication whether
species can be more or less tolerant (Carew et al. 2011). Key-gene families
phylogenies can equally be of great importance to clarify at what extent gene
duplication and function differentiation may be associated with distinct functions and
efficiencies for a function (e.g. Tío et al. 2004; Chang and Duda 2012). For example
when looking at a gene with known function in organism detoxification from chemical
substance, a phylogenetic approach could provide insights into the effects of the
FCUP Phylogeny and molecular biology in amphibian ecotoxicology
5
contaminant on different taxa.
Another very important and promising scientific area within Ecotoxicology is
Genomics. Genomics is a field which encompasses a great number of techniques from
genome sequencing, annotation of function to genes, patterns of gene expression
(transcriptomics), protein expression (proteomics) and metabolite flux (metabolomics)
(as in Kille et al. 2003). Gene expression profiling is one of the most relevant genomic
approaches to environmental analysis and stress tests. This technology, among other
genomic based techniques, has the potential to increase risk assessment power
analyses and to facilitate a rapid evaluation of: 1) the toxic compound potential effects
and 2) the response of the biological systems to environmental change (Kille et al.
2003). In ecotoxigenomics, gene expression analyses is generally carried out by
exposing organisms under certain conditions (e.g. concentration of a known pesticide)
and profiling their transcriptome by microarrays or quantitative RNA sequencing (van
Straalen and Federer 2011).
Amphibians, Genetics and Ecotoxicogenomics
Amphibians have been largely covered in toxicological experiments that
focused at genetic or biochemical responses to contaminants (e.g. LeBlanc and Bain
1997; Veldhoen and Helbing 2001; Zocche et al. 2013). The most common species for
ecotoxicological studies is Xenopus laevis (US EPA, 2012 and reviewed in Helbing
2012). Currently, this is also the only amphibian species with a fully sequenced genome
available in public databases. This facilitates the use of this species, instead of others,
in toxigenomics, even if its representativeness as a model amphibian or even as a
natural frog species (most studies rely on animals bred in captivity since many
generations) is far from ideal (Helbing 2012).
Ecotoxicological tests: Natural, semi-natural and artificial conditions
To provide meaningful results, ecotoxicological tests should be performed on: 1)
individuals collected under carefully designed and controlled experimental conditions,
and 2) individuals collected in semi-natural conditions (e.g. microcosms, mesocosms).
6 FCUP
2013
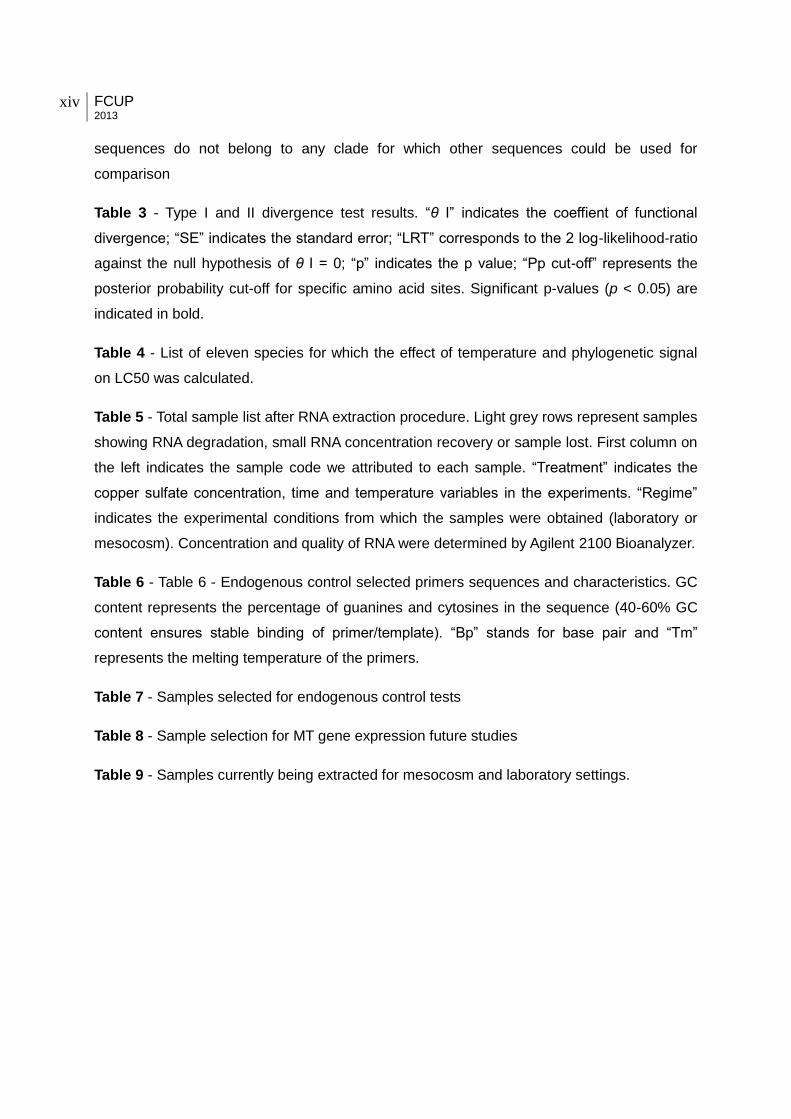
Mesocosms, or replicated outdoor artificial systems containing simplified self-sustaining
communities, provide a compromise between reductionist laboratory experiments and
uncontrolled, difficult-to-interpret field observations, permitting also rigorous
experimental design and statistical analyses due to the replication not achieved in
natural conditions (Odum 1984). Mesocosm experiments, in an early phase, can also
serve as a pilot study to look for differences between laboratory and semi-natural
conditions, offering a new perspective on how mesocosm setting changes th treatment
results
Figure 3 – Laboratory and mesocosm settings used in our study. Photos: Enrique García-Muñoz
Experimental Design - Study species, contaminant and temperature
effect, and gene of study
Our study species is an anuran, the Natterjack toad (Epidalea calamita). This
species is generally found in a wide range of territories in Europe and makes use of
shallow temporary ponds and lagoons in early stages of life (short larval development
period) and for spawning (IUCN, Beja et al. 2009). It is known to survive in medium-
high contaminated ecosystems across the Iberian Peninsula (García-Muñoz et al.
2009) and it has been demonstrated that it is affected by copper sulfate exposure
(García-Muñoz et al. 2009; 2010; 2011b) on laboratory conditions. Copper sulfate
(CuSO4·5H20) is a highly toxic component often used as fungicide and algaecide in
agricultural practices, and it is encountered also in textile, leather and oil industries
discharges (U.S. Environmental Protection Agency 1986).
FCUP Phylogeny and molecular biology in amphibian ecotoxicology
7
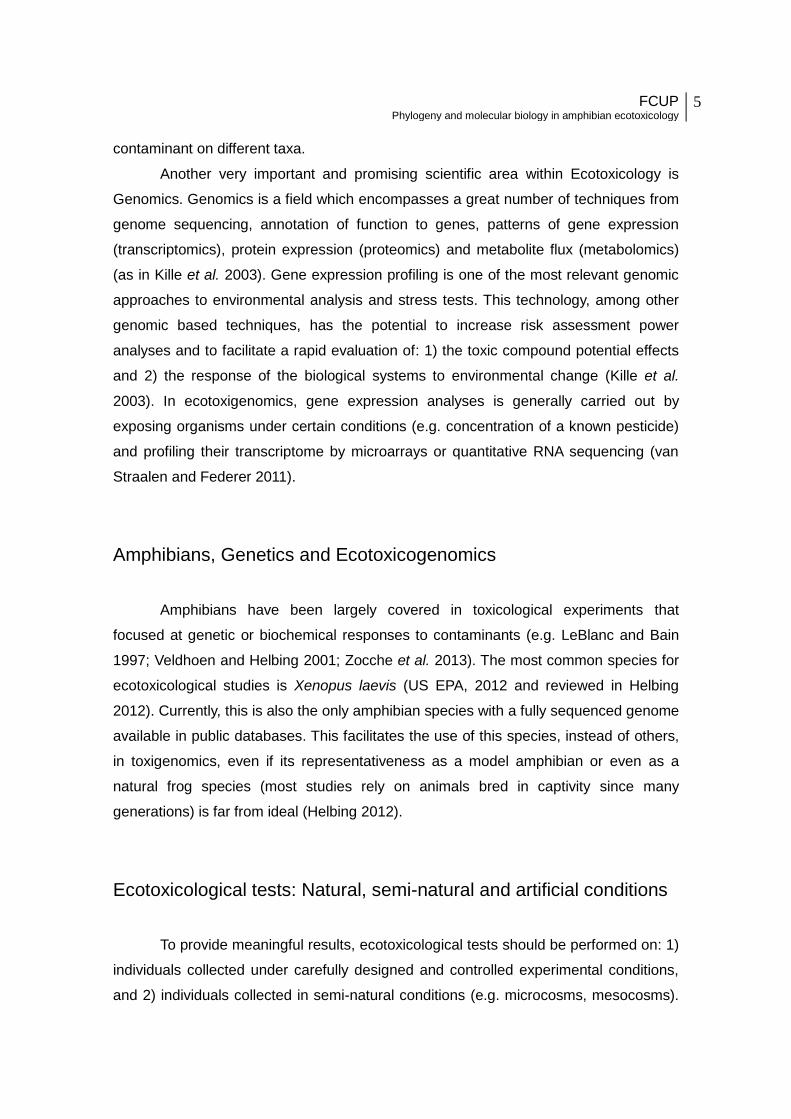
Figure 4 - Natural pond containing amphibian species (including E. calamita) showing high levels of copper sulfate
contamination. Fungicide containing this toxic compound is used across vast areas of olive grove monocultures,
affecting dramatically aquatic ecosystems and biodiversity in every stream or nearby ponds. Photo: Enrique García-
Muñoz.
Due to these unwary origins of compounds containing this highly toxic
component, high levels of copper contamination have already reached natural aquatic
habitats, affecting a great number of species (Herkovits and Helguero 1998; U.S
Environmental Protection Agency 2008).
Several studies on amphibians demonstrated the negative effects of copper by
testing the toxic effects of copper sulfate or copper exposure in lab conditions to
anurans (Porter and Hakanson 1976, Khangarot and Ray 1987, Herkovits and
Helguero 1998; García-Muñoz et al. 2009, 2010, 2011b; Gürkan and Hayretdağ 2012;
Santos et al. 2013). Contaminant effects reported for E. calamita include
morphological, histological and behavioral traits (García-Muñoz et al. 2009, 2010,
2011b). However, to date, nothing is known concerning molecular and/or genetic
mechanisms triggered in E. calamita by the pollutant.
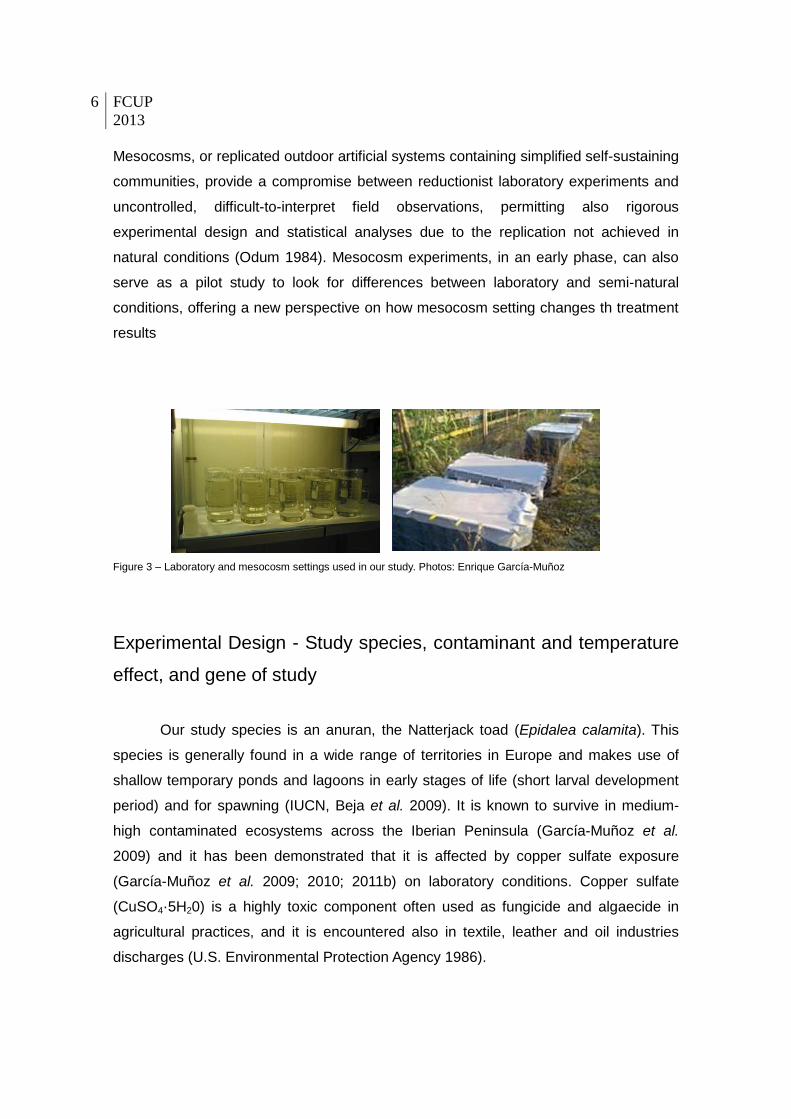
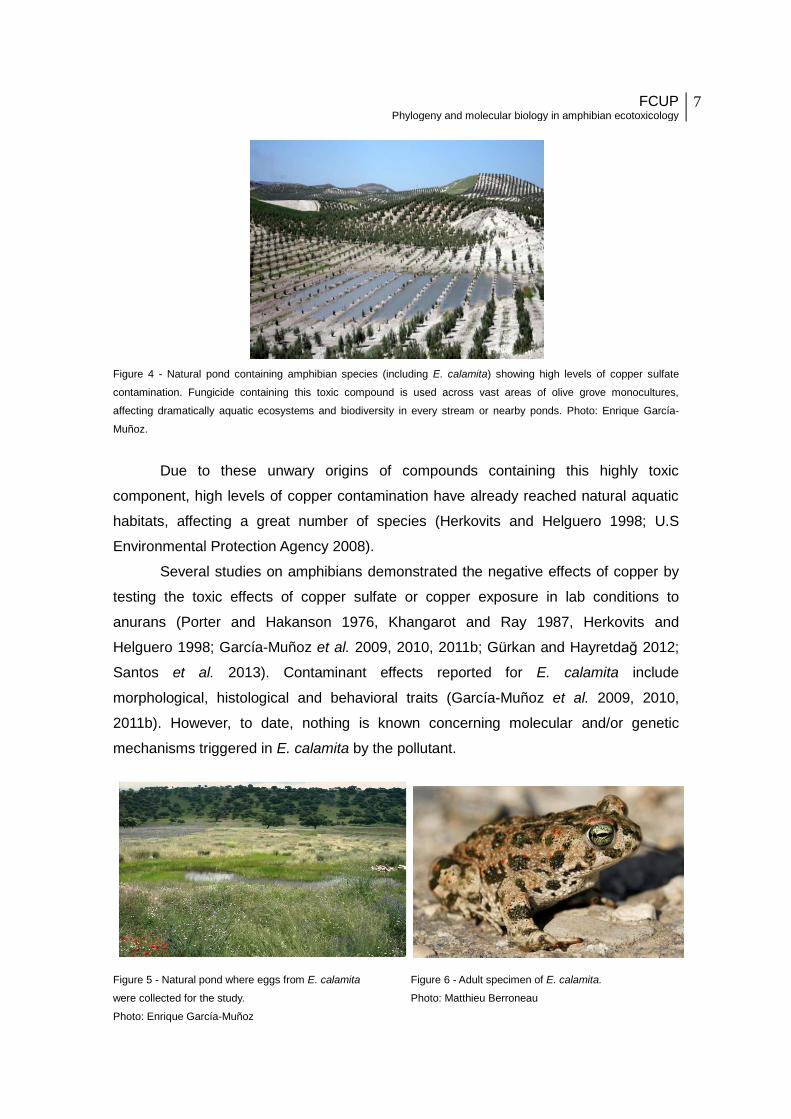
Figure 5 - Natural pond where eggs from E. calamita Figure 6 - Adult specimen of E. calamita.
were collected for the study. Photo: Matthieu Berroneau
Photo: Enrique García-Muñoz
8 FCUP
2013
Previous studies on several organisms have shown that one immediate effect of
copper was to enhance metallothionein (MT) protein production and metallothionein
gene expression (Lam et al. 1998; Riggio et al. 2003; Mosleh et al. 2006; Serafim and
Bebianno 2009). This is most likely correlated to the detoxification function of these
proteins in presence of heavy metals. A demonstration of MT effect on amphibians is
still to be studied. Until date, only MT protein production in amphibians has been
demonstrated and not by copper effect cadmium exposure (Suzuki et al. 1986; Pérez-
Coll et al. 1997). Despite the evident pertinence that the knowledge of amphibian MT
gene expression (under different experimental conditions) could bring to understand
amphibian sensibility to pollution or environmental change, MT gene expression was
never studied in any amphibian species.
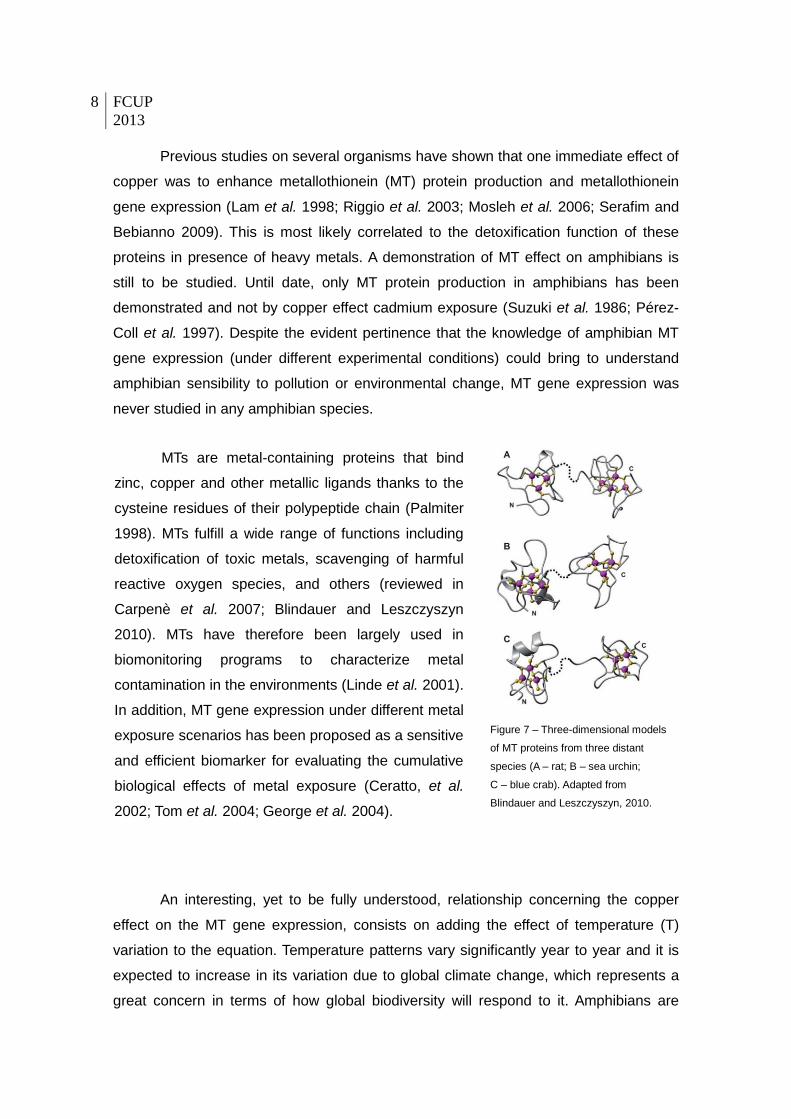
Figure 7 – Three-dimensional models
of MT proteins from three distant
species (A – rat; B – sea urchin;
C – blue crab). Adapted from
Blindauer and Leszczyszyn, 2010.
An interesting, yet to be fully understood, relationship concerning the copper
effect on the MT gene expression, consists on adding the effect of temperature (T)
variation to the equation. Temperature patterns vary significantly year to year and it is
expected to increase in its variation due to global climate change, which represents a
great concern in terms of how global biodiversity will respond to it. Amphibians are
MTs are metal-containing proteins that bind
zinc, copper and other metallic ligands thanks to the
cysteine residues of their polypeptide chain (Palmiter
1998). MTs fulfill a wide range of functions including
detoxification of toxic metals, scavenging of harmful
reactive oxygen species, and others (reviewed in
Carpenè et al. 2007; Blindauer and Leszczyszyn
2010). MTs have therefore been largely used in
biomonitoring programs to characterize metal
contamination in the environments (Linde et al. 2001).
In addition, MT gene expression under different metal
exposure scenarios has been proposed as a sensitive
and efficient biomarker for evaluating the cumulative
biological effects of metal exposure (Ceratto, et al.
2002; Tom et al. 2004; George et al. 2004).

FCUP Phylogeny and molecular biology in amphibian ecotoxicology
9
among the species for which changing temperatures are considered to represent a
strong threat to animal survival (Blaustein and Kiesecker 2002, Blaustein et al. 2010;
Wake and Vredenbourg 2008). Previous studies have already demonstrated a
synergetic effect of temperature with the contaminant, negatively influencing the impact
of the contaminant in many aquatic organisms, like fish (Macek et al. 1969; Mayer and
Ellersieck 1986; Capkin et al. 2006; Osterauer and Köhler 2008) and amphibians
(reviewed in Blaustein et al. 2010; e.g. Boone and Bridges 1999). When the opposite
effect is observed (temperature reduces toxic effect, see Rohr et al. 2011) some
authors have proposed to be due to the increased metabolic rates associated with the
rising temperature that can lead to a more quick response against the contaminant as
in some insecticides (Mayer and Ellersieck 1986). Another possibility is that increasing
temperature determines an accelerating embryonic and larval development, which
might decrease the amount of exposure of the organisms at these sensitive stages
(Rohr et al. 2011). Additional studies on more species and populations under the same
contaminant are needed to improve predictions and underlying causes of the
synergetic mechanisms on temperature versus copper effect mutual interference.
Ideally this should be done to understand patterns of response to temperature and
pollutants among species and populations.
Objectives
A gene family (metallothionein), known to be involved in metal detoxification, will
be studied to provide us an approximation of the number of gene copies present in our
study-species. It will also to give us an indication of how tolerance or sensitivity may
have evolved through many vertebrates groups including amphibians.
To isolate for the first time the MT gene in the species studied for my thesis and
to study the evolution of this gene family in vertebrates to further investigate its
correlation to distinct functions (including metal detoxification), we carried out a
phylogenetic analysis (Chapter 1 and paper submitted to Journal of Molecular
Evolution). The main relevant topics investigated in Chapter 1 regarding the phylogeny
of this gene family explore the MT CDS sequence conservation among: selected
species, introns or sequence characteristics, number of MT copies in each group
(mammals, birds, fish, etc.), estimation of gene gain and loss events, and detection of
gene sites correlated with functional divergence between MT groups. Some of these
gene parameters could be useful to better understand the effects of pollution due to
heavy metal (copper, as copper sulfate) in future studies. To complement this, in
10 FCUP
2013
Chapter 2 we assessed the differential copper sulfate LC50 under distinct temperature
regimes in amphibians to find a phylogenetic signal.
On the other hand, we carried out another analysis which can broaden the
study to a prediction of the copper sulfate versus temperature effect on other species.
The study of the patterns of sensitivity on amphibian already available data (in our
case, anurans) on copper sulfate exposure at different temperatures, can be extremely
useful to predict how other species may respond to the same contaminant through a
phylogenetic signal approach. Ultimately, this study permitted to test the influence of
temperature on amphibian sensitivity to copper sulfate (LC50) and if could affect
amphibian populations survival. This is of paramount importance, especially taking in
consideration that most amphibian species are declining and using these species in
experiments could result in serious conservation threats.
A case-study evoking these questions is addressed in Chapter 3. In this
chapter, I described the work carried out to obtain the MT gene from the study species
E. calamita by using degenerated primers and PCR amplification on a cDNA sample.
The isolated gene can therefore be used for future studies in ecotoxicogenomics on E.
calamita into studying gene expression following treatment with copper sulfate and
different temperature in E. calamita. For this reason, in Chapter 4, I developed a study
on optimization of endogenous control genes (reference genes) with the required
characteristics for control in future qRT-PCR gene expression experiments. In this
chapter it is described the gene selection, primer design and methods applied in
laboratory to isolate the reference genes from cDNA samples
The aims of my work are therefore:
1) Study the evolution of MT family gene in vertebrates, using species with full
genomic data available.
2) Carry out laboratory and mesocosm experiments with copper and temperature
testing conditions in E. calamita.
3) Infer if there is a phylogenetic signal for copper/temperature effects in anurans.
4) Isolate the MT gene(s) in E. calamita.
5) Select appropriate reference genes for endogenous control to test their gene
expression stability in our experimental conditions using qRT-PCR.

FCUP Phylogeny and molecular biology in amphibian ecotoxicology
11
1. Molecular evolution and functional
divergence of the metallothionein gene family in
vertebrates
Abstract
The metallothionein superfamily consists of metal binding proteins involved in
various metal-detoxification and storage mechanisms. The evolution of this gene family
in vertebrates has been previously studied mostly in mammals using a sparse taxon or
gene sampling. Genomic databases and available data on metallothionein protein
functions and expression allow a better understanding on the evolution and functional
divergence of the different metallothionein types. We downloaded 77 metallothionein
coding sequences from 20 representative vertebrates with annotated complete
genomes. We found multiple metallothionein genes, also in reptiles, which were
thought to have only one metallothionein type. Phylogenetic analyses both on
nucleotide and amino acid data recovered metallothionein clades corresponding to the
eutherian MT1/MT2, potential tetrapod MT3 and amniote MT4, and fish MT. The
optimal gene-tree/species-tree reconciliation analysis identified the best root in the fish
clade. Functional analyses reveal variation in hydropathic index among protein regions,
likely correlated with distinct flexibility and function (or metal affinity) of the protein
domains. Analyses of functional divergence identified amino acid sites correlated with
functional divergence among metallothionein types. Uncovering the number of genes
and sites possibly correlated with functional divergence will help to design cost-
effective metallothionein protein functional studies in other organisms. This will permit
further understanding of the distinct roles and specificity of these proteins as well as to
properly target specific metallothionein types for different types of functional studies. In
the genomic-era comparative functional genomic studies of gene families are possible,
improving our understanding on the underlying mechanisms of functional divergence
after gene duplication.
Keywords: Functional analysis, Gene duplication, Gene tree, Genomic database,
Pseudogene, Reconciliation

12 FCUP
2013

FCUP Phylogeny and molecular biology in amphibian ecotoxicology
13
Introduction
Gene families are a set of genes sharing sequence, and often functional,
homology. The evolution of gene families is considered an important source driving
species evolution (Ohno 1970; e.g. Demuth et al. 2006 and references therein). Gene
families mainly evolve as a result of duplication and loss events, often associated with
gain of adaptive function (Chang and Duda 2012; Kondrashov 2012; Zhang 2003). This
mechanism may be due to neofunctionalization (Ohno 1970) according to which recent
duplicated genes can suffer an accelerated rate of mutations in one of the recently
duplicated copies once free from selective constraints, with these changes potentially
leading to new function (e.g. Zhang et al. 1998). Another hypothesis proposes that the
paralogs gradually substitute the multiple functions once maintained by the original
single copy gene, leading to specialized genes with no overlapping functions
(subfunctionalization model, Force et al. 1999; e.g. Prince and Pickett 2002; see also
Kondrashov et al. 2002). Independently of the underlying mechanisms driving
functional divergence after gene duplication, this process may promote increased gene
diversity and new gene functions (Kondrashov et al. 2002; Prince and Pickett 2002;
Zhang 2003), possibly leading or facilitating organismal adaptation to various
environmental conditions (e.g. Kondrashov 2012). In yeast, it has been suggested that
selection has favored retention of gene copies of yeast hexose transport genes under
low nutrient environments (Brown et al. 1998). Furthermore, mosquitoes’ populations
show high frequency of duplications on genes involved in pesticide-resistance,
apparently due to selection induced by insecticide treatment (Lenormand et al. 1998).
The metallothionein (MT) gene superfamily represents an interesting case
study, known for the high turnover of gene duplication and loss determining its
evolution (Capdevila and Atrian 2011). In some mammals, such as mouse and human,
the presence of multiple MTs has been connected to different gene expression and
gain and loss of function (e.g. Garrett et al. 1998; Moleirinho et al. 2011; Tío et al. 2004;
reviewed in Blindauer and Leszczyszyn 2010; see also below). Metallothioneins are
ubiquitous low molecular weight proteins and polypeptides of extremely high metal and
sulfur content (Nordberg and Nordberg 2009). These inducible proteins encompass
essential metal-binding properties and have several roles in metabolism, homeostasis,
and kinetics of metals such as transport, storage and detoxification of metal ions in
cells (e.g. Carpenè et al. 2007; Nordberg & Nordberg 2009; Palmiter 1998). Metal

14 FCUP
2013
affinity varies among the different MT types (Nordberg 1989 and see below). MTs have
recently also gained more attention in biomedical studies, due to their proposed
involvement in cancer or neurological diseases (reviewed in Hidalgo et al. 2009). Metal
resistance is known to be induced by gene duplication events in several species
(Kondrashov et al. 2002; Kondrashov and Kondrashov 2006). For example, it has been
shown that bacteria highly adapted to extreme metal concentrations retain several
duplicated genomic regions containing other metal transporter and resistance genes.
This suggests that rapid adaptation may be driven by these duplication events (von
Rozycki and Nies 2009).
The wide representation of MTs genes across all three domains of life does not
mean that they have been equally studied in different taxonomic groups. In vertebrates,
a large number of biochemical, molecular, and chemical studies have been carried on
these multi-functional genes in mammals (mostly in human and mouse), contrasting
with a scarce knowledge and the very limited data available for other organisms
(reviewed in Blindauer and Leszczyszyn 2010; Hidalgo et al. 2009). Different MTs
classification systems have been developed for all organisms based on protein
structure (e.g. Fowler et al. 1987; Nordberg and Kojima 1979; Palacios et al. 2011;
Valls et al. 2001; Vašák and Armitage 1986; reviewed in Nordberg and Nordberg 2009)
or using both protein structure and phylogenetic relationships (Binz and Kägi 1999;
Moleirinho et al. 2011). The earlier classification, based on protein structure, divides
MTs in three classes, including proteinaceous MTs closely related to those in
mammals (called class I), proteinaceous MTs that lack this close resemblance (class
II), and non-proteinaceous MTs (MT-like polypeptides form, class III) (Fowler et al.
1987; reviewed in Blindauer and Leszczyszyn 2010; Miles et al. 2000). However, the
currently adopted classification in available genomic and protein database of MT genes
is mostly based on the phylogenetic relationships among mammalian MT sequences,
which are known for their great functional diversity (e.g. Capdevila and Atrian 2011;
Vašák and Meloni 2011). According to this classification, MTs fall at least into four
subgroups, MT1, MT2, MT3, and MT4, which are generally differentially expressed,
induced, and show diverse metal binding affinities (e.g. Tío et al. 2004; reviewed in
Davis and Cousins 2000; Miles et al. 2000; Vašák and Meloni 2011). Only a partial
correspondence is shown between the early classification and the more recent
mammalian MT subgroups (e.g. MT1/2 to class I) (reviewed in Palacios et al. 2011).
Recent studies highlight the lack of suitability of this latest classification based on
mammalian MTs for molecular evolution studies at a taxonomically large scale,

FCUP Phylogeny and molecular biology in amphibian ecotoxicology
15
claiming the dissemblance of physiological selective pressures between mammals and
other organisms (reviewed in Capdevila and Atrian 2011). For example, studies on
other taxonomic groups (including plants and bacteria) underline a departure from the
classical mammalian (human and mouse) amino acid composition, biochemical metal-
binding characteristics, and protein folding (reviewed in Vašák and Meloni 2011; see
also Villarreal et al. 2006).
The increasing availability of genomic annotated databases provides an incredible
resource to study functional diversification and evolution of many genes and gene
families (e.g. Koonin 2009; Yanai et al. 2000). In vertebrates, available gene and
protein databases have been recently used to infer the MT gene family origin and
evolution through comparative analyses (e.g. in mammals, mostly on human,
Moleirinho et al. 2011 and in other vertebrates, Guirola et al. 2012; Trinchella et al.
2008, 2012). However, these studies have been based either on sparse taxon or gene
sampling when species with fully sequenced genomes have been considered (e.g.
Moleirinho et al. 2011) or they have been based on cDNA or protein data (Guirola et al.
2012; Trinchella et al. 2008, 2012). In this latter case, proper distinction between
different genes versus different isoforms cannot be assessed without genomic
sequencing of the target gene and for the cDNA data, all existing genes cannot easily
be detected if not expressed, for example as a result of no response to a metal
treatment used or differential expression in time and space. This could produce
misleading estimation of duplication and loss events and of the evolutionary history and
functional divergence of the studied gene family. The goal of our work is therefore to
complement the current and sparse knowledge on the molecular evolution and
functional divergence of this gene family in vertebrates, aiming at: 1) identifying actual
MT genes in the studied species, 2) estimating the number of duplication/loss events,
3) inferring the root of the MT gene tree in vertebrates, 4) inferring possible different
levels of selective pressure following the duplication events and among the main MT
types, and 5) studying functional divergence among MT types and identifying amino
acid sites potentially correlated with this difference.

16 FCUP
2013
Materials and Methods
Dataset assembly and characteristics
The dataset was initially constructed based on metallothionein genes retrieved
from the Ensembl 68 database (Flicek et al. 2011) (data collected on September 25,
2012). Data were further double-checked using the BLAT tool on UCSC Genome
Bioinformatics (Kent 2002), the BioMart, BLAST/BLAT tools of Ensembl, the NCBI
genomic database (data collected on January 29, 2013), and the Ensembl 70 release
(data checked on January 28, 2013). Sequences were further double-checked to
account for annotation discrepancies between databases. When necessary due to the
comparison between the Ensembl and NCBI databases, for sequences showing partial
bad annotation on each of the databases, we combined the information retrieved from
the two databases (Supplementary Materials 1 and 2). We selected only representative
vertebrate species spanning across distinct vertebrate groups (Supplementary Material
1). MT genes for all selected species were first retrieved using Ensembl Comparative
Genomics search tool for orthologs and paralogs of all human identified functional MT
genes (MT1A, MT1B, MT1E, MT1F, MT1G, MT1H, MT1M, MT1X, MT2A, MT3, MT4)
except for MT5, which is testis-specific and was not included in our work. Obtained
genes were then further checked by using the other databases and tools listed above.
To properly identify the CDS (coding sequences) products of distinct genes
instead than derived from different gene splicing events (therefore different transcripts
of the same gene), we compared exon and intron sequences and length. Only CDS
corresponding to different genes (distinct exons and intron sequences) were retained
for our analyses. Furthermore, for genes with multiple CDS only the ones codifying for
a product above 50 and below 70 amino acids were retained, accordingly to the amino
acid length of characteristic MT proteins in vertebrates. When this parameter was
matched by more than one transcript, we maintained only the transcript tagged as
CCDS, the Consensus CDS project (Pruitt et al. 2009) (e.g. Hom_MT1G and
Hom_MT1F for human). A complete list of species, CDS (with relative Ensembl and
NCBI accession numbers), chromosome location when available, and intron/exon gene
characteristics of the CDS used for this work are indicated in Supplementary Material
1. The final dataset contained ten mammals, Bos taurus (Linnaeus, 1758), Canis lupus

FCUP Phylogeny and molecular biology in amphibian ecotoxicology
17
familiaris (Linnaeus, 1758), Equus caballus Linnaeus, 1758, Homo sapiens Linnaeus,
1758, Monodelphis domestica (Wagner, 1842), Mus musculus Linnaeus, 1758,
Ornithorhynchus anatinus (Shaw, 1799), Pan troglodytes (Blumenbach, 1799), Rattus
norvegicus (Berkenhout, 1769), and Sus scrofa (Linnaeus, 1758), three birds, (Gallus
gallus (Linnaeus, 1758), Meleagris gallopavo Linnaeus, 1758, and Taeniopygia guttata
(Vieillot, 1817), two reptiles, Anolis carolinensis (Voigt, 1832) and Pelodiscus sinensis
(Wiegmann, 1835), one amphibian, Xenopus tropicalis (Gray, 1864) and four fish,
Danio rerio (Hamilton, 1822), Oryzias latipes Temminck & Schlegel, 1846, Takifugu
rubripes (Temminck & Schlegel, 1850), and Tetraodon nigroviridis Marion de Procé,
1822.
Sequence alignment was carried out on CDS nucleotide sequences in MEGA 5
(Tamura et al. 2011) using the Clustal W option. The alignment was further checked by
eye. Terminal stop codons were removed from all CDS prior analyses. Nucleotide
alignment of the dataset used in this work can be accessed on Dryad. The number of
variable and conserved nucleotide and amino acid sites was calculated in MEGA.
Phylogenetic analyses
Prior to phylogenetic analyses, the degree of saturation was estimated for all
the codon positions together and for the 3rd codon position alone in DAMBE 5.3 (Xia
2013) as the presence of substitution saturation in the data, if not taken into account,
may produce misleading phylogenetic results (e.g. Chiari et al. 2012). The estimate of
the degree of saturation present in the dataset was based on the comparison between
the index of substitution saturation (ISS), calculated from the data and a critical value
(ISS.c) at which the sequences signal fails to recover the true tree. The calculation was
performed under different topologies (symmetrical and asymmetrical); if ISS was not
recovered to be smaller than ISS.c, this was interpreted as indication of substitution
saturation in the dataset (see Xia et al. 2003 for further details). Phylogenetic analyses
were run on the nucleotide and amino acid datasets. Maximum Likelihood (ML)
analysis was performed in PhyML 3.0 (Guindon et al. 2010). ML analysis on CDS was
carried out with a K80+G substitution model (tr/tv = 1.7917; gamma shape = 0.7250;
proportion of invariable sites = 0) as estimated by the AICc (Akaike information criterion
corrected for finite sample size), to account for the small size of the dataset used, in
jModeltest2 (Darriba et al. 2012; Guindon and Gascuel 2003). ML analysis on amino
acid was carried out with FLU substitution model as estimated by the AICc in Prottest3
(Darriba et al. 2011) allowing PhyML to estimate the gamma factor and the proportion
18 FCUP
2013
of invariable sites. ML analysis was run with 1000 bootstrap replicates for both
nucleotide and amino acid data. Bayesian analyses were carried out on the nucleotide
and amino acid datasets in MrBayes 3.2. (Huelsenbeck and Ronquist 2001; Ronquist
and Huelsenbeck 2003). Bayesian analyses on the nucleotide dataset were run
applying 1) the same model of evolution to all codon positions or 2) a two-partitioned
mixed model (1st + 2nd codon and 3rd codon positions). The partitioned mixed model
was applied to our dataset as an alternative model of substitution to take into account
the higher substitution rate of the 3rd codon position comparatively to the 1st and 2nd.
For these analyses we used number of substitutions (nst), proportion of invariable sites
(pinvar), and rates according to jModeltest2. In the analysis with the partitioned mixed
model we used nst = 6, gamma = equal, and pinvar = 0 for the 1st + 2nd codon position,
and nst = 6, rates = gamma, pinvar = 0 for the 3rd codon position. The Bayesian amino
acid analysis was run with rates = gamma and pinvar = 0. The other parameters were
left to be estimated by MrBayes. Phylogenetic analyses were run on nucleotide and
amino acid datasets as well as on the nucleotide dataset using a codon-based partition
strategy (Bayesian analysis) to further take into account differences in the recovered
tree topologies that may be due to potential saturation occurring in the data (e.g. see
Chiari et al. 2012) and not detected by the saturation test.
All Bayesian analyses (on CDS and amino acid) were performed with two runs
each of four Markov MonteCarlo chains (MCMC), of which one cold and three hot. We
ran the analyses for 50 million generations to allow the standard deviation of split
frequencies to reach a value below 0.01. Trees and associated model parameters were
sampled every 1000 generations. The first 25% of the obtained trees were discarded
by the burnin and the 50% majority-rule Bayesian consensus retained. Admixture and
convergence of chains and runs were checked with Tracer v1.5 (Rambaut and
Drummond 2009). To compare the best model of evolution strategy used for the
Bayesian analysis ran on the nucleotide dataset, we calculated the Bayes factor for the
two distinct models (one single or a partitioned mixed model). Bayesian factor was also
used to compare among distinct tree topologies concerning the main MT clades as
recovered by the nucleotide and amino acid Bayesian analyses. Bayesian analyses
with a constrained monophyletic tetrapod MT3 clade and tetrapod MT3 – amniote MT4
(as recovered in the Bayesian analysis on the amino acid dataset, see Results) were
ran separately on the nucleotide dataset. The Bayes factor value (K) was calculated by
the ratio between harmonic means (average for all runs) of likelihoods for the two
models/tree topologies comparison (e.g. A and B, see (Nylander et al. 2004 for further
FCUP Phylogeny and molecular biology in amphibian ecotoxicology
19
information). An A/B ratio with K>1 indicates that the A model is more strongly
supported than B, while a value of K<1 states the opposite. A value of K=1 suggests
that the difference between the two models is not important.
Reconciliation analysis
To understand the gene evolution of the MT gene family, including duplication
and loss events, and to infer gene orthology relationships (see Doyon et al. 2011 for a
review), we carried out a reconciliation analysis of the gene and species trees. The
reconciliation was performed by a parsimony-based approach as implemented in
Notung 2.6. (Chen et al. 2000; Durand et al. 2005; Vernot 2008) using an unrooted
gene tree with multifurcations (uncertainties) and a built binary species tree. A species
tree including all the species in our dataset was built based on Chiari et al. (2012), Li et
al. (2007), and the Tree of Life web project (accessed on 2 October, 2012). The used
gene tree corresponded to the one obtained from the Bayesian analysis ran on the
nucleotide dataset with one model of evolution (best strategy model, see 3.2 Results
and discussion). For the reconciliation analysis, we chose the default parameters and
the posterior probability values as obtained from the Bayesian analysis for the used
tree (edge weight threshold / posterior probability values (pp) = 0.9, duplication = 1.5,
loss = 1.0). The edge weight threshold identifies nodes that are not supported with a
posterior probability equal or above 0.9 (chosen threshold for this analysis in our study)
and that can be rearranged during the reconciliation. This allows obtaining the optimal
reconciliation (see below) considering also different tree topologies from the one used
as input, at least for nodes with support lower than the used threshold. The cost/weight
of gene loss was considered lower than the one for duplication so that losses may
occur more frequently than duplications in the inferred reconciliation. This allows
accounting for possible non-sequenced or non-retrieved data in our dataset. Because
there may be many possible reconciliations of a gene tree within a species tree, the
optimal reconciliation corresponds to the one with the lower cost of duplication and loss
(see Doyon et al. 2011 for further information). The obtained optimal reconciliation was
used to root the gene tree, in order to obtain the lower cost of gene duplication and
loss, and to solve the polytomies in the gene tree. This process allows inferring a tree
with optimal reconciliation cost among all binary gene trees that are consistent with the
input multifurcated gene tree. A reconciliation analysis to confirm the results obtained
with the nucleotide-based gene tree was also performed using the Bayesian amino
acid gene tree.

20 FCUP
2013
Analysis of variation in selective pressure among lineages
To estimate the possible variation in selective pressure associated with
duplication events in the MT gene family, we applied a model of coding sequence
evolution allowing variation of the selective pressure among branches. Selective
pressure is calculated by comparing synonymous (dS) versus non-synonymous (dN)
substitution rates. Synonymous are silent substitutions as they do not involve an amino
acid change, differently from non-synonymous substitutions. The analysis of variation in
selective pressure among main MT clades (as in Figure 8 and Supplementary Material
4) was performed with the codeml program of the PAML 4.7 package (Yang 2007). The
analyses were performed both on the unrooted Bayesian nucleotide tree (one model of
evolution) and on the binary gene tree resulting from the optimal reconciliation (basal
tricotomy in the gene tree was not solved according to the codeml application
requirements). Analyses were run on the two tree topologies to infer the possible
influence of polytomies and different gene topologies at not-well supported nodes on
parameters estimates. This strategy allows us to also take into account uncertainties
concerning the phylogenetic relationship among the main MT clades. This Maximum
Likelihood-based analysis can, based on the data, estimate different ω (dN/dS) within
the tree by letting the user apply different weights of selective pressure among
evolutionary lineages. The parameter ω is therefore first estimated by running the
model with one single ω across all lineages (model = 0 option; hypothesis H = 0), and
then by allowing the program to estimate from the data distinct ω parameters for
chosen clades (model = 2 option; other hypotheses). This permits to test the different
selection rates among branches following duplication by assigning different ω
estimation to these branches. Branch lengths and transition/transversion are also
estimated separately for each analysis. Both ambiguity characters and alignment gaps
were treated as undetermined nucleotides (option Cleandata = 0) and the analyses
were run with one single ω across sites (option Nsites = 0). To test for convergence of
the runs, several simulations were run with multiple initial starting values of ω (0.2
and > 1) and kappa (transition/transversion rate; k = 2.0241 obtained with ω = 0.2 and
k = 3.5834 as previously calculated in jModeltest2), separately, in H0 (hypothesis with
one single ω across the tree). Alternative hypotheses (H1-H4, Table 1a and
Supplementary Material 3) were formulated to test ω between branches. We aimed to
test for: 1) a difference in selective pressure in the branches immediately following the
FCUP Phylogeny and molecular biology in amphibian ecotoxicology
21
duplication events (Hps H1 and H2), to assess functional divergence following
duplication, and 2) a difference in the mutation rates of one of the main MT clades (Hps
H3 and H4), to assess if the distinct main MT types evolve under similar selective
pressure (Table 1a and Supplementary Material 3). To statistically compare the different
evolutionary hypotheses we applied the LRT (Likelihood Ratio Test), which is a statistic
test based on the likelihood ratio between the null and alternative hypotheses (LR)
following the χ2 distribution of this statistic with degrees of freedom (fd) equal to the
difference between the number of parameters (np) of the alternative hypothesis and the
np of H0. The LRT rejects the H0 when the LR is considered too small by the given
significance level (p value < 0.05).
Bayesian and ML phylogenetic analyses ran on the amino acid dataset
recovered a tetrapod MT3 clade (see Results). To test if the selection pressure results
obtained using the Bayesian tree would be confirmed in case of an alternative tree
topology, we repeated the analyses described above using as input tree the Bayesian
tree obtained on the nucleotide dataset (one model of evolution) with a tetrapod,
instead than a eutherian MT3 clade (input tree represented in Supplementary Material
6).
Functional analyses
To further analyze the existence of functional protein divergence among main
MT clades (as in Figure 8 and Supplementary Material 4; see also Results and
Discussion), we calculated the GRAVY (grand average of hydropathicity) index using
the referenced hydropathic index for amino acids as in Kyte and Doolittle (1982). The
hydropathic index consists of the attribution of a fix value to an amino acid according to
the hydrophobic or hydrophilic properties of its side chain (Kyte and Doolittle, 1982).
The GRAVY index of a sequence corresponds to the sum of the hydropathic value of
each amino acid in the sequence divided by the number of residues in the sequence.
This calculation was performed using the GRAVY Calculator web application.
Increasing positive score indicates greater hydrophobicity meaning higher water
repellency to non-polar molecules. Since the structure of the protein and its folding
define its function, differences in overall GRAVY index and in the hydropathic plot (see
below) can provide information about functional divergence among protein types and
have been used as an indication of the flexibility of the protein (e.g. Capasso et al.
2003, 2005). We calculated the average, maximum, minimum, and SD (standard
deviation) GRAVY index for the main MT clades (see below) corresponding to the
22 FCUP
2013
arithmetic mean of the obtained GRAVY index of all the sequences contained within
each main MT clade. Main MT clades (Supplementary Material 4) correspond to the
clade defined by node 3 (amphibian, bird, and reptile MT), node 31 (eutherian MT1/2),
node 40 (eutherian MT3), node 46 (mammalian MT4), node 49 (potential amniote
MT4), and node 53 (fish MT) (node numbers as in Supplementary Material 4).
Furthermore, for each of the above mentioned clades, a “clade” amino acid consensus
sequence was manually built by eye. For these consensus amino acid clade
sequences, the hydrophobicity plots were obtained following the Kyte-Doolittle method
using the Protein Hydrophobicity Plots Generator.
Functional divergence among main MT clades after duplication events was
further investigated using DIVERGE v.2 (Gu and Vander Velden 2002) by assessing
the Type I and Type II functional divergences among clusters (main MT clades, see
below). Gu (2001) recognizes two main types of functional divergence for duplicated
genes: Type I (Gu 1999) is characterized by amino acids that are highly conserved in
one cluster, but variable in the other, taking into account the phylogeny and sequences
variation across the tree. Type I divergence is correlated to different functional
constraints between duplicate genes with consequent site-specific rate differences (Gu
1999). Type II (Gu 2006) is characterized by a “cluster-specific functional divergence”
(Lichtarge et al. 1996) due to site-specific changes of amino acid physiochemical
property (e.g. charge, hydrophobicity). For this analysis, the sequences Equ_b_MT,
Mel_MT1_, Orn_a_MT, Orn_b_MT, OrnMT3, and all sequences of P. sinensis were
removed from the dataset due to either missing data at the beginning of the sequences
or very divergent amino acid sequences and unresolved phylogenetic placement (see
dataset file deposited in Dryad, Figure 8, and Supplementary Material 4). Sites with
missing data would be excluded from the divergence analysis, thus reducing the amino
acid sites for which the estimate of sequence divergence among the distinct MT clades
would be calculated, for example by eliminating half of the functional β-domain of the
protein (see Results and Discussion for MT protein domains). Very distinct sequences
for which phylogenetic placement was not well recovered (Orn_a_MT, Orn_b_MT, and
Orn_MT3) were removed as they could interfere with divergence estimates. The
DIVERGE analysis was run using the rooted binary gene tree obtained after
reconciliation (Figure 9), since the software only operates with phylogenetic trees
without polytomies. The three-dimensional (3D) structure of the MT2 protein of R.
norvegicus (Uniprot protein database, accession number P04355 and corresponding to
Rat_MT2A in our dataset) was used as MT protein reference. Divergence was tested
FCUP Phylogeny and molecular biology in amphibian ecotoxicology
23
between 1) eutherian clades MT1/2 and MT3 (corresponding to node 35 in
Supplementary Material 4), and 2) eutherian clades MT1/2 and MT3 (MT1/2/3) versus
potential amniote MT4 (the amniote MT4 clade is identified by node 49 in
Supplementary Material 4), corresponding to major gene duplication events (see
Results and Discussion and Figure 9). The coefficient of functional divergence, theta
(θ), corresponding to the proportion of sites to be expected functionally divergent, was
determined for all gap-free amino acid positions. θ is directly linked to the coefficient of
rate correlation between the evolutionary rates of a site within each gene cluster (Gu
1999; Wang and Gu 1999). It varies between 0 and 1, with θ = 0 indicating no observed
functional divergence. DIVERGE provides a ML statistical estimate of θ (ThetaML) (Gu
2001). The statistically significant functional divergence among clusters (θ > 0) is
evaluated by a LRT with θ = 0 representing the null hypothesis. The LRT was used for
each of the pairwise comparisons eutherian MT1/2 versus eutherian MT3 and
eutherian MT1/2/3 versus potential amniote MT4, with the null hypothesis being
rejected for p < 0.05. Once the statistical evidence for functional divergence after gene
duplication is provided, sites that are likely to influence this divergence may be
identified by applying a cut-off value. The cut-off value corresponds to the posterior
probability of functional divergence at a site (see Gu 1999 for further details). In our
analyses, we applied a conservative cut-off value of 0.9 for all comparisons. Analysis of
functional divergence and search for sites involved in functional divergence was
repeated using the constructed tree topology including a tetrapod MT3 (see tetrapod
MT3 clade in Supplementary Material 6) to assess if the influence of this clade versus a
eutherian MT3 clade one the results obtained with the analyses indicated above.
Putative pseudogene inference
Species for which MT sequences were recovered as a within-species
duplication event (Figure 9 and Results and Discussion) or showed very divergent
amino acid sequences and were recovered within the same MT clade (e.g. Can,
Can_MT2A, Pan_a, Pan_c and Pan_h, Figs 1 and 2, see also alignment available on
Dryad) were comparatively investigated in order to infer potential pseudogenization. All
known mammalian functional MTs are characterized by 20 conserved metal-binding
cysteine residues and no or little aromatic amino acids (Kägi et al. 1984; reviewed in
Vašák and Meloni 2011, see also Figure 10 in Moleirinho et al. 2011). MT proteins
folding depend on these metal-binding cysteines and a mutation involving one of these
amino-acids may incapacitate the protein main function (Han and Lee 2006). Hence, to
24 FCUP
2013
infer the presence of pseudogenes in our dataset, we looked for sequence variation in
cysteines for 24 candidate pseudogene MT sequences (as defined at the beginning of
this section). Human MT sequences were chosen as reference to look for sequence
variation due to the large knowledge in protein structure and function in human MTs.
Furthermore, the 20 conserved metal-binding cysteine residues are the same as in the
chicken sequences, permitting to use the human MTs also for comparison of non-
mammalian MT sequences. Among human MTs, the choice of reference sequence to
use was based on phylogenetic relatedness according to the Bayesian nucleotide
analysis (one model of evolution, see Results and Discussion) rather than on
nomenclature resemblance (when nomenclature was available), to avoid incorrect
results due to misleading nomenclature. For the potential pseudogene sequences, the
GRAVY index was calculated as a further indication of possible functional divergence
from classical MT proteins.
Results and Discussion
Dataset assembly and characteristics
The initial retrieved dataset contained 86 sequences. After removal and
replacement of sequences due to incorrect annotation or annotation problems
(Supplementary File 2) the final dataset consisted of 77 sequences (Supplementary
Material 1). Approximately half of the removed sequences were intronless (data not
shown). On duplication events, intronless genes may be generated by retroposition
when the mRNA is retrotranscribed into the genome and may still represent functional
MT proteins. Despite this possibility, intronless sequences were removed from the
dataset after the lack of introns was confirmed according to both used databases
(Ensembl and NCBI) (Supplementary Material 2). In our dataset assembly, we
recovered cases of incorrect annotation (Supplementary Material 2) in the Ensembl
database, as it has been previously observed (e.g. McEwen et al. 2006; see also Wang
et al. 2003).
A great diversity of MT genes was recovered among mammalian species,
supporting what previously found in human (e.g. Moleirinho et al. 2011; Tío et al. 2004),
ranging from three in M. domestica to twelve in P. troglodytes (see below for additional
comments on one of these twelve MTs). In other vertebrates, we found two MT genes

FCUP Phylogeny and molecular biology in amphibian ecotoxicology
25
for each bird species (see below), two or three genes in reptiles (lizard and turtle; see
also below), one gene in amphibian, and one or two genes in fish. Previous studies
carried out to characterize MT genes in squamates and amphibians from cDNA,
recovered only one MT gene per species (Riggio et al. 2003; Trinchella et al. 2008,
2012), confirming for amphibians what already observed in Xenopus (Saint-Jacques et
al. 1995). In mammals, multiple MT genes/proteins are associated with expression in
distinct tissues and different metal affinity, with MT genes considered to be more
ubiquitous and other more specific (see below and Guirola et al. 2012). Data on MT
gene characterization in reptiles were, to our knowledge, until our study only limited to
squamated. In the squamate species Podarcis sicula (Rafinesque, 1810), Riggio et al.
(2003) and Trinchella et al. (2006, 2008) observed only one MT type in the different
tissues studied (brain, liver, ovary). The same MT type was also expressed in another
squamate, a snake, in the venemon glands (Junqueira-de-Azevedo and Ho 2002). In
chicken, similarly to what found in our work for reptiles, a second gene copy was
recovered only recently after the full genome of this species was released (Villarreal et
al. 2006). Biochemical analyses support for this gene/protein functional spectrum in
between the ones characterized for mammalian MT1 and MT4. Villarreal et al. (2006)
proposed that the second chicken MT gene may have remained undiscovered until the
full genome of this species was released due a restricted or limited expression in time
or space or specific metal-induction mechanisms (which may also differ among
species, see Nam et al. 2007 for expression of the two MT genes in two avian species).
A similar hypothesis could explain why only one MT gene has been characterized so
far in squamates. Our results, together with future newly sequenced complete reptile
genomes and biochemical studies will permit to test for differential expression and
induction among distinct species, tissues, developmental stages and metal response.
Furthermore, future fully sequenced genomes, including data from crocodilians and
tuatara, will provide further data to understand if a second MT duplication event equally
interested all amniotes, in comparison to the single MT gene recovered in fish and
amphibians. In fish, the two MT gene copies recovered in our dataset only in T.
nigroviridis are most likely due to the whole-genome duplication observed in this
species (Jaillon et al. 2004). Teleost fish (all the fish included in our dataset) genomes
are characterized by a whole genome duplication and large gene loss (Brunet et al.
2006; Taylor et al. 2003). Although we cannot completely exclude the possibility of not
having recovered a second MT gene for the other fish species in our dataset, whole
genome duplication and secondary gene loss can explain the different number of MT
26 FCUP
2013
genes recovered in our dataset for fish and reported in other studies (Bargelloni et al.
1999; see also datasets in Nam et al. 2007; Trinchella et al. 2008, 2012; one of the MT
genes used for D. rerio in these last two studies have been removed from Genbank
due to the chimeric origin of the sequence). Additional fully sequenced fish genomes
(e.g. Howe et al. 2013) will provide further insights on this subject.
Most MT CDS contained 162 nucleotides (61 amino acids), excluding the
terminal stop codon (Materials and Methods). MT3 type has an additional seven amino
acids in comparison to the other MTs, as already previously observed (reviewed in
Vašák and Meloni 2011). The majority of MT sequences included in our dataset
consisted of three exons, following the classical structure of mammalian MT (reviewed
in Hidalgo et al. 2009) (see sequence alignment). Two exons encode for the β-domain,
while the third exon for the α-domain of the protein (Vašák and Meloni 2011). These
thiol-rich domains bind with high affinity a different number and types of metal ions (e.g.
Zn2+, Cd2+, Cu2+ and others) consequently folding into two dumbbell-like shaped
connected by a flexible region constituted by lysine amino acids (reviewed in Hidalgo et
al. 2009; see also amino acid positions 33 and 34 in our alignment and below). The β-
domain is generally characterized by the amino acids 1-30, while α- domain by amino
acids 31-61 (Braun et al. 1992; Romero-Isart et al. 1999).
Sequences in our dataset had 13% and 17% of conserved nucleotides and
amino acids (183 and 58 variable sites), respectively (missing data and gaps
considered as different states). 1/3 of the conserved amino acids are within beta
domain, and 2/3 in the alpha domain. The double number of conserved amino acids
observed in the α-domain of the protein, a pattern previously reported for mammals for
MT1 versus MT4 (Tío et al. 2004), is probably correlated with the higher structural
constrain of this domain (reviewed in Hidalgo et al. 2009).
Within main MT clades (see below) sequence identity was 72 and 21 sites (120
and 43 variable) for eutherian MT1/2, 146 and 68 (58 and 16 variable) for eutherian
MT3, 77 and 26 sites (127 and 42 variable) for tetrapod MT3, 78 and 29 (111 and 34
variable) for potential amniote MT4, 67 and 26 (122 and 37 variable) for amphibian,
bird, and reptile MT and 113 and 41 (67 and 19 variable) for fish MT for the nucleotide
and amino acid sequences, respectively. Finally, there was no evidence of saturation
when assuming symmetrical and asymmetrical topology on the complete dataset as
well as for the 3rd codon position alone (data not shown).
FCUP Phylogeny and molecular biology in amphibian ecotoxicology
27
Phylogenetic analyses
Tree topologies obtained using distinct phylogenetic reconstruction methods
and the nucleotide or amino acid dataset were largely similar. The Bayes factor
calculation ratio between the partitioned and non partitioned Bayesian analyses was
0.98, suggesting a barely worth to mention evidence that the non partitioned strategy
was better than the partitioned one. Almost all analyses identified distinct major MT
clades in fish MT, eutherian MT1/2, eutherian MT3, mammalian MT4, a reptile/bird MT
clade, and a potential amniote MT4 (Figure 8 and Supplementary Material 4).
According to our phylogenetic results, currently used nomenclature to
distinguish among different MT types is not necessarily meaningful. In fact, we
recovered a reptile/bird MT clade including MT2, MT3 and MT4 called sequences, as
well as a well-supported eutherian MT1/2 clade consisting of many sequences with
unknown MT characterization (Figure 8, Supplementary Materials 1 and 4). In this
paper, we will refer to main MT clades following the predominant MT types included in
the clade as delineated above. The distinct fish versus tetrapod MT clades were
already recovered in previous analyses based on reduced MT type sequences (e.g.
Nam et al. 2007; Trinchella et al. 2008, 2012). Clade A (Figure 8, and node 31 in
Supplementary Material 4), the clade with most sequences (39), encloses all eutherian
MTs annotated as MT1, MT2 and some unknown from C. lupus, E. caballus, P.
troglodytes, and S. scrofa. This clade is highly supported by all trees, with the
exception of the ML and Bayesian amino acid trees (bootstrap = 18 and pp = 0.51, data
not shown).

28 FCUP
2013
Figure 8 - Unrooted Bayesian consensus tree (50% majority-rule) based on one single model of evolution. Bootstrap for
ML (in %) and Posterior Probability values are given for specific clades in the following order: ML nucleotide/ML amino
acid/Bayesian nucleotide no partition/Bayesian nucleotide partition/Bayesian amino acid. Values replaced by “-” when
below 60% bootstrap or 0.70 pp. When a clade is not recovered by the analysis it is indicated with “#”. Clade A
(eutherian MT1/2) 78/-/0.79/1/#; Clade B (eutherian MT3) 99/94/1/1/1; Clade D (bird+reptile+amphibian MT) -/#/-/0.75/#;
Clade F (fish MT) 93/99/1/1/1; Clade G (mammalian MT4) 99/100/1/1/1; Clade H (eutherian MT1/2/3) #/#/0.85/0.96/#.
Ornithorynchus and Monodelphis MT sequences were not recovered to belong
to this clade (Figure 8 and Supplementary Material 4). Clade B (Figure 8 and node 40
in Supplementary Material 4) includes MT3 from eutherian mammals (since O.
anatinus MT3 is outside this clade) and it is recovered with high support values from all
analyses (Figure 8 and Supplementary Material 4). Mammalian MT1/2 and eutherian
MT3 clades were also recovered in previous studies using smaller datasets (in terms of
FCUP Phylogeny and molecular biology in amphibian ecotoxicology
29
species or MT types) (Moleirinho et al. 2011; Nam et al. 2007; Trinchella et al. 2008,
2012). Differently from our results, Moleirinho et al. (2011) also resolved a mammalian
MT3 clade, with the inclusion of Ornithorynchus and Monodelphis, although this clade
was not strongly supported (pp< 0.6 and < 0.8 for MT3 clades including Monodelphis
and Ornithorynchus, respectively). The ML and Bayesian analyses ran on the amino
acid dataset recovered a tetrapod MT3 (eutherian MT3 + bird/reptiles MT + amphibian)
(bootstrap = 12 and pp = 0.87, data not shown). Bayes factor calculation to compare
for alternative tree topologies (Bayesian trees obtained with constrained clades)
suggests that a tree topology including a tetrapod MT3 clade (as in the trees obtained
on the amino acid dataset) or a tree with a eutherian MT3 and a reptile/bird MT clades
(as obtained in the trees obtained with the nucleotide dataset) are equally probable (BF
= 1; data not shown). Clade D (Figure 8 and node 3 in Supplementary Material 4)
includes seven MTs only from amphibian, reptiles, and birds. This clade containing
unknown MTs was recovered by all phylogenetic analyses using nucleotide sequences,
despite showing relatively weak support (ML nucleotide bootstrap value = 27, Bayesian
no partition pp = 0.58, and Bayesian with partition pp = 0.75). The ML and Bayesian
amino acid analyses recovered a reptile/bird clade, with the exclusion of the amphibian
sequence, which instead belonged to the tetrapod MT3 clade (bootstrap = 49, pp =
0.94, data not shown). Trinchella et al. (2012) using more species of squamate reptiles
(but no other reptiles) and amphibians recovered a reptile/bird clade corresponding to
clade D in our study, but to the exclusion of amphibian sequences. Clade F (Figure 8
and node 53 in Supplementary Material 4) corresponds to fish MT and it is always
recovered with high support values. Clade G (Figure 8 and node 46 in Supplementary
Material 4), which includes the mammal MTs annotated as MT4 is always recovered
with maximum support by all analyses (Supplementary Material 4). The rooted tree
indicates a potential amniote MT4 clade (node 49 in Supplementary Material 4), which
is recovered by all phylogenetic analyses, but the ML amino acid one. A potential
mammals/birds MT4 clade was also previously recovered, although with no significant
statistical support, using ML analyses on amino acid sequences of a reduced dataset
by Trinchella et al. (2012). Based on phylogenetic analyses, the MT4 clade has been
proposed to be of a more ancient origin than the rest of the MT types (e.g. mammalian
MT4 in Moleirinho et al. 2011, and mammals/birds MT4 in Trinchella et al. 2012). Our
results do not clearly solve MT4 as the ancestral MT type (Supplementary Material 4,
see also gene tree obtained after reconciliation, Figure 9) and independently on the
dataset used (nucleotide or amino acid) phylogenetic relationships among main MT

30 FCUP
2013
clades are generally poorly resolved. The MT4 mammalian relationship was, however,
recovered as basal to all the other MT types by the ML analyses on the amino acid
dataset (bootstrap value = 99, data not shown). Furthermore, the binary gene tree
obtained after reconciliation supports the amniote MT4 clade as ancestral to eutherian
MT1/2 and MT3 (Figure 9 and reconciliation results below). Clade H (node 35 in
Supplementary Material 4) representing the duplication event between MT1/2 and MT3
genes (see also reconciliation results below) is recovered with high statistical support
only by the Bayesian analyses on the nucleotide dataset. This clade has not been
clearly recovered in previous studies in which all MT types were included (Moleirinho et
al. 2011; Trinchella et al. 2012). In Moleirinho et al. (2011), the sister relationship
between MT1/2 and MT3 was disrupted only by the inclusion of a sequence from
Anolis; however the node corresponding to the relationship MT1/2 and MT3/Anolis was
recovered with high posterior probability (pp. 0.95). In Trinchella et al. (2012),
phylogenetic relationships among main MT types are generally poorly resolved.
Reconciliation analysis
The optimal unrooted reconciliation had a D/L (duplication/loss) cost of 89, with
32 duplications and 41 losses, confirming the high turnover of gene duplication and
loss predicted for this family. The “a priori” best outgroup chosen to root the
phylogenetic vertebrate MT tree in previous studies (e.g. Moleirinho et al. 2011;
Trinchella et al. 2012), the fish MT clade, was confirmed by our analysis (D/L score =
85, number of duplications = 32, number of losses = 37). This result was also
confirmed by the optimal reconciliation obtained using the Bayesian amino acid gene
tree (data not shown). Figure 9 shows the rooted binary (with solved polytomies from
the input gene tree) gene tree resulting from the optimal reconciliation, with putative
duplication and loss events. According to the optimal reconciliation, several duplication
events occurred before the MT gene expansion within the eutherian mammals (clade
MT1/2 and MT3). Furthermore, our results indicate that MT duplications mostly predate
speciation events. A duplication event characterized the divergence of the clades
containing MT from birds, reptiles, and amphibian from the rest. Another duplication
was responsible for the diversification of the putative amniote MT4 from mammalian
MT1/2 and MT3 (with the exclusion of M. domestica). Finally, a duplication event
interested eutherian mammals only and separated the eutherian MT3 and MT1/2. The
obtained reconciliation was recovered within species duplication events (duplication
located at the tip of that species) for B. taurus, E. caballus, M. domestica, O. anatinus,

FCUP Phylogeny and molecular biology in amphibian ecotoxicology
31
P. sinensis, and S. scrofa (Figure 9). These within species duplication were further
investigated to infer the possible existence of pseudogenization events (see Materials
and Methods).
Analysis of variation in selective pressure among lineages
The estimated ω, likelihood values and obtained LRT according to the different
tested hypotheses of variation in selective pressure after duplication events and among
main MT types (Table 1a and Supplementary Material 3) are shown in Table 1b.
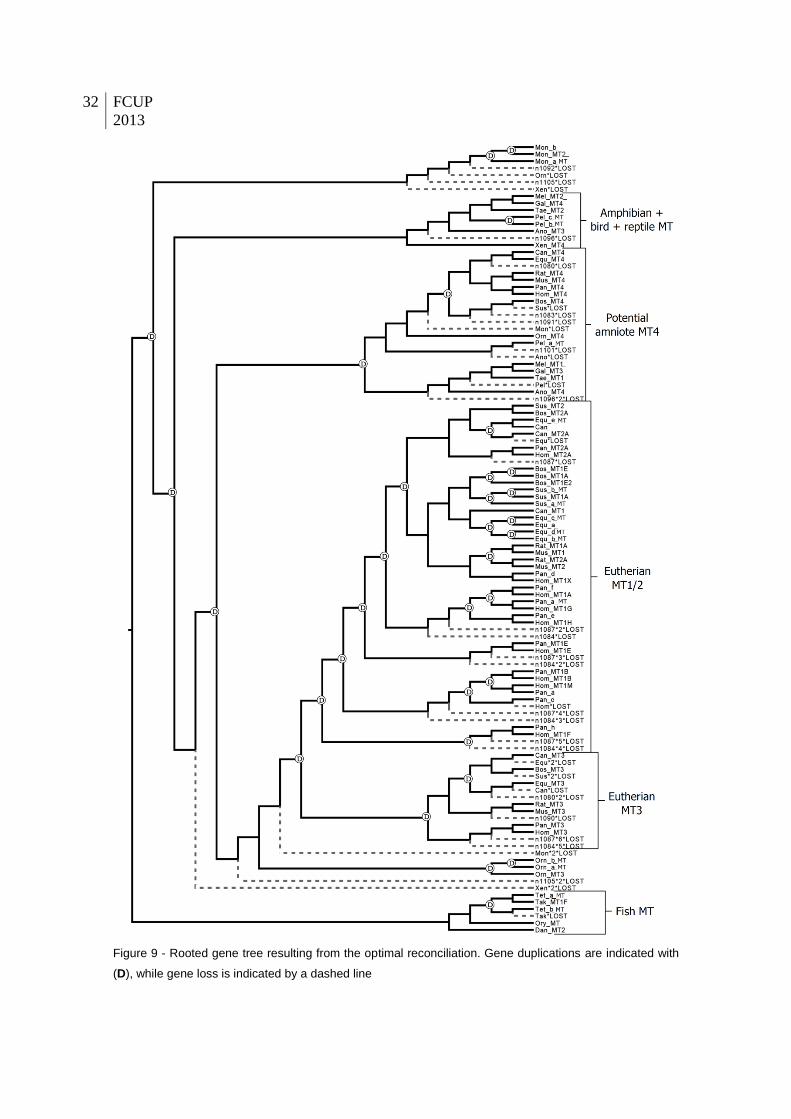
32 FCUP
2013
Figure 9 - Rooted gene tree resulting from the optimal reconciliation. Gene duplications are indicated with
(D), while gene loss is indicated by a dashed line
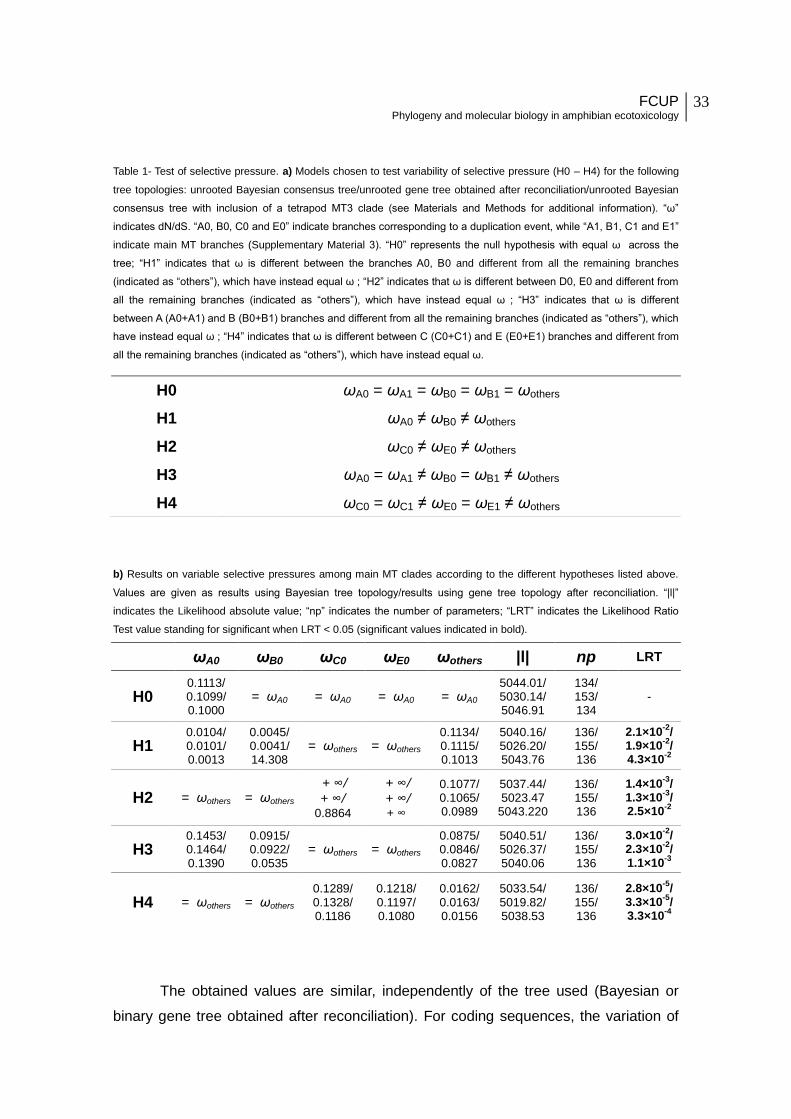
FCUP Phylogeny and molecular biology in amphibian ecotoxicology
33
Table 1- Test of selective pressure. a) Models chosen to test variability of selective pressure (H0 – H4) for the following
tree topologies: unrooted Bayesian consensus tree/unrooted gene tree obtained after reconciliation/unrooted Bayesian
consensus tree with inclusion of a tetrapod MT3 clade (see Materials and Methods for additional information). “ω”
indicates dN/dS. “A0, B0, C0 and E0” indicate branches corresponding to a duplication event, while “A1, B1, C1 and E1”
indicate main MT branches (Supplementary Material 3). “H0” represents the null hypothesis with equal ω across the
tree; “H1” indicates that ω is different between the branches A0, B0 and different from all the remaining branches
(indicated as “others”), which have instead equal ω ; “H2” indicates that ω is different between D0, E0 and different from
all the remaining branches (indicated as “others”), which have instead equal ω ; “H3” indicates that ω is different
between A (A0+A1) and B (B0+B1) branches and different from all the remaining branches (indicated as “others”), which
have instead equal ω ; “H4” indicates that ω is different between C (C0+C1) and E (E0+E1) branches and different from
all the remaining branches (indicated as “others”), which have instead equal ω.
b) Results on variable selective pressures among main MT clades according to the different hypotheses listed above.
Values are given as results using Bayesian tree topology/results using gene tree topology after reconciliation. “|l|”
indicates the Likelihood absolute value; “np” indicates the number of parameters; “LRT” indicates the Likelihood Ratio
Test value standing for significant when LRT < 0.05 (significant values indicated in bold).
The obtained values are similar, independently of the tree used (Bayesian or
binary gene tree obtained after reconciliation). For coding sequences, the variation of
H0 ωA0 = ωA1 = ωB0 = ωB1 = ωothers
H1 ωA0 ≠ ωB0 ≠ ωothers
H2 ωC0 ≠ ωE0 ≠ ωothers
H3 ωA0 = ωA1 ≠ ωB0 = ωB1 ≠ ωothers
H4 ωC0 = ωC1 ≠ ωE0 = ωE1 ≠ ωothers
ωA0 ωB0 ωC0 ωE0 ωothers |l| np LRT
H0 0.1113/ 0.1099/ 0.1000
= ωA0 = ωA0 = ωA0 = ωA0 5044.01/ 5030.14/ 5046.91
134/ 153/ 134
-
H1 0.0104/ 0.0101/ 0.0013
0.0045/ 0.0041/ 14.308
= ωothers = ωothers 0.1134/ 0.1115/ 0.1013
5040.16/ 5026.20/ 5043.76
136/ 155/ 136
2.1×10⁻²
/ 1.9×10
-2/
4.3×10⁻²
H2 = ωothers = ωothers + ∞/ + ∞/
0.8864
+ ∞/ + ∞/ + ∞
0.1077/ 0.1065/ 0.0989
5037.44/ 5023.47
5043.220
136/ 155/ 136
1.4×10⁻³
/ 1.3×10
-3/
2.5×10⁻²
H3 0.1453/ 0.1464/ 0.1390
0.0915/ 0.0922/ 0.0535
= ωothers = ωothers 0.0875/ 0.0846/ 0.0827
5040.51/ 5026.37/ 5040.06
136/ 155/ 136
3.0×10⁻²
/ 2.3×10
-2/
1.1×10⁻³
H4 = ωothers = ωothers 0.1289/ 0.1328/ 0.1186
0.1218/ 0.1197/ 0.1080
0.0162/ 0.0163/ 0.0156
5033.54/ 5019.82/ 5038.53
136/ 155/ 136
2.8×10⁻⁵
/ 3.3×10
-5/
3.3×10⁻⁴

34 FCUP
2013
selective pressure may reflect an acceleration of non synonymous substitutions and
indicate functional divergence following the duplication event, eventually decreasing
secondarily as an effect of purifying selection, which permits that the duplicated genes
maintain related but distinct functions (e.g. Gu 1999; Kondrashov et al. 2002; Li et al.
1985). Depending on when functional divergence among the paralog genes occur,
different patterns of evolutionary rates may be detected immediately after the
duplication event or among paralogs (in our case among the main MT clades) (see also
Gu 1999 for further theoretical details). The null hypothesis, H0 that the selective
pressure and the mutation rate remain constant along the tree is rejected in all
alternative hypotheses tested (H1-H4, p << 0.05, Table 1b). Our analyses indicated that
the evolution of the MT genes under the null hypothesis is generally characterized by
purifying selection (H0, ω < 1). Because the estimation of ω is based on the average
across all sites, our results do not discard the possibility that positive selection and
adaptation may occur at specific amino acid sites, as suggested by our functional
analysis results (see below). Substitution rates and selective pressure change
immediately following the duplication events (H1 and H2). The divergence of MT3 from
MT1/2 resulted in a two-fold increase in ω in MT1/2 compared to MT3 (e.g. H1, ω =
0.0104 versus ω = 0.0045, Table 1b). While there may not be an overall indication of
positive selection (ω < 1) and functional adaptation associated with this duplication
event, it has been reported that human MT3 shows different biological proprieties in
comparison to MT1/2 (see also Functional analyses below). For example, in humans
MT3, but not MT1/2, has been correlated to Alzheimer disease (reviewed in Vašák and
Meloni 2011). Our results support, however, a burst of positive selection for the
duplication event associated with the divergence of MT4 from all the rest (ω >> 1) (H2,
Table 1b). This could suggest the evolution of functional divergence between MT4 and
the other MTs. This result would support structural and biochemical data concerning the
distinct metal binding affinity of MT4 versus MT1 in mammals and the more specific
versus ubiquitous tissue expression of the two forms (Tío et al. 2004; reviewed in
Vašák and Meloni 2011, see also below). Finally, our analyses suggested that following
gene duplication, MT1/2 experienced an increase of ω of about one time and half in
comparison to all the rest of the MT genes (H3, ω = 0.1453, Table 1b). This result
seems to be in agreement with the large number of duplication events occurring within
this clade and the differential tissue and temporal expression of distinct MT1 genes
observed in human and mouse (e.g. Moleirinho et al. 2011; Schmidt and Hamer 1986).
On the other hand, after the duplication event, the evolution of MT4 from the other MTs
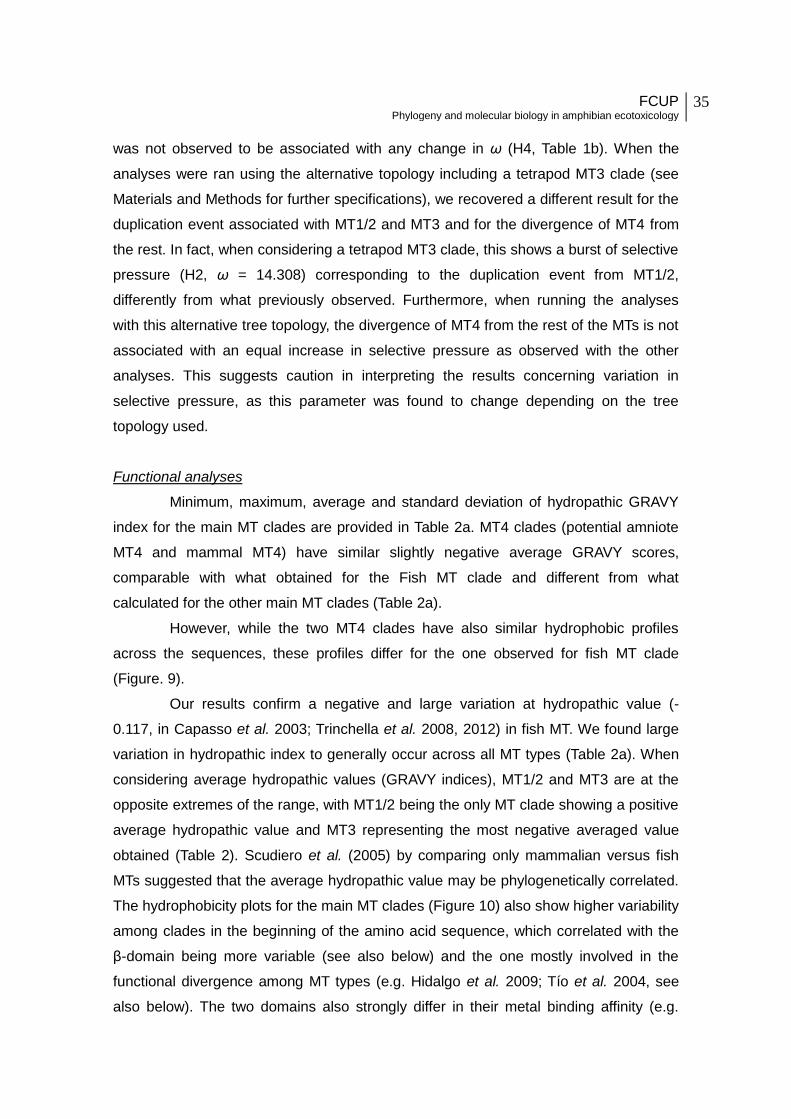
FCUP Phylogeny and molecular biology in amphibian ecotoxicology
35
was not observed to be associated with any change in ω (H4, Table 1b). When the
analyses were ran using the alternative topology including a tetrapod MT3 clade (see
Materials and Methods for further specifications), we recovered a different result for the
duplication event associated with MT1/2 and MT3 and for the divergence of MT4 from
the rest. In fact, when considering a tetrapod MT3 clade, this shows a burst of selective
pressure (H2, ω = 14.308) corresponding to the duplication event from MT1/2,
differently from what previously observed. Furthermore, when running the analyses
with this alternative tree topology, the divergence of MT4 from the rest of the MTs is not
associated with an equal increase in selective pressure as observed with the other
analyses. This suggests caution in interpreting the results concerning variation in
selective pressure, as this parameter was found to change depending on the tree
topology used.
Functional analyses
Minimum, maximum, average and standard deviation of hydropathic GRAVY
index for the main MT clades are provided in Table 2a. MT4 clades (potential amniote
MT4 and mammal MT4) have similar slightly negative average GRAVY scores,
comparable with what obtained for the Fish MT clade and different from what
calculated for the other main MT clades (Table 2a).
However, while the two MT4 clades have also similar hydrophobic profiles
across the sequences, these profiles differ for the one observed for fish MT clade
(Figure. 9).
Our results confirm a negative and large variation at hydropathic value (-
0.117, in Capasso et al. 2003; Trinchella et al. 2008, 2012) in fish MT. We found large
variation in hydropathic index to generally occur across all MT types (Table 2a). When
considering average hydropathic values (GRAVY indices), MT1/2 and MT3 are at the
opposite extremes of the range, with MT1/2 being the only MT clade showing a positive
average hydropathic value and MT3 representing the most negative averaged value
obtained (Table 2). Scudiero et al. (2005) by comparing only mammalian versus fish
MTs suggested that the average hydropathic value may be phylogenetically correlated.
The hydrophobicity plots for the main MT clades (Figure 10) also show higher variability
among clades in the beginning of the amino acid sequence, which correlated with the
β-domain being more variable (see also below) and the one mostly involved in the
functional divergence among MT types (e.g. Hidalgo et al. 2009; Tío et al. 2004, see
also below). The two domains also strongly differ in their metal binding affinity (e.g.

36 FCUP
2013
Jiang et al. 2000; reviewed in Tío et al. 2004). The hydropathic/hydrophobic value gives
indications about the flexibility of the protein, which is correlated to higher capacity of
undertaking conformational changes and therefore may be an indication of functional
divergence. In fact, the protein folds around the metal(s) it binds, and the ligand
accessibility and release are dependent on the flexibility of the whole protein. Our
results would therefore suggest a higher functional flexibility in the β-domain of the MT
protein and possibly a well defined distinction among main MT types.
Table 2 - Hydropathic value results. a) GRAVY index calculated for main MT clades (see Materials and Methods for
additional information). “Max”, “Min”, “Average”, “SD” indicate respectively the maximum, minimum, average, standard
deviation GRAVY indices obtained for sequences within a given clade; “GRAVY +/- 2SD” represents the higher and
lower boundaries respectively, limiting the 95% area of the normal distribution of the GRAVY index for all sequences
within the main MT clades. b) GRAVY index for potential pseudogenes, sequences used for comparison (see Materials
and Methods), and clade to which they belong to. For M. domestica and O. anatinus sequences, the GRAVY index was
not calculated because these sequences do not belong to any clade for which other sequences could be used for
comparison.
MT Clades Max Min Average SD GRAVY +/- 2SD
MT1/2 0.4344 -0.0820 0.1353 0.0957 0.3267 +/- 0.0561
MT3 -0.3029 -0.4691 -0.3849 0.0674 -0.2501 +/- 0.5197
Mammal MT4 0.0758 -0.1571 -0.0225 0.0787 0.1452 +/- 0.1798
Potential amniote MT4
0.0758 -0.1667 -0.0650 0.0840 0.1348 +/- 0.2329
Amphibian, bird, and reptile MT
0.1436 -0.5065 -0.2105 0.1779 0.1058 +/- 0.5662
Fish MT 0.0767 -0.1917 -0.0687 0.0872 0.1029 +/- 0.2431

FCUP Phylogeny and molecular biology in amphibian ecotoxicology
37
b) GRAVY index for potential pseudogenes, sequences used for comparison (see Materials and Methods), and clade to
which they belong to. For M. domestica and O. anatinus sequences, the GRAVY index was not calculated because
these sequences do not belong to any clade for which other sequences could be used for comparison.
Clade Potential
Pseudogenes Sequence
GRAVY Clade GRAVY
+/- 2SD
Clade MT1/2
Bos_MT1A 0.1934
0.3267 / -0.0561
Bos_MT1E 0.1557
Bos_MT1E2 0.0377
Can_MT2A 0.1721
Can 0.4344*
Equ_a_ 0.0607
Equ_b_MT 0.1462
Equ_c_MT -0.0820*
Equ_d_MT 0.0525
Pan_a -0.0291
Pan_c 0.2574
Pan_h 0.0758
Pan_MT1B 0.0328
Sus_MT1A 0.1295
Sus_a_MT 0.2475
Sus_b_MT 0.2148
Clade amphibian, bird and reptile MT
Pel_b_MT -0.1453 0.1058 / -0.5662 Pel_c_MT 0.1436*
Sequences not recovered in major clades
Mon_MT2 0.0871
(GRAVY index not calculated)
Mon_a_MT -0.0516
Mon_b -0.0323
Orn_MT3 -0.3190
Orn_a_MT -0.0873
Orn_b_MT -0.0823
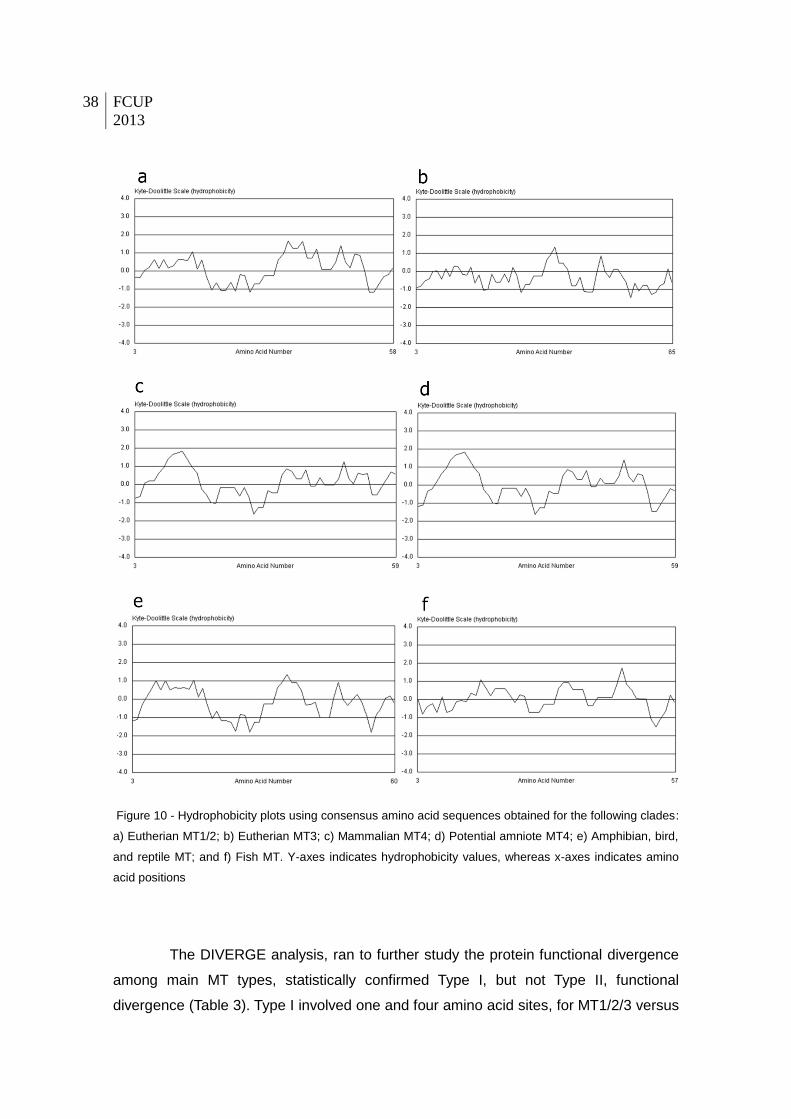
38 FCUP
2013
Figure 10 - Hydrophobicity plots using consensus amino acid sequences obtained for the following clades:
a) Eutherian MT1/2; b) Eutherian MT3; c) Mammalian MT4; d) Potential amniote MT4; e) Amphibian, bird,
and reptile MT; and f) Fish MT. Y-axes indicates hydrophobicity values, whereas x-axes indicates amino
acid positions
The DIVERGE analysis, ran to further study the protein functional divergence
among main MT types, statistically confirmed Type I, but not Type II, functional
divergence (Table 3). Type I involved one and four amino acid sites, for MT1/2/3 versus

FCUP Phylogeny and molecular biology in amphibian ecotoxicology
39
MT4 and MT1/2 versus MT3 functional divergence (Table 3, Figure 8, and
Supplementary Material 5).
Figure 11 - Metallothionein 3D structure as obtained from DIVERGE using the RatMT2 3D protein as a model. Colored
circles on the protein structure indicate Type I divergent amino acids (cut-off value = 0.9) between MT1/2 versus MT3
clades (A) and MT1/2/3 versus MT4 clades (B). Colored rectangles under the figure correspond to the distinct colored
amino acids and indicate the type of amino acid change at that position for the compared clades. Amino acid code: “A” –
alanine, “R” – arginine, “N” – asparagine, “C” – cysteine, “E” – glutamic acid, “I” – isoleucine, “K” – lysine, “P” – proline,
“S” – serine, “T” - threonine, “V”- valine
Table 3 - Type I and II divergence test results. “θ I” indicates the coeffient of functional divergence; “SE” indicates the
standard error; “LRT” corresponds to the 2 log-likelihood-ratio against the null hypothesis of θ I = 0; “p” indicates the p
value; “Pp cut-off” represents the posterior probability cut-off for specific amino acid sites. Significant p-values (p <
0.05) are indicated in bold.
These sites all occur within the β-domain, to further confirm the less
constrained functional activity of this part of the protein compared to the α-domain. The
amino acid site recovered at position 10 in our alignment (Figure 11 and
θI ± SE LRT p Pp cut-off = 0.9
θII ± SE p Pp cut-off = 0.9
MT1/2 vs MT3 7.992×10⁻¹
± 0.310 7.158 0.007 4 8.244x10
-2 ±
0.160 0.20 8
MT1/2/3 vs MT4 2.552×10⁻¹
± 0.107 5.659 0.017 1 -6.236×10
-2 ±
0.201 0.26 3

40 FCUP
2013
Supplementary Material 5) within the β domain has been previously identified to be
involved in different functions in MT3 and MT1/2 in mammals (Faller et al. 1999). The
change of two conserved proline residues in positions 7 and 10 (position numbers
according to Supplementary Material 5) to alanine or serine, which occurs in some
sequences in our MT1/2 clade, dissolves the neuroinhibitory activity and cluster
dynamics of the MT3 unique function in the brain (Hasler et al. 2000; reviewed in
Hidalgo et al. 2009). Two of the other sites indicated by our study to be involved in
functional divergence show an interesting pattern in the MT3 dataset. These divergent
amino acids (positions 24 and 30, alignment as in Supplementary Material 5) suggest a
species-specific functional divergence of the MT3 protein in rodents compared to MT3
and MT1/2 of other species. The amino acid site at position 24 is divergent for all
MT1/2 versus MT3, except for M. musculus and R. norvegicus (MT3 amino acid in
these species is the same as the one conserved in MT1/2), while the one in position 30
is conserved between MT1/2 and MT3 with the exception of these two species. The
amino acid site at position 24 is the only one consistent with functional divergence
between MT1/2 and MT3 when including in the input tree a tetrapod MT3 clade (see
Materials and Methods for further explanations). This would suggest that the other
recovered sites would be most likely involved in functional divergence of only eutherian
MT3 versus the other MT types. The last site, amino acid position 31 (position number
as in Supplementary Material 5) most likely was recovered due to the substitution of a
conserved cysteine in Bos_MT3. Expression data for this gene/protein will be
necessary to assess if this is a fully functional copy. Finally, the amino acid potentially
involved in functional divergence between MT1/2/3 and MT4 at position 14 involves a
serine, conserved in MT1/2/3 (and also in most of other sequences not belonging to
MT4 clade) (Figure 11 and Supplementary Material 5). This amino acid occurs next to
the metal binding cysteine, conserved in all main clades. Intercalating residues among
the conserved cysteines in the β-domain are highly dissimilar and associated with
functional divergence between MT4 and MT1 types (Tío et al. 2004). This result is
further confirmed when performing the analysis using an input tree including a tetrapod
MT3 clade.
Putative pseudogene inference
To identify potential pseudogenes among the studied sequences we followed
two criteria: the occurrence of a replacement of invariant cysteines and, when possible
a strong deviation of hydropathic index in comparison to the other sequences
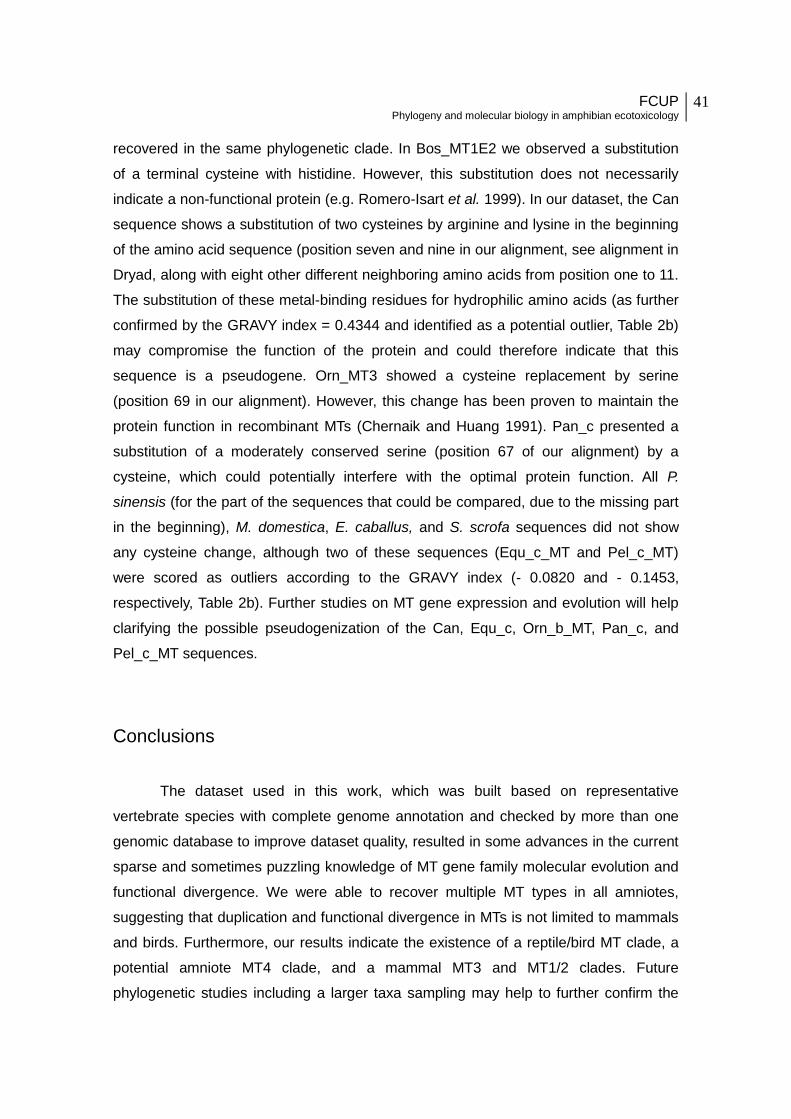
FCUP Phylogeny and molecular biology in amphibian ecotoxicology
41
recovered in the same phylogenetic clade. In Bos_MT1E2 we observed a substitution
of a terminal cysteine with histidine. However, this substitution does not necessarily
indicate a non-functional protein (e.g. Romero-Isart et al. 1999). In our dataset, the Can
sequence shows a substitution of two cysteines by arginine and lysine in the beginning
of the amino acid sequence (position seven and nine in our alignment, see alignment in
Dryad, along with eight other different neighboring amino acids from position one to 11.
The substitution of these metal-binding residues for hydrophilic amino acids (as further
confirmed by the GRAVY index = 0.4344 and identified as a potential outlier, Table 2b)
may compromise the function of the protein and could therefore indicate that this
sequence is a pseudogene. Orn_MT3 showed a cysteine replacement by serine
(position 69 in our alignment). However, this change has been proven to maintain the
protein function in recombinant MTs (Chernaik and Huang 1991). Pan_c presented a
substitution of a moderately conserved serine (position 67 of our alignment) by a
cysteine, which could potentially interfere with the optimal protein function. All P.
sinensis (for the part of the sequences that could be compared, due to the missing part
in the beginning), M. domestica, E. caballus, and S. scrofa sequences did not show
any cysteine change, although two of these sequences (Equ_c_MT and Pel_c_MT)
were scored as outliers according to the GRAVY index (- 0.0820 and - 0.1453,
respectively, Table 2b). Further studies on MT gene expression and evolution will help
clarifying the possible pseudogenization of the Can, Equ_c, Orn_b_MT, Pan_c, and
Pel_c_MT sequences.
Conclusions
The dataset used in this work, which was built based on representative
vertebrate species with complete genome annotation and checked by more than one
genomic database to improve dataset quality, resulted in some advances in the current
sparse and sometimes puzzling knowledge of MT gene family molecular evolution and
functional divergence. We were able to recover multiple MT types in all amniotes,
suggesting that duplication and functional divergence in MTs is not limited to mammals
and birds. Furthermore, our results indicate the existence of a reptile/bird MT clade, a
potential amniote MT4 clade, and a mammal MT3 and MT1/2 clades. Future
phylogenetic studies including a larger taxa sampling may help to further confirm the

42 FCUP
2013
existence of a tetrapod MT3 clade, as recovered in this study by the analyses ran on
the amino acid dataset. Our results, together with the analyses of functional divergence
between main MT clades and sites possibly associated with the functional divergence,
permitted us to conclude a likely association of MT functional genes roles in vertebrate
groups to duplication/loss events.
In humans, MT1/2 are inducible and expressed in almost every tissues. MT3
and MT4 are, on the other hand, relatively unresponsive to the inducers that stimulate
MT1/2 expression and are mostly located in the central nervous system and in the
stratified squamous epithelium, respectively (reviewed in Vašák and Meloni 2011). The
limited amount of data available for on non-mammalian vertebrate and on a non-
vertebrate chordate in which the expression and induction of distinct MT types have
been analyzed (e.g. Guirola et al. 2012; Nam et al. 2007) suggest the existence in non-
mammalian vertebrates of two MT types, of which one is more ubiquitous and the other
is more specialized. The poor resolution of phylogenetic relationship among the main
MT types does not allow us to fully interpret the evolutionary process of functional
divergence in this gene family. We may speculatively propose that a less functionally
specialized ancestral MT may have occurred in all tetrapods (similar to the current
mammalian MT1/2 type), which evolved into more specialized MT types (e.g. the
current MT3 and MT4). Although our analyses support the existence of functional
divergence among the main MT types, we do not have sufficient indication to support
that MT3 and MT4 represent functionally specialized MTs in amniotes other than
mammals. More biochemical and expression data are certainly needed to understand
the underlying mechanisms of functional divergence after gene duplication in MTs,
especially between mammals and other vertebrates. Together with highlighting that MT
gene duplication interested all amniotes and that functional divergence occurred
among main MT types, our results can also help to design future cost-effective MT
functional studies in other vertebrates, beside human and mouse. In fact, while a large
body of biochemical and molecular work is currently available for mammalian model
species, similar data are currently lacking for the distinct MT types recovered in non-
mammalian vertebrates. Furthermore, in vertebrates, metallothionein expression and
concentration are often used in ecotoxicological and metal homeostasis studies (e.g.
Andreani et al. 2007; Kim et al. 2013; Riggio et al. 2003). As studies on mammalian
model species reveal, not all MT types are equally involved in the same function,
expressed in the same tissue and at the same time, neither show the same metal
affinity. Therefore, the lack of knowledge on similar potential differences among MT

FCUP Phylogeny and molecular biology in amphibian ecotoxicology
43
types in other vertebrates possessing multiple MT genes may be misleading or provide
incomplete conclusions. Comparative genomic and biochemical studies will help filling
this gap of knowledge and contribute to our understanding on both metallothionein
evolution and functional divergence after gene duplication in vertebrates.

44 FCUP
2013

FCUP Phylogeny and molecular biology in amphibian ecotoxicology
45
2. Phylogenetic signal in amphibian sensitivity (LC50) to copper sulfate
Abstract
One of the most common objective measures used in toxicological studies to
quantify the association between exposure and toxicity is the LC50. This parameter is
exclusive for each species and contaminant and may therefore vary considerably
between species, providing some indications of species sensitiveness to a contaminant
when exposed conditions are the same. In ecological risk assessment (ERA) for
ecotoxicological studies, little variation in chemical sensitivity within a taxonomic group
(and sometimes among taxonomic groups, e.g. fish and amphibians) is assumed. This
relies on a further assumption that taxonomic relationship may be used to infer species
sensitivity to a certain contaminant. However, the influence of taxonomic relationships
on sensitivity to a certain chemical compound has largely not been tested. We
therefore used a phylogenetic comparative approach to assess the phylogenetic signal
to sensitivity, using the LC50 parameter, to copper sulfate in amphibians and to also
estimate the effect of temperature variation on sensitivity variation.
Our results demonstrate a strong influence of temperature on amphibian LC50
to copper sulfate. The data gathered from published and available comparative data on
eleven amphibian species show a phylogenetic signal in LC50 only when taking
temperature under consideration, demonstrating the important role of temperature in
species sensitiveness to copper sulfate. This result, if confirmed with a larger sample
size, can be used as a predictive tool in amphibian conservation and risk assessment
studies.

46 FCUP
2013
FCUP Phylogeny and molecular biology in amphibian ecotoxicology
47
Introduction
To evaluate the effects of chemicals, pesticides, and contaminants on
organisms, a repeatable quantitative measure of relationship between exposure and
toxicity to the organisms is generally used. This relationship is typically characterized
by two variables: 1) the dose or exposure (amount of chemical/pesticide taken up or
ingested by the organism, such as the chemical concentration in the exposure medium
in a total exposure time), and 2) the response, which may be mortality, growth,
reproductive performance or other phenotypic responses (Wright and Welbourn, 2002).
One parameter often used as a response is the LC50 (Lethal Concentration 50), which
corresponds to the toxicant concentration at which in a certain time, half of the test
population/sample is killed (Wright and Welbourn, 2002). LC50 is therefore dependent
on the concentration of the chemical used and on the time of exposure, however it may
also be influenced by: specific experimental conditions (e.g. temperature, salinity), the
studied species, and by the developmental stage of the tested specimens.
The importance of integrating concepts and knowledge from evolutionary
biology into ecological risk assessment (ERA) has been recently recognized (e.g.
Coutellec and Barata 2011 and references therein). In fact, traditional ecotoxicology
and ecotoxicological risk assessment focus mostly on descriptive phenotypic changes
(e.g. mortality, LC50, growth, etc.) following treatment with a contaminant, generally
considering species and populations as independent units. However, species, and
population sensitivity resemblance to a chemical (contaminant/pesticide) may or may
not reflect the evolutionary history of the species (or populations). In ERA, the common
procedure is to assume little intraspecific and interspecific variation (generally among
species belonging to the same taxonomic group, e.g. birds, mammals) in chemical
sensitivity. Therefore, the LC50 of a determinate chemical for certain species provides
an indication of how distinct species may be more or less sensitive to a contaminant
under the same experimental conditions.
The assessment of chemical sensitivity can be carried out on a handful of
model species in ecotoxicology that can be easily studied in laboratory conditions to
identify the most sensitive taxonomic group (e.g. birds, mammals, fish, and
invertebrates). The results are then extrapolated to estimate the impact of a chemical
on all the species within the group and sometimes even on other distantly related
groups (e.g. ESFA Journal 2013, pag 169; Species Sensitivity Distribution, SSD, see
for example Awkerman et al. 2008; Interspecific correlation Estimation, ICE, Raimondo
48 FCUP
2013
et al. 2010). However, this approach may ignore evolutionary processes, such as
natural selection and neutral evolution (genetic drift), and their outcome. Those include
adaptation and plasticity, which may produce variation in sensitivity to a chemical
among populations and species (e.g. Hua et al. 2013). Hammond et al. (2012)
reviewed how intra- and inter- specific variation in sensitivity to a pesticide may largely
vary depending on the chemical and on the species. In the same work, these authors
found that significant phylogenetic signal can be observed in the sensitivity to
endosulfan, a common insecticide.
Knowledge on patterns of sensitivity to a contaminant among and within well
studied species may help to formulate prediction on how other species may respond to
the same contaminant. This approach would be especially useful to predict how toxic a
compound may be to endangered species and populations, in order to prevent or limit
their decline. When assessing patterns of sensitivity within and among species,
identifying confounding factors that may influence the sensitivity parameter is
especially important, since these factors could invalidate predictions that ignore them.
In this study we aim to use a phylogenetic comparative approach to evaluate the
phylogenetic signal in sensitivity (in this case, LC50) to copper sulfate in amphibians
and to estimate the influence of temperature variation on this measure of sensitivity.
We used published and available comparative data, together with a phylogenetic
generalized least-squares model on eleven amphibian species representing different
genera and families of Anura.
Materials and Methods
The list of amphibian species to use in this study was selected using three
different reference sources: Fryday and Thompson (2012), the Ecotox database (last
accessed on Sept. 7, 2013), and a literature search using “LC50”, copper sulfate, and
amphibians as keywords (last search Sept. 7, 2013). Data from Ecotox and Fryday and
Thomson (2012) were double checked on the original papers (see Table 4). To retain
the maximum number of amphibian species for which comparative data were available
for copper sulfate, we selected only studies that were carried under static conditions
without renewal, with technical test material, at the stage of tadpole (or larva) and for
studies with duration of 96 hours (four days). The only parameters we allowed to vary
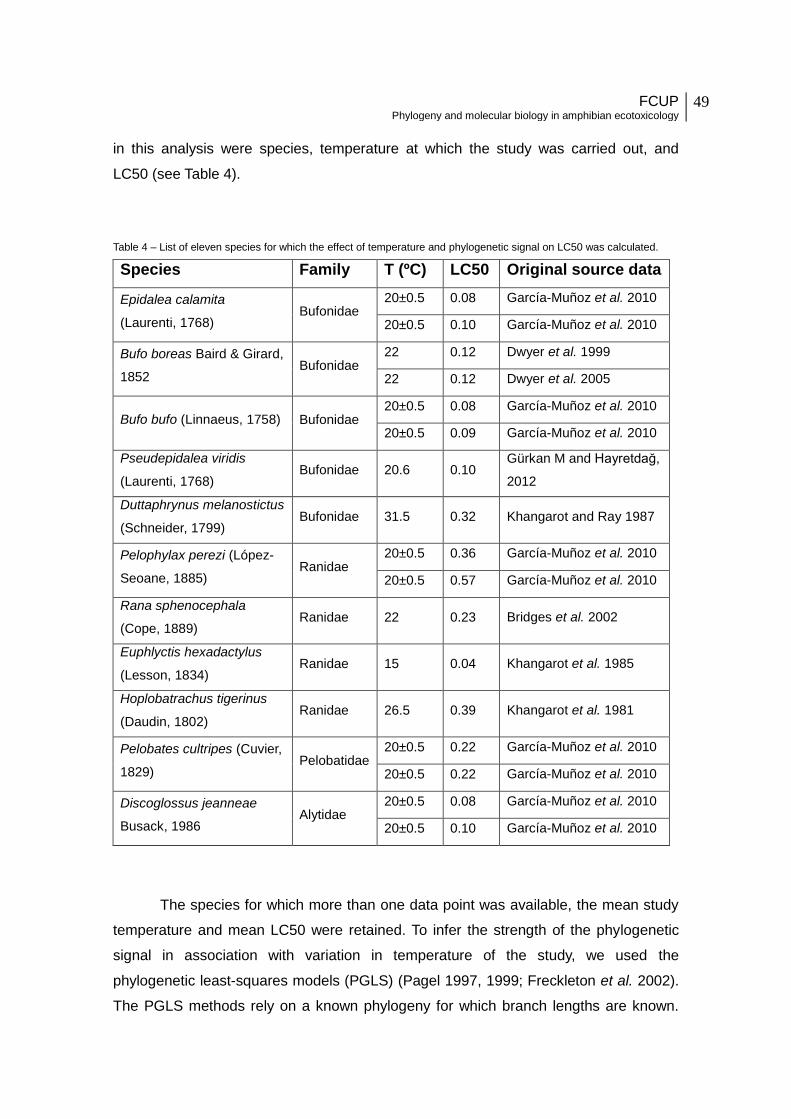
FCUP Phylogeny and molecular biology in amphibian ecotoxicology
49
in this analysis were species, temperature at which the study was carried out, and
LC50 (see Table 4).
Table 4 – List of eleven species for which the effect of temperature and phylogenetic signal on LC50 was calculated.
Species Family T (ºC) LC50 Original source data
Epidalea calamita
(Laurenti, 1768) Bufonidae
20±0.5 0.08 García-Muñoz et al. 2010
20±0.5 0.10 García-Muñoz et al. 2010
Bufo boreas Baird & Girard,
1852 Bufonidae
22 0.12 Dwyer et al. 1999
22 0.12 Dwyer et al. 2005
Bufo bufo (Linnaeus, 1758) Bufonidae 20±0.5 0.08 García-Muñoz et al. 2010
20±0.5 0.09 García-Muñoz et al. 2010
Pseudepidalea viridis
(Laurenti, 1768) Bufonidae 20.6 0.10
Gürkan M and Hayretdağ,
2012
Duttaphrynus melanostictus
(Schneider, 1799) Bufonidae 31.5 0.32 Khangarot and Ray 1987
Pelophylax perezi (López-
Seoane, 1885) Ranidae
20±0.5 0.36 García-Muñoz et al. 2010
20±0.5 0.57 García-Muñoz et al. 2010
Rana sphenocephala
(Cope, 1889) Ranidae 22 0.23 Bridges et al. 2002
Euphlyctis hexadactylus
(Lesson, 1834) Ranidae 15 0.04 Khangarot et al. 1985
Hoplobatrachus tigerinus
(Daudin, 1802) Ranidae 26.5 0.39 Khangarot et al. 1981
Pelobates cultripes (Cuvier,
1829) Pelobatidae
20±0.5 0.22 García-Muñoz et al. 2010
20±0.5 0.22 García-Muñoz et al. 2010
Discoglossus jeanneae
Busack, 1986 Alytidae
20±0.5 0.08 García-Muñoz et al. 2010
20±0.5 0.10 García-Muñoz et al. 2010
The species for which more than one data point was available, the mean study
temperature and mean LC50 were retained. To infer the strength of the phylogenetic
signal in association with variation in temperature of the study, we used the
phylogenetic least-squares models (PGLS) (Pagel 1997, 1999; Freckleton et al. 2002).
The PGLS methods rely on a known phylogeny for which branch lengths are known.
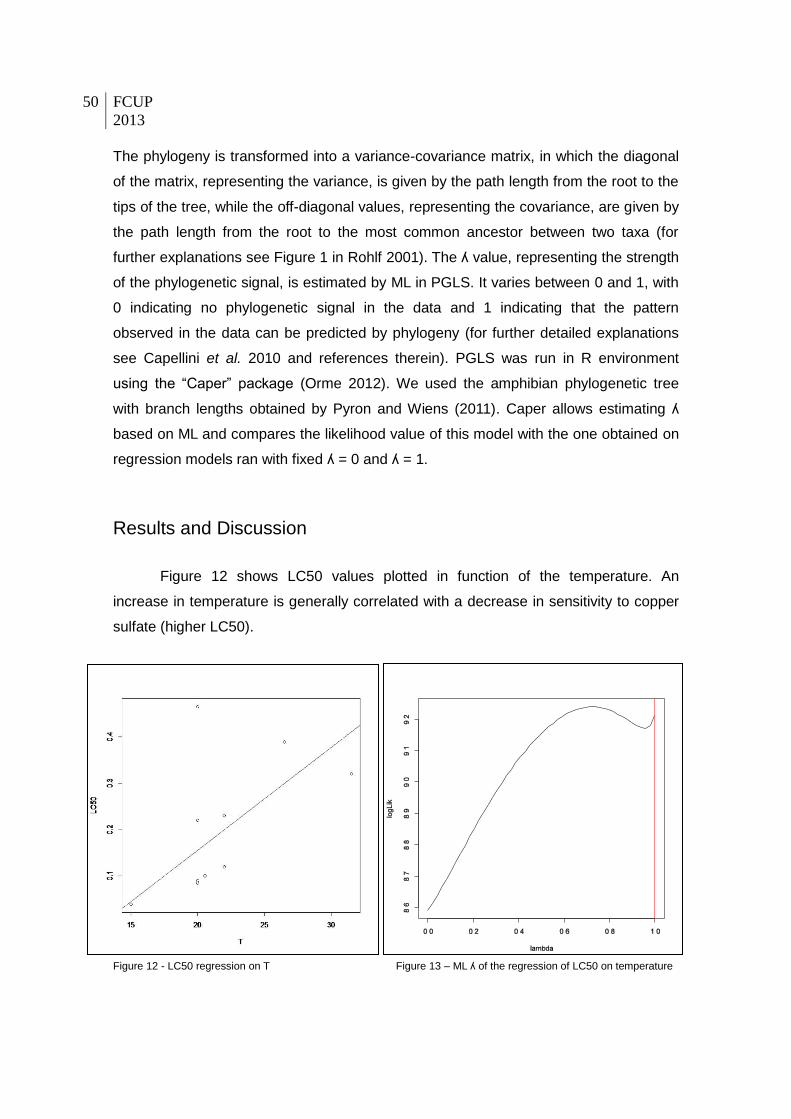
50 FCUP
2013
The phylogeny is transformed into a variance-covariance matrix, in which the diagonal
of the matrix, representing the variance, is given by the path length from the root to the
tips of the tree, while the off-diagonal values, representing the covariance, are given by
the path length from the root to the most common ancestor between two taxa (for
further explanations see Figure 1 in Rohlf 2001). The ʎ value, representing the strength
of the phylogenetic signal, is estimated by ML in PGLS. It varies between 0 and 1, with
0 indicating no phylogenetic signal in the data and 1 indicating that the pattern
observed in the data can be predicted by phylogeny (for further detailed explanations
see Capellini et al. 2010 and references therein). PGLS was run in R environment
using the “Caper” package (Orme 2012). We used the amphibian phylogenetic tree
with branch lengths obtained by Pyron and Wiens (2011). Caper allows estimating ʎ
based on ML and compares the likelihood value of this model with the one obtained on
regression models ran with fixed ʎ = 0 and ʎ = 1.
Results and Discussion
Figure 12 shows LC50 values plotted in function of the temperature. An
increase in temperature is generally correlated with a decrease in sensitivity to copper
sulfate (higher LC50).
Figure 12 - LC50 regression on T Figure 13 – ML ʎ of the regression of LC50 on temperature
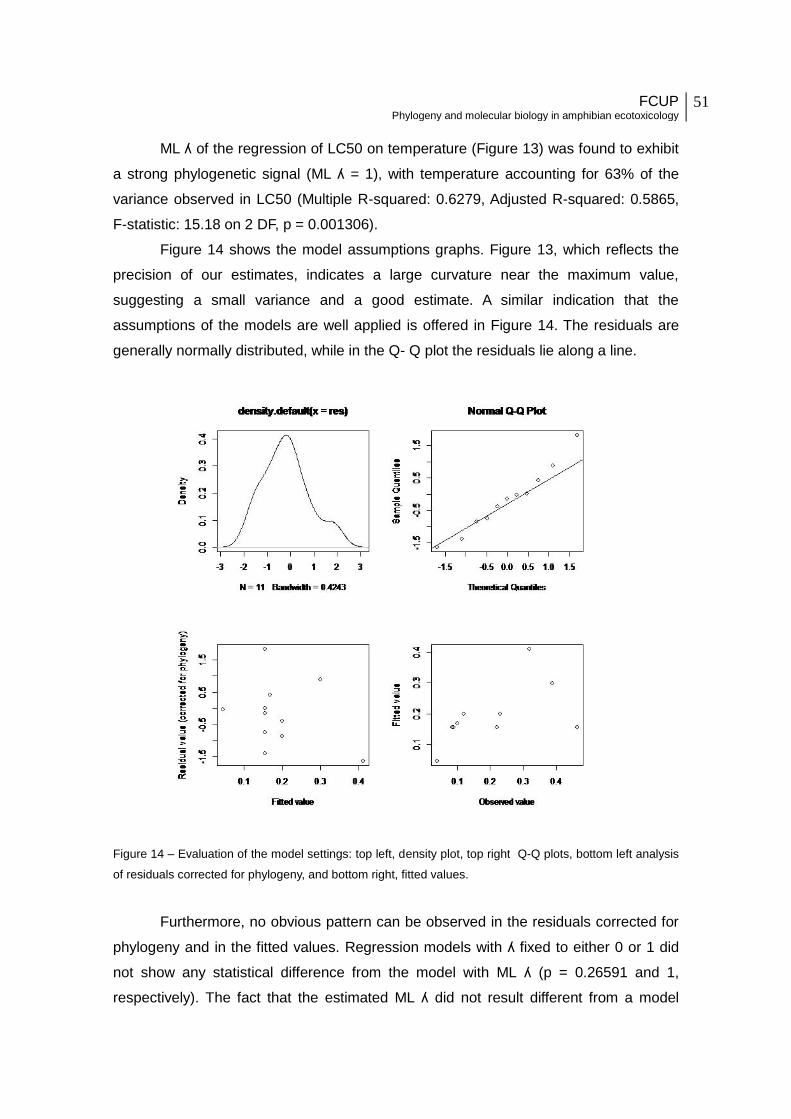
FCUP Phylogeny and molecular biology in amphibian ecotoxicology
51
ML ʎ of the regression of LC50 on temperature (Figure 13) was found to exhibit
a strong phylogenetic signal (ML ʎ = 1), with temperature accounting for 63% of the
variance observed in LC50 (Multiple R-squared: 0.6279, Adjusted R-squared: 0.5865,
F-statistic: 15.18 on 2 DF, p = 0.001306).
Figure 14 shows the model assumptions graphs. Figure 13, which reflects the
precision of our estimates, indicates a large curvature near the maximum value,
suggesting a small variance and a good estimate. A similar indication that the
assumptions of the models are well applied is offered in Figure 14. The residuals are
generally normally distributed, while in the Q- Q plot the residuals lie along a line.
Figure 14 – Evaluation of the model settings: top left, density plot, top right Q-Q plots, bottom left analysis
of residuals corrected for phylogeny, and bottom right, fitted values.
Furthermore, no obvious pattern can be observed in the residuals corrected for
phylogeny and in the fitted values. Regression models with ʎ fixed to either 0 or 1 did
not show any statistical difference from the model with ML ʎ (p = 0.26591 and 1,
respectively). The fact that the estimated ML ʎ did not result different from a model

52 FCUP
2013
indicating no phylogenetic signal in species sensitivity to copper sulfate is most likely
due to the low number of species used in this study. Freckleton et al. (2002) reported
that in datasets where the sample size is below 20 taxa, it is often difficult to obtain a
statically significant difference between ʎ equal to 0 or 1. However, this does not
invalidate the result of the regression, which suggests that once the variance in LC50
explained by temperature is removed, there is a strong phylogenetic signal in the lethal
concentration at which 50% of the animals are killed following copper sulfate treatment.
If these results would be confirmed using a larger taxon sampling (e.g. including
other amphibians, such as Urodela), a larger sample size, and studies carried out at
different temperatures also for the same species (for a known temperature)
phylogenetic relationships could be used to predict LC50 in other species of
amphibians. This would be especially important for species that due to either their
endangered status or their difficulty in being sampled or raised in laboratory conditions
could not be experimentally manipulated to obtain data on their sensitivity to copper
sulfate. Finally, future works could focus on the molecular basis correlated with the
phylogenetic signal observed in LC50 following copper sulfate treatment in amphibians.
One future direction would be to study if amino acid variation in the sequence of target
genes involved in metal detoxification (e.g. metallothioneins) could be associated with
functional divergence among species and therefore explain the phylogenetic signal
observed in the LC50.
FCUP Phylogeny and molecular biology in amphibian ecotoxicology
53
3. Isolation of the metallothionein gene in E. calamita
Abstract
Ecotoxicological studies often use morphological and behavioral changes on
amphibians to estimate the effect of contaminant exposure. However, the use of
molecular techniques in this field could provide a first line of contamination detection
since it identifies sub-lethal effects with no visible phenotypic manifestation.
The metallothionein genes, which are involved in organismal detoxification processes,
are known to be expressed in high doses under copper exposure in some organisms. A
demonstration of MT high gene expression on amphibians in response to copper
sulfate treatment remains to be studied. In my study, I will develop tools to study
metallothionein gene expression in order to fill this knowledge gap since it is of great
importance to further understand the rapid implications at molecular level caused by a
common contaminant exposure in this sensitive animal group. The first step in any
gene expression study is to identify and isolate the gene of interest in the target
species. In this study, we isolated the metallothionein gene in E. calamita from cDNA
samples obtained from an animal treated with copper sulfate in laboratory condition.

54 FCUP
2013
FCUP Phylogeny and molecular biology in amphibian ecotoxicology
55
Introduction
This chapter focuses on the isolation of the metallothionein gene (most likely a
single gene copy, see further information in Chapter 1 and below) in E. calamita.
Despite the great abundance and diversity of MT gene copies in some
vertebrates (namely mammals; Capdevila and Atrian 2011; Vašák and Meloni 2011;
Guirola et al. 2012, see Chapter 1), earlier characterization of MT genes in squamates
and amphibians from cDNA, succeed to recover only one MT gene per species (Riggio
et al. 2003; Trinchella et al. 2008, 2012, see also Chapter 1 for what concerns the
number of copies in reptiles). This confirms for amphibians what already observed in
Xenopus (Saint-Jacques et al. 1995). Generally all MT ortholog and paralog genes
present a relatively short and similar CDS sequence across vertebrate taxa (see
Chapter 1, this Thesis). Data on MT in amphibians are still limited. However MT
amphibian gene sequences have been previously isolated in five species, including
Anura and Urodela (Saint-Jacques et al. 1998; Trinchella et al. 2012). Sequence
similarity among these five species has been reported as 70% taking in consideration
the number of similar nucleotide sites between sequences (Trinchella et al. 2012). In
our work, we used the conserved status of the MT gene among amphibians to isolate
the MT gene directly from the cDNA of one of our samples (see below), by using
degenerated primers designed on the basis of CDS amphibian sequences obtained
from Genbank.
Hence, this step of our work in is aimed for:
1) Design specific primers to use in qRT-PCR experiment to study gene
expression following treatment with copper sulfate (see Future Work);
2) Isolate the gene from cDNA to make sure that the designed primers amplify
one single band (the target gene) before running the qRT-PCR, and that the
MT gene in E. calamita is a single copy.
Materials and Methods
Lab settings
One complete egg mass of E. calamita, (a single clutch of genetically similar
individuals) was collected in May, 2012 from a pond site with no record of historical
56 FCUP
2013
pollution (Ardal´s pond; UTM 30S 448100, 4220986; located on Jaén province, south-
eastern Spain, on siliceous bedrock and surrounded by Mediterranean forest, see
Figure 5). Eggs, embryos and tadpoles were always kept in compartments or
aquariums in unpolluted highland spring from the same source and with same chemical
characteristics (pH: 7.2–7.8; alkalinity: 170–250 mg L-1; hardness: 129 mg L-1; NO-3 <
0.1 mg L-1). Eggs were kept at 20ºC (±0.5ºC), on a 12 h light vs 12 h dark cycle in a
temperature-controlled chamber. Individuals were allowed to develop to Gosner Stage
25 (equal to a tadpole stage).
The test was performed on distinct experimental sets consisting of five tadpoles
each placed in separate glass vessels of 15 cm diameter) under different temperatures
(20 and 25ºC) and each with 1000 mL of solution containing different concentration of
copper sulfate, CuSO4∙5H2O (0; 0.02 and 0.04 mg L-1) or without the contaminant.
Samples were collected according to the following criteria: 1) individuals raised with no
contaminant in water were used as a control, while 2) and 3) samples were collected
one hour after adding copper sulfate. Samples were immediately flash frozen in liquid
nitrogen to preserve RNA quality and conserve effective gene expression of individuals.
These samples were then shipped to CIBIO in dry ice (-80ºC) to maintain RNA stability
(prevent degradation). All collected samples (tadpoles in Gosner Stage 20 and Gosner
Stage 25 or toadlets) were stored at -80ºC after flash frozen untill the extraction
procedure. Obtained samples were used to isolate the metallothionein gene in E.
calamita (see Table 5) as well as to carry out the experiments described in Chapter 4.
RNA extraction
RNA was extracted from a total of 45 samples (entire animal) using TRIzol
Reagent (Life Technologies®) following manufacturer instructions. Animals were ground
with a pestle in a mortar frozen by pouring liquid nitrogen on it (see also Gayral et al.
2011 for additional information). Extractions were commissioned to AllGenetics® (La
Coruña, Spain). The required RNA extraction technique was selected due to the high
efficiency (in terms of yield and success of extraction) of this method (Y. Chiari, pers.
comm.) and first tested and optimized by AllGenetics on specimens of Rana temporaria
(tadpoles) and on a newt (species not identified, J Vierna, AllGenetics, pers. comm.)
available at the facility. Available test samples shared the same storing conditions as
ours (flash frozen in liquid nitrogen immediately after collection and stored at -80ºC
before the extractions). After RNA extraction, samples were treated with RQ1 RNase-
Free DNase (Promega®) according to manufacturer instructions and run on the Agilent
2100 Bioanalyzer (Agilent Technologies®) to check for RNA integrity and yield. RNA
FCUP Phylogeny and molecular biology in amphibian ecotoxicology
57
samples were shipped to us in dry ice and stored at -80ºC until retro-trascription (see
below).
Reverse transcription of RNA
RNA samples for which the extraction had been carried out successfully (see
Table 5) and with a minimal total RNA quantity of 47 ng/µL were reverse transcribed to
single strand cDNA using the iScript cDNA Synthesis Kit (Bio-Rad®). 0.7 µg of total
RNA for each sample (see Chapter 4 for additional information regarding the use of the
same RNA quantity for this step) were retro-transcribed following manufacturer
instruction. cDNA samples were stored at -80ºC.
Primer design and gene isolation
Available amphibian MT sequences were downloaded from Genbank and
aligned in MEGA. Sequences were available for Pelophylax esculentus (Linnaeus,
1758), Xenopus laevis (Daudin, 1802), Xenopus tropicalis (Gray, 1864), Triturus
carnifex (Laurenti, 1768) and Ambystoma mexicanum (Shaw & Nodder, 1798) (see
Figure 15 for Genbank accession numbers); and we also added two MT sequences of
a single bird species, Gallus gallus (Linnaeus, 1758) (see Chapter 1) to take into
account sequence divergence across taxa. Search of available MT CDS was primarily
organized by hierarchical taxonomic level: first we looked for available sequences for
the same species, than the same genera, family, and class. Primers were designed in
Primer3 Plus (Untergasser at al., 2007) and/or by eye on the beginning and end of the
CDS sequence. Primers were further checked by MFEprimer-2.0 (Qu et al. 2009) for
possible unspecific binding (given by the number of predicted amplicons), annealing
temperature, primer-dimer formation, and hairpins using the Chicken RNA and genomic
background database selection. The primers used for PCR amplification and gene
isolation for the E. calamita metallothionein gene were: forward, 5’
ATGGACCCTAA[A/G]GACTGCG 3’ (Ta 57-59.7ºC), and reverse, 5’
GTTGCA[A/G]CAGCTGCACTTCT 3’ (Ta 59.4-64.4ºC). The expected amplified
fragment has 189 bp.
Final primer alignment of the CDS used for MT primer design is shown below

58 FCUP
2013
Pel_esc_MT ATGGACCCTAAAGACTGCGGCTGTGCTGCCGGTGGCTCATGCTCCTGCGGTGATTCCTGCAAGTGC
Xen_lae_MT ATGGACCCTCAGGACTGCAAATGCGAAACAGGTGCTTCTTGCTCCTGTGGTACTACCTGCAGTTGC
Xen_tro_MT ATGGACCCCCAGGACTGCAATTGTGAAACAGGTGCTTCCTGCTCCTGTGCAAATAAATGTGTATGC
Tri_car_MT ATGGACCCTAAAGACTGCGGCTGTGCCTCCGGTGGCTCTTGTTCATGTGCTGGGTCGTGCAAGTGC
Amb_mex_MT ATGGAC---------TGCGCATGCGCCACTGGCGGCTCCTGCTCTTGTGCTGGGTCATGCAAGTGT
Gal_ga_MT4 ATGGACCCTCAGGACTGCACTTGTGCTGCTGGTGACTCCTGCTCCTGTGCTGGGTCGTGCAAGTGC
Gal_ga_MT3 ATGGACTCCCAGGACTGCCCTTGTGCCACCGGCGGCACCTGCACGTGTGGAGACAACTGCAAATGT
****** *** ** * * ** * * ** * ** * ** **
Pel_esc_MT AAAGACTGCAAATGCAAGGGCTGCAAGAAGAGTTGCTGCTCCTGCTGTCCAACAGACTGCACCAAA
Xen_lae_MT AGCAATTGCAAGTGCACATCATGCAAGAAAAGCTGCTGTTCCTGCTGTCCAGCTGAATGCAGCAAA
Xen_tro_MT AGCAATTGCAAGTGCACATCTTGCAAGAAAAGCTGCTGTTCCTGCTGTCCAGCTGAGTGCAGTAAA
Tri_car_MT GAGAACTGCAAATGTACCTCCTGCAAAAAAAGCTGCTGTTCCTGTTGCCCTGCCGGATGCGATAAA
Amb_mex_MT GAGAACTGCAAGTGCACATCCTGCAAAAAAAGTTGCTGTTCCTGCTGCCCATCGGAATGTGAGAAG
Gal_ga_MT4 AAGAACTGCCGCTGCCGGAGCTGCCGCAAGAGCTGCTGCTCCTGCTGCCCCGCCGGCTGCAACAAC
Gal_ga_MT3 AAAAACTGCAAATGCACATCGTGCAAAAAAGGCTGCTGCTCCTGCTGCCCTGCAGGATGTGCCAAG
* *** ** *** ** * ***** ***** ** ** * * ** **
Pel_esc_MT TGCAGCCAGGGCTGTGAATGTGCAAAGGGATGT---GATACCTGCAGTTGTTGCAAGTGA
Xen_lae_MT TGCAGCCAGGGCTGCCACTGTGAAAAGGGAAGC---AAGAAGTGCAGCTGCTGTAACTGA
Xen_tro_MT TGCAGCAAGGGCTGCCACTGTGAAAAGGAAAGC---AAGAAGTGCAGCTGCTGTAACTGA
Tri_car_MT TGTGGCCAGGGTTGTGTGTGCAAAGGAGGGTCGACTGAGAAATGCAGCTGTTGCACCTAA
Amb_mex_MT TGTGGCCAGGGATGTGTTTGCAAAGGAGGGTCATCCGAGAAATGCAGCTGTTGCAACTAA
Gal_ga_MT4 TGTGCCAAGGGCTGTGTCTGCAAGGAACCGGCCAGCAGCAAGTGCAGCTGCTGCCACTGA
Gal_ga_MT3 TGTGCACAGGGCTGCGTCTGCAAAGGGCCCCCCTCCGCCAAGTGCAGCTGCTGCAAGTGA
** **** ** ** * ****** ** ** * *
Figure 15 - Alignment performed on the CDS of amphibian and bird species used to design primers to isolate the MT
gene in E. calamita. The location of the designed primers is highlighted in grey. The corresponding species name and
Genbank accession number of the selected MT sequences are the following: “Pel_esc_MT” - Pelophylax esculentus,
HE681912 ; “Xen_lae_MT” - Xenopus laevis, X69380; “Xen_tro_MT” - Xenopus tropicalis, NM_001171679;
“Tri_car_MT” - Triturus carnifex, HE681911; Amb_mex_MT - Ambystoma mexicanum, AF008583; Gal_ga_MT4 and
Gal_ga_MT3 – Gallus gallus, NM_205275 and NM_001097538 respectively. Sequences accessed in Genbank at 19th
July, 2013.
For the gene isolation we used the sample 23G30H and 12G30H already
converted to cDNA. We selected the first sample among the ones exposed to 0.04 mg
L-1 to ensure that the metallothionein gene was expressed and therefore could be
isolated by PCR. 12G30H was selected for its high RNA amount so that can be easily
saved for posterior gene expression experiments which require a greater dilution of the
samples with high RNA concentration.
PCR amplification was carried out using 12.5 µl of Multiplex PCR Master Mix
(Qiagen®) and 0.5 µM of each designed degenerated primer for 35 ng of template
cDNA. PCR reaction was performed with an initial activation step of 95ºC followed by
40 cycles of 94ºC for 30 seconds (denaturation), a gradient between 50-60ºC
(temperature of annealing (Ta) tested were 53.2ºC and 56.8ºC) for 90 seconds
(annealing), and 72ºC for 90 seconds (extension). It was also implemented a final step
of 72ºC for 10min (final extension). Due to the unknown level of gene expression for
this gene, PCR reactions were also ran on a 1:10 dilution of the original cDNA following
the conditions written above. Finally, to obtain a cleaner PCR product (see Results and

FCUP Phylogeny and molecular biology in amphibian ecotoxicology
59
Discussion section in this chapter), PCR reactions were optimized after reducing 1x to
0.7x of Multiplex PCR Master Mix, decreasing each primer concentration from 0.5 µM
to 0.4 µM, and by running a PCR on the previously obtained PCRs. Hence, PCRs
described above were sequentially diluted to 1:10, 1:50, 1:100, and 1:1000 and 1 µL of
each was used as a template for further reactions, using three test annealing
temperatures, 51ºC, 54.6ºC, and 57ºC, 60 seconds instead of 90 seconds extension at
72 ºC and 35 PCR cycles. A negative control, consisting of the PCR mix without the
template, was always added to each PCR run.
Gel electrophoresis was performed with TBE buffer solution (5%) on an agarose
gel (2%). The ladder used to determine the base pair length of our amplified fragments
was NZYDNA Ladder V (Nzytech®).
Results and Discussion
Results for all RNA extractions are available with detailed description in Table 3.
Some of the samples showed RNA degradation most likely due to bad sample
collection or storage above -80ºC (Figure 16). Total RNA quantity varies among
samples, largely due to an improvement of the RNA extraction technique among
extracted batch of samples (J. Vierna, AllGenetics, pers. comm.). Good quality DNA
was obtained from 35 out of 50 samples (Table 5, see also Figure 16 for good quality
RNA example profile).
Figure 16 – Agilent profile obtained from two samples tests, one with degraded RNA (in the left, Endgen12) and the
other containing good RNA quality. A good RNA quality is indicated by two clear 18S and 28S peaks. Indication of no
degradation of large mRNA is represented with a 28S peak higher than 18S.
Degraded sample (e.g. Endgen12) Good quality RNA sample (e.g. 21G31H)
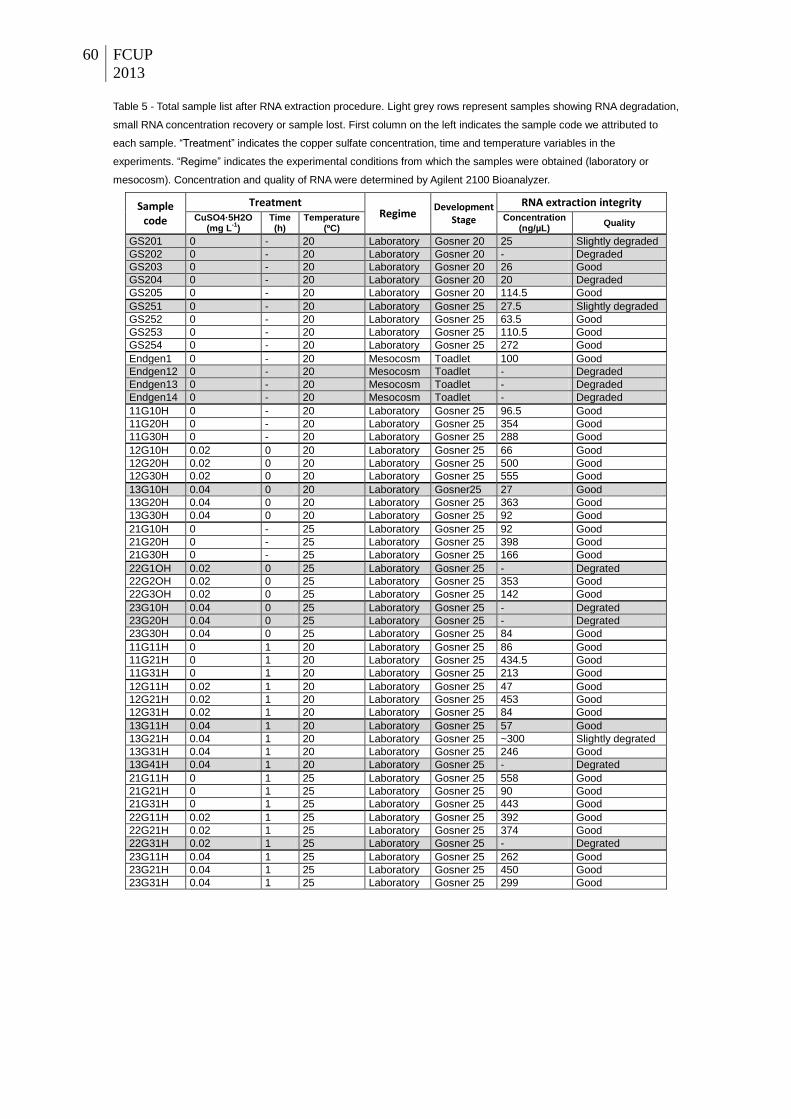
60 FCUP
2013
Table 5 - Total sample list after RNA extraction procedure. Light grey rows represent samples showing RNA degradation,
small RNA concentration recovery or sample lost. First column on the left indicates the sample code we attributed to
each sample. “Treatment” indicates the copper sulfate concentration, time and temperature variables in the
experiments. “Regime” indicates the experimental conditions from which the samples were obtained (laboratory or
mesocosm). Concentration and quality of RNA were determined by Agilent 2100 Bioanalyzer.
Sample code
Treatment Regime
Development
Stage
RNA extraction integrity CuSO4·5H2O
(mg L-1
) Time (h)
Temperature (ºC)
Concentration (ng/µL)
Quality
GS201 0 - 20 Laboratory Gosner 20 25 Slightly degraded
GS202 0 - 20 Laboratory Gosner 20 - Degraded
GS203 0 - 20 Laboratory Gosner 20 26 Good
GS204 0 - 20 Laboratory Gosner 20 20 Degraded
GS205 0 - 20 Laboratory Gosner 20 114.5 Good
GS251 0 - 20 Laboratory Gosner 25 27.5 Slightly degraded
GS252 0 - 20 Laboratory Gosner 25 63.5 Good
GS253 0 - 20 Laboratory Gosner 25 110.5 Good
GS254 0 - 20 Laboratory Gosner 25 272 Good
Endgen1 0 - 20 Mesocosm Toadlet 100 Good
Endgen12 0 - 20 Mesocosm Toadlet - Degraded
Endgen13 0 - 20 Mesocosm Toadlet - Degraded
Endgen14 0 - 20 Mesocosm Toadlet - Degraded
11G10H 0 - 20 Laboratory Gosner 25 96.5 Good
11G20H 0 - 20 Laboratory Gosner 25 354 Good
11G30H 0 - 20 Laboratory Gosner 25 288 Good
12G10H 0.02 0 20 Laboratory Gosner 25 66 Good
12G20H 0.02 0 20 Laboratory Gosner 25 500 Good
12G30H 0.02 0 20 Laboratory Gosner 25 555 Good
13G10H 0.04 0 20 Laboratory Gosner25 27 Good
13G20H 0.04 0 20 Laboratory Gosner 25 363 Good
13G30H 0.04 0 20 Laboratory Gosner 25 92 Good
21G10H 0 - 25 Laboratory Gosner 25 92 Good
21G20H 0 - 25 Laboratory Gosner 25 398 Good
21G30H 0 - 25 Laboratory Gosner 25 166 Good
22G1OH 0.02 0 25 Laboratory Gosner 25 - Degrated
22G2OH 0.02 0 25 Laboratory Gosner 25 353 Good
22G3OH 0.02 0 25 Laboratory Gosner 25 142 Good
23G10H 0.04 0 25 Laboratory Gosner 25 - Degrated
23G20H 0.04 0 25 Laboratory Gosner 25 - Degrated
23G30H 0.04 0 25 Laboratory Gosner 25 84 Good
11G11H 0 1 20 Laboratory Gosner 25 86 Good
11G21H 0 1 20 Laboratory Gosner 25 434.5 Good
11G31H 0 1 20 Laboratory Gosner 25 213 Good
12G11H 0.02 1 20 Laboratory Gosner 25 47 Good
12G21H 0.02 1 20 Laboratory Gosner 25 453 Good
12G31H 0.02 1 20 Laboratory Gosner 25 84 Good
13G11H 0.04 1 20 Laboratory Gosner 25 57 Good
13G21H 0.04 1 20 Laboratory Gosner 25 ~300 Slightly degrated
13G31H 0.04 1 20 Laboratory Gosner 25 246 Good
13G41H 0.04 1 20 Laboratory Gosner 25 - Degrated
21G11H 0 1 25 Laboratory Gosner 25 558 Good
21G21H 0 1 25 Laboratory Gosner 25 90 Good
21G31H 0 1 25 Laboratory Gosner 25 443 Good
22G11H 0.02 1 25 Laboratory Gosner 25 392 Good
22G21H 0.02 1 25 Laboratory Gosner 25 374 Good
22G31H 0.02 1 25 Laboratory Gosner 25 - Degrated
23G11H 0.04 1 25 Laboratory Gosner 25 262 Good
23G21H 0.04 1 25 Laboratory Gosner 25 450 Good
23G31H 0.04 1 25 Laboratory Gosner 25 299 Good

FCUP Phylogeny and molecular biology in amphibian ecotoxicology
61
PCRs resulted in a clear MT band only for reactions ran either with 1 µl of cDNA
or from previous PCRs (Figures 17 and 18). No clear band was obtained using a 1:10
cDNA dilution (Figure 19), however, PCR ran on these products produced an
amplification (Figure 18) indicating that, although not visible, all the PCRs we ran
amplified the required fragment. We selected one of the cleaner PCR products (see
Figure 18) to send it for sequencing to Macrogen®.
An extra RNA sample obtained under treatment of 0.02 mg L-1 of copper sulfate
(12G30H) was tested for MT amplification to look for MT expression from 2 µl of cDNA
to check if a MT band is still visible in the gel when the sample treatment applied
presented a lower contaminant concentration (a visible but faiding band was visible on
sample with 0.04 mg L-1 copper sulfate treatment, see Figure 17). The gel did not show
any bands (see Figure 24 in Chapter 4) possibly indicating lower MT mRNA amount on
samples retrieved from 0.02 mg L-1 but only further gene expression qRT-PCR tests
can confirm if MT gene is less expressed in this sample.
Figure 17 – Electrophoresis
gel run with 1 µl of cDNA from
sample 23G30H for MT
amplification. (Ta of 53.2 and
56.8ºC). A clear MT band is
shown for one of the
temperatures tested (56.8ºC).
Figure 18 – Electrophoresis gel run with PCR template
obtained from 1:10 cDNA dilution (Figure 19) and wiith PCR
template obtained with no dilution (Figure 18) with clear MT
band in all dilutions of PCR templates (1:10; 1:50; 1:100 and
1:1000). Ta used are 53.2 and 56.8 ºC. A clear MT band is
shown for all loaded wells with amplified cDNA. Arrow
indicates the band for which corresponding sample was
selected for sequencing.

62 FCUP
2013
Figure 19 – Electrophoresis gel run
with 1:10 dilution of cDNA from sample
23G30H for MT amplification,
highlighted (Ta of 53.2 and 56.8 ºC).
No MT bands appeared in the gel.

FCUP Phylogeny and molecular biology in amphibian ecotoxicology
63
4. Development and test of endogenous control
genes for qRT-PCR experiments in E. calamita
following treatment with copper sulfate and
temperature variation
Abstract
qRT-PCR is a revolutionary technique used for precise and rapid quantification
of gene expression. To benefit from qRT-PCR, and especially due to its highly sensitive
nature to cDNA detection, several control procedures must be carried out in parallel
with the main analysis to calibrate several sources of variation. The endogenous
control method relies on a selection of genes that do not change expression among
tissues and developmental stages and as a consequence of different treatments. The
use of these reference genes in qRT-PCR experiments permits to equalize uncontrolled
sources of variation. However, stability of the reference genes for the specific
experimental conditions needs to be tested. We started from a list of 28 genes to select
the reference genes for stability testing in our experimental setting among the ones
generally used as endogenous controls. In the end, six candidate reference genes
were selected for our experimental setting of copper sulfate exposure and temperature
variation in the Natterjack frog (Epidalea calamita). Newly designed primers were used
to isolate the six referenced genes in our target species. We successfully isolated from
cDNA five of the six genes: the Beta actin, 18S, Annexin A2, GAPDH, and Elongation
factor 1 alpha 1. This study enables future studies on gene expression using qRT-PCR
in the experimental conditions tested in E. calamita

64 FCUP
2013
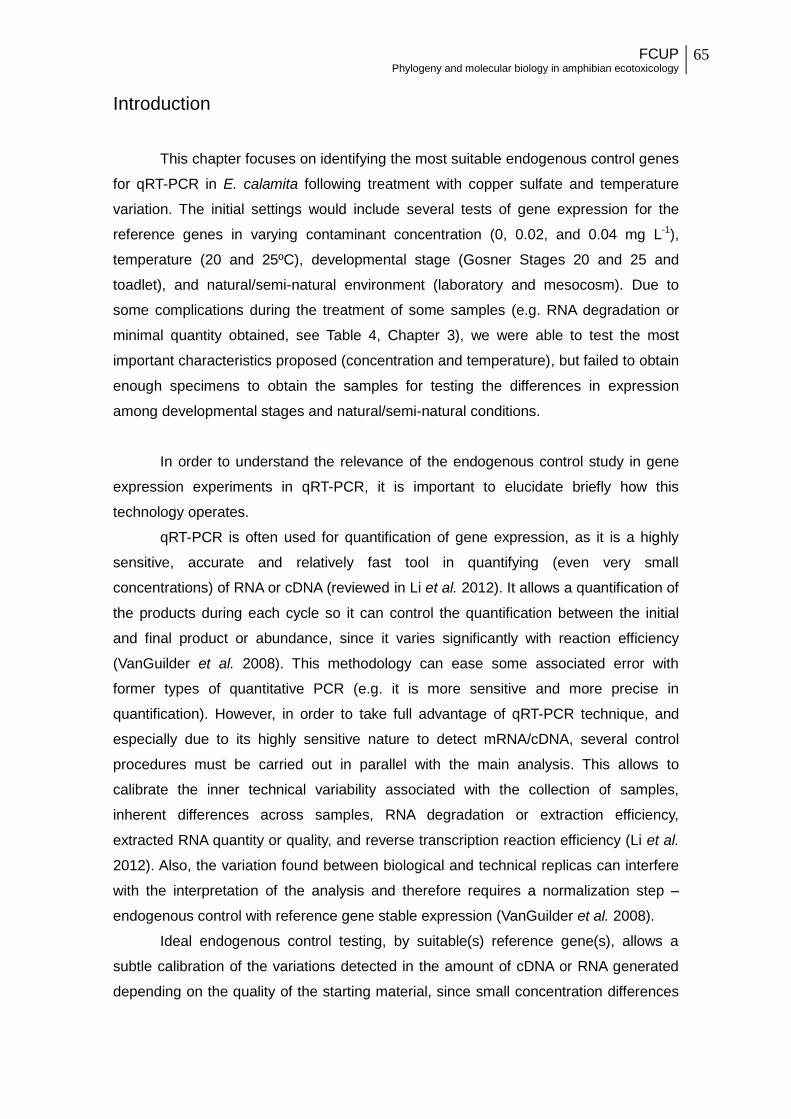
FCUP Phylogeny and molecular biology in amphibian ecotoxicology
65
Introduction
This chapter focuses on identifying the most suitable endogenous control genes
for qRT-PCR in E. calamita following treatment with copper sulfate and temperature
variation. The initial settings would include several tests of gene expression for the
reference genes in varying contaminant concentration (0, 0.02, and 0.04 mg L-1),
temperature (20 and 25ºC), developmental stage (Gosner Stages 20 and 25 and
toadlet), and natural/semi-natural environment (laboratory and mesocosm). Due to
some complications during the treatment of some samples (e.g. RNA degradation or
minimal quantity obtained, see Table 4, Chapter 3), we were able to test the most
important characteristics proposed (concentration and temperature), but failed to obtain
enough specimens to obtain the samples for testing the differences in expression
among developmental stages and natural/semi-natural conditions.
In order to understand the relevance of the endogenous control study in gene
expression experiments in qRT-PCR, it is important to elucidate briefly how this
technology operates.
qRT-PCR is often used for quantification of gene expression, as it is a highly
sensitive, accurate and relatively fast tool in quantifying (even very small
concentrations) of RNA or cDNA (reviewed in Li et al. 2012). It allows a quantification of
the products during each cycle so it can control the quantification between the initial
and final product or abundance, since it varies significantly with reaction efficiency
(VanGuilder et al. 2008). This methodology can ease some associated error with
former types of quantitative PCR (e.g. it is more sensitive and more precise in
quantification). However, in order to take full advantage of qRT-PCR technique, and
especially due to its highly sensitive nature to detect mRNA/cDNA, several control
procedures must be carried out in parallel with the main analysis. This allows to
calibrate the inner technical variability associated with the collection of samples,
inherent differences across samples, RNA degradation or extraction efficiency,
extracted RNA quantity or quality, and reverse transcription reaction efficiency (Li et al.
2012). Also, the variation found between biological and technical replicas can interfere
with the interpretation of the analysis and therefore requires a normalization step –
endogenous control with reference gene stable expression (VanGuilder et al. 2008).
Ideal endogenous control testing, by suitable(s) reference gene(s), allows a
subtle calibration of the variations detected in the amount of cDNA or RNA generated
depending on the quality of the starting material, since small concentration differences

66 FCUP
2013
in the starting material and in RNA or cDNA preparation will be amplified many levels,
and so the error associated with it (Radonić et al. 2004). The endogenous control
method must rely, therefore, on a selection of genes that have certain number of stable
characteristics and at the same time, go through the exact same conditions as the
target gene undergone experimentation. These genes (reference genes) should have a
high RNA transcription level in all cells and tissues and more importantly, its
transcription levels should remain stable under the different tested experimental
conditions (Li et al. 2012). Of course, in qRT-PCR, specific RNA quantification for a
target gene cannot be carried out before the experiment, so the same quantity and
quality of cDNA or RNA should be used for all the samples. This helps to already
reduce variability due to different cDNA/RNA quantity and quality among samples.
A great number of genes are used on endogenous control, and despite many
are demonstrated as suitable in some cases, they have also been shown to express
differently following different treatments, developmental stages, or experimental
condition (Chiari et al. 2010; Li et al. 2012). This highlights the need of previous testing
of the stability of the reference gene for specific experimental conditions before
carrying out qRT-PCR studies. For this reason, in this step our work is focused on
testing the stability of gene expression for some of the commonly used reference
genes available.
Materials and Methods
For the reference genes, sequences of amphibians (and when necessary from
other vertebrates) were obtained from Genbank and aligned in MEGA by the same
methodology adopted and explained in Chapter 3. Primers were designed when
unavailable for the studied species or closely related and genes were amplified from
cDNA on the same samples described in Chapter 3.
Primer design
A total of 28 genes have been sorted from commonly used reference genes for
qRT-PCR in vertebrates, and in amphibian in particular (e.g. Xenopus laevis, Sindelka
et al. 2006, Xenopus tropicalis, Dhorne-Poullet et al. 2013, Rattus sp., Rocha-Martins
et al. 2012, and Danio rerio, Casadei et al. 2011. We added also one house-keeping
gene to our 28 reference genes that has already known primer sequences for our
target species, defined in Harris et al. (2001).

FCUP Phylogeny and molecular biology in amphibian ecotoxicology
67
The vast majority (18 genes) was excluded immediately after browsing
Genbank database due to the little number of sequences available for these genes in
closely related species (Amphibia) and in the hierarchical taxonomic level above, using
the same search strategy as described in Chapter 3. These searches revealed that
these genes (partial and/or full sequence) had less than four amphibian
representatives, two of which belonging to the genus Xenopus, failing therefore any
chance of alignment (when the partial gene fragments were not overlapping) and
primer design for our species. The remaining genes were also further selected in the
alignment due to: 1) partial gene sequences that prevent a good base alignment across
all sequence (e.g. ornithine decarboxylase 1 gene); 2) high dissimilarity between
available sequences (e.g. ubiquitin and phosphoglycerate kinase); and 3) small
sequence length. Sequence length is an important factor to take into account when
working with qRT-PCR. In fact, different fragment length can differently amplify during
the qRT-PCR run (as in any PCR, shorter fragments amplify quicker than longer
fragments), therefore to avoid noise in the results due to differently longer gene
fragments, it is advisable to select primers that amplify similar fragment lengths.
Fragment amplification above 200bp was selected as a criterion to obtain fragments on
which to further design specific primers for qRT-PCR reactions amplifying similar gene
fragment across the reference genes and the metallothionein (see Future work
section). The remaining six reference genes showed good alignments and therefore
primers could be successfully designed. The selected genes were: 18S, Beta actin
(βActin), GAPDH, ribosomal protein L8 (rpL8), Annexin A2 (ANXA2) and eukaryotic
Elongation factor 1 alpha 1 (eef1a1). Sequences from closely related species used to
design these primers and their accession numbers are indicated in Supplementary File
7.
The primers were designed following the same methods explained in Chapter 3,
and the final sequences for gene PCR amplification are shown in Table 6.

68 FCUP
2013
Table 6 - Endogenous control selected primers sequences and characteristics. GC content represents the percentage of
guanines and cytosines in the sequence (40-60% GC content ensures stable binding of primer/template). “Bp” stands
for base pair and “Tm” represents the melting temperature of the primers.
Gene
acronym
Forward Primer
5’-3’ (F)
Reverse Primer
5’-3’ (R)
GC
content
(F/R) in %
Bp
lenght
(F/R)
Tm (F/R)
in ºC
18S AGCTCGTAGTTGGATCTTGG GTCGGAACTACGACGGTATC 45% / 55% 20 / 20 57.6 / 58.2
βActin AGCTATGA[A/G]CTGCCTGA[C/T]GGACA TTGCTGATCCACATCTGCTGGAA 52% / 48% 23 / 23 64.4* / 63.1
GAPDH CCAACATCAAATGGGGAGAT TTCACTGCAGCCTTGATGTC 45% / 50% 20 / 20 55.9 / 59.1
rpL8 GGCTCTGTTTT[C/T]A[A/G]AGCCCACGT CAGGATGGG[C/T]TT[A/G]TCAATACG 52% / 47% 23 / 21 64.3* / 57.2*
ANXA2 CCATTAA[A/G]AC[A/T]AAAGGTGTGGA TA[G/T]GGRCTGTAGCTCTTGTA 40% / 44% 22 / 20 56.0* / 56.4*
Eef1a1 ATGT[C/G]TACAA[A/G]ATTGG[A/G]GGTATTG AACTTGCAAGCAATGTGAGC 38% / 45% 24 / 20 58.3* / 58.4
* Mean Tm of degenerated primers (between the minor and maximum Tm of all primer combinations)
We found one house-keeping gene, 16S, with already available primers tested
on our species (Harris et al. 2001). We choose to not test this gene for its stable
expression since there is no reference in the literature on 16S suitability as reference
gene for endogenous control in vertebrates (only in bacteria, see for example Chang et
al. 2009).
Isolation of reference genes
All genes were isolated from the same samples used for MT isolation in Chapter
3. PCR amplification was carried out in the same conditions as in MT relatively to the
volume of reagents and concentrations for the PCR from cDNA and for the PCRs using
as template the previous PCR. The PCR cycle steps for PCR template amplification
varied only in gradient of the annealing step for each gene. Ta tested for each pair of
primers was: 18S (52 and 55.6ºC); β-Actin (55.6 and 60º); GAPDH (51, 52, 54.4, 55.1,
55.6; 58.2ºC); rpL8 (50, 53.2, 54.4, 55.6, 58ºC); ANXA2 (50, 50.8, 51, 52.9, 53.2, 54.4,
55.1, 55.6ºC); and eef1a1 (52, 54.2, 55.6, 57, 59ºC). If the band of the target gene was
not visible from PCR of cDNA, we diluted the PCR product in a proportion of 1:10, 1:50,
1:100 and 1:1000 and tested for other temperatures and other improved PCR
components concentrations, as in Chapter 3 (1x to 0.7x of PCR Master Mix and 0.5 µM
to 0.4 µM). When we performed a PCR on a previous PCR product with no visible band
of the target gene, we select the sample ran in middle temperature, or in case of only
two temperatures, the higher temperature to prevent unspecific amplification product.
In some PCRs we used 1 µl, 1.5 µl or 2 µl of the sample cDNA with 0.035 µg/µl
concentration.
Gene electrophoresis specifications and ladder were equal to the ones
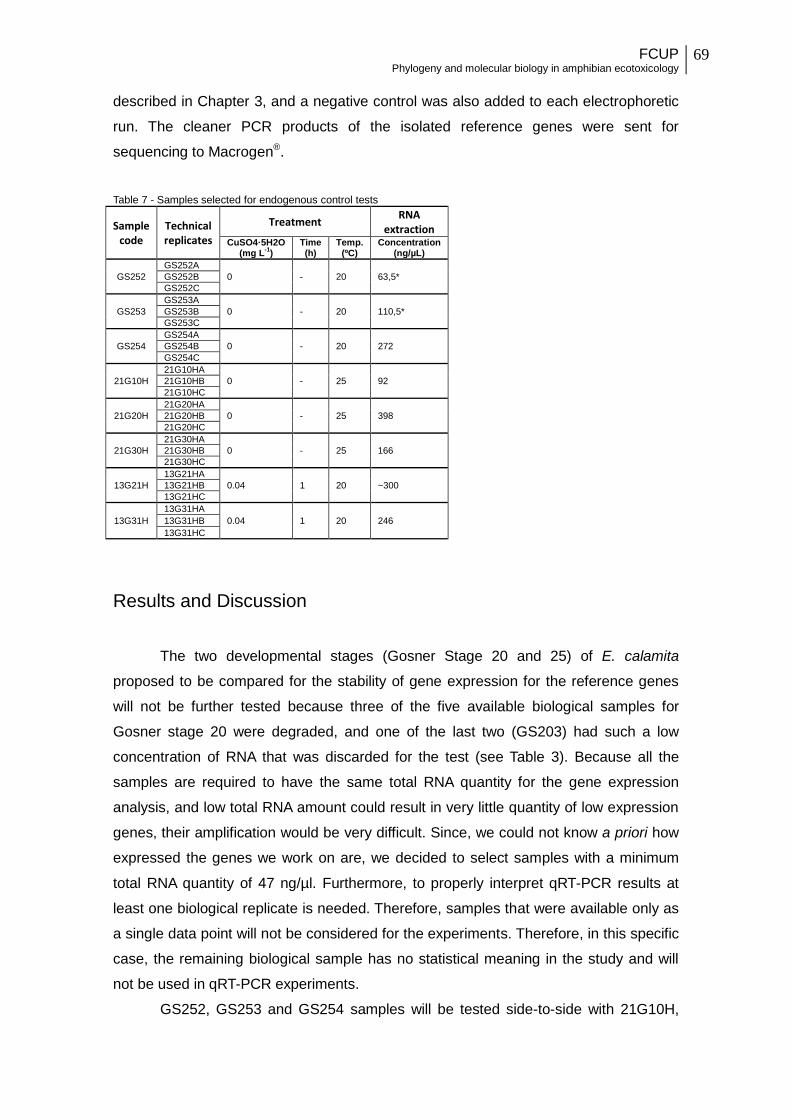
FCUP Phylogeny and molecular biology in amphibian ecotoxicology
69
described in Chapter 3, and a negative control was also added to each electrophoretic
run. The cleaner PCR products of the isolated reference genes were sent for
sequencing to Macrogen®.
Table 7 - Samples selected for endogenous control tests
Sample code
Technical replicates
Treatment RNA
extraction CuSO4·5H2O
(mg L-1
) Time (h)
Temp. (ºC)
Concentration (ng/µL)
GS252
GS252A
0 - 20 63,5* GS252B
GS252C
GS253
GS253A
0 - 20 110,5* GS253B
GS253C
GS254
GS254A
0 - 20 272 GS254B
GS254C
21G10H
21G10HA
0 - 25 92 21G10HB
21G10HC
21G20H
21G20HA
0 - 25 398 21G20HB
21G20HC
21G30H
21G30HA
0 - 25 166 21G30HB
21G30HC
13G21H
13G21HA
0.04 1 20 ~300 13G21HB
13G21HC
13G31H
13G31HA
0.04 1 20 246 13G31HB
13G31HC
Results and Discussion
The two developmental stages (Gosner Stage 20 and 25) of E. calamita
proposed to be compared for the stability of gene expression for the reference genes
will not be further tested because three of the five available biological samples for
Gosner stage 20 were degraded, and one of the last two (GS203) had such a low
concentration of RNA that was discarded for the test (see Table 3). Because all the
samples are required to have the same total RNA quantity for the gene expression
analysis, and low total RNA amount could result in very little quantity of low expression
genes, their amplification would be very difficult. Since, we could not know a priori how
expressed the genes we work on are, we decided to select samples with a minimum
total RNA quantity of 47 ng/µl. Furthermore, to properly interpret qRT-PCR results at
least one biological replicate is needed. Therefore, samples that were available only as
a single data point will not be considered for the experiments. Therefore, in this specific
case, the remaining biological sample has no statistical meaning in the study and will
not be used in qRT-PCR experiments.
GS252, GS253 and GS254 samples will be tested side-to-side with 21G10H,

70 FCUP
2013
21G20H and 21G30H to check for stability of reference gene expression under different
temperature regime (20 and 25ºC). 13G21H and 13G31H will be tested for gene
expression stability under treatment with copper sulfate. These are only two biological
replicates because one of the extracted samples was lost in the procedure and the
other exhibited RNA degradation.
From the six selected genes for endogenous control, five were successfully
isolated from cDNA: 18S and β-Actin (Figure 20), ANXA2 (Figure 21), GAPDH (Figure
22) and eef1a1 (Figure 23). PCR of PCR template containing all genes (Figure 20) with
dilutions from first gel and three different Ta, failed to amplify any of the remaining
target genes (results not shown). For that reason we changed the settings of the PCR
(number of cycles, extension time and PCR Master Mix components concentration as
described in the Methods of Chapter 3) and started a PCR for each gene from the
cDNA. ANXA2 was isolated without requiring a PCR of another PCR. The other
GAPDH and eef1a1 needed an extra PCR cycle to show visible band fluorescence
(see Figure 21 and 22 respectively). Rpl8 was not successfully isolated by any of these
methods.
A last gel was run directly on 2 µl of cDNA from the 21G30H sample to better
check GAPDH and MT gene identity in the gel (see Figure 24). MT band didn’t appear
in the gel (possibly related with the lower contaminant esposure in this sample, and
therefore weaker gene expression) and GAPDH showed a high band (see Figure 24)
which can represent another isoform of GAPDH gene, since this gene is known to
show alternative splicing and generating different mRNA transcripts, for example
GAPDH gene has 10 different transcripts in Homo sapiens and two for Xenopus
tropicalis (Ensembl database).
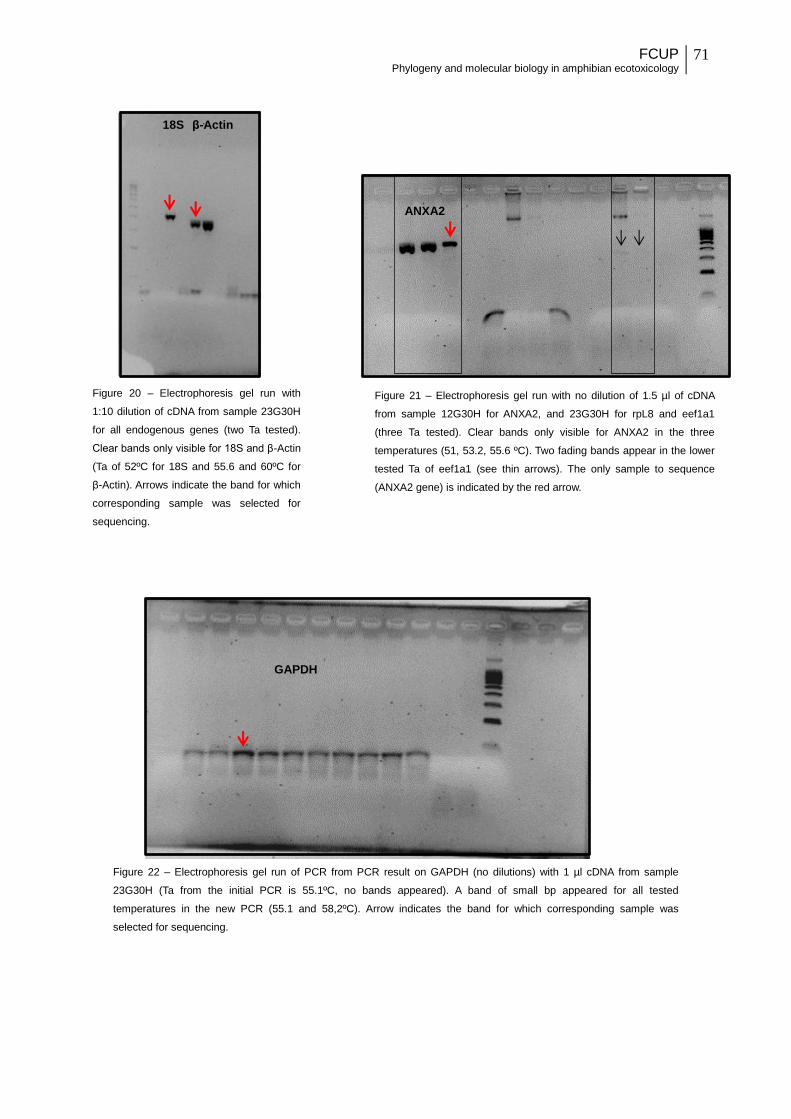
FCUP Phylogeny and molecular biology in amphibian ecotoxicology
71
Figure 22 – Electrophoresis gel run of PCR from PCR result on GAPDH (no dilutions) with 1 µl cDNA from sample
23G30H (Ta from the initial PCR is 55.1ºC, no bands appeared). A band of small bp appeared for all tested
temperatures in the new PCR (55.1 and 58,2ºC). Arrow indicates the band for which corresponding sample was
selected for sequencing.
Figure 20 – Electrophoresis gel run with
1:10 dilution of cDNA from sample 23G30H
for all endogenous genes (two Ta tested).
Clear bands only visible for 18S and β-Actin
(Ta of 52ºC for 18S and 55.6 and 60ºC for
β-Actin). Arrows indicate the band for which
corresponding sample was selected for
sequencing.
Figure 21 – Electrophoresis gel run with no dilution of 1.5 µl of cDNA
from sample 12G30H for ANXA2, and 23G30H for rpL8 and eef1a1
(three Ta tested). Clear bands only visible for ANXA2 in the three
temperatures (51, 53.2, 55.6 ºC). Two fading bands appear in the lower
tested Ta of eef1a1 (see thin arrows). The only sample to sequence
(ANXA2 gene) is indicated by the red arrow.
18S β-Actin
ANXA2
GAPDH
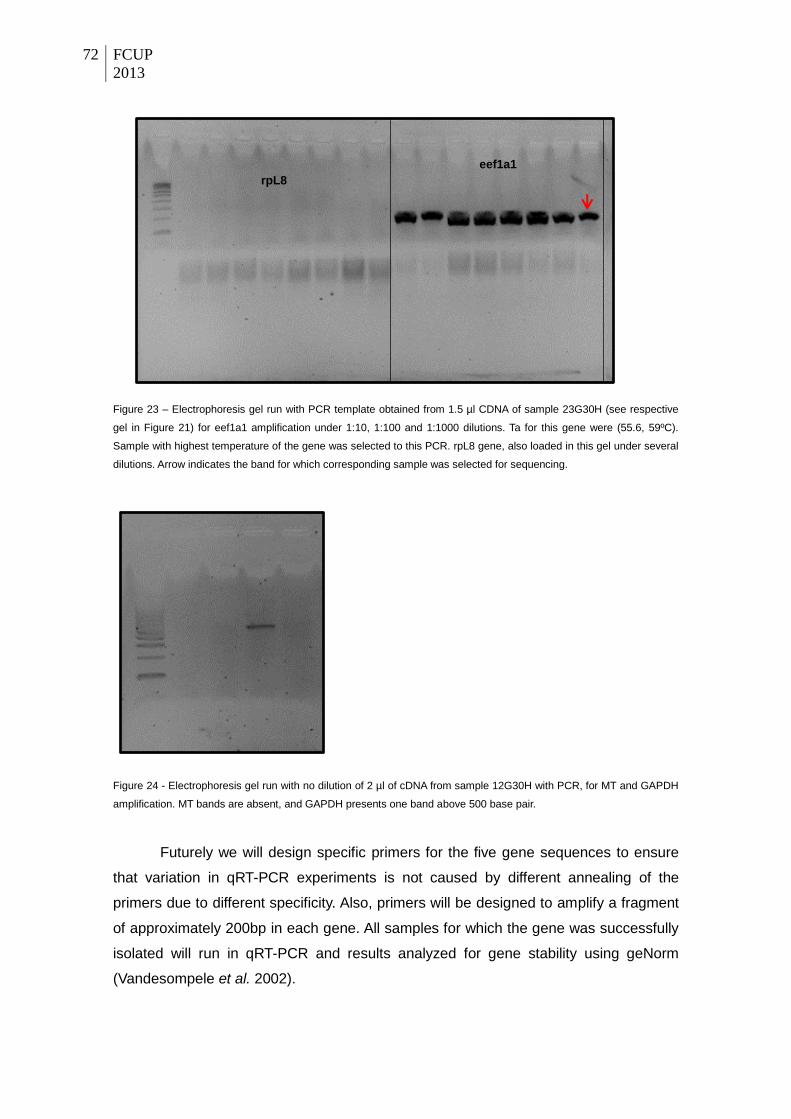
72 FCUP
2013
Figure 23 – Electrophoresis gel run with PCR template obtained from 1.5 µl CDNA of sample 23G30H (see respective
gel in Figure 21) for eef1a1 amplification under 1:10, 1:100 and 1:1000 dilutions. Ta for this gene were (55.6, 59ºC).
Sample with highest temperature of the gene was selected to this PCR. rpL8 gene, also loaded in this gel under several
dilutions. Arrow indicates the band for which corresponding sample was selected for sequencing.
Figure 24 - Electrophoresis gel run with no dilution of 2 µl of cDNA from sample 12G30H with PCR, for MT and GAPDH
amplification. MT bands are absent, and GAPDH presents one band above 500 base pair.
Futurely we will design specific primers for the five gene sequences to ensure
that variation in qRT-PCR experiments is not caused by different annealing of the
primers due to different specificity. Also, primers will be designed to amplify a fragment
of approximately 200bp in each gene. All samples for which the gene was successfully
isolated will run in qRT-PCR and results analyzed for gene stability using geNorm
(Vandesompele et al. 2002).
eef1a1 rpL8

FCUP Phylogeny and molecular biology in amphibian ecotoxicology
73
Future work developed from this study
Our work until date provided sufficient information and working material on a
non-model amphibian species (E. calamita), on which future works could be developed
to study the genetic response to heavy metal contamination (copper sulfate) and how
genetic variation can be correlated to different sensitivity to the contaminant and to
temperature variation.
Consequently, in the future we will continue our study on E. calamita to look at
metallothionein gene expression variation with the already available material (copper
sulfate treated tadpoles in laboratory and mesocosms, specific primers designed on
our species) by qRT-PCR. The lists of the available samples that have already been
extracted or are currently in the process of being extracted are indicated in Table 8 and
Table 9 (below). We will study also the samples of mesocosms (currently being
extracted) which we sampled in Aveiro, Portugal, from four mesocosms containers
installed near a natural lake of the University of Aveiro (divided by two controls, without
contaminant, and two with sublethal concentration of 0.04 mg L-1 of copper sulfate.
The type of quantification of genetic responses in the cells required for this qRT-
PCR consists in the primary mechanism through which organisms respond to
environmental changes (within or between populations). Being the first evidence of
effect on the individuals, this quantification and characterization of the genetic
response at individual/population level could provide monitoring and conservation tools
for key-populations possibly by identifying an occurring threat due to contamination
before any traceable morphological or behavioral effect of the contaminant could be
observed.
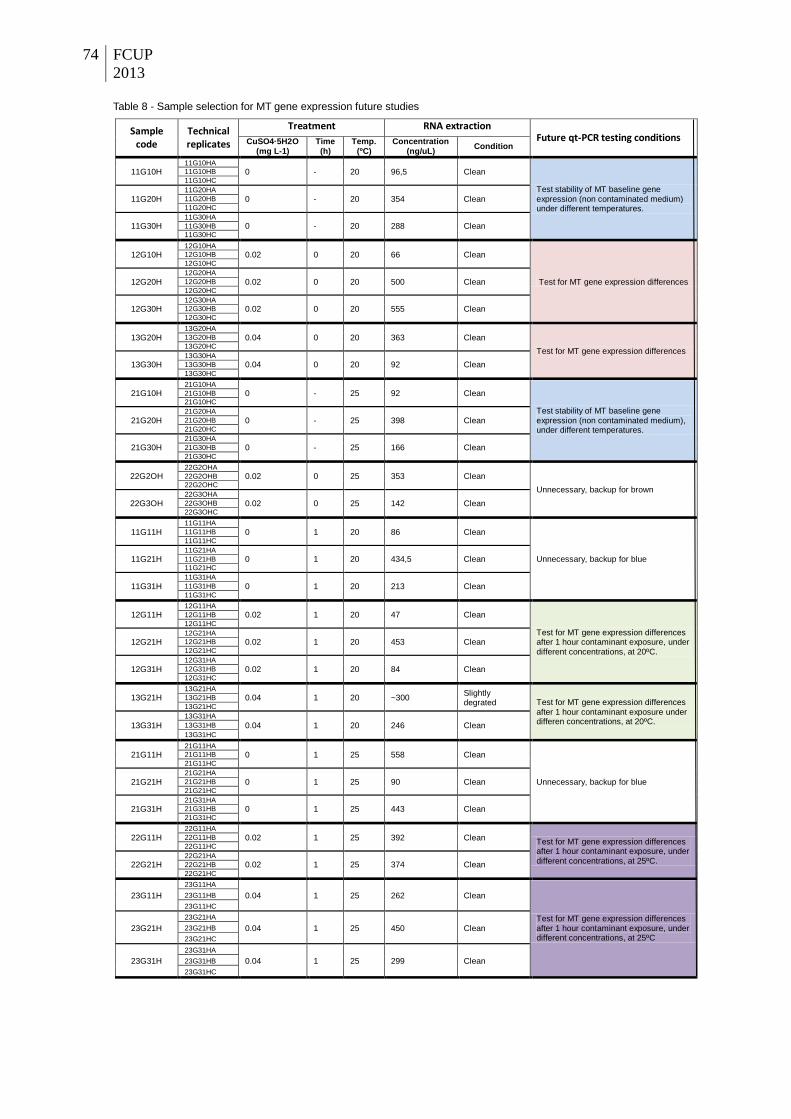
74 FCUP
2013
Table 8 - Sample selection for MT gene expression future studies
Sample code
Technical replicates
Treatment RNA extraction Future qt-PCR testing conditions CuSO4·5H2O
(mg L-1) Time (h)
Temp. (ºC)
Concentration (ng/uL)
Condition
11G10H 11G10HA
0 - 20 96,5 Clean
Test stability of MT baseline gene expression (non contaminated medium) under different temperatures.
11G10HB
11G10HC
11G20H 11G20HA
0 - 20 354 Clean 11G20HB
11G20HC
11G30H 11G30HA
0 - 20 288 Clean 11G30HB
11G30HC
12G10H 12G10HA
0.02 0 20 66 Clean
Test for MT gene expression differences
12G10HB
12G10HC
12G20H 12G20HA
0.02 0 20 500 Clean 12G20HB
12G20HC
12G30H 12G30HA
0.02 0 20 555 Clean 12G30HB
12G30HC
13G20H 13G20HA
0.04 0 20 363 Clean
Test for MT gene expression differences
13G20HB
13G20HC
13G30H 13G30HA
0.04 0 20 92 Clean 13G30HB
13G30HC
21G10H 21G10HA
0 - 25 92 Clean
Test stability of MT baseline gene expression (non contaminated medium), under different temperatures.
21G10HB
21G10HC
21G20H 21G20HA
0 - 25 398 Clean 21G20HB
21G20HC
21G30H 21G30HA
0 - 25 166 Clean 21G30HB
21G30HC
22G2OH 22G2OHA
0.02 0 25 353 Clean
Unnecessary, backup for brown
22G2OHB
22G2OHC
22G3OH 22G3OHA
0.02 0 25 142 Clean 22G3OHB
22G3OHC
11G11H 11G11HA
0 1 20 86 Clean
Unnecessary, backup for blue
11G11HB
11G11HC
11G21H 11G21HA
0 1 20 434,5 Clean 11G21HB
11G21HC
11G31H 11G31HA
0 1 20 213 Clean 11G31HB
11G31HC
12G11H 12G11HA
0.02 1 20 47 Clean
Test for MT gene expression differences after 1 hour contaminant exposure, under different concentrations, at 20ºC.
12G11HB
12G11HC
12G21H 12G21HA
0.02 1 20 453 Clean 12G21HB
12G21HC
12G31H 12G31HA
0.02 1 20 84 Clean 12G31HB
12G31HC
13G21H 13G21HA
0.04 1 20 ~300 Slightly degrated Test for MT gene expression differences
after 1 hour contaminant exposure under differen concentrations, at 20ºC.
13G21HB
13G21HC
13G31H 13G31HA
0.04 1 20 246 Clean 13G31HB
13G31HC
21G11H 21G11HA
0 1 25 558 Clean
Unnecessary, backup for blue
21G11HB
21G11HC
21G21H 21G21HA
0 1 25 90 Clean 21G21HB
21G21HC
21G31H 21G31HA
0 1 25 443 Clean 21G31HB
21G31HC
22G11H 22G11HA
0.02 1 25 392 Clean Test for MT gene expression differences after 1 hour contaminant exposure, under different concentrations, at 25ºC.
22G11HB
22G11HC
22G21H 22G21HA
0.02 1 25 374 Clean 22G21HB
22G21HC
23G11H
23G11HA
0.04 1 25 262 Clean
Test for MT gene expression differences after 1 hour contaminant exposure, under different concentrations, at 25ºC
23G11HB
23G11HC
23G21H
23G21HA
0.04 1 25 450 Clean 23G21HB
23G21HC
23G31H
23G31HA
0.04 1 25 299 Clean 23G31HB
23G31HC
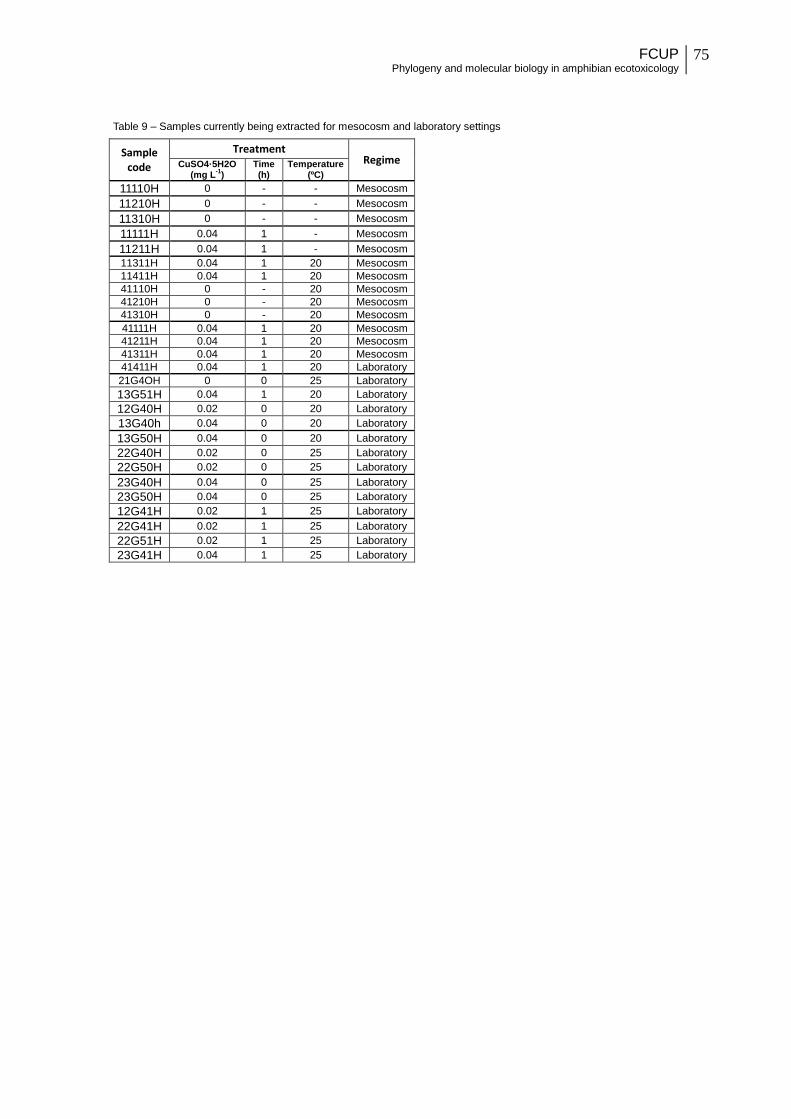
FCUP Phylogeny and molecular biology in amphibian ecotoxicology
75
Table 9 – Samples currently being extracted for mesocosm and laboratory settings
Sample code
Treatment Regime CuSO4·5H2O
(mg L-1
) Time (h)
Temperature (ºC)
11110H 0 - - Mesocosm
11210H 0 - - Mesocosm
11310H 0 - - Mesocosm
11111H 0.04 1 - Mesocosm
11211H 0.04 1 - Mesocosm
11311H 0.04 1 20 Mesocosm
11411H 0.04 1 20 Mesocosm
41110H 0 - 20 Mesocosm
41210H 0 - 20 Mesocosm
41310H 0 - 20 Mesocosm
41111H 0.04 1 20 Mesocosm
41211H 0.04 1 20 Mesocosm
41311H 0.04 1 20 Mesocosm
41411H 0.04 1 20 Laboratory
21G4OH 0 0 25 Laboratory
13G51H 0.04 1 20 Laboratory
12G40H 0.02 0 20 Laboratory
13G40h 0.04 0 20 Laboratory
13G50H 0.04 0 20 Laboratory
22G40H 0.02 0 25 Laboratory
22G50H 0.02 0 25 Laboratory
23G40H 0.04 0 25 Laboratory
23G50H 0.04 0 25 Laboratory
12G41H 0.02 1 25 Laboratory
22G41H 0.02 1 25 Laboratory
22G51H 0.02 1 25 Laboratory
23G41H 0.04 1 25 Laboratory

76 FCUP
2013
FCUP Phylogeny and molecular biology in amphibian ecotoxicology
77
General conclusions
I believe the work I developed in this study helped increase the understanding
on how two different fields, phylogenetics and ecotoxicology, can be used together to
help identify major problems in amphibian conservation. There is already a vast body of
knowledge in the field of amphibian ecotoxicology due to extensive research on the
causes of rapid amphibian decline, even if some of the conclusions can still be subject
to debate due to the innumerous and complex problems inherent to each case/species
studied, as well as the conditions tested. On the other hand, we are continuously
discovering new tools that could address or predict important genetic features of a wide
array of taxa, by looking and comparing available genomes (which are continuously
increasing in number) to study key-gene family evolution and analyze functional
divergence important to further understand the role of distinct protein functions, which
had different evolutionary paths across taxa.
I additionally reinforced this connection by demonstrating how important is the
influence of phylogenetic relationships in risk assessment studies, by testing for the
weight of this influence in the parameters experienced, which were sensitivity to a toxic
(measured by LC50) and temperature.
By addressing this important relationship between these two fields of expertise
within the context of metal contamination and sensitivity of amphibians, I believe I was
able to develop important tools which are still not used or developed to their full
capacity in most studies to assess and research very serious conservation issues in
the world.
For the final chapters the initial steps of a major gene expression study were
developed, aimed at showing the importance of gathering information on gene
expression in ecotoxicology and risk assessment, using the non-model amphibian
species Epidalea calamita. I describe the experimental design, sample collection, RNA
extraction, cDNA retro-transcription, target gene isolation and endogenous control gene
isolation necessary for further work with qRT-PCR. Future results may show the
importance of the organismal genetic response to a contaminant, thus providing
traceable contamination responses even before visible sub-lethal effects arise, very
important to monitor key-populations.

78 FCUP
2013

FCUP Phylogeny and molecular biology in amphibian ecotoxicology
79
References
Andreani G, Santoro M, Cottignoli S, Fabbri M, Carpenè E, Isani G (2007) Metal
distribution and metallothionein in loggerhead (Caretta caretta) and green
(Chelonia mydas) sea turtles. Sci Total Environmen 390:287-294.
Awkerman JA, Raimondo S, Barron MG (2008) Development of species sensitivity
distribution for wildlife using interspecies toxicity correlation models. Environ.
Sci. Technol. 42, 3447 – 3452.
Bargelloni L, Scudiero R, Parisi E, Carginale V, Capasso C, Patarnello T (1999)
Metallothioneins in antarctic fish: evidence for independent duplication and gene
conversion. Mol Biol Evol 16:885-97.
Barnosky AD, Matzke N, Tomiya S, Wogan GO, Swartz B, Quental TB, Marshall C,
McGuire JL, Lindsey EL, Maguire KC, Mersey B, & Ferrer EA (2011). Has the
Earth’s sixth mass extinction already arrived? Nature, 471:51-7.
Beebee TJC, Griffiths RA (2005) The amphibian decline crisis: a watershed for
conservation biology? Biol Conserv 125:271–85.
Beja P, Kuzmin S, Beebee T, Denoël M, Schmidt B, Tarkhnishvili D, Ananjeva N,
Orlov N, Nyström P, Ogrodowczyk A, et al. (2009) Epidalea calamita. In: IUCN
2013. IUCN Red List of Threatened Species. Version 2013.1.
<www.iucnredlist.org>. Downloaded on 15 September 2013.
Binz P-A, Kägi JHR (1999) Classification of metallothionein.
http://www.bioc.uzh.ch/mtpage/classif.html. Accessed 6 February 2013
Blaustein AR, Han BA, Relyea RA, Johnson PT, Buck JC, Gervasi SS, Kats LB (2011).
The complexity of amphibian population declines: understanding the role of
cofactors in driving amphibian losses. Ann NY Acad Sci 1223:108-19.
Blaustein AR, Kiesecker JM (2002) Complexity in conservation: lessons from the
global decline of amphibian populations. Ecol Lett 5:597-608.
Blaustein AR, Walls SC, Bancroft BA, Lawler JJ, Searle CL, Gervasi SS (2010) Direct
and indirect effects of climate change on amphibian populations. Diversity 2:281-
313.
Blindauer CA, Leszczyszyn OI (2010) Metallothioneins: unparalleled diversity in
structures and functions for metal ion homeostasis and more. Nat Prod Rep 27:720-
41.
Boone MD, Bridges CM (1999) The effect of temperature on the potency of carbaryl for
survival of tadpoles of the green frog (Rana clamitans). Environ Toxi Chem
18:1482-4.
80 FCUP
2013
Botkin DB, Saxe H, Araújo MB, Betts R, Bradshaw RW, Cedhagen T, Chesson P, et al
(2007) Forecasting the effects of global warming on biodiversity. BioScience
57:227-36
Braun W, Vašák M, Robbins AH, Stout CD, Wagner G, Kägi JHR, Wüthrich K (1992)
Comparison of the NMR solution structure and the x-ray crystal structure of rat
metallothionein-2. Proc Natl Acad Sci USA 89:10124-10128
Bridges CM (1997). Tadpole swimming performance and activity affected by acute
exposure to sublethal levels of carbaryl. Environ Toxicol Chem, 16:1935-39.
Bridges CM, Dwyer FJ, Hardesty DK, and Whites DW (2002). Comparative
contaminant toxicity: are amphibian larvae more sensitive than fish? B Environ
Contam Tox 69:562-569.
Brown CJ, Todd KM, Rosenzweig RF (1998) Multiple duplications of yeast hexose
transport genes in response to selection in a glucose-limited environment. Mol Biol
Evol 15:931-42
Brunet FG, Crollius HR, Paris M, Aury JM, Gilbert P, Jaillon O, Laudet V, Robinson-
Rechavi M (2006) Gene loss and evolutionary rates following whole-genome
duplication in teleost fishes. Mol Biol Evol 23:1808-16.
Capasso C, Carginale V, Crescenzi O, Di Maro D, Spadaccini R, Temussi PA, Parisi E
(2005) Structural and functional studies of vertebrate metallothioneins: cross-talk
between domains in the absence of physical contact. Biochem J 391:95-103.
Capasso C, Carginale V, Scudiero R, Crescenzi O, Spadaccini R, Temussi PA, Parisi E
(2003) Phylogenetic divergence of fish and mammalian metallothionein:
relationships with structural diversification and organismal temperature. J Mol
Evol 57:S250-7.
Capdevila M, Atrian S (2011) Metallothionein protein evolution: a miniassay. J Biol
Inorg Chem 16:977-89. doi: 10.1007/s00775-011-0798-3.
Capellini I, Venditti C, Barton RA (2010) Phylogeny and metabolic scaling in
mammals. Ecology 91:2783-2793.
Capkin E, Altinok I, Karahan S (2006) Water quality and fish size affect toxicity of
endosulfan, an organochlorine pesticide, to rainbow trout. Chemosphere 64:1793-
1800.
Carew ME, Adam DM, Ary AH (2011) Phylogenetic signals and ecotoxicological
responses: potential implications for aquatic biomonitoring. Ecotoxicology 20:595-
606.
Carpenè E, Andreani G, Isani G (2007) Metallothionein functions and structural
characteristics. J Trace Elem Med Biol 21:35-9.
FCUP Phylogeny and molecular biology in amphibian ecotoxicology
81
Ceratto N, Dondero F, Loo J.-WVD, Burlando B, Viarengo A (2002) Cloning and
sequencing of a novel metallothionein gene in Mytilus. Comp Biochem Physiol
31:217-22.
Chang Q, Amemiya T, Liu J, Xu X, Rajendran N, Itoh K. (2009) Identification and
validation of suitable reference genes for quantitative expression of xylA and xylE
genes in Pseudomonas putida mt-2. J Biosci Bioeng 107 210-4.
Chang D, Duda TF (2012) Extensive and continuous duplication facilitates rapid
evolution and diversification of gene families. Mol Biol Evol 29:2019-29.
Chen K, Durand D, Farach-Colton M (2000) NOTUNG: a program for dating gene
duplications and optimizing gene family trees. J Comput Biol 7:429-47.
Chernaik ML, Huang PC (1991) Differential effect of cysteine-to-serine substitutions in
metallothionein on cadmium resistance. Proc Natl Acad Sci USA 88:3024-8.
Chiari Y, Dion K, Colborn J, Parmakelis A, Powell JR (2010). On the possible role of
tRNA base modifications in the evolution of codon usage: queuosine and
Drosophila. J Mol Evol 70:339-345.
Chiari Y, Cahais V, Galtier N, Delsuc F (2012) Phylogenomic analyses support the
position of turtles as the sister group of birds and crocodiles (Archosauria). BMC
Biol 10:65.
Collins JP, Storfer A (2003) Global amphibian declines: sorting the hypotheses. Divers
Distrib 9:89-98.
Colón-Gaud, Whiles MR, Kilham SS, Lips KR, Pringle CM, Connelly S, Peterson SD
(2009) Assessing ecological responses to catastrophic amphibian declines: patterns
of macroinvertebrate production and food web structure in upland Panamanian
streams. Limnol and Oceanogr 54:331.
Coutellec MA, Barata C (2011) An introduction to evolutionary processes in
ecotoxicology. Ecotoxicology 20:493-6.
Darriba D, Taboada GL, Doallo R, Posada D (2011) ProtTest 3: fast selection of best-fit
models of protein evolution. Bioinformatics 27:1164-5.
Darriba D, Taboada GL, Doallo R, Posada D (2012) jModelTest 2: more models, new
heuristics and parallel computing. Nat Methods 9:772.
Davis SR, Cousins RJ (2000) Recent advances in nutritional sciences metallothionein
expression in animals: a physiological perspective on function. J Nutr 1:1085-
1088.
Demuth JP, De Bie T, Stajich JE, Cristianini N, Hahn MW (2006) The evolution of
mammalian gene families. PLoS ONE 1(1):e85.

82 FCUP
2013
Dhorne‐Pollet S, Thélie A, Pollet N (2013) Validation of novel reference genes for RT‐qPCR studies of gene expression in Xenopus tropicalis during embryonic and post‐embryonic development. Dev Dyn 242:709-717.
Doyon J-P, Ranwez V, Daubin V, Berry V (2011) Models, algorithms and programs for
phylogeny reconciliation. Brief Bioinf 12:392-400. doi: 10.1093/bib/bbr045
Durand D, Halldórsson BV, Vernot B (2006) A hybrid micro-macroevolutionary
approach to gene tree reconstruction. J Comput Biol 13:320-35.
Dwyer FJ, Hardesty DK, Henke CE, Ingersoll CG, Whites DW, Mount DR, Bridges
CM (1999) Assessing contaminant sensitivity of endangered and threatened
species: Toxicant Classes. EPA 600/R-99/098, U.S.EPA, Washington, D.C., 15 p.
Dwyer FJ, Mayer FL, Sappington LC, Buckler DR, Bridges CM, Greer IE, Hardesty
DK, Henke CE, Ingers CG (2005) Assessing contaminant sensitivity of endangered
and threatened aquatic species: Part I. Acute toxicity of five chemicals, Arch
Environ Con Tox, 48:143-54.
Ecotox database http://cfpub.epa.gov/ecotox/
Ensembl Database: www.ensembl.org. Last accessed in May 2013.
ESFA Journal (2013) DRAFT Guidance Document on tiered risk assessment for plant
protection products for aquatic organisms in edge-of-field surface waters. EFSA
Panel on Plant Protection Products and their Residues (PPR). Pag. 169
http://www.efsa.europa.eu/en/consultationsclosed/call/121214.pdf
Faller P, Hasler DW, Zerbe O, Klauser S, Winge DR, Vašák M (1999) Evidence for a
dynamic structure of human neuronal growth inhibitory factor and for major
rearrangements of its metal-thiolate clusters. Biochemistry 38:10158-67.
Fedorenkova A, Vonk JA, Lenders HR, Ouborg NJ, Breure AM, Hendriks AJ (2010)
Ecotoxicogenomics: Bridging the gap between genes and populations. Environ Sci
Technol, 44:4328-33.
Flicek P, Amode MR, Barrell D, Beal K, Brent S, Chen Y, Claphan P, Coates G, Fairley
S, Fitzgerald S, Gordon L et al (2011) Ensembl 2011. Nucleic Acids Res 39:D800-
6.
Force A, Lynch M, Pickett FB, Amores A, Yan YL Postlethwait J (1999) Preservation
of duplicate genes by complementary, degenerative mutations. Genetics 151:1531-
45.
Fowler BA, Hildebrand CE, Kojima Y, Webb M (1987) Nomenclature of
metallothionein. Exp Supp 52:19-22.
Freckleton RP, Harvey PH, Pagel M (2002) Phylogenetic analysis and comparative
data: a test and review of evidence. Am Nat 160:712–726.

FCUP Phylogeny and molecular biology in amphibian ecotoxicology
83
Fryday S, Thompson H (2012) Toxicity of pesticides to aquatic and terrestrial life stages
of amphibians and occurrence, habitat use and exposure of amphibian species in
agricultural environments. Food Environment Research Agency, Sand Hutton,
York, UK 348p.
García-Muñoz E, Guerrero F, Bicho RC, Parra G (2011)a Effects of ammonium nitrate
on larval survival and growth of four iberian amphibians. B Environ Contam Toxic
87:16-20.
García-Muñoz E, Guerrero F, Parra G (2011)b Larval escape behavior in anuran
amphibians as a wetland rapid pollution biomarker. Mar Freshw Behav Phy
44:109-23.
García-Muñoz E, Guerrero F, Parra G (2009) Effects of copper sulfate on growth,
development, and escape behavior in Epidalea calamita embryos and larvae. Arch
Environ Con Tox, 56:557-65.
García-Muñoz E, Guerrero F, Parra G (2010) Intraspecific and interspecific tolerance to
copper sulphate in five Iberian amphibian species at two developmental stages.
Arch Environ Con Tox 59:312-21.
Garrett SH, Somji S, Todd JH, Sens MA, Sens DA (1998) Differential expression of
human metallothionein isoform I mRNA in human proximal tubule cells exposed
to metals. Environ Health Perspect 106:825-31.
Genbank: http://www.ncbi.nlm.nih.gov/genbank/
George S, Gubbins M, MacIntosh A, Reynolds W, Sabine V, Scott A, Thain J (2004) A
comparison of pollutant biomarker responses with transcriptional responses in
European flounders (Platicthys flesus) subjected to estuarine pollution. Mar
Environ Res 58:571-5.
Gravy Calculator: www.gravy-calculator.de. Last accessed in May 2013.
Gu X, Vander Velden K (2002) DIVERGE: phylogeny-based analysis for functional-
structural divergence of a protein family. Bioinformatics 18, 500-1.
Gu X (1999) Statistical methods for testing functional divergence after gene duplication.
Mol Biol Evol 16:1664-74
Gu X (2001) Maximum-likelihood approach for gene family evolution under functional
divergence. Mol Biol Evol 18, 453-64
Gu X (2006) A simple statistical method for estimating type-II (cluster-specific)
functional divergence of protein sequences. Mol Biol Evol 23:1937-45.
Guindon S, Dufayard J-F, Lefort V, Anisimova M, Hordijk W, Gascuel O (2010) New
algorithms and methods to estimate maximum-likelihood phylogenies: assessing
the performance of PhyML 3.0. Syst Biol 59:307-21.
84 FCUP
2013
Guindon S, Gascuel O (2003) A simple, fast, and accurate algorithm to estimate large
phylogenies by Maximum Likelihood. Syst Biol 52:696-704.
Guirola M, Pérez-Rafael S, Capdevila M, Palacios O, Atrian S (2012) Metal dealing at
the origin of the Chordata phylum: the metallothionein system and metal overload
response in Amphioxus. PLoS ONE 7(8): e43299.
Gürkan M, Hayretdağ S (2012) Morphological and histological effects of copper sulfate
on the larval development of green toad, Bufo viridis. Turk J Zool 36:231-40
Hayes TB, Case P, Chui S, Chung D, Haeffele C, Haston K, et al. (2006). Pesticide
mixtures, endocrine disruption, and amphibian declines: are we underestimating
the impact?. Environ Health Persp 114(S-1),40.
Helbing CC (2012) The metamorphosis of amphibian toxicogenomics. Front Genet
3:37.
Hecker M, Park JW, Murphy MB, Jones PD, Solomon KR, Van Der Kraak G, et al.
(2005) Effects of atrazine on CYP19 gene expression and aromatase activity in
testes and on plasma sex steroid concentrations of male African clawed frogs
(Xenopus laevis). Toxicol Sci 86:273-280.
Herkovits J, Helguero AL (1998) Copper toxicity and copper–zinc interactions in
amphibian embryos. Sci Total Environ 221:1-10.
Hahn Y, Lee B (2006) Human-specific nonsense mutations identified by genome
sequence comparisons. Hum Genet 119:169-78.
Hammond JI, Jones DK, Stephens PR, Relyea RA (2012) Phylogeny meets
ecotoxicology: evolutionary patterns of sensitivity to a common insecticide. Evol
App 593-606.
Harris DJ (2001) Reevaluation of 16S Ribosomal RNA Variation in Bufo (Anura:
Amphibia). Mol Phyl Evol 19:326-9.
Hasler DW, Jensen LT, Zerbe O, Winge DR, Vašák M (2000) Effect of the two
conserved prolines of human growth inhibitory factor (metallothionein-3) on its
biological activity and structure fluctuation: comparison with a mutant protein.
Biochemistry 39:14567-75.
Hidalgo J, Chung R, Penkowa M, Vašák M (2009) Structure and function of vertebrate
metallothioneins Met Ions Life Sci 5:279-317.
Hopkins WA (2007) Amphibians as models for studying environmental change. Ilar
Journal 48: 270-277.
Howe K, Clark MD, Torroja CF, Torrance J, Berthelot C, Muffatto M, Collins JE,
Humphray S, McLaren K, Matthews L et al. (2013) The zebrafish reference
genome sequence and its relationship to the human genome. Nature 496:498-503.

FCUP Phylogeny and molecular biology in amphibian ecotoxicology
85
Hua J, Morehouse NI, Relyea R (2013) Pesticide tolerance in amphibians: induced
tolerance in susceptible populations, constitutive tolerance in tolerant populations.
Evol. Applications, in press
Huelsenbeck JP, Ronquist F (2001) MRBAYES: Bayesian inference of phylogenetic
trees. Bioinformatics 17:754-5.
Jaillon O, Aury J-M, Brunet F, Petit J-L, Stange-Thomann N, Mauceli E, Bouneau L,
Fisher C, Ozouf-Costaz C, Bernot A et al (2004) Genome duplication in the teleost
fish Tetraodon nigroviridis reveals the early vertebrate proto-karyotype. Nature
431:946-57.
Jiang LJ, Vašák M, Vallee BL, Maret, W (2000) Zinc transfer potentials of the α- and β-
clusters of metallothionein are affected by domain interactions in the whole
molecule. Proc Natl Acad Sci USA 97:2503-08.
Junqueira-de-Azevedo IDLM, Ho PL (2002) A survey of gene expression and diversity
in the venom glands of the pitviper snake Bothrops insularis through the
generation of expressed1 sequence tags (ESTs). Gene 299:279-91.
Kent WJ (2002) BLAT — The BLAST-Like Alignment Tool. Genome Res 12:656-664.
Kille P, Small G, Snape J, Pickford D, Spurgeon D, Tyler CR (2003) Environmental
genomics - an introduction. The Environment Agency, Bristol.UK, 99p.
Khangarot BS, Mathur S, Durve VS (1981). Studies on the acute toxicity of copper on
selected freshwater organisms, Sci Cult 47:429-431.
Khangarot BS, Sehgal A and Bhasin MK (1985) “Man and Biosphere” - Studies on the
Sikkim Himalayas. Part 5: Acute toxicity of selected heavy metals on the tadpoles
of Rana hexadactyla, Acta Hydrochimica Et Hydrobiologica, 13: 259-263.
Khangarot BS, Ray PK (1987). Sensitivity of toad tadpoles, Bufo melanostictus
(Schneider), to heavy metals. B Environ Contam Tox 38:523-7.
Kim M, Park K, Park JY, Kwak I-S (2013) Heavy metal contamination and
metallothionein mRNA in blood and feathers of Black-tailed gulls (Larus
crassirostris) from South Korea. Environ Monit Assess 185:2221-30.
Kondrashov FA, Kondrashov AS (2006) Role of selection in fixation of gene
duplications. J Theor Biol 239:141-51.
Kondrashov FA, Rogozin IB, Wolf YI, Koonin EV (2002) Selection in the evolution of
gene duplications. Genome Biol 3:1-0008.
Kondrashov FA (2012) Gene duplication as a mechanism of genomic adaptation to a
changing environment. Proc R Soc 279:5048-57.
Koonin EV (2009) Darwinian evolution in the light of genomics. Nucleic Acids Res
37:1011-34.
86 FCUP
2013
Kyte J, Doolittle RF (1982) A simple method for displaying the hydropathic character
of a protein. J Mol Biol 157:105-32.
Kägi JH, Vašák M, Lerch K, Gilg DE, Hunziker P, Bernhard WR, Good M (1984)
Structure of mammalian metallothionein. Environ Health Perspect 54:93-103.
Lam, KL, Wong JK-yee, Ghan KM (1998) Metal toxicity and metallothionein gene
expression studies in common carp and tilapia. Mar Environ Res 46:563-6
Lenormand T, Guillemaud T, Bourguet D, Raymond M (1998) Appearance and sweep
of a gene duplication: adaptive response and potential for new functions in the
mosquito Culex pipiens. Evolution 52:1705-1712.
LeBlanc GA, Bain LJ (1997) Chronic toxicity of environmental contaminants: sentinels
and biomarkers Environ Health Persp 105:65
Li C, Ortí G, Zhang G, Lu G (2007) A practical approach to phylogenomics: the
phylogeny of ray-finned fish (Actinopterygii) as a case study. BMC Evol Biol
7:44.
Li Q, Skinner J, Bennett, J (2012) Evaluation of reference genes for real-time
quantitative PCR studies in Candida glabrata following azole treatment. BMC
Mol Biol 13:22.
Li W, Luo C, Wu C (1985) A new method for estimating synonymous and
nonsynonymous rates of nucleotide substitution considering the relative likelihood
of nucleotide and codon changes. Mol Biol Evol 2:150-174.
Lichtarge O, Bourne HR, Cohen FE (1996) An evolutionary trace method defines
binding surfaces common to protein families. J Mol Biol 257:342-58.
Linde AR, Sánchez-Galán S, Vallés-Mota P, García-Vázquez E (2001) Metallothionein
as bioindicator of freshwater metal pollution: European eel and brown trout.
Ecotox Environ Safe 49:60-3.
Macek KJ, Hutchinson C, Cope OB (1969) The effects of temperature on the
susceptibility of bluegills and rainbow trout to selected pesticides. B Environ
Contam Toxicol 4:174-83.
Mayer FL, Ellersieck MR (1986) Manual of acute toxicity: interpretation and data base
for 410 chemicals and 66 species of freshwater animals. Washington, DC: US
Department of the Interior, Fish and Wildlife Service. Pg 5-73.
McEwen GK, Woolfe A, Goode D, Vavouri T, Callaway H, Elgar G (2006) Ancient
duplicated conserved noncoding elements in vertebrates: a genomic and functional
analysis. Genome Res. 16:451-65.
MFEprimer-2.0: http://biocompute.bmi.ac.cn/CZlab/MFEprimer-2.0/ - Last acessed in
July 2013

FCUP Phylogeny and molecular biology in amphibian ecotoxicology
87
Miles AT, Hawksworth GM, Beattie JH, Rodilla V (2000) Induction, regulation,
degradation, and biological significance of mammalian metallothioneins. Crit Ver
Biochem Mol Biol 35:35-70.
Miracle AL, Ankley GT (2005) Ecotoxicogenomics: linkages between exposure and
effects in assessing risks of aquatic contaminants to fish. Reprod Toxicol 19: 321-
326.
Moleirinho A, Carneiro J, Matthiesen R, Silva RM, Amorim A, Azevedo L (2011)
Gains, losses and changes of function after gene duplication: study of the
metallothionein family. PLoS ONE 6(4): e18487.
Moriarty F (1983) Ecotoxicology: the study of pollutants in ecosystems. Academic
press London and New York, Pg 233.
Mosleh YY, Paris-Palacios S, Biagianti-Risbourg S (2006) Metallothioneins induction
and antioxidative response in aquatic worms Tubifex tubifex (Oligochaeta,
Tubificidae) exposed to copper. Chemosphere 64:121-8.
Nam D-H, Kim E-Y, Iwata H, Tanabe S (2007) Molecular characterization of two
metallothionein isoforms in avian species: evolutionary history, tissue distribution
profile, and expression associated with metal accumulation. Comp Biochem
Physiol 145:295-305.
NCBI database: www.ncbi.nlm.nih.gov. Last accessed in June 2013.
Nordberg GF (1989) Modulation of metal toxicity by metallothionein. Biol Trace
Elemen Res. 21:131-5.
Nordberg M, Kojima Y (1979) Metallothionein, in Kägi JWR, Nordberg M (eds),
Proceedings of the first international meeting on metallotionein and other low
molecular weight metal-binding proteins, Birkhäuser, Switzerland, pp 41-117.
Nordberg M, Nordberg GF (2009) Metallothioneins: Historical Development and
Overview. in: Sigel A, Sigel H, Sigel RKO (eds), Met Ions Life Sci, The Royal
Society of Chemistry, Cambridge, UK:1-29.
Nylander J, Ronquist F, Huelsenbeck J, Nieves-Aldrey J (2004) Bayesian phylogenetic
analysis of combined data. Syst Biol 53:47-67.
Odum EP (1984) The mesocosm. BioScience 558-562.
Ohno S (1970) Evolution by gene duplication, Springer-Verlag, London
Orme D (2012) The caper package: comparative analysis of phylogenetics and
evolution in R, version 0.5.
Osterauer R, Köhler HR (2008). Temperature-dependent effects of the pesticides
thiacloprid and diazinon on the embryonic development of zebrafish (Danio rerio).
Aquat Toxicol 86:485-94.
88 FCUP
2013
Pagel M (1997) Inferring evolutionary processes from phylogenies. Zool Scr 26:331–
348.
Pagel M (1999) Inferring the historical patterns of biological evolution. Nature
401:877–884.
Palacios O, Atrian S, Capdevila M (2011) Zn- and Cu-thioneins: a functional
classification for metallothioneins? J Biol Inorg Chem 16:991-1009.
Palmiter RD (1998) The elusive function of metallothioneins. Proc Natl Acad Sci
95:8428-8430.
Pérez-Coll CS, Herkovits J, Fridman O, Daniel P, D'eramo JL (1997) Metallothioneins
and cadmium uptake by the liver in Bufo arenarum. Environ Pollut 97:311-315.
Porter KR, Hakanson DE (1976) Toxicity of mine drainage to embryonic and larval
boreal toads (Bufonidae: Bufo boreas). Copeia 327-331.
Pounds JA, Bustamante MR, Coloma LA, Consuegra JA, Fogden MPL, Foster PN, La
Marca E, Master KL, Merino-Viteri A, Puschendorf R, Ron SR, Sánchez-Azofeifa
GA, Still CJ, Young BE (2006) Widespread amphibian extinctions from epidemic
disease driven by global warming. Nature 439:161-7.
Prince VE, Pickett FB (2002) Splitting pairs: the diverging fates of duplicated genes.
Nat Rev Gen 3:827-37.
Protein hydrophobicity plots generator: www.vivo.colostate.edu/molkit/hydropathy.
Last accessed in May 2013.
Pruitt KD, Harrow J, Harte RA, Wallin C, Diekhans M, Maglott DR, Searle S, Farrell
CM, Loveland JE, Ruef BJ et al (2009) The consensus coding sequence (CCDS)
project : Identifying a common protein-coding gene set for the human and mouse
genomes. Genome Res 19:1316-1323.
Qu W, Shen Z, Zhao D, Yang Y, Zhang C (2009) MFEprimer: multiple factor
evaluation of the specificity of PCR primers. Bioinformatics 25:276-278. – website
http://biocompute.bmi.ac.cn/CZlab/MFEprimer-2.0/.
Radonić A, Thulke S, Mackay IM, Landt O, Siegert W, Nitsche A. (2004). Guideline to
reference gene selection for quantitative real-time PCR. Biochemical and
biophysical research communications, 313, 856-862.
Raimondo S, Jackson CR, Barron MG (2010) Influence of taxonomic relatedness and
chemical mode of action in acute interspecies estimation model for aquatic species.
Environ Sci Technol 44: 7711 – 7716.
Rambaut A, Drummond AJ (2009) Tracer, MCMC Trace Analysis Tool, v1.5.0.
http://beast.bio.ed.ac.uk/Tracer. Acessed in November 2012.
FCUP Phylogeny and molecular biology in amphibian ecotoxicology
89
Riggio M, Trinchella F, Filosa S, Parisi E, Scudiero R (2003) Accumulation of zinc,
copper, and metallothionein mRNA in lizard ovary proceeds without a concomitant
increase in metallothionein content. Mol Reprod Dev 66:374-82.
Robbens J, Van der Ven K, Maras M, Blust R, De Coen W (2007) Ecotoxicological risk
assessment using DNA chips and cellular reporters. Trends Biotechnol 25:460-6.
Rohlf FJ (2001) Comparative methods for the analysis of continuous variables:
geometric interpretations. Evolution 55: 2143-2160
Rohr JR, Sesterhenn TM, Stieha C (2011) Will climate change reduce the effects of a
pesticide on amphibians?: partitioning effects on exposure and susceptibility to
contaminants. Glob Change Biol 17:657-66
Romero-Isart N, Cols N, Termansen MK, Gelpí JL, González-Duarte R, Atrian S,
Capdevila M, González-Duarte P (1999) Replacement of terminal cysteine with
histidine in the metallothionein alpha and beta domains maintains its binding
capacity. Eur J Biochem 259:519-27
Ronquist F, Huelsenbeck JP (2003) MrBayes 3: Bayesian phylogenetic inference under
mixed models. Bioinformatics 19:1572-1574.
von Rozycki T, Nies DH (2009) Cupriavidus metallidurans: evolution of a metal-
resistant bacterium. Antonie van Leeuwenhoek 96:115-39.
Saint-Jacques E, April MJ, Séguin C (1995) Structure and metal-regulated expression of
the gene encoding Xenopus laevis metallothionein-A Gene 160:201-6
Saint-Jacques E, Guay J, Wirtanen L, Huard V, Tewart G, Séguin C (1998). Cloning of
a complementary DNA encoding an Ambystoma mexicanum metallothionein,
AmMT, and expression of the gene during early development. DNA Cell Biol,
17:83-91.
Santos B, Ribeiro R, Domingues I, Pereira R, Soares AM, Lopes I (2013). Salinity and
copper interactive effects on perez's frog Pelophylax perezi. Environ Toxicol Chem
32:1864-72.
Schmidt CJ, Hamer DH (1986) Cell specificity and an effect of ras on human
metallothionein gene expression. Proc Natl Acad Sci USA 83:3346-3350
Scudiero R, Temussi PA, Parisi E (2005) Fish and mammalian metallothioneins: a
comparative study. Gene 345:21-6. doi: 10.1016/j.gene.2004.11.024
Serafim A, Bebianno MJ (2009) Metallothionein role in the kinetic model of copper
accumulation and elimination in the clam Ruditapes decussatus. Environ Res
109:390-9.
Šindelka R, Ferjentsik Z, Jonák J (2006) Developmental expression profiles of Xenopus
laevis reference genes. Dev Dynam 235:754-758.
90 FCUP
2013
Stuart SN, Chanson JS, Cox NA, Young BE, Rodrigues ASL, Fischman DL, Waller
RW (2004) Status and trends of amphibian declines and extinctions worldwide.
Science 306:1783-86.
Suzuki KT, Itoh N, Ohta K, Sunaga H (1986) Amphibian metallothionein. Induction in
the frogs Rana japonica, R. nigromaculata and Rhacophorus schlegeii.
Comparative Comp Biochem Phys C, 83: 253-259.
Tamura K, Peterson D, Peterson N, Stecher G, Nei M, Kumar S (2011) MEGA5:
molecular evolutionary genetics analysis using maximum likelihood, evolutionary
distance, and maximum parsimony methods. Mol Biol Evol 28:2731-9.
Taylor JS, Brassch I, Frickey T, Meyer A, Van de Peer Y (2003) Genome duplication, a
trait shared by 22,000 species of ray-finned fish. Genome Res 13:382-90.
Tree of Life Web Project: http://tolweb.org/tree/. Last accessed in October 2012.
Trinchella F, Esposito MG, Scudiero R (2012) Metallothionein primary structure in
amphibians: Insights from comparative evolutionary analysis in vertebrates. C R
Biol 335:480-7.
Trinchella F, Riggio M, Filosa S, Parisi E, Scudiero R (2008) Molecular cloning and
sequencing of metallothionein in squamates: new insights into the evolution of the
metallothionein genes in vertebrates. Gene 423:48-56.
Trinchella F, Riggio M, Filosa S, Volpe MG, Parisi E, Scudiero R, (2006) Cadmium
distribution and metallothionein expression in lizard tissues following acute and
chronic cadmium intoxication. Comp Biochem Physiol C Toxicol 144:272-8.
Tío L, Villarreal L, Atrian S, Capdevila M (2004) Functional differentiation in the
mammalian metallothionein gene family: metal binding features of mouse MT4
and comparison with its paralog MT1. J Biol Chem 279:24403-13.
Tom M, Chen N, Segev M, Herut B, Rinkevich B (2004). Quantifying fish
metallothionein transcript by real time PCR for its utilization as an environmental
biomarker. Mar Pollut Bull 48:705-10.
Uniprot protein database: www.uniprot.org/uniprot. Last accessed in April 2013.
U. S. Environmental Protection Agency. (1986) Guidance for reregistration of pesticide
products containing copper sulfate. Fact sheet no 100. Office of Pesticide
Programs. Washington, DC.
U. S. Environmental Protection Agency (2008) Prevention, Pesticides and Toxic
Substances – (7508P) - Copper Facts.
U.S. Environmental Protection Agency (US EPA) (2012) ECO-TOX. Database.
available at: http://cfpub.epa.gov/ecotox/quick_query.htm

FCUP Phylogeny and molecular biology in amphibian ecotoxicology
91
Untergasser A, Nijveen H, Rao X, Bisseling T, Geurts R, Leunissen JAM (2007)
Primer3Plus, an enhanced web interface to Primer3. Nucl Acids Res 35:W71-W74.
Valls M, Bofill R, Gonzalez-Duarte R, Gonzalez-Duarte P, Capdevila M, Atrian S
(2001) A new insight into metallothionein (MT) classification and evolution.
The in vivo and in vitro metal binding features of Homarus americanus
recombinant MT J Biol Chem 276:32835-43.
Vandesompele, J., De Preter, K., Pattyn, F., Poppe, B., Van Roy, N., De Paepe, A., &
Speleman, F. (2002). Vašák M, Armitage I (1986). Nomenclature and possible
evolutionary pathways of metallothionein and related proteins. Environ Health Perspect
65:215-216.
Vašák M, Meloni G (2011) Chemistry and biology of mammalian metallothioneins. J
Biol Inorg Chem 16:1067-78.
van Straalen NM, Feder ME (2011) Ecological and Evolutionary Functional Genomics:
How Can It Contribute to the Risk Assessment of Chemicals?. Environ Sci
Technol 46:3-9
Vandesompele J, De Preter K, Pattyn F, Poppe B, Van Roy N, De Paepe A, Speleman F
(2002) Accurate normalization of real-time quantitative RT-PCR data by geometric
averaging of multiple internal control genes. Genome Biol 3,research0034
VanGuilder HD, Vrana KE, Freeman WM (2008). Twenty-five years of quantitative
PCR for gene expression analysis. Biotechniques, 44, 619
Veldhoen N, Helbing CC (2001) Detection of environmental endocrine‐disruptor effects
on gene expression in live Rana catesbeiana tadpoles using a tail fin biopsy
technique. Environ Toxicol Chem 20:2704-2708
Vernot B, Stolzer M, Goldman A, Durand D (2008) Reconciliation with non-binary
species trees. J Comput Biol 15:981-1006. doi: 10.1089/cmb.2008.0092
Villarreal L, Tío L, Capdevila M, Atrian S (2006) Comparative metal binding and
genomic analysis of the avian (chicken) and mammalian metallothionein. FEBS J
273:523-35. doi: 10.1111/j.1742-4658.2005.05086.x
Villeneuve DL, Garcia-Reyero N, Escalon BL, Jensen KM, Cavallin JE, Makynen EA
et al (2011) Ecotoxicogenomics to support ecological risk assessment: A case
study with bisphenol A in fish. Environl Sci Technol 46:51-9. doi:
10.1021/es201150a
Vitousek PM (1994) Beyond global warming: ecology and global change. Ecology
75:1861–76.
Wang Y, Gu X (2001) Functional divergence in the caspase gene family and altered
functional constraints: statistical analysis and prediction. Genetics 158:1311-20.
92 FCUP
2013
Wake DB, Vredenburg VT (2008) Are we in the midst of the sixth mass extinction? A
view from the world of amphibians. P Natl A Sci 105:11466-73.
Wright DA, Welbourn P (2002) Environmental toxicology. Cambridge University Press
Wyman RL (1998) Experimental assessment of salamanders as predators of detrital
food webs: effects on invertebrates, decomposition and the carbon cycle."
Biodivers Conservs 7:641-50
Xia X, Xie Z, Salemi M, Chen L, Wang Y (2003) An index of substitution saturation
and its application. Mol Phylogenetic Evol 26:1-7. doi: 10.1016/S1055-
7903(02)00326-3
Xia X (2013) DAMBE5: A comprehensive software package for data analysis in
molecular biology and evolution. Mol Biol Evol 1-9. doi: 10.1093/molbev/mst064
Yanai I, Camacho CJ, DeLisi C (2000) Predictions of gene family distributions in
microbial genomes: evolution by gene duplication and modification. Phys Rev Lett
85:2641-4. doi: 10.1103/PhysRevLett.85.2641
Yang Z (2007) PAML 4: phylogenetic analysis by maximum likelihood. Mol Biol Evol
24:1586-91. doi: 10.1093/molbev/msm088
Yu S, Wages MR, Cai Q, Maul JD, Cobb GP (2013) Lethal and sublethal effects of
three insecticides on two developmental stages of Xenopus laevis and comparison
with other amphibians. Environ Toxicol Chem 32:2056-64.
Zhang J, Rosenberg HF, Nei M (1998) Positive Darwinian selection after gene
duplication in primate ribonuclease genes. Proc Natl Acad Sci USA 95:3708-13
Zhang J (2003) Evolution by gene duplication: an update. Trends Ecol Evol 18:292-298.
Zocche JJ, da Silva LA, Damiani AP, Mendonça RÁ, Peres PB, dos Santos CEI, et al.,
(2013) Heavy-Metal Content and Oxidative Damage in Hypsiboas faber: The
impact of coal-mining pollutants on amphibians. Arch Environ Con Tox 1-9.

FCUP Phylogeny and molecular biology in amphibian ecotoxicology
93
Supplementary Materials
Supplementary Material 1 - Vertebrate metallothionein CDS dataset used in this work (see Materials and Methods for further details).
“Annotation” reflects names according to the database used to retrieve this sequence. “Sequence Code” refers to names used for this work.
“Length (bp-aa)” refers to length of the full exon when known (CDS+UTR or CDS) in number of base pairs (bp) and the number of amino acids;
“Gene Type – Ensembl” with the classification “known” if there is a sequence match to the CDS or protein for the same species, “novel” if
there is no match and "known by projection" classification if the transcript is a match for another species. “RefSeq Status – NCBI” as defined
according to www.ncbi.nlm.nih.gov/RefSeq/key.html#status; “Location” indicates the interval of basepairs where the CDS is located in the
chromosome; “Direction” means the direction of expression of the CDS in the double stranded DNA chromosome. Acession numbers of the
sequences are indicated as full gene in Ensembl and NCBI (Gene Acess No and NCBI annotation) and as CDS in Ensembl (Transcript Acess
No.).
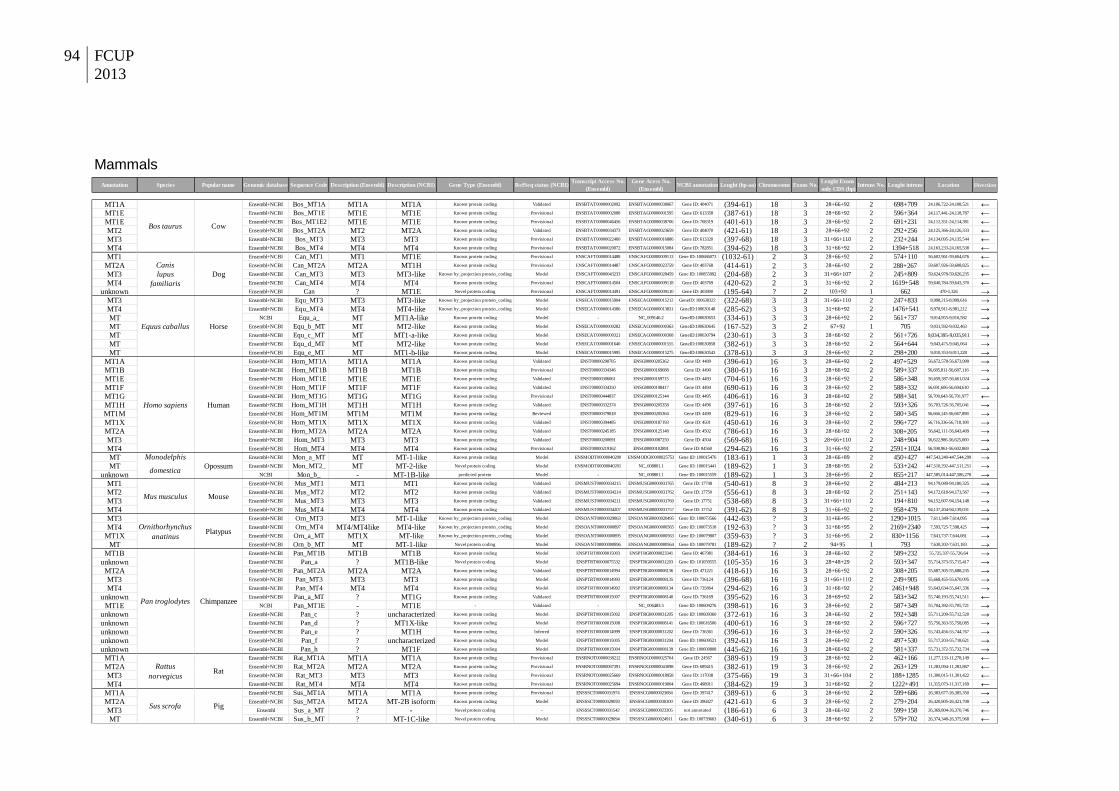
94 FCUP
2013
Transcript Access No. Gene Acess No. Lenght Exons
(Ensembl) (Ensembl) only CDS (bp)
MT1A Ensembl+NCBI Bos_MT1A MT1A MT1A Known protein coding Validated ENSBTAT00000002092 ENSBTAG00000038067 Gene ID: 404071 (394-61) 18 3 28+66+92 2 698+709 24,106,722-24,108,521 ←MT1E Ensembl+NCBI Bos_MT1E MT1E MT1E Known protein coding Provisional ENSBTAT00000002088 ENSBTAG00000001595 Gene ID: 613358 (387-61) 18 3 28+66+92 2 596+364 24,117,441-24,118,787 ←MT1E Ensembl+NCBI Bos_MT1E2 MT1E MT1E Known protein coding Provisional ENSBTAT00000046456 ENSBTAG00000038706 Gene ID: 768319 (401-61) 18 3 28+66+92 2 691+231 24,112,351-24,114,381 ←MT2 Ensembl+NCBI Bos_MT2A MT2 MT2A Known protein coding Validated ENSBTAT00000034373 ENSBTAG00000023659 Gene ID: 404070 (421-61) 18 3 28+66+92 2 292+256 24,125,366-24,126,333 ←MT3 Ensembl+NCBI Bos_MT3 MT3 MT3 Known protein coding Provisional ENSBTAT00000022460 ENSBTAG00000016886 Gene ID: 613320 (397-68) 18 3 31+66+110 2 232+244 24,134,095-24,135,544 ←MT4 Ensembl+NCBI Bos_MT4 MT4 MT4 Known protein coding Provisional ENSBTAT00000020072 ENSBTAG00000015084 Gene ID: 782851 (394-62) 18 3 31+66+92 2 1394+518 24,163,233-24,165,538 ←MT1 Ensembl+NCBI Can_MT1 MT1 MT1E Known protein coding Provisional ENSCAFT00000014488 ENSCAFG00000009113 Gene ID: 100686073 (1032-61) 2 3 28+66+92 2 574+110 56,602,961-59,604,676 ←
MT2A Ensembl+NCBI Can_MT2A MT2A MT1H Known protein coding Provisional ENSCAFT00000014487 ENSCAFG00000023759 Gene ID: 403768 (414-61) 2 3 28+66+92 2 288+267 59,607,926-59,608,825 ←MT3 lupus Ensembl+NCBI Can_MT3 MT3 MT3-like Known by_projection protein_coding Model ENSCAFT00000043233 ENSCAFG00000028459 Gene ID: 100855992 (204-68) 2 3 31+66+107 2 245+809 59,624,978-59,626,235 ←MT4 Ensembl+NCBI Can_MT4 MT4 MT4 Known protein coding Provisional ENSCAFT00000014504 ENSCAFG00000009118 Gene ID: 403769 (420-62) 2 3 31+66+92 2 1619+548 59,640,784-59,643,370 ←
unknown Ensembl+NCBI Can ? MT1E Novel protein coding Provisional ENSCAFT00000014491 ENSCAFG00000009110 Gene ID: 403800 (195-64) ? 2 103+92 1 662 470-1,326 →MT3 Ensembl+NCBI Equ_MT3 MT3 MT3-like Known by_projection protein_coding Model ENSECAT00000015904 ENSECAG00000015212 GeneID: 100630322 (322-68) 3 3 31+66+110 2 247+833 8,998,215-8,999,616 →MT4 Ensembl+NCBI Equ_MT4 MT4 MT4-like Known by_projection protein_coding Model ENSECAT00000014386 ENSECAG00000013831 GeneID:100630148 (285-62) 3 3 31+66+92 2 1476+541 8,978,911-8,981,212 →MT NCBI Equ_a_ MT MT1A-like Known protein coding Model - NC_009146.2 GeneID:100630653 (334-61) 3 3 28+66+92 2 561+737 9,014,955-9,016,582 →MT Ensembl+NCBI Equ_b_MT MT MT2-like Known protein coding Model ENSECAT00000000282 ENSECAG00000000363 GeneID:100630645 (167-52) 3 2 67+92 1 705 9,031,592-9,032,463 →MT Ensembl+NCBI Equ_c_MT MT MT1-a-like Known protein coding Model ENSECAT00000000321 ENSECAG00000000368 GeneID:100630794 (230-61) 3 3 28+66+92 2 561+726 9,034,395-9,035,911 →MT Ensembl+NCBI Equ_d_MT MT MT2-like Known protein coding Model ENSECAT00000001640 ENSECAG00000001555 GeneID:100630858 (382-61) 3 3 28+66+92 2 564+644 9,043,475-9,045,064 →MT Ensembl+NCBI Equ_e_MT MT MT1-b-like Known protein coding Model ENSECAT00000015995 ENSECAG00000015275 GeneID:100630543 (378-61) 3 3 28+66+92 2 298+200 9,010,353-9,011,228 →
MT1A Ensembl+NCBI Hom_MT1A MT1A MT1A Known protein coding Validated ENST00000290705 ENSG00000205362 Gene ID: 4489 (396-61) 16 3 28+66+92 2 497+529 56,672,578-56,673,999 →MT1B Ensembl+NCBI Hom_MT1B MT1B MT1B Known protein coding Provisional ENST00000334346 ENSG00000169688 Gene ID: 4490 (380-61) 16 3 28+66+92 2 589+337 56,685,811-56,687,116 →MT1E Ensembl+NCBI Hom_MT1E MT1E MT1E Known protein coding Validated ENST00000306061 ENSG00000169715 Gene ID: 4493 (704-61) 16 3 28+66+92 2 586+348 56,659,387-56,661,024 →MT1F Ensembl+NCBI Hom_MT1F MT1F MT1F Known protein coding Validated ENST00000334350 ENSG00000198417 Gene ID: 4494 (690-61) 16 3 28+66+92 2 588+332 56,691,606-56,694,610 →MT1G Ensembl+NCBI Hom_MT1G MT1G MT1G Known protein coding Provisional ENST00000444837 ENSG00000125144 Gene ID: 4495 (406-61) 16 3 28+66+92 2 588+341 56,700,643-56,701,977 ←MT1H Ensembl+NCBI Hom_MT1H MT1H MT1H Known protein coding Validated ENST00000332374 ENSG00000205358 Gene ID: 4496 (397-61) 16 3 28+66+92 2 593+326 56,703,726-56,705,041 →MT1M Ensembl+NCBI Hom_MT1M MT1M MT1M Known protein coding Reviewed ENST00000379818 ENSG00000205364 Gene ID: 4499 (829-61) 16 3 28+66+92 2 580+345 56,666,145-56,667,898 →MT1X Ensembl+NCBI Hom_MT1X MT1X MT1X Known protein coding Validated ENST00000394485 ENSG00000187193 Gene ID: 4501 (450-61) 16 3 28+66+92 2 596+727 56,716,336-56,718,108 →MT2A Ensembl+NCBI Hom_MT2A MT2A MT2A Known protein coding Validated ENST00000245185 ENSG00000125148 Gene ID: 4502 (786-61) 16 3 28+66+92 2 308+205 56,642,111-56,643,409 →MT3 Ensembl+NCBI Hom_MT3 MT3 MT3 Known protein coding Validated ENST00000200691 ENSG00000087250 Gene ID: 4504 (569-68) 16 3 28+66+110 2 248+904 56,622,986-56,625,000 →MT4 Ensembl+NCBI Hom_MT4 MT4 MT4 Known protein coding Provisional ENST00000219162 ENSG00000102891 Gene ID: 84560 (294-62) 16 3 31+66+92 2 2591+1024 56,598,961-56,602,869 →MT Monodelphis Ensembl+NCBI Mon_a_MT MT MT-1-like Known protein coding Model ENSMODT00000040200 ENSMODG00000025753 Gene ID: 100015476 (183-61) 1 3 28+66+89 2 450+427 447,543,240-447,544,299 →MT Ensembl+NCBI Mon_MT2_ MT MT-2-like Novel protein coding Model ENSMODT00000040201 NC_008801.1 Gene ID: 100015441 (189-62) 1 3 28+66+95 2 533+242 447,510,292-447,511,251 →
unknown NCBI Mon_b_ - MT-1B-like predicted protein Model - NC_008801.1 Gene ID: 100015559 (189-62) 1 3 28+66+95 2 855+217 447,585,014-447,586,270 →MT1 Ensembl+NCBI Mus_MT1 MT1 MT1 Known protein coding Validated ENSMUST00000034215 ENSMUSG00000031765 Gene ID: 17748 (540-61) 8 3 28+66+92 2 484+213 94,179,089-94,180,325 →MT2 Ensembl+NCBI Mus_MT2 MT2 MT2 Known protein coding Validated ENSMUST00000034214 ENSMUSG00000031762 Gene ID: 17750 (556-61) 8 3 28+66+92 2 251+143 94,172,618-94,173,567 →MT3 Ensembl+NCBI Mus_MT3 MT3 MT3 Known protein coding Validated ENSMUST00000034211 ENSMUSG00000031760 Gene ID: 17751 (538-68) 8 3 31+66+110 2 194+810 94,152,607-94,154,148 →MT4 Ensembl+NCBI Mus_MT4 MT4 MT4 Known protein coding Validated ENSMUST00000034207 ENSMUSG00000031757 Gene ID: 17752 (391-62) 8 3 31+66+92 2 958+479 94,137,204-94,139,031 →MT3 Ensembl+NCBI Orn_MT3 MT3 MT-1-like Known by_projection protein_coding Model ENSOANT00000029863 ENSOANG00000020495 Gene ID: 100073566 (442-63) ? 3 31+66+95 2 1290+1015 7,611,349-7,614,095 →MT4 Ensembl+NCBI Orn_MT4 MT4/MT4like MT4-like Known by_projection protein_coding Model ENSOANT00000000897 ENSOANG00000000565 Gene ID: 100073518 (192-63) ? 3 31+66+95 2 2169+2340 7,593,725-7,598,425 →
MT1X Ensembl+NCBI Orn_a_MT MT1X MT-like Known by_projection protein_coding Model ENSOANT00000000895 ENSOANG00000000563 Gene ID: 100079807 (359-63) ? 3 31+66+95 2 830+1156 7,641,737-7,644,081 →MT Ensembl+NCBI Orn_b_MT MT MT-1-like Novel protein coding Model ENSOANT00000000896 ENSOANG00000000564 Gene ID: 100079781 (189-62) ? 2 94+95 1 793 7,630,202-7,631,183 →
MT1B Ensembl+NCBI Pan_MT1B MT1B MT1B Known protein coding Model ENSPTRT00000015003 ENSPTRG00000023341 Gene ID: 467981 (384-61) 16 3 28+66+92 2 589+232 55,725,337-55,726,64 →unknown Ensembl+NCBI Pan_a ? MT1B-like Novel protein coding Model ENSPTRT00000075532 ENSPTRG00000031203 Gene ID: 101059555 (105-35) 16 3 28+48+29 2 593+347 55,714,373-55,715,417 →
MT2A Ensembl+NCBI Pan_MT2A MT2A MT2A Known protein coding Validated ENSPTRT00000014994 ENSPTRG00000008136 Gene ID: 471221 (418-61) 16 3 28+66+92 2 308+205 55,687,305-55,688,235 →MT3 Ensembl+NCBI Pan_MT3 MT3 MT3 Known protein coding Model ENSPTRT00000014993 ENSPTRG00000008135 Gene ID: 736124 (396-68) 16 3 31+66+110 2 249+905 55,668,455-55,670,005 →MT4 Ensembl+NCBI Pan_MT4 MT4 MT4 Known protein coding Model ENSPTRT00000014992 ENSPTRG00000008134 Gene ID: 735864 (294-62) 16 3 31+66+92 2 2461+948 55,643,634-55,647,336 →
unknown Ensembl+NCBI Pan_a_MT ? MT1G Known protein coding Validated ENSPTRT00000015007 ENSPTRG00000008140 Gene ID: 736169 (395-62) 16 3 28+69+92 2 583+342 55,740,193-55,741,511 ←MT1E NCBI Pan_MT1E - MT1E - Validated - NC_006483.3 Gene ID: 100609276 (398-61) 16 3 28+66+92 2 587+349 55,704,392-55,705,721 →
unknown Ensembl+NCBI Pan_c ? uncharacterized Known protein coding Model ENSPTRT00000015002 ENSPTRG00000031205 Gene ID: 100609360 (372-61) 16 3 28+66+92 2 592+348 55,711,209-55,712,520 →unknown Ensembl+NCBI Pan_d ? MT1X-like Known protein coding Model ENSPTRT00000015008 ENSPTRG00000008141 Gene ID: 100616506 (400-61) 16 3 28+66+92 2 596+727 55,756,363-55,758,085 →unknown Ensembl+NCBI Pan_e ? MT1H Known protein coding Inferred ENSPTRT00000014999 ENSPTRG00000031202 Gene ID: 736361 (396-61) 16 3 28+66+92 2 590+326 55,743,456-55,744,767 →unknown Ensembl+NCBI Pan_f ? uncharacterized Known protein coding Model ENSPTRT00000015005 ENSPTRG00000031204 Gene ID: 100609521 (392-61) 16 3 28+66+92 2 497+530 55,717,203-55,718,621 →unknown Ensembl+NCBI Pan_h ? MT1F Known protein coding Model ENSPTRT00000015004 ENSPTRG00000008139 Gene ID: 100609808 (445-62) 16 3 28+66+92 2 581+337 55,731,372-55,732,734 →
MT1A Ensembl+NCBI Rat_MT1A MT1A MT1A Known protein coding Provisional ENSRNOT00000038212 ENSRNOG00000025764 Gene ID: 24567 (389-61) 19 3 28+66+92 2 462+166 11,277,133-11,278,149 ←MT2A Ensembl+NCBI Rat_MT2A MT2A MT2A Known protein coding Provisional ENSRNOT00000067391 ENSRNOG00000043098 Gene ID: 689415 (382-61) 19 3 28+66+92 2 263+129 11,283,094-11,283,867 ←MT3 Ensembl+NCBI Rat_MT3 MT3 MT3 Known protein coding Provisional ENSRNOT00000025669 ENSRNOG00000018958 Gene ID: 117038 (375-66) 19 3 31+66+104 2 188+1285 11,300,015-11,301,422 ←MT4 Ensembl+NCBI Rat_MT4 MT4 MT4 Known protein coding Provisional ENSRNOT00000025694 ENSRNOG00000019004 Gene ID: 498911 (384-62) 19 3 31+66+92 2 1222+491 11,315,073-11,317,169 ←
MT1A Ensembl+NCBI Sus_MT1A MT1A MT1A Known protein coding Provisional ENSSSCT00000031974 ENSSSCG00000023684 Gene ID: 397417 (389-61) 6 3 28+66+92 2 599+686 26,383,677-26,385,350 →MT2A Ensembl+NCBI Sus_MT2A MT2A MT-2B isoform Known protein coding Model ENSSSCT00000029059 ENSSSCG00000030300 Gene ID: 396827 (421-61) 6 3 28+66+92 2 279+204 26,420,805-26,421,708 →MT3 Ensembl Sus_a_MT ? - Novel protein coding - ENSSSCT00000031542 ENSSSCG00000023305 not annotated (186-61) 6 3 28+66+92 2 599+158 26,369,804-26,370,746 ←MT Ensembl+NCBI Sus_b_MT ? MT-1C-like Novel protein coding Model ENSSSCT00000029094 ENSSSCG00000024911 Gene ID: 100739663 (340-61) 6 3 28+66+92 2 579+702 26,374,348-26,375,968 ←
NCBI annotation Lenght (bp-aa) ChromosomeAnnotation Species Popular name Genomic database Sequence Code Description (Ensembl) Exons No. Introns No. Lenght introns Location Direction
Bos taurus Cow
Description (NCBI) Gene Type (Ensembl) RefSeq status (NCBI)
Dog
Equus caballus Horse
Homo sapiens Human
familiaris
Canis
Opossum
Mus musculus Mouse
Platypusanatinus
Ornithorhynchus
domestica
Pan troglodytes Chimpanzee
Rat
Sus scrofa Pig
Rattus
norvegicus
Mammals
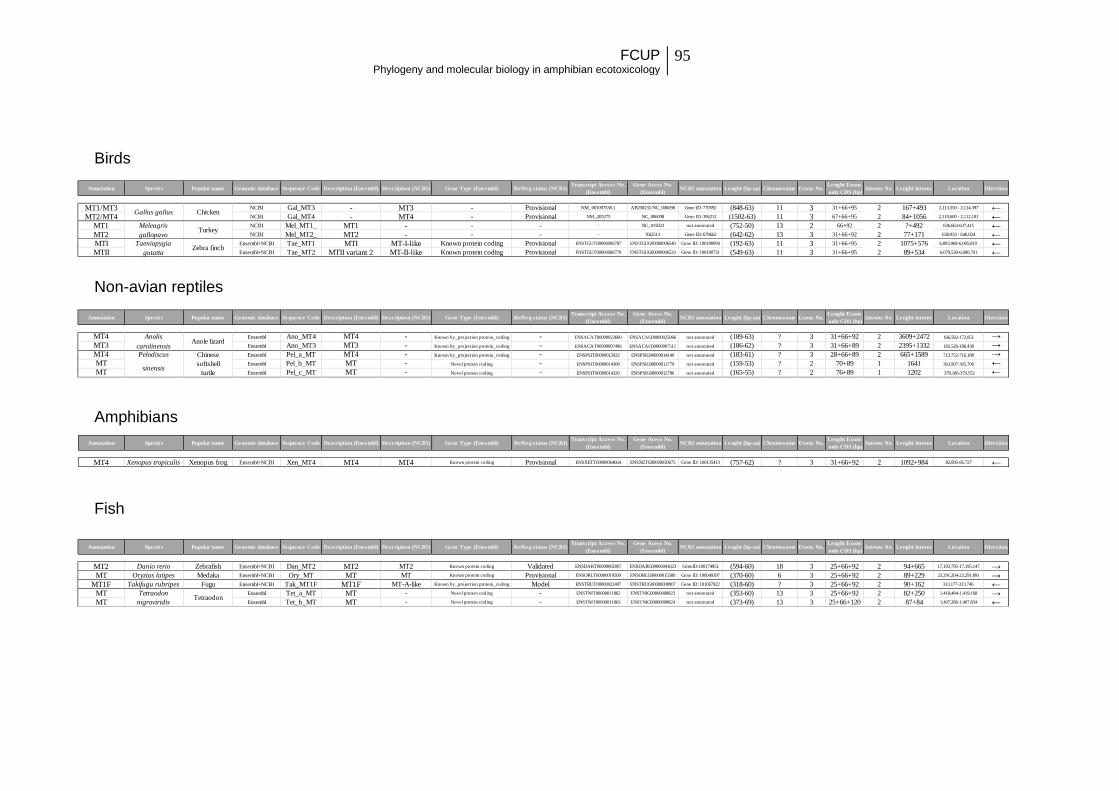
FCUP Phylogeny and molecular biology in amphibian ecotoxicology
95
Transcript Access No. Gene Acess No. Lenght Exons
(Ensembl) (Ensembl) only CDS (bp)
MT1/MT3 NCBI Gal_MT3 - MT3 - Provisional NM_001097538.1 AB258231/NC_006098 Gene ID: 770592 (848-63) 11 3 31+66+95 2 167+493 2,113,550 - 2,114,397 ←MT2/MT4 NCBI Gal_MT4 - MT4 - Provisional NM_205275 NC_006098 Gene ID: 396212 (1502-63) 11 3 67+66+95 2 84+1056 2,110,600 - 2,112,101 ←
MT1 Meleagris NCBI Mel_MT1_ MT1 - - - - NC_015023 not annotated (752-50) 13 2 66+92 2 ?+492 636,663-637,415 ←MT2 gallopavo NCBI Mel_MT2_ MT2 - - - - X62513 Gene ID: 678662 (642-62) 13 3 31+66+92 2 77+171 638,933 - 640,024 ←MTI Taeniopygia Ensembl+NCBI Tae_MT1 MTI MT-I-like Known protein coding Provisional ENSTGUT00000006787 ENSTGUG00000006540 Gene ID: 100190094 (192-63) 11 3 31+66+95 2 1075+576 6,083,968-6,085,810 ←MTII gutatta Ensembl+NCBI Tae_MT2 MTII variant 2 MT-II-like Known protein coding Provisional ENSTGUT00000006779 ENSTGUG00000006533 Gene ID: 100190731 (549-63) 11 3 31+66+95 2 89+534 6,079,530-6,080,701 ←
NCBI annotation Lenght (bp-aa) ChromosomeAnnotation Species Popular name Genomic database Sequence Code Description (Ensembl) Exons No. Introns No. Lenght introns Location Direction
Gallus gallus Chicken
Description (NCBI) Gene Type (Ensembl) RefSeq status (NCBI)
Turkey
Zebra finch
Transcript Access No. Gene Acess No. Lenght Exons
(Ensembl) (Ensembl) only CDS (bp)
MT2 Danio rerio Zebrafish Ensembl+NCBI Dan_MT2 MT2 MT2 Known protein coding Validated ENSDART00000061007 ENSDARG00000041623 GeneID:100174951 (594-60) 18 3 25+66+92 2 94+665 17,193,795-17,195,147 →MT Oryzias latipes Medaka Ensembl+NCBI Ory_MT MT MT Known protein coding Provisional ENSORLT00000019509 ENSORLG00000015580 Gene ID: 100049397 (370-60) 6 3 25+66+92 2 89+229 23,291,204-23,291,891 →
MT1F Takifugu rubripes Fugu Ensembl+NCBI Tak_MT1F MT1F MT-A-like Known by_projection protein_coding Model ENSTRUT00000022487 ENSTRUG00000008907 Gene ID: 101067922 (318-60) ? 3 25+66+92 2 90+162 313,177-313,746 ←MT Tetraodon Ensembl Tet_a_MT MT - Novel protein coding - ENSTNIT00000011862 ENSTNIG00000008823 not annotated (353-60) 13 3 25+66+92 2 82+250 1,418,484-1,419,168 →MT nigroviridis Ensembl Tet_b_MT MT - Novel protein coding - ENSTNIT00000011863 ENSTNIG00000008824 not annotated (373-69) 13 3 25+66+120 2 87+84 1,407,286-1,407,834 ←
Description (NCBI) Gene Type (Ensembl) RefSeq status (NCBI)Annotation Species Popular name Genomic database Sequence Code Description (Ensembl) NCBI annotation Lenght (bp-aa) Chromosome Exons No. Introns No. Lenght introns Location Direction
Tetraodon
Transcript Access No. Gene Acess No. Lenght Exons
(Ensembl) (Ensembl) only CDS (bp)
MT4 Xenopus tropicalis Xenopus frog Ensembl+NCBI Xen_MT4 MT4 MT4 Known protein coding Provisional ENSXETT00000064664 ENSXETG00000030675 Gene ID: 100135413 (757-62) ? 3 31+66+92 2 1092+984 82,895-85,727 ←
Annotation Species Popular name Genomic database Introns No. Lenght introns LocationSequence Code Description (Ensembl) Description (NCBI) Gene Type (Ensembl) RefSeq status (NCBI) NCBI annotation Lenght (bp-aa) Chromosome Exons No. Direction
Transcript Access No. Gene Acess No. Lenght Exons
(Ensembl) (Ensembl) only CDS (bp)
MT4 Anolis Ensembl Ano_MT4 MT4 - Known by_projection protein_coding - ENSACAT00000023600 ENSACAG00000025066 not annotated (189-63) ? 3 31+66+92 2 3609+2472 166,582-172,851 →MT3 carolinensis Ensembl Ano_MT3 MT3 - Known by_projection protein_coding - ENSACAT00000007496 ENSACAG00000007511 not annotated (186-62) ? 3 31+66+89 2 2395+1332 182,526-186,438 →MT4 Pelodiscus Chinese Ensembl Pel_a_MT MT4 - Known by_projection protein_coding - ENSPSIT00000015922 ENSPSIG00000014140 not annotated (183-61) ? 3 28+66+89 2 665+1589 713,752-716,188 →MT softshell Ensembl Pel_b_MT MT - Novel protein coding - ENSPSIT00000014308 ENSPSIG00000012779 not annotated (159-53) ? 2 70+89 1 1641 363,907-365,706 ←MT turtle Ensembl Pel_c_MT MT - Novel protein coding - ENSPSIT00000014320 ENSPSIG00000012786 not annotated (165-55) ? 2 76+89 1 1202 378,186-379,552 ←
sinensis
Anole lizard
DirectionAnnotation Species Popular name Genomic database Description (Ensembl) Description (NCBI) LocationSequence Code Lenght (bp-aa) Chromosome Exons No. Introns No. Lenght intronsGene Type (Ensembl) RefSeq status (NCBI) NCBI annotation
Birds
Non-avian reptiles
Amphibians
Fish
96 FCUP
2013
Supplementary Material 2 - List of sequences removed, edited or replaced after checking
them on the Ensembl and NCBI genomic databases.
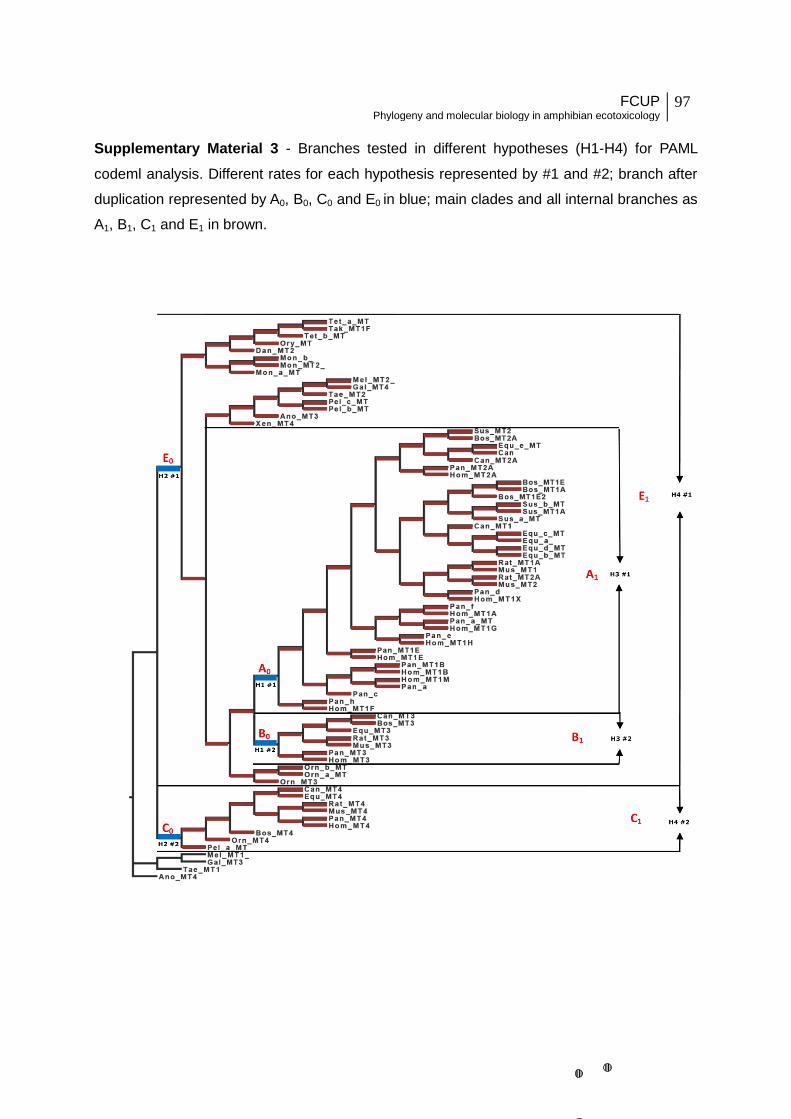
FCUP Phylogeny and molecular biology in amphibian ecotoxicology
97
Supplementary Material 3 - Branches tested in different hypotheses (H1-H4) for PAML
codeml analysis. Different rates for each hypothesis represented by #1 and #2; branch after
duplication represented by A0, B0, C0 and E0 in blue; main clades and all internal branches as
A1, B1, C1 and E1 in brown.
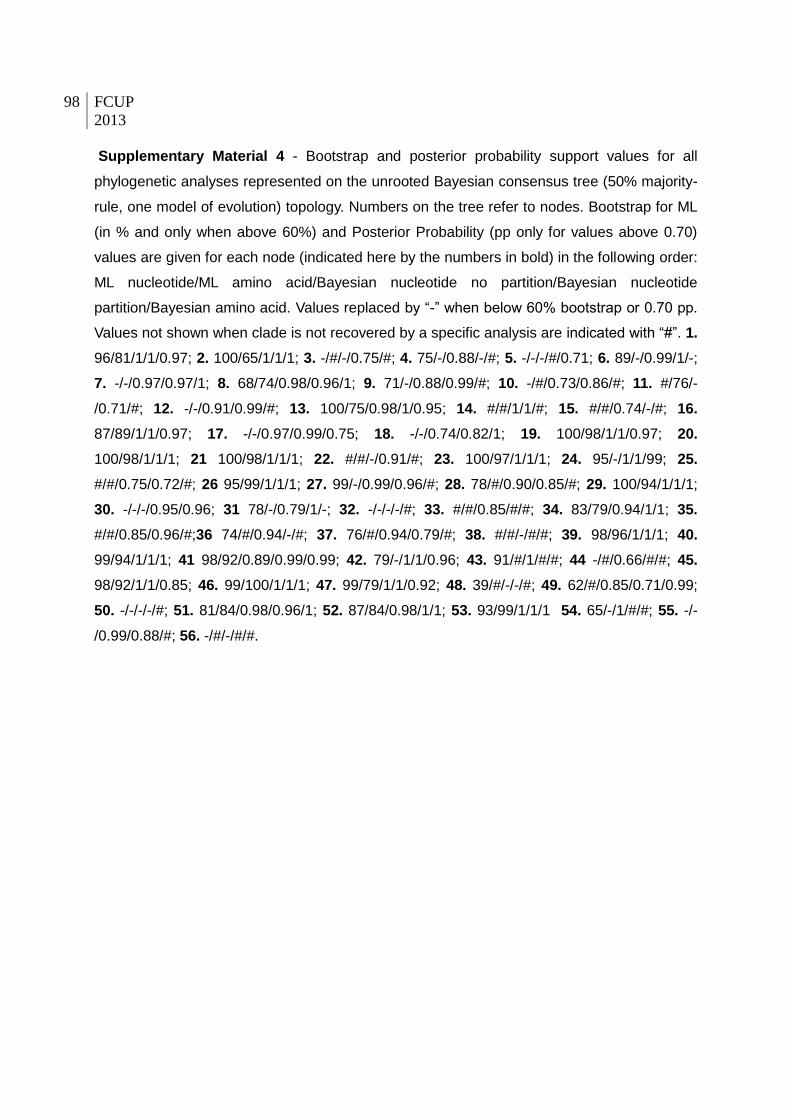
98 FCUP
2013
Supplementary Material 4 - Bootstrap and posterior probability support values for all
phylogenetic analyses represented on the unrooted Bayesian consensus tree (50% majority-
rule, one model of evolution) topology. Numbers on the tree refer to nodes. Bootstrap for ML
(in % and only when above 60%) and Posterior Probability (pp only for values above 0.70)
values are given for each node (indicated here by the numbers in bold) in the following order:
ML nucleotide/ML amino acid/Bayesian nucleotide no partition/Bayesian nucleotide
partition/Bayesian amino acid. Values replaced by “-” when below 60% bootstrap or 0.70 pp.
Values not shown when clade is not recovered by a specific analysis are indicated with “#”. 1.
96/81/1/1/0.97; 2. 100/65/1/1/1; 3. -/#/-/0.75/#; 4. 75/-/0.88/-/#; 5. -/-/-/#/0.71; 6. 89/-/0.99/1/-;
7. -/-/0.97/0.97/1; 8. 68/74/0.98/0.96/1; 9. 71/-/0.88/0.99/#; 10. -/#/0.73/0.86/#; 11. #/76/-
/0.71/#; 12. -/-/0.91/0.99/#; 13. 100/75/0.98/1/0.95; 14. #/#/1/1/#; 15. #/#/0.74/-/#; 16.
87/89/1/1/0.97; 17. -/-/0.97/0.99/0.75; 18. -/-/0.74/0.82/1; 19. 100/98/1/1/0.97; 20.
100/98/1/1/1; 21 100/98/1/1/1; 22. #/#/-/0.91/#; 23. 100/97/1/1/1; 24. 95/-/1/1/99; 25.
#/#/0.75/0.72/#; 26 95/99/1/1/1; 27. 99/-/0.99/0.96/#; 28. 78/#/0.90/0.85/#; 29. 100/94/1/1/1;
30. -/-/-/0.95/0.96; 31 78/-/0.79/1/-; 32. -/-/-/-/#; 33. #/#/0.85/#/#; 34. 83/79/0.94/1/1; 35.
#/#/0.85/0.96/#;36 74/#/0.94/-/#; 37. 76/#/0.94/0.79/#; 38. #/#/-/#/#; 39. 98/96/1/1/1; 40.
99/94/1/1/1; 41 98/92/0.89/0.99/0.99; 42. 79/-/1/1/0.96; 43. 91/#/1/#/#; 44 -/#/0.66/#/#; 45.
98/92/1/1/0.85; 46. 99/100/1/1/1; 47. 99/79/1/1/0.92; 48. 39/#/-/-/#; 49. 62/#/0.85/0.71/0.99;
50. -/-/-/-/#; 51. 81/84/0.98/0.96/1; 52. 87/84/0.98/1/1; 53. 93/99/1/1/1 54. 65/-/1/#/#; 55. -/-
/0.99/0.88/#; 56. -/#/-/#/#.
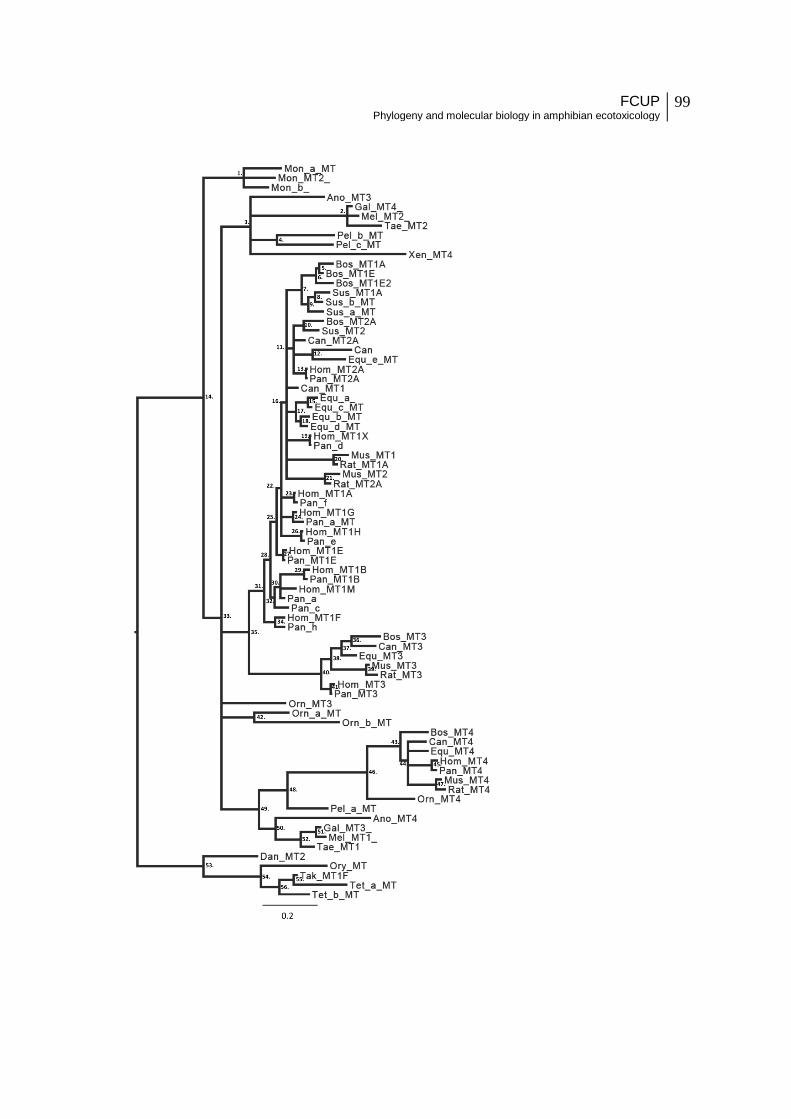
FCUP Phylogeny and molecular biology in amphibian ecotoxicology
99

100 FCUP
2013
Supplementary Material 5 - Functional divergence alignments (Type I divergence). Vertical
bar represents amino acid site indicated as functionally divergent among the indicated clades
for a cut-off value = 0.9
1) MT1/MT2 vs MT3 functional divergence alignments
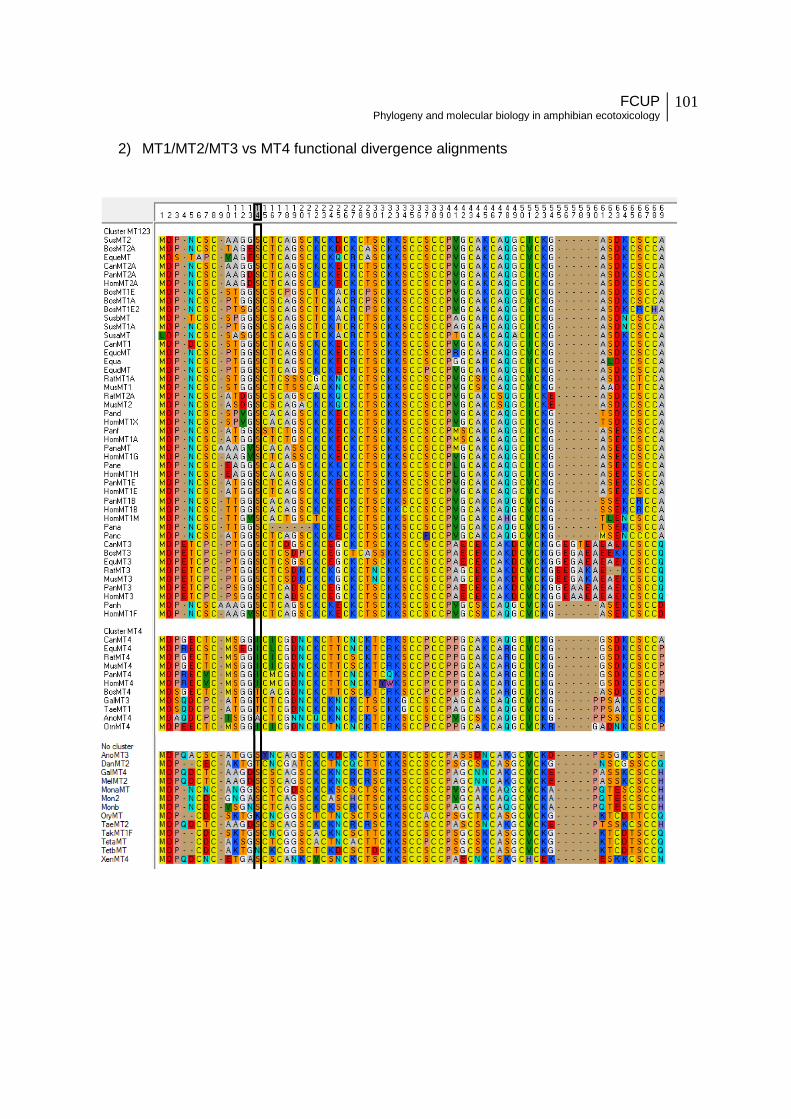
FCUP Phylogeny and molecular biology in amphibian ecotoxicology
101
2) MT1/MT2/MT3 vs MT4 functional divergence alignments

102 FCUP
2013
Supplementary Material 6 - Input tree for additional analyses on variation of selective
rates. A tetrapod MT3 clade is highlighted.
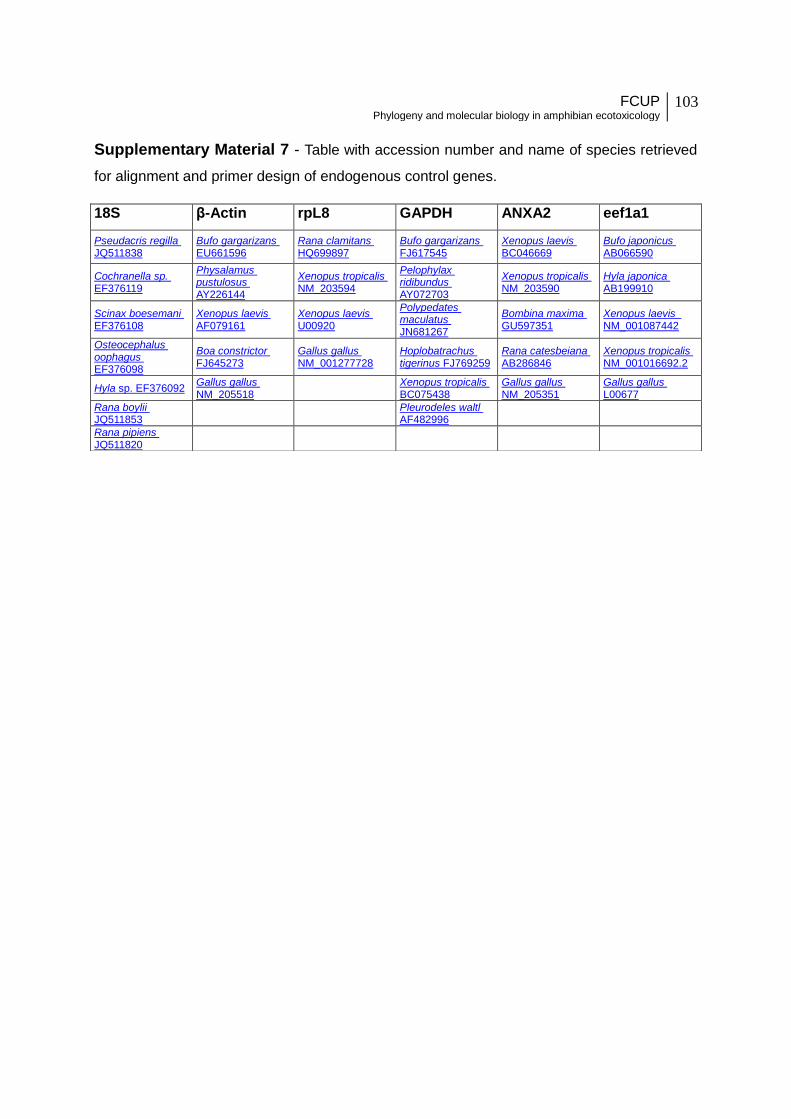
FCUP Phylogeny and molecular biology in amphibian ecotoxicology
103
Supplementary Material 7 - Table with accession number and name of species retrieved
for alignment and primer design of endogenous control genes.
18S β-Actin rpL8 GAPDH ANXA2 eef1a1
Pseudacris regilla JQ511838
Bufo gargarizans EU661596
Rana clamitans HQ699897
Bufo gargarizans FJ617545
Xenopus laevis BC046669
Bufo japonicus AB066590
Cochranella sp. EF376119
Physalamus pustulosus AY226144
Xenopus tropicalis NM_203594
Pelophylax ridibundus AY072703
Xenopus tropicalis NM_203590
Hyla japonica AB199910
Scinax boesemani EF376108
Xenopus laevis AF079161
Xenopus laevis U00920
Polypedates maculatus JN681267
Bombina maxima GU597351
Xenopus laevis NM_001087442
Osteocephalus oophagus EF376098
Boa constrictor FJ645273
Gallus gallus NM_001277728
Hoplobatrachus tigerinus FJ769259
Rana catesbeiana AB286846
Xenopus tropicalis NM_001016692.2
Hyla sp. EF376092 Gallus gallus NM_205518
Xenopus tropicalis BC075438
Gallus gallus NM_205351
Gallus gallus L00677
Rana boylii JQ511853
Pleurodeles waltl AF482996
Rana pipiens JQ511820