Phygitalization and its effect on customer satisfaction...
67
Phygitalization and its effect on customer satisfaction and loyalty - The case of Sephora - - 1 MSc International Marketing & Brand Management 2016/2017 Keren Attas & Miranda Rincon Supervisor: Jens Hultman Examiner: Ulf Johansson
Transcript of Phygitalization and its effect on customer satisfaction...

Phygitalization and its effect on customer satisfaction and loyalty - The case of Sephora
- ! -1
MSc International Marketing & Brand Management 2016/2017
Keren Attas & Miranda Rincon
Supervisor: Jens Hultman Examiner: Ulf Johansson

I. ABSTRACT
Title: Phygitalization and its affect on customer satisfaction and loyalty - The case of Sephora
Key words: Phygitalization, in-store technology, Sephora, customer satisfaction, customer loyalty, repatronage, word of mouth, Technology Acceptance Model, Technology Readiness Model, brick-and-mortar,
Purpose: The purpose of this research was to explore the phenomenon of phygitalization and its effect on customer satisfaction and customer loyalty. The researchers specifically investigated the drivers of customer satisfaction and customer loyalty based on the usage of in-store technology. Moreover, the main objective was to find measurements to describe the perceived usage of in-store technology and further deduce the relationship between in-store technology, satisfaction and loyalty.
Methodology: The philosophical stance taken by the researchers was mainly inspired by a positivists approach. Since the study is carried out through a quantitative nature, the method contains assumptions that there are indeed true answers. However, it is difficult to only look at a positivists position because aspects from social constructivism also contribute to the study. Therefore, this research finds inspiration in post-positivists critical realists aspects and recognizes that observations are imperfect and the ability to know reality with certainty is critical. The research follows a deductive approach and applied quantitative methods for the data collection procedure.
Theoretical Perspective: The study concentrates on the field of phygitalization and the relevance of the phenomenon to customer satisfaction and customer loyalty. The researchers examined previous literature in the areas of marketing innovation, retail technology, customer satisfaction and loyalty as a form of establishing a measurement for the perceived usage of in-store technology and further analyse if the use of such technologies improve the customer satisfaction and loyalty in brick-and-mortars.
Empirical Data: The researchers applied a convenience sampling procedure for the data collection. A questionnaire was created in the form of a web-based survey and administered to online Sephora communities. The survey was available for 14 days, with a total of 119 responses. Following and in-depth analysis of data through IBM SPSS Statistic 23.
Conclusion: The researchers developed a model which enabled to explain the relationship between innovative in-store technology, customer satisfaction and customer loyalty. The researchers found five constructs acting as positive drivers of in-store technology for the purpose of this study. Furthermore, the relationship between in-store technology and customer loyalty was confirmed by finding showing that customer satisfaction leads to loyalty
- ! -2

II. Acknowledgements
First of all, we would like to thank our supervisor, Jens Hultman, for his structured guidance, valuable advice and for contributing to a great atmosphere during these past months. Moreover, this paper couldn't have been possible without the support of Tony Marañon and his dedication to quantitative research.
Lastly, we are sincerely thankful for the ongoing motivation, love, and support from the Attas and Rincon family. You never doubted our passion for cosmetics since day 1.
Merci, Gracias!
Keren Attas Miranda Rincon
- ! -3

III. TABLE OF CONTENTS IV. LIST OF FIGURES 5 ...........................................................................................................................
1 INTRODUCTION 6 ................................................................................................................................1.1 RESEARCH AIM 7 ..................................................................................................................................1.2 OUTLINE OF THE THESIS 8 .....................................................................................................................
2 THEORETICAL FRAMEWORK 8 .....................................................................................................2.1 THE CHALLENGE OF IN-STORE TECHNOLOGY 9 ...................................................................................... 2.1.1 MEASURING IN-STORE TECHNOLOGY 9 ...............................................................................................2.2 CUSTOMER SATISFACTION 12 ..................................................................................................................2.3 LINKAGE BETWEEN TECHNOLOGY AND CUSTOMER SATISFACTION 13 ...................................................2.4 CUSTOMER LOYALTY 14 .........................................................................................................................2.5 DEMOGRAPHICS 16 .................................................................................................................................
3 METHODOLOGY 16 .............................................................................................................................3.1 RESEARCH PHILOSOPHY 17 ....................................................................................................................3.2 VALIDITY, RELIABILITY AND REPRESENTATIVITY 17 ............................................................................3.3 SEPHORA 18 ............................................................................................................................................3.4 OPERATIONALIZATION 18 ........................................................................................................................3.5 MEASUREMENTS 19 ................................................................................................................................3.6 RESEARCH METHOD 20 ...........................................................................................................................3.7 DATA COLLECTION 21 .............................................................................................................................3.8 DATA PROCESSING 23 ............................................................................................................................
3.8.1 Linear Regression 24 .......................................................................................................................3.8.2 Spearman Correlation Analysis 24 ................................................................................................3.8.3 One-way ANOVA 24 ........................................................................................................................
3.9 RESEARCH METHODOLOGY LIMITATIONS 25 ..........................................................................................3.9.1 Data Collection 25 ...........................................................................................................................3.9.2 Direct and Indirect in-store Technology Evaluation 26 ...................................................................3.9.3 Type I and Type II error 26 ..............................................................................................................
4 EMPIRICAL RESULTS 26 ....................................................................................................................4.1 OVERVIEW OF GATHERED DATA 27 .........................................................................................................4.2 CREATING A MEASUREMENT FOR IN-STORE TECHNOLOGY 27 ...............................................................4.3 RELATIONSHIP BETWEEN IN-STORE TECHNOLOGY AND CUSTOMER SATISFACTION 28 ..........................4.4 FROM CUSTOMER SATISFACTION TO LOYALTY 29 ..................................................................................4.5 IMPACT ON REPATRONAGE AND WOM 29 ...............................................................................................4.6 AGE AS A MODERATOR 30 .....................................................................................................................4.7 NOTABLE RESULTS 30 .............................................................................................................................
5 DISCUSSION 32 ......................................................................................................................................5.1 THE ROLE OF THE FIVE CONSTRUCTS WITH IN-STORE TECHNOLOGIES 32 ..............................................5.2 IN-STORE TECHNOLOGY LEADING TO CUSTOMER SATISFACTION 34 .....................................................5.3 IN-STORE TECHNOLOGIES LEADING TO CUSTOMER LOYALTY 36 ...........................................................5.4 AGE 37 ...................................................................................................................................................
6 CONCLUSION 38 ...................................................................................................................................6.1 PHYGITALIZATION IN RETAIL 38 ...........................................................................................................6.2 THEORETICAL CONTRIBUTION 39 ...........................................................................................................
- ! -4

IV. LIST OF FIGURES
Figure 1: Phygitalization - Blending the physical and digital experience……………………….6 Figure 2: Two Factor Model by Söderlund (2006)……………………………………………..15 Figure 3: Created model to demonstrate the purpose of the study……………………………..20 Figure 4: Spearman correlation from the two clusters…………………………………………28
V. LIST OF TABLES Table 1: Sources and definition of used models………………………………………………..19 Table 2: Statistical Hypotheses…………………………………………………………………21 Table 3: Items and constructs used to measure the perceived usage of in-store technology…..23 Table 4: Results of Statistical Hypotheses…………………………………………………………..32
6.3 MANAGERIAL CONTRIBUTION 40 ............................................................................................................6.4 LIMITATIONS AND FURTHER RESEARCH 41 ............................................................................................
7 REFERENCES 42 ...................................................................................................................................
8 APPENDIX 54 ..........................................................................................................................................APPENDIX 1 - USAGE OF IN-STORE TECHNOLOGY SURVEY 54 .....................................................................APPENDIX 2 - NON-EXPERIENCED CONSUMERS: SPSS OUTPUTS 61 .............................................................APPENDIX 3 - EXPERIENCED CONSUMERS: SPSS OUTPUTS 64.....................................................................
- ! -5

1 INTRODUCTION In today’s changing economy, the retail industry is getting reinvented continuously. There is a constant development towards new technologies that are able to enhance retailer’s performance by optimizing the shopping experience (Pantano, 2014; Pantano & Di Pietro, 2012; Zhu., Sivakumar & Grewal, 2013). These new technologies are becoming strong drivers for brick-and-mortars and the early assumption that the internet was going to eradicate the brick-and-mortar industry is gone. Shankar, Smith and Rangaswamy (2003) categorize the use of in-store technology as a promising weapon. While current research mainly concentrates on either physical vs online, clicks vs bricks (Kumar & Ruan, 2006; Parsons, 2002; Perea & Monsuwé, Dellaert & De Ruyter, 2004) or integration of omnichannel (Piotrowicz & Cuthbertson, 2014; Wallstrom, Salehi-Sangari, Foster, Styven & Strandberg, 2017) this study focuses on the phenomenon of phygitalization and its effect on customer satisfaction and loyalty by better understanding the gap in the linkage of the digital and physical world in-stores. In the context of this study, the word phygital (from phygitalization) refers to the concept of synchronizing both physical and digital channels to create an enhanced shopping experience for customers (Vel, Brobbey, Salih & Jaheer, 2015). Lin and Hsieh (2011) explain the general concept of phygitalization, by bridging the physical store with technological information systems such as tablets and interactive kiosks. Throughout this paper, the term technology is used to refer to the innovative in-store technologies provided by retailers and perceived by consumers.
Previous studies have limit this new phenomenon by only looking at the integration of technologies to increase productivity and service delivery (Burke, 2002; Scherer, Wunderlich & Von Wangenheim, 2015). This is evident in the case of self-service technologies (SSTs) and the view of customers as “partial employers” (Meuter, Bitner, Ostrom & Brown, 2005). In contrast to SSTs, phygitalization accounts for the technologies used at the physical store to offer a personalised and unique experience in a real retail context. Digital technologies act as an interactive vehicle where customers can engage directly in-stores.
! Figure 1: Phygitalization - blending the physical and digital experience
- ! -6

The tangible (Babin, Darden & Griffin, 1994) and physical environment from the consumers point of view plays an important role in the perception of the usage of in-store technology (Baker & Wakefield, 1998). Environmental psychology research has repeatedly proven that the perceived physical environment influences approach avoidance behaviour, such as the desire to stay in a place (Donovan & Rossiter 1982; Hui & Bateson, 1991). Elements such as layout, interior architecture and decor are important determinants of patronage behaviour (Bellenger, Greenberg & Robertson, 1977; McGoldrick & Thompson, 1992). In-store researchers support the linkage between the physical environment and the emotional responses towards the retailer (Baker & Wakefield, 1998, Bloch, Ridgeway & Dawson, 1994; Kowinski, 1985).
Looking at the managerial contribution from the consumer perspective, these innovative technologies improve the services offered in retailers through different strategies. Previous research emphasizes the fact that over 75% of participants have had a positive perception towards the use of innovative technologies to generate a pleasant atmosphere (Sîrbu, Saseanu & Ghita, 2015). In this sense, technology adds extra value to the overall customer satisfaction (Tyrimou, 2015). For the purpose of this research, the researchers have chosen to follow the use of innovative technologies in the cosmetic industry. Since these new services options bring flexibility to consumers (Lin & Hsieh, 2006), beauty companies have realised that the use of technology needs to be an essential part of the core strategy (Tyrimou, 2015). Furthermore, a new approach is given to phygitalization, by connecting a hedonically and sense related store environment with technological features, and therefore challenging the aspect of the customer satisfaction within the cosmetic retailers.
1.1 Research Aim
This study is aiming to deeper analyse the consumers point of view on the usage of in-store technology and to further understand the contribution of those technologies on consumers. The relevant constructs for the purpose of this research can help determine where customer satisfaction is succeeding and where it needs improvement by measuring how the products and services supplied by a retailer meet, surpass or fail customers expectations (Inside CXM, 2016). The method used in this thesis provides new insights into the potential of studying phygitalization and opens the door for researchers and practitioners to the possibility of measuring the perception of in-store technologies from consumers, and the benefits that may be obtained from such technologies. As an overall research aim of this study, the customer satisfaction will be measured in relation to the usage of the in-store technology. Therefore, the first research question will be the following:
How does the usage of in-store technology affect the customer satisfaction?
- ! -7

Previous research has acknowledged there is a strong relationship between customer satisfaction and loyalty (Gronholdt, Martensen & Kristensen, 2000). Furthermore, studies have shown the impact of satisfaction on behavioral intentions in the service industry, and pointed out that customer satisfaction had a positive influence on loyalty, especially on the repurchase intention and likelihood of recommending (Lin & Hsieh, 2011). Based on the following, the researchers of this study deduce that a linkage can be inferred between the usage of in-store technology and the customer loyalty. Accordingly, the second research question is as follows:
How does the usage of in-store technology influence the customer loyalty?
1.2 Outline of the Thesis
In order to answer these research questions, the second chapter presents theories that help better understand the purpose of this thesis by introducing a theoretical framework. Based upon preliminary studies, hypotheses and a model were constructed for measuring the usage of in-store technology. The third chapter of this study elaborates on methodological considerations that were taken into practice and argue for the research design that the study followed. Lastly, the fourth chapter presents the empirics, resulting in the tests and analysis of the hypotheses. The study ends with a discussion of the results and a concluding chapter, which consists of the researcher's conclusions with the implications of the study and suggested future research is presented.
2 THEORETICAL FRAMEWORK
The following chapter introduces relevant theory about in-store technology. This theory can be used to further understand the relevance of phygitalization and elaborate on the relationship between in-store technology, customer satisfaction and customer loyalty. A linkage between customer satisfaction and loyalty has already been shown by previous literature and can be undertaken (Gronholdt, Martensen & Kristensen, 2000; Bitner, 1990; Bloemer, Pauwels, Kasper, 1996; Bloemer & Kasper, 1995). Difficulties arise, however, when an attempt is made to positively link in-store technology and customer satisfaction. Based on previous literature, the researchers crafted a model to better illustrate the impact of in-store technology on customer satisfaction and loyalty and strengthen the theoretical basis between the three concepts to further support their relationship. Research hypotheses are formulated and supported by the theory presented. Therefore, this chapter will consist of different research hypotheses as a statement of expected or predicted relationship between the variables. In order to test the Research hypotheses
- ! -8

presented, statistical hypotheses will be elaborated in the methodology chapter. In this sense, the researchers will be able to test the results with the goal of meeting the research aim of this thesis.
2.1 The Challenge of in-store Technology
Digital in-store materials, such as technological tools and devices are commonly used to add value in order to create a vivid store environment (Bäckström & Johansson, 2006). With their variety of sense linked products (smell, touch, feel) cosmetic retailers impact the customer experience by affecting their senses and subsequently their emotions. This new perspective of connecting a hedonically and sense related store environment with technological features is giving a different approach to the shopping experience and therefore challenging the aspect of the customer satisfaction within the cosmetic retailers. However, not only hedonistic aspects can contribute to an optimal shopping experience. Parise, Guinan and Kafka (2016) have shown that real time technology delivered content in-store results in a closer, more personal and emotionally stronger relationship between the consumer and the store. They furthermore introduced in their study, the concept of the crisis of immediacy (2016), which refers to the need for consumers to receive technological content, expertise and personalised solutions in real time during the shopping experience. Hence, it could be argued that digital touch points available in-store, enable an easier and simplifying decision-making process for customers, which creates a new way of product interaction and shopping experience (Sîrbu et al. 2015; Parise et al. 2016).
2.1.1 Measuring in-store Technology
In order to measure the perceived usage of technology, Davis’s Technology Acceptance Model (TAM) (1986) is considered to be the most important and powerful model (Park & Kim, 2014; Lee & Lehto, 2013). TAM explains that perceived usefulness and perceived ease of use influence the behaviour of consumers towards technology (Childers, Carr, Peck & Carson, 2001; Weijters, Rangarajan, Falk & Schillewaert, 2007; Kim & Forsythe, 2008). Although the TAM model is helpful to better understand technology acceptance, it offers little towards the understanding of the extent to which the resulting customer perception and behaviour can affect the adoption of technology (Lin and Hsieh, 2011). Therefore, the study from Lin and Hsieh (2011), which conceptualized a deductive and inductive multiple scale approach seems to be more accurate for the purpose of this research. In order to examine key factors influencing technology service quality, Lin and Hsieh (2011) presented the technology readiness (TR) of the consumers, which refers to people’s propensity to embrace and use new technologies (Parasuraman, 2000).
To better understand the antecedents and consequences of consumer assets to technological related tools, Lin & Hsieh (2011) took the customer’s technology readiness into account in order
- ! -9

to accurately predict the perception and behaviour of customers to adopt, use or evaluate in-store technological tools and any consequent influence on their behaviour (Lin & Hsieh, 2011). According to Lin and Hsieh (2011), the TR construct can be viewed as an overall state of mind that determines a person’s predisposition towards technologies (2011). Based on Parasuraman (2000), the constructs describe four dimensions driving the TR: optimism, innovativeness, discomfort and insecurity. The first two dimensions are encouraging customers to use technological tools and to hold a positive attitude towards technology. While discomfort and insecurity are negative drivers, making the consumer reluctant to use technology (Lin & Hsieh, 2011). The four phases of scale development employed by Lin and Hsieh (2011) resulted in seven factors comprising 20 quality items which affect the perceived technology service related quality of electronic services regardless of the industry. According to Radomir and Nistor (2012), the seven final quality dimensions are described as follows (adapted from Lin and Hsieh, 2011): Functionality, Enjoyment, Privacy/Accuracy, Assurance, Convenience, Design and Customization. For the purpose of this research, the study will analyze only the five most relevant factors in regard to the perceived usage of in-store technology. Each measurement will contribute to the consumer’s perception of in-store technology.
The first measurement, functionality, is referring to the extent, to which consumers find the innovative technology clear, fast and efficient. This factor can be compared to the perceived usefulness factor presented in Davis’s TAM model (1986). The functionality construct can be analysed by understanding how individuals feel when presented with the choice of interacting with a certain type of technology. This is confirmed by studies that indicate customers usually focus on the potential benefits the technology has to offer (Meuter et al. 2000; Burke, 2002; Parasuraman, Zeithaml, and Malhotra 2005). The in-store technology must provide consumers with immediate and tangible benefits. Furthermore, functionality also involves the manner in which the service is delivered (Grönroos, 1982). Thus, the objective is to have technologies that are easy to use and require the minimum effort of implementation. In order to have an in depth analysis of functionality, the researchers compile the following items based on previous literature: efficiency, speed, benefit, and value. These items will allow to further explain the relationship of functionality with in-store technology.
Secondly, Grönroos (1982) explains enjoyment as the extent to which customers perceive the technology service to be interesting and useful as well as providing a positive feeling towards the use of that technology. The enjoyment construct accounts for the hedonic aspect of interacting with in-store technology. This construct has already been classified as an influencer for technology usage (Davis, Bagozzi, and Warshaw 1992). Thus, customers will be examined through their perceptiveness of enjoyment while using in-store technology. The items that will
- ! -10

compose enjoyment are discovery, inspiration and fun. Up to now, several studies have revealed the significant effect of the fun item as a positive influencer towards the use of technologies (Childers et al. 2001; Dabholkar and Bagozzi 2002; Dabholkar, Bobbitt, and Lee 2003). Consequently, the researchers propose that customers who demonstrate a certain level of enjoyment while interacting with in-store technology are likely to perceive it as more positive. Building on that, the third factor, convenience, refers to the extent to which the technology based service is considered convenient and easy to use for customers. Literature in retailing environment has shown two main factors in delivering convenient service to customers: time-saving and minimization efforts (Etgar, 1978; Kotler and Zaltman, 1971; Seiders et al., 2000, 2005; Yale and Venkatesh, 1986). The time-saving aspect of convenience has been researched in consumer literature, particularly in regard to consumers reaction to waiting time (Gehrt and Yale, 1993). According to Berry, Seiders and Grewal (2005) the concept of effort-saving refers to the minimization of physical, and emotional activities that consumers must take to purchase goods. Furthermore, Seiders, Berry and Gresham (2000) have argued that the emphasis customers place on convenience has encouraged retailers to redesign store operating systems. Based on the previous, the researchers of this study will further analyze the major items taken from literature such as simplicity, flexibility, effort and consistency.
The fourth construct chosen for the purpose of this study is the design, which according to Lin and Hsieh (2011) relates to the extent to which the technology based service is aesthetically appealing and relies on cutting edge technology. Terms such as originality, innovativeness and appearance are commonly used to describe design within in-store technology (Design Retail Online, n.d.). Studies have also shown that, well-designed context could speed up adoption of features and improve the end user experience (Liua, Zhua, Holroydb & Seng, 2011).
The last item to be descripted is customization, which relates to the degree to which the technology addresses the customer's specific needs (Gunasekaran & Sandhu, 2010). In customization, the focus is to offer increased options and services for product customization and provide a personalized experience (Lewis & Loker 2017). Research suggested that customization is central to customers' expectations and perceptions of quality (Fornell, Johnson, Anderson, Cha & Bryant, 1996). Therefore, in order to have a deeper understanding of the construct of customization, the unique benefits provided by customization, the discovery of new products and the needs will be further analyzed in the context of in-store technology. In support of the above mentioned the following research hypotheses were crafted:
H1: Functionality has a relationship to the usage of in-store technology by the consumer.
- ! -11

H2: Enjoyment has a relationship to the usage of in-store technology by the consumer.
H3: Convenience has a relationship to the usage of in-store technology by the consumer.
H4: Design has a relationship to the usage of in-store technology by the consumer.
H5: Customization has a relationship to the usage of in-store technology by the consumer.
2.2 Customer Satisfaction All the experiences a customer has with a brand, a product or even a company over a duration of time are covering the terminology of customer experience. The customer experience is determined by a complex mix of touch points to the brand, and how the retailer engages with each user in terms of providing immediate, personalised, and emotional content will determine its success (Parise et al. 2016). However, customer experience is a broad term and hardly measurable. In this section and later on in the study, the focus will be on the term customer satisfaction, which by contrast to customer experience, is more measurable in scope. Based on a comparative article of the two terminologies, it can be explained that customer satisfaction aims to better understand if customers are pleased with a product, a service or a brand and can further contribute to whether or a not a seamless customer experience has been delivered (Inside CXM, 2016). According to several studies (Cronin, Brady & Hult, 2000; Rust & Oliver, 1994) satisfaction reflects the degree to which a consumer derives positive feelings from a service. Satisfaction has been measured through different sets of attributes throughout the past 40 years. Petterson and Smith (2003) focused on the overall quality, perceived reliability, needs fulfillment, overall satisfaction, repurchase intentions and recommendation. Whereas, Yüksel and Rimmington (1998) looked at the perceived performance and predicted expectations. Churchill Jr and Surprenant (1982) focused on the perceived expectations, performance and disconfirmation. McKinney, Yoon and Zahedi (2002) studied usefulness, entertainment, understandability, reliability, access, and interactivity. Among the most popular measurements of customer satisfaction, two approaches are widely employed (Yang & Peterson, 2004). The first approach is the transaction specific approach, which according to Oliver (1999) defines the satisfaction as an emotional response by the consumer to the recent experience with an organisation. The second approach is the overall satisfaction perspective, that perceives customer satisfaction in a cumulative evaluation of specific products, services and facets of the firm (Yang & Peterson, 2004) often considered by researchers to be primarily a function of perceived service quality (Cronin Jr & Taylor, 1992; Parasuraman, Zeithaml & Berry, 1988).
- ! -12

2.3 Linkage between Technology and Customer Satisfaction
Different studies have shown that a link between information technology-based services and satisfaction can be demonstrated (Zhu et al., 2002; Cronin and Taylor, 1992; Dabholkar, Thorpe & Rentz, 1995; Oliver, 1993). Consequently, the positive assumption that higher perceived service quality leads to higher customer satisfaction was established (DeLone and McLean 1992, 2004). Studies about quick response technology-based attributes (Kincade, 2016) showed a positive impact of consumer’s perception of QRT used in retail stores on customer satisfaction. Similar studies in the retail context, investigated the role and the effectiveness of digital signage (screen displays in public or in-store showing videos) used for many purposes such as including advertising, provision of news and community information, and enhancement of image (Dennis, Brakus & Alamanos, 2013). This type of displaying has demonstrated to have a positive effect on shopper’s approach behaviors and their buying intentions. Moreover, it also shows an effective stimulus, adding to positive perceptions of the retail environment and emotions (Dennis et al., 2013).
The service management literature further argues that customer satisfaction is the result of a customer’s perception of the value received in a transaction or relationship, where value equals perceived service quality relative to price and customer acquisition costs (Blanchard & Galloway, 1994; Heskett, Sasser & Hart, 1990). As mentioned earlier, the TR constructs can determine a person's predisposition towards technology and play a vital role for studying the perception and behaviours of customers (Lin and Hsieh, 2011). Liljander, Gillberg, Gummerus, van Riel (2006) and Yen (2005) indicated a customer with greater attitude, ability, and willingness to adopt technology would be more likely to enjoy and express satisfaction with those type of technologies. Based on the above studies, the researchers hypothesised the five chosen TR constructs will influence the customer satisfaction level.
H6: The usage of in-store technology has a relationship to customer satisfaction.
Moreover, customer satisfaction is a major driver of customer retention (Anderson, Fornell & Mazvancheryl, 2004; Weijters et al. 2007). Based on this fact the researchers integrated satisfaction as an important outcome of the usage of in-store technology and as a key tool for finding customer’s loyalty. Other relevant literature is found in the marketing domain, where the impact of customer satisfaction on customer loyalty is discussed. In Yi and Zeithaml’s critical review of customer satisfaction (1990) they conclude that many studies found that customer satisfaction influences purchase intentions as well as post-purchase attitude (Hallowell, 1996). According to Fornell (1992) success and failure for customer satisfaction are evaluated primarily by changes in customer retention. In other words, customer satisfaction can be measured through
- ! -13

patronage switching, a more common pattern of loyalty, which leads us to the next measurable variable, the customer loyalty.
2.4 Customer Loyalty
According to Söderlund (2006), customer loyalty makes reference to the customer’s relationship over time towards one specific object, such as a vendor, a brand or a service supplier. Loyalty intentions are various. Walsh, Evanschitzky and Wunderlich (2008) define three popular conceptualizations of loyalty as an attitude that influences a relationship with a brand, product or service. He indicates the following: revealed behavior; buying behavior moderated by individual characteristics and circumstances, and the purchase situation. Other authors, such as Oliver (1999), define loyalty as a deeply held commitment to rebuy or repatronize a preferred product or service consistently in the future. Whereas, Čater & Čater (2009) suggest loyalty as a construct that measures the probability that customers will return. Different studies have been conducted on how to measure the link between customer satisfaction and customer loyalty (Homburg & Giering 2001). The relationship between satisfaction and loyalty has been pertaining by literature. Bitner (1990) pursued an empirical evidence of a positive relationship between customer satisfaction and loyalty, which confirms the traditional view about the relationship which indicates towards a direct relationship. Thereby, when increasing customer satisfaction, the loyalty increases too. He demonstrated that satisfaction has an indirect effect on loyalty, which is mediated by the perceived quality.
Elaborating on the perceived quality, other models have defined customer satisfaction through this constructs. For example, the basic ECSI model links customer satisfaction to customer loyalty through its determinants, such as perceived company image, customer expectations, perceived quality and perceived value. Gronholdt, Martensen & Kristensen (2000) and Bloemer et al. (1995) had a different approach to customer loyalty by highlighting that involvement has a positive moderating effect on the relationship between satisfaction and loyalty. Heskett, Jones, Loveman, Sasser and Schlesinger (1994) argue by explaining the service-profit chain. This is where the relationships between profitability, customer loyalty, employee satisfaction, loyalty, and productivity come together and contribute to loyalty as a direct result of customer satisfaction.
To further emphasize the strong linkage between customer satisfaction and customer loyalty, Söderlund (2006) argues that customer satisfaction is the most frequently used loyalty predictor and subsequently a determinant of loyalty. It can be distinguished between two main loyalty dimensions; loyalty as a behaviour and loyalty as a mental state (Runde-Thiele & Mackay, 2001). According to Söderlund (2006), loyalty as a behaviour includes customer share
- ! -14

(Baumann, Burton & Elliot, 2005; Pine, Peppers & Rogers, 1995), frequency of visits (Bolton, Kannan & Bramlett, 2000), level of cross-buying (Gremler & Brown, 1999; Rundle- Thiele & Mackay, 2001) and the duration of the relationship (Bolton, 1998; Gremler & Brown, 1999; Rundle-Thiele & Mackay, 2001). While loyalty as a mental state examines loyalty in terms of attitudes (Day, 1969; Dick & Basu, 1994), preferences (Pritchard, Havitz & Howard, 1999; Rundle-Thiele & Mackay, 2001), commitment (Backman & Crompton, 1991) and intentions (Zeithaml, Berry & Parasuraman, 1996). Retail literature argues in favor of customer satisfaction being related to customer loyalty. Macintosh and Lockshin (1997) state that store satisfaction is defined as the customer's overall evaluation of the store experience. Rust and Zahorik (1993), Cronin Jr and Taylor (1994) and Parasuraman et al. (1994) studies confirm and contribute to the retail literature that store satisfaction leads to store loyalty. Therefore, the researches expect satisfaction to have a positive relationship with loyalty:
H7: Customer satisfaction through the usage of in-store technology has an effect on the level of customer loyalty.
However, literature has shown, that the majority of all measurement approaches include mental state aspects of loyalty and not behavioral aspects. Thus, repatronage intentions and word of mouth intentions are the most noticeable loyalty in existing literature referring to the mental state aspect of loyalty (Andreassen, 2001). Both have demonstrated a greater result of loyalty measurement when presented as two separate factors as it can be seen on figure 2. According to Söderlund (2006) the main reason for that is because both behaviors refer to different constructs.
- ! -15
Figure 2: Two factor Model by Söderlund (2006)

On the one side, repatronage has to do with physical action of moving one’s body in order to get in contact with a supplier again, while word of mouth behavior has to do with communicating with others. Additionally, the two constructs refer to different audiences. Repatronage describes the customer’s direct implications for the patronized supplier’s revenues. In the retail context it defines the rebuying intentions, whereas word of mouth intentions refer to people in the customer’s social environment (Söderlund, 2006). Based on that, loyalty is demonstrated differently throughout the various constructs. Hence, the following hypothesis will be tested:
H8: Customer satisfaction has a different impact on repatronage and word of mouth.
2.5 Demographics
The study of demographics is acknowledged for generating insightful data for understanding marketing strategies (Mittal & Kamakura, 2001). Simon and Usunier (2007) concluded age as a dissatisfaction factor due to consumers who strictly preferred employee contact over SSTs. People that grew up with constant access to the internet differ to the older generations who might still prefer the traditional shopping experience (Piotrowicz & Cuthbertson, 2014). Studies have indicated that the acceptance level of technology could be justified by the difference of generations (Goodwin and McElwee, 1999). Thus, is important to understand how technology usage varies across segments to gain a deeper understanding on the effect it has on all generations of consumers. An important generation of consumers of this past decades is the millennials. Since they have come of age during a time of technological change (Millennials Infographic, 2017). They are the first generation of digital natives, with a strong affinity for technology. Thus, it could be assume that young customers have a greater positive incline towards in-store technology.
H9: There is a difference in the perceived usage of in-store technology between the younger and older consumers.
3 METHODOLOGY
The following chapter begins with the research philosophy and the reasoning behind the method chosen. The standard null hypothesis testing method is used, meaning that each of the hypothesis will be tested and can only be accepted after demonstrating there is a statistically significant result that contradicts the null hypothesis. Each hypothesis will be classified as H1-H9 and the alternative will be H1a-H9a. This chapter continues with a presentation of the techniques used to collect the data and the procedures followed to analyse it. The researchers end the chapter with the limitations of the chosen design.
- ! -16

3.1 Research Philosophy
The philosophical stance taken by the researchers is mainly inspired by a positivists approach. Since the study is carried out through a quantitative nature, the method contains assumptions that there are indeed true answers (Easterby-Smith, Thorpe & Jackson, 2015). The purpose of the theory previously provided is to contribute with answers to the hypotheses that can further be tested and thus, result in explanations that can be generalized for further retailers (Bryman & Bell, 2015). However, based on the dual nature of this study, there is also a need to further look at some aspects of social constructivism. Due to the fact that this study examines loyalty (word of mouth and repatronage) in the retail industry, their behaviour can be seen to reflect society as a whole. Moreover, it is difficult to only look at a positivist position, which is the most common for quantitative research, because loyalty and more specifically word of mouth is a constructed social phenomenon (Parrot & Ohashi, 2010). Therefore, this research also finds inspiration from post-positivists critical realists aspects and recognizes that observations are imperfect and the ability to know reality with certainty is critical (Trochim, 2006).
3.2 Validity, Reliability and Representativity Validity accounts for the appropriateness of the measures to asses the construct it aims to measure (Burns & Burns, 2008). In other words, validity is the extent to which measures and research findings provide accurate representation of the things they are supposed to be describing. In order to assure the internal validity of the study and the proper measurement of what needed to be measured, the researchers used an online questionnaire measuring the concepts: perceived usage, the satisfaction, the loyalty and its two constructs, repatronage and word of mouth. Furthermore, external validity needs to be guaranteed. External validity is relevant, since it aims to ensure representativeness and valid generalisations over bigger population (Easterby-Smith et al. 2015). However, since the researchers are analysing a set target population through a convenience sampling, the external validity cannot be applied to people beyond the sample in the study. A representative sample can be identified since it resembles the Sephora online community that is important for the conducted research. Reliability refers to the extent to which the study can be repeated while getting similar results (Brymann & Bell, 2003). In order to provide a good quality of the study, the representativeness of the sample needs to be guaranteed. The representativeness is also important in order to ensure solid data and empirically bounded claims about in-store technologies and their contribution to the customer satisfaction and loyalty.
- ! -17

3.3 Sephora
The phenomenon of phygitalization will be further developed through the use of an instrumental case. In order to make the link between in-store technology, customer satisfaction and loyalty more tangible, the researchers decided to use the empirical context from the online Sephora community. With an active community of 20 million loyalty program members, who shop on a daily and weekly basis, Sephora has been recognized as a true market leader (Keenan, 2017). Sephora is bridging the line between digital and physical while still mainly focusing on the brick-and-mortar store conceptualization. Beauty enthusiasts are offered with a fully integrated experience where technology serves as a mechanism to deliver personalised and interactive products in real time. The CEO of Sephora Americas, Calvin McDonald, assures their goal is to create demand through emotional relationships that will result in long-term loyalty. In order to do so, Sephora revolutionized the consumer experience with an interrelated channel merging digital to physical. The store provides digital beauty workshops with video tutorials for learning new beauty techniques and aesthetics suggestions for the eager clientele. Even though the tutorials are held in-store, the interaction with the brand continues outside the store. Thus, strengthening the connectivity towards the brand (McDonald, 2007; Keenan, 2007). Consumers can also find inspiration through the Virtual Artist 3-D tool which allows users to digitally play and try on any product through their mobile phones. This tool was mainly created digitally but is also seen in-stores with the digital selfie mirrors where consumers are able to try any product and send the photo via social media. The physical store is digitally connected at all levels by incorporating the full spectrum of innovative technologies to create a differentiated and unique in-store experience (Menon, 2016). The inclusion of augmented reality allows consumers to find tailored products by using the fragrance, color and skin IQ device. Moreover, product information can be easily found by placing the item on any of the strategically connected screens and precise scenarios. At the exit of the store, consumers can pass by the “Mini-Beautic” vending machine where they can receive the well sought samples straight away (Menon, 2016). As it can be seen, Sephora is building a strong community of beauty enthusiasts through the in-store experience. Moving away from traditional retailers and transforming the brick-and-mortar store experience in cosmetic retailing.
3.4 Operationalization Basing our approach on the technology readiness model (TR) of the consumers, the researchers identify five main measurable constructs in order to measure the perceived usage of in-store technology: functionality, enjoyment, convenience, design and customization. These constructs will help justify to what extent in-store technologies are positively/negatively perceived by consumers. As the most commonly used mental state aspects of loyalty, repatronage (repeated purchase intention) and word of mouth have demonstrated a greater result of loyalty
- ! -18

measurement when presented as two separate factors. Due to the fact that they are not striving to describe the same construct as one is physically and the other is socially related (Söderlund, 2006). In that sense, based on the two factor model of Söderlund (2006) a reviewed two factor model has been established, in order to measure the effect of the satisfaction on loyalty separately. Additionally, it will allow to define if the satisfaction may or may not impact the two loyalty intentions with the same strength.
3.5 Measurements
The proposed model is an adaptation of Söderlunds two factor model (2006). It explains the relationship between innovative in-store technology, customer satisfaction and customer loyalty. In order to provide greater insight about the usage of in-store technology in terms of generational aspects and affinity, two different age groups were selected. The reviewed model suggested allows us to further measure (1) the effect of in-store technology by studying the five constructs: functionality, enjoyment, convenience, design and customization; (2) the degree to which these five constructs describe the usage of in-store technology by the consumer; (3) determine whether these five constructs have an effect on customer satisfaction; and (4) define the degree of loyalty due to the use of in-store technology. The degree of loyalty is further divided into the two most consistent common loyalty intentions, repatronage and word of mouth.
- ! -19
Table 1: Sources of models
Models Source Definition
Technology Readiness Model (TR)
Lin & Hsieh, 2011
Explains people’s propensity to embrace and use new technologies for accomplishing goals in home
life and at work.
Two Factor Model
Söderlund, 2006
Explains the relationship between the determinants of customer satisfaction and customer loyalty by separating customer loyalty into two constructs:
word of mouth intentions and repatronage intentions.

3.6 Research Method
In view of this study purpose, research questions, and time frame, the researchers decided to adhere a convenience sampling technique. A convenience sampling method involves the selection of participants due to their accessibility and convenience (Burns & Burns, 2008). Therefore, the researchers collected data from respondents conveniently available on online Sephora communities. This delimitation of the empirical material was based after cautious exploration leading to the conclusion that the time horizon and budget for the study was not manageable for a random sampling technique and thus not appropriate for probability sampling. Following this method, the researcher were able to quickly capture the data needed for the study. In order to obtain the most scientific results, the target population was set to the dedicated online Sephora community. By following this sampling technique, the researchers are aware the data obtained may not lead to generalizable information (Burns & Burns, 2008). However, the benefits of the study lay on the foundation of potential relationships between the usage of in-store technology, customer satisfaction and loyalty. In the previous theoretical chapter, the research hypotheses were introduced. However, in order to find significant results, the research hypotheses were transformed to statistical null (e.g H1) and alternative hypotheses (e.g H1a).
- ! -20
Figure 3: Created model to demonstrate the purpose of the study

3.7 Data Collection
Given the purpose of the study, the data will be collected through a quantitative research design in the form of a web-based survey. The survey was developed (see appendix 1) and pre tested four times to ensure that the questions were understandable and feasible. In order for the researchers to increase the reliability of the study, the administration of the survey was standardized (Burns & Burns, 2008). Participants responded to a four point Likert scale anchored at “strongly disagree” (1) and “strongly agree” (4) which is used to represent people's attitudes to a topic based on a questionnaire (Burns & Burns, 2008). The Likert scale will help to define the level of agreement or disagreement for a series of statements and questions regarding the pre
- ! -21
Table 2: Statistical Hypotheses

defined items. Thus, this range will capture the intensity of their feelings for technology, satisfaction and loyalty.
The questionnaire used for the purpose of this research is aiming to better understand the usage of in-store technology for the cosmetic industry and more specifically the Sephora consumer. As mentioned in chapter 3.2, Sephora is used as an instrumental case. The set of questions provide general knowledge about the perceived usage of in-store technology and its effect on satisfaction and loyalty. Therefore, this questionnaire can be used as a base for further research in the field of phygitalization. In the first section of the questionnaire, respondents were briefly asked about demographics such as age, gender and education. Furthermore, in order to have a better insight about the shopping behaviour, the researchers asked questions about the average monthly cosmetic retailer visit. After showing a brief video about the in-store technology at Sephora, the respondents had to specify whether they had previously interacted with the in-store technology or not. After doing so, the survey was redirected and divided into two parts, with specific questions for the experiences users and non-experienced.
To evaluate the potential differential impact of the cosmetic industry in the sample of this study and in order to guarantee the representativeness of it, the sample was split into two clusters. The researchers differentiate between the consumers that have previously interacted and experience in store technology and the ones that haven’t. The two clusters will help define, whether or not the in-store technology affect the customer satisfaction differently. The first part of the survey targeted the respondents that have previously interacted with in-store technology at Sephora. In order to measure the innovative in-store technology, questions were formulated based on the five constructs adopted from the TR model of Lin and Hsieh (2011). Additionally, the last section of the survey contains questions regarding the customer satisfaction and loyalty. These questions serve as a vehicle for connecting the in-store technology to the customer satisfaction. Thus, allowing the researchers to analyse the relationship between the five constructs, satisfaction and loyalty. In this context, the five constructs will be grouped together to form the measurement for in-store technology. The second part targeted those who have not experienced any interaction with in-store technology at Sephora. The same set of questions from the first part were adjusted to the second group. The questionnaire was filled out by participants from the Sephora Community, beauty enthusiasts groups and pages on Facebook such as Sephoraddict and Play by Sephora. The aim was to obtain the biggest sample size as possible, capturing variety within the loyal community. Based on existing theory, the study will emphasize mainly on a deductive approach. Thus, finding the degree in which innovative in-store technologies take a role in the customer
- ! -22

satisfaction and moreover in the customer loyalty. Each of the loyalty patterns, the repeated purchase intention and the word of mouth intention will be described by several items. The data collected is going to serve to further understand the role of in-store technology and the relationship to consumer’s satisfaction and loyalty. The relevant constructs and the items, that will be measured for this study can be seen down below:
3.8 Data Processing
The data set will be analyzed using IBM SPSS Statistic 23 following a simple linear regression technique, spearman correlation analysis and ANOVA.
- ! -23
Table 3:Items and constructs used to measure the perceived usage of in-store technology.

3.8.1 Linear Regression Since the purpose of the study is to estimate whether one variable affects the other, a simple regression will be used to deduce the correlation between innovative in-store technologies and customer loyalty. Three different factors will serve as regression variables: The independent variable will be technology, the dependent variable will be loyalty and the intervening variable will be the customer satisfaction.
3.8.2 Spearman Correlation Analysis The researchers chose to execute an Spearman correlation analysis since the Pearson correlation accounts for changes in one variable associated with a proportional change in another variable. However, this study evaluates relationships between ordinal variables thus the variables tend to change together, but not necessarily at a constant rate (Burns & Burns, 2008). In order to deduce whether each of the items is positively related to the usage of in-store technology a bivariate analysis was conducted. This analysis enables to compare variables in order to seek understanding of their relationship (Bryman & Bell, 2013). In order to construct a single item that can be used as an indicator, the researchers compute the items from each construct and form averages (mean) based on the data collected from the Likert scale (1 = strongly disagree, 2 = disagree, 3 = agree, 4 = strongly agree). When computed, each construct defines an attitude, such as for example, the perceived functionality of the in-store technology. In the questionnaire used on this, each item was linked to a question. In the example of functionality, the questions assessed the respondent's likelihood towards the functionality and were annotated as follows: EX_function1, EX_funtion2, EX_function3, EX_function4, EX_function5. The computed construct for functionality was formulated under the name of: Average_function by adding all the items from the construct and dividing them by the amount of items. This computing approach was done for each construct. To test H1, the researchers assigned the variables as: Average_functionality and Technology. In the case of H2, the variables assigned were Average_enjoy and Technology. Continuing with H3, the variables are Average_conv and Technology. In the case of H4, the variables are Average_Design and Technology. To test H5, the variables are Average_Custom and Technology.
3.8.3 One-way ANOVA After carefully assessing hypotheses 1-8, a further analysis was implemented to differentiate whether age serves as a moderating role. A one-way ANOVA consists of only one independent variable which is later splitted into two categories. This analysis seeks to indicate if there are significant differences between the categories of the independent variable on the dependent variable (Burns & Burns, 2008). In this case, the independent variable is age, this will then be splitted into younger and older consumers. This is done with the purpose of finding if there is
- ! -24

any significance between these two groups on the usage of in-store technology. In this case, it is important to take into consideration the means for each of the age groups, since if there are significant results the researchers need to have some awareness of where the significant differences between the means may lay (Burns & Burns, 2008). Moreover, the test of homogeneity of variance will help check that the homogeneity assumption has not been violated. The objective is to find that the variance within each of the age groups is equal. Bearing in mind Goodwin and McElwees’ findings (1999), in which the acceptance level of technology could be justified by the difference of generations, the researchers decided to classify one group as the millennials, born between 1980 and 2000 (Millennials Infographic, 2017) and one group before the millennials resulting in the following division: Younger respondents <37 and Older respondents >37.
3.9 Research Methodology Limitations
While carrying out the study there were some limitations due to the research design and method chosen. In the following sections, the limitations that came up while conducting the study are presented.
3.9.1 Data Collection
One of the important aspects of this research is that it relies on a survey based data collection (data mining) from the Sephora Community. There are existing limitations put in place by the Sephora Community website. Since this community is very active, on an hourly basis, hundreds of questions and advices are being asked and given. In order for community members to see the survey, the researchers had to repost the survey twice a day, once in the morning and once in the evening, on top of the Sephora page. Furthermore, the large amount of subgroups, initially created by Sephora (ask the experts, beauty insider, makeup, skincare, fragrance, hair, bright ideas, etc.) made it difficult for the researchers to find the most likely subgroups to post the survey. Additionally, to the Sephora Community, the Facebook Sephora communities were activated. Those communities are country/region, interest or language related. The survey was uploaded on those Facebook pages and groups as well. However, the Facebook platform is less controllable since anyone could potentially join the group, whereas for the Sephora Community an account is needed. The researchers carried out the study with the workable data obtained for the objective of this thesis. However, cautions must be applied, as the findings are delimited to this sample size. This research was conducted in a limited time frame. The overall data was collected during 14 days. Under ideal circumstances more time could be spent gathering data, however, the researchers believe that this time limitation does not impact the outcome of the results, since validity was guaranteed throughout the entire procedure of the data collection.
- ! -25

3.9.2 Direct and Indirect in-store Technology Evaluation The sample of this study is composed of experienced and non-experienced consumers in relation to the usage of in-store technology. In previous literature, this type of set is commonly used to measure the direct and indirect consumer experience (Hamilton & Thompson, 2007). It has been proven that direct product experience versus indirect experience results in different preferences and perceptions. Therefore, information that has been gathered from indirect and direct material may be encoded differently by consumers. According to Hamilton and Thomson, one reason for that is because the information was encountered in different formats (Hamilton & Thompson, 2007) and therefore processes in different cognitive subsystems (Paivio, 1991). In addition to that, the information provided through direct and indirect experience is associated with a different context for evaluation (Hamilton & Thompson, 2007). The video chosen for the web based questionnaire was found on YouTube and was used for the purpose of this study as the indirect experience material. It is not an official corporate Sephora Video, however, it contributes to the better understanding of the Sephora in-store technology. The direct experience material for this study was the real experience consumers have made with the in-store technology at Sephora. Based on that, it is to expect that consumers that have experience the in-store technology will contribute differently to the study than the ones that haven't experienced it.
3.9.3 Type I and Type II error In order to be able to deduce that two distributions vary in significant ways, the researchers must take enough precaution for the possibility of Type I and Type II errors. By minimizing the chance of occurrence from the hypotheses, unjustified results can be avoided. However, there is no guaranteed that Type I and Type II errors may not occur throughout the study. Therefore, the researchers took into account the statistical significance of every variable at a 99 confidence level and precisely based the variables on a simple linear regression, correlation analysis or ANOVA. This allowed for the understanding of similar variables and their importance in explaining the gathered data and proposed model. Additionally, when conducting ANOVA, the chances of producing both Type I and Type II error are reduced (Burns & Burns, 2008).
4 EMPIRICAL RESULTS In the chapter that follows, the results of the study are presented and analysed using the program IBM SPSS Statistic 23. This chapter begins with an overview of the gathered data. Each hypothesis will then be discussed and analysed according to the findings. The chapter concludes with a summary of the notable results of the data collected.
- ! -26

4.1 Overview of gathered Data
In total, the researchers gathered 119 participants from the Sephora Community during a period of 14 days, out of those, 39 respondents had experienced the in-store technology and the rest, 80, had previously never interacted with the Sephora in-store technology. 96.6% of the respondents were female and 3.6% male. 52.3% of the total respondents have a Bachelor's degree and 16.3% a Masters degree. The regularity of the cosmetic retailer visit is fairly distributed, with 32.2% visiting a cosmetic retailer less than once a month, 32.2% visiting 1-2 a month, 19.2% 3-4 times a month and 16.4% visiting more than 5 times a month.
4.2 Creating a Measurement for in-store Technology
For the following hypotheses 1 to 5, a Spearman correlation analysis was conducted to determine the relationship between each construct and the perceived usage of in-store technology. In order to obtain the results, the researchers selected the designated variable from each hypothesis and correlated it with the in-store technology. From there, a set of Spearman correlation was computed to determine the relationships. There was a positive linear correlation between every construct and the perceived usage of in-store technology as it can be seen in the chart and graph presented below:
The first construct analysed, functionality, indicated a correlation coefficient value of 0.607 for the experienced consumers and 0.767 for the non-experienced consumer. This means that the functionality construct is significant (p = .000) to the usage of in-store technology. The second construct, enjoyment, marks a correlation coefficient value of 0.693 for the experienced consumers and 0.672 for the non-experienced. This signals a positive correlation between enjoyment and the usage of in-store technology. In the case of convenience, a positive correlation was also detected. The Spearman correlation coefficient value was 0.699 for the experienced consumers and 0.715 for the non-experienced. Thus, convenience also indicates to be significant (p = .000) to the usage of in-store technology. Looking at the corresponding results for design and customization the results also reveal a positive correlation between each construct and the usage of in-store technology. The data obtained for design shows, a Spearman correlation
- ! -27

coefficient value of 0.589 for the experienced consumers and 0.546 for the non-experienced. Whereas for customization, the correlation coefficient value was 0.882 for the experienced consumers and 0.548 for the non-experienced. Both of these results confirm that both construct are significant (p = .000) to the usage of in-store technology.
Overall, when analyzing these five hypotheses, a significant relationship could be identified with the chosen constructs and in-store technology. Each of the previous hypotheses show a positive effect towards the usage of in-store technologies. Thus, based on this study, the researchers can infer that functionality, enjoyment, convenience, design, and customization are significant when measuring the usage of in-store technology. The null hypotheses 1-5 are therefore rejected and the alternative hypotheses are accepted. In the table below, the correlation coefficient of each construct is shown, while differentiating between experienced and non-experienced consumers.
4.3 Relationship between in-store Technology and Customer Satisfaction
In order to explore the usage of in-store technology and customer satisfaction a Spearman correlation analysis was also completed. In the case of experienced respondents, a 0.570 correlation coefficient was obtained. Whereas for the non-experienced, the Spearman correlation coefficient was 0.655. Both results are significant (p = .000) and show a positive correlation, which indicates that the usage of in-store technology is related to customer satisfaction.
- ! -28
Figure 4: Spearman correlation from the two clusters

Therefore, the researchers reject the null hypothesis and accept the alternative hypothesis. Based on the results gathered, the usage of in-store technology is in fact related to the customer satisfaction. Further validating the fact that customers with a greater attitude and willingness to adapt to new technologies are more likely to express satisfaction (Liljander et al. 2006).
4.4 From Customer Satisfaction to Loyalty To empirically test hypothesis 7, a Spearman correlation analysis was repeated. The data from the analysis showed a positive correlation between customer satisfaction and the customer loyalty. The non-experienced respondents are slightly more susceptible to express a degree of loyalty with a Spearman correlation coefficient value of 0.690 in comparison to 0.641 for the experienced users. The results from both clusters, certainly indicate that customer satisfaction through the usage of in-store technology is significant (p = .000) on the level of customer loyalty. Therefore, the null hypothesis is rejected leading to an acceptance of the alternative hypothesis. Pointing out that the customer satisfaction obtained from in-store technology has an effect on the level of customer loyalty.
4.5 Impact on Repatronage and WoM
As it can be seen down below the customer satisfaction for the experienced consumer affects the repatronage intentions and WoM intentions differently with a Spearman correlation coefficient value of 0.401 (p = .041) for repatronage and 0.744 (p = .000) for WoM. Furthermore, it can be demonstrated, that a consumer that hasn't experienced the in-store technology is more likely to judge both constructs with the same strength with a Spearman correlation coefficient value of 0.576 (p = .000) for repatronage and 0.535 (p = .000) for WoM. The researchers deduce that there is an evidence to reject the H8 Null and accept H8 alternative at an alpha level of 0.05. Therefore, it can be concluded that the experienced consumers perceive a difference between repatronage and word of mouth and that there is no difference between WoM and repatronage in the non experienced cluster in contrast to the experienced cluster, where WoM is more impactful.
- ! -29

4.6 Age as a Moderator
In order for the researchers to further analyse the data, a one-way ANOVA was conducted to check if age acts as a moderator between the usage of in-store technology. By looking at the test of homogeneity of variance from the experienced users, the Levine’s test suggest that there is a non significant difference at a significance of 0.066 between the two groups (see Apendix 3). Thus, the homogeneity of variance can be accepted. The main ANOVA sub table indicates that the p-value is 0.714 (see Appendix 3), which means that there is no statistically significant difference between the younger and older participants. Due to the fact that if the p-value is higher than the significance level of 0.05, the difference between the two groups has no effect on the perceived usage of in-store technology (Burns & Burns, 2008). The results obtained from the non-experienced users also indicate that there is no significant difference between age groups with a p-value of 0.482. The empirical data reveal there is not sufficient evidence to reject the null hypothesis and therefore conclude age differences does not influence the perceived usage of in-store technology.
4.7 Notable Results
In the treatment of the results, the researchers have controlled two different clusters: experienced and non-experienced consumers. Based on the results of the Spearman correlation analysis of hypotheses 1-5, functionality (H1) and customization (H5) showed a more significant difference than the other three constructs enjoyment (H2), convenience (H3) and design (H4). Hypotheses 2, 3 and 4 had a comparable significance level between the experienced and non-experienced
- ! -30

consumers, even though all of the hypotheses 1-5 contributed to the positive perception of in-store technology by both clusters. Functionality (H1) was perceived higher by non-experienced (0.767), whereas customization (H5) was perceived higher by experienced consumers (0.882). In order to confirm that difference, a one-way ANOVA was further conducted to determine if there is a statistically significant difference between the experienced and non-experienced groups regarding the perceived usage of in-store technology. The ANOVA p-value of 0.034 confirmed this statement.
Moreover, it is to mention that not only the hypotheses 1-5 demonstrated notable differences within the experienced and non-experienced groups but also further hypothesis. Hypothesis 6 was significantly rejected, suggesting that the usage of in-store technology was positively related to satisfaction in both clusters. However, the satisfaction was demonstrated to be higher by the non-experienced consumers. This observation was confirmed by the one-way ANOVA with a p-value of 0.016, showing a difference between the two groups regarding the satisfaction towards the in-store technology. Another interesting result regarding the loyalty in hypothesis 8 was that experienced consumers showed a more positive approach towards WoM than repatronage, whereas the non-experienced consumers had a similar approach towards both constructs. This difference of perception between the experienced and non-experienced consumers was further confirmed by the one-way ANOVA with a p-value of 0.002. Overall, it can be demonstrated by the Spearman correlation analysis and controlled by the one-way ANOVA that there are significant differences in the perceived usage of in-store technology between experienced and non-experienced customers. Theses differences will be further discussed in the analysis.
- ! -31

5 DISCUSSION The following chapter presents an in depth analysis from the results of the study. The results will be compared to previous theory about technology, customer satisfaction, and customer loyalty. Based upon that, the researchers will construe relationships within the results obtained to answer and validate the research questions of this thesis. The aim of this chapter is to provide insights on how in-store technology could be measured and linked to customer satisfaction and loyalty.
5.1 The role of the five constructs with in-store Technologies
One of the most established facts in theory for measuring technology is the TAM model. The majority of research falls under the overall search of technology acceptance. However, Lin & Hsieh (2011) studied the behaviour of customers to adopt, to use or to evaluate in-store technological tools with the TR model. In general, further research has encouraged to find appropriate measurements for the perceived usage of in-store technology.
The findings of this study suggest that by measuring specific constructs, the effect of in-store technology by customers can be investigated. There are a set of items that are relevant to build
- ! -32
Table 4: Results of Statistical Hypotheses

upon the usage of in-store technology leading to customer satisfaction and loyalty. The constructs chosen and adapted from the TR were: functionality, enjoyment, convenience, design, and customization. Taken the five constructs together, the results indicate functionality and customization as the most significant drivers of in-store technology at Sephora. This follows the study of Lin & Hsieh (2011) differently by only selecting the constructs that best fit to the usage of in-store technology. Within each construct, items were used to accurately measure the degree of relevance of each. These results need to be interpreted with caution since the data from the two clustered groups (experienced and non-experienced) indicate differences on each construct. There are several possible explanations for the obtained results. One being that the items measuring functionality had the probability of being perceived in a more biased way by the non-experienced customers. Due to the reason that the questions for this construct were formulated upon a video where the in-store technology was impeccably portrayed. Moreover, the survey was administered to Sephora online communities only, so the probability of having a more positive response was expected due to their affinity with the brand. The questions for the non-experienced were:
(1) The in store technology seem to be efficient
(2) I would take the time to interact with in store technology?
(3) The in store technology seems to be helping to choose what you are looking for
(4) The use of in store technology would add any value to the intended purchase
The results obtained in the study indicate that the functionality construct is perceived significantly stronger by customers that have not experienced in-store technology. This statement supports the fact that consumers find the in-store innovative technology clear, fast and efficient (Burke, 2002). The positive correlation with in-store technology confirms previous studies that indicate customers usually focus on the potential benefits the technology has to offer (Meuter et al. 2000; Burke, 2002; Parasuraman et al. 2005). Non-experience respondents indirectly observed how the in-store technology functioned throughout the video and thus express stronger results than experienced users (Hamilton & Thompson, 2007). In contrast to functionality, the results for customization were significantly higher for the experienced users. The findings indicate the items measuring this construct reiterate the way experienced customers feel towards a personalised in-store experience. The following questions were asked:
(1) This technology offers unique benefits
(2) This technology meets my needs
- ! -33

(3) This technology helps me discover new products
These questions helped strengthen the researchers hypothesis about customization. And further highlight that the in-store technology at Sephora already addresses the customer’s specific needs, increases options, services, and provides personalized experiences (Lewis & Loker 2017; Gunasekaran & Sandhu, 2010). When analysing the other three constructs, the significance among the two clusters was not equal but similar. The construct of enjoyment was analysed through the discovery, inspiration and fun of using or wanting to use in-store technology. The relationship with in-store technology among both clusters was significant and support the fact of enjoyment as a construct that can measure the extent to which customers perceive the technology interesting, useful, and positive (Gronroos, 1982). Following to the next construct, convenience, the data indicates that the items used to measure the correlation with in-store technology led to significant results. The effectiveness of in-store technology is therefore demonstrated by H3 and is considered to be convenient and easy to use by the consumers. More specifically, the results can suggest that time-saving and minimization efforts are indeed of importance when studying in-store technology (Etgar, 1978; Kotler and Zaltman, 1971; Seiders et al. 2005; Yale and Venkatesh, 1986). Lastly, the evaluation of the design construct is also seen as a factor positively related to in-store technology. This is not surprising since design relates to the extent to which the technology based service is aesthetically appealing and relies on cutting edge technology (Lin & Hsieh, 2006).
Overall, the five constructs demonstrated to be positively significant for measuring the usage of in-store technologies. The results from each allowed for a more robust explanation of the overall perception from customers concerning the usage of in-store technology.
5.2 In-store Technology leading to Customer Satisfaction
As explained earlier, customer satisfaction aims to better understand whether customers are pleased with a product, service or a brand. However, the focus of the usage of in-store technology and its effect on customer satisfaction has not been further investigated. In order to find a clear linkage between in-store technology and customer satisfaction, the correlation between the Average_Satisfaction and Technology was assessed. By finding out whether there is a significant relationship between the two variables, the researchers were able to demonstrate if in-store technology is related to satisfaction. Since the five constructs were grouped together to form one whole indicator for in-store technologies, the researchers were able to obtain a degree of correlation based on the average responses from the survey questions about satisfaction. The questions about satisfaction were strategically positioned after the questions measuring the five
- ! -34

constructs. This was done to examine how customers felt after watching the video and already having in mind the five constructs: functionality, enjoyment, convenience, design, and customization. As explained earlier, the TR constructs can determine a person's predisposition towards technology and play a vital role for studying the perception and behaviours of customers (Lin & Hsieh, 2011). Therefore, having the five constructs in mind was crucial in defining the perceptiveness of satisfaction from customers. The experienced users were asked the following questions about satisfaction:
(1) I am satisfied with the usage of the in store technology
(2) The usage of in store technology works the way I want it to work
(3) The in store technology is pleasant to use
(4) The usage of the in store technology exceeded my expectations
The study was able to support the overall satisfaction perspective from 119 Sephora customers. Moreover, this study upholds the theory of Parise, Guinan and Kafka (2016) showing that real time technology delivered content in-store results in a closer, more personal and emotionally stronger relationship between the consumer and the store. By performing a cumulative evaluation of specific products and services offered by the company (Yang & Peterson, 2004). This study explained that the in-store technology at Sephora, enables an easier and simplifying decision-making process for customers. Likewise, the non-experienced users also demonstrate in-store technology is related to customer satisfaction. The slight difference on the significance level obtained from both clusters pointed out towards an additional finding. Going one step further, the researchers conducted an extra analysis to reassure and support the difference between experienced and non-experienced users was indeed significant.
The results indicate that in-store technology at Sephora has an effect on the customer satisfaction. Further validating the fact that customers with a greater attitude and willingness to adapt to new technologies are more likely to express satisfaction (Liljander et al. 2006). This can be seen in the level of satisfaction towards the usage of the in-store technology. With an average between experienced and non-experienced consumers, functionality explains the positive perceptions of in-store technology with a significant Spearman correlation. Customization plays an important role for the experienced consumers, as it contributes to a significant relationship of the customer satisfaction based on the usage of in-store technology. Going back to the proposed model, the significance from the five constructs allowed the researchers to define a measurement for in-store technologies. Since previous literature confirm that higher perceived quality in
- ! -35

technology-based services leads to higher customer satisfaction (DeLone and McLean 1992, 2004), the items compiled for measuring in-store technology affirm this statement. In this context, a linkage between in-store technology and customer satisfaction could be established.
5.3 In-store Technologies leading to Customer Loyalty
The objective of this thesis was to extent the field of phygitalization and the complexity of the usage of in-store technology for an enhanced customer satisfaction. This was carried out by analysing how technology affects the customer satisfaction and thereby the customer loyalty. Customer satisfaction through the usage of in-store technology has an effect on the level of customer loyalty. Experienced and non-experienced consumers showed a significant and similar value regarding the effect of customer satisfaction obtained through the usage of in-store technology on the level of customer loyalty. Since the proposed model was also adapted from Söderlund (2006), the linkage between satisfaction and loyalty had been previously proven. However, this thesis investigates the relationship between the two constructs within the Sephora community. As indicated previously, customer satisfaction is a major driver of customer retention (Anderson, Fornell & Mazvancheryl, 2004; Weijters et al. 2007). Therefore, in order to analyse the factors that influenced customer loyalty through the usage of in-store technology, the researchers integrated the set of questions about satisfaction before. In this way, the assimilation of customer satisfaction could coherently shift to customer loyalty.
Söderlund (2006) places an emphasis on customer satisfaction as a determinant and predictor of loyalty. Since satisfied customers can portray loyalty differently, the researchers logistically included the two main loyalty measurements: repatronage and word of mouth. By doing this, an Average_loyalty was computed to explain the correlation between customer satisfaction and loyalty. Moreover, this correlation was based on the overall usage of in-store technology thus strengthening the relationship between in-store technology, satisfaction and loyalty. Söderlund’s study (2005) showed that both repatronage and word of mouth have demonstrated a greater result of loyalty measurement when presented as two separate factors since both behaviors refer to different constructs. The questions related to those two constructs were the following for repatronage intentions:
(1) These in store technologies might be the reason for me to come back to the store
(2) I would rather go to this store than a competitor, because of these technologies
- ! -36

And for word of mouth: (1) I would recommend the usage of the in store technology (to friends, family, etc.) due to my positive experience with it
(2) I would actively communicate about this in store technology with my friends and family
(3) I would share my positive experience about the in store technology with friends and family
The difference between the two constructs can clearly be seen in the results of the study, especially in the analysis of the experienced consumers. This contribution of the experienced cluster, confirms Söderlunds theory (2006) that loyalty is demonstrated differently throughout the two different constructs and satisfaction doesn’t affect repatronage and word of mouth in the same way. Namely, that word of mouth is significantly more affected than repatronage. In fact, the researchers can state that satisfaction in the experienced group has a stronger impact on word of mouth than on repatronage intentions. Therefore, the experienced consumers are more likely to refer to people in their social environment than to physically visit the store again (Söderlunds, 2006). The observed difference between the experienced and non-experienced consumers could be attributed to having only an indirect experience meaning that the survey was encoded differently by the two cluster groups of consumers, i.e. a Sephora video as a reference for the questions about loyalty. Based on that, loyalty is demonstrated differently throughout the various constructs. Hence, it can be confirmed that customer satisfaction has a different impact on repatronage and word of mouth.
5.4 Age
Interestingly, the age has no influence on the perception or the usage of in-store technology. Even though it has been argued in the theoretical background that the acceptance level of technology could be justified by the difference of generations (Goodwin and McElwee, 1999). No significant results have been demonstrated in the study. Thus, it cannot be inferred that technology usage varies across segments and more specifically, that younger consumers have a more positive incline towards in-store technology. In terms of generational aspects, no differences have been proven between the younger and the older participants for the five different constructs. Thus, it can be noticed, that the age difference does not influence the perceived usage of in-store technology at Sephora.
- ! -37

6 CONCLUSION
The final chapter presented below will discuss the findings of the study in relation with the analysis, research questions, and aim presented for this thesis. The aim was to deeper analyse the consumers point of view on the usage of in-store technology and to further understand the contribution of those technologies on consumers and the store environment as a whole. On the basis of this research objective, the data was analysed and further led the researchers to the conclusions presented. This chapter also discusses the practical and theoretical contributions of the study and provide suggestions for future research in the field of phygitalization.
6.1 Phygitalization in Retail As previously mentioned, Sephora is bridging the line between digital and physical while still mainly focusing on the brick-and-mortar store conceptualization. The aim of this study was to analyze this fully integrated beauty experience where technology serves as a mechanism to further contribute to satisfaction and loyalty. The phenomenon of phygitalization, in contrast to SSTs, accounts for the technology used at the physical store to offer a personalised and unique experience in a real retail context. This challenge can be observed in the number of monthly visits in cosmetic retailing in comparison to other retailers, as for example, grocery stores. Most people don't buy beauty products every day and this can be seen throughout the study. The study found out that over 70% of the participants visited a cosmetic retailer 1-2 times or less than once a month. This rare occasion needs to be fully exploited by the retailer and using in-store technologies such as the Color IQ, the Fragrance IQ and the Skin IQ have proven to contribute to the customer satisfaction of the Sephora shoppers.
It can be noted that based on this study, Sephora succeeded to connect a hedonically and sense related store environment with technological features as the satisfaction measures showed in the analysis. In order not to lose the physical stores, there is a need for the managers to reinvent them and make them more familiar to what customers are used to, name, technology. All in all, it can be observed that the cosmetic retailer, Sephora, is rethinking its approach towards customers, which are used to technology on a daily basis by adding value in the form of phygitalization. There is no longer only one-way (digital) or the other (physical) but a trustworthy cooperation between both the 2D and 3D world hand in hand. The common platform between cosmetic products and in-store technology is meeting the customer’s need in a changing retailing environment. Colours, smells, and textures may remain the same, but the way they are perceived can be extended to a 360 degrees in-store experience with the help of in-store technology.
- ! -38

6.2 Theoretical Contribution
With this study, the researchers aim to contribute to the unexplored phenomenon of phygitalization. The word itself, is not common around the industry yet. Past studies within this field have mainly focus on the general approach to these technologies (Scherer, Wünderlich & Von Wangenheim, 2015; Lin & Hsieh, 2011; Rigby, 2011). Phygitalization is already seen differently across retailing, from interactive fitting rooms, kiosks, virtual real life clothing rails, and touch screen window displays to personalized virtual car experiences. To better understand this phenomenon, the researchers introduced a framework to describe the merger of the physical and digital world in-stores. The use of Sephora as a case study served as a base for understanding the potential outcomes of integrating in-store technology. Moreover, Sephora is a reference point for measuring the usage of in-store technology and its effect on the customer satisfaction. Current conceptualizations of innovative technology reveal there is little empirical work that directly addresses the use of such technologies in-stores and how it influences the brick and mortar experience. In the literature, the TAM and TR models already proposed a process for measuring the acceptance of technology (Lin & Hsieh, 2011; Davis, 1986). Based on that, the relationship between the five constructs: functionality, enjoyment, convenience, design, and customization to in-store technology was established. The researchers found that the five constructs could act as positive drivers of in-store technology. Moreover, functionality and customization serve as the most significant when studying phygitalization. The significance between the constructs and in-store technology demonstrate the fundamental aspect of this study. Due to the positive correlation, the researchers were able to relate in-store technology with customer satisfaction. In this sense, a measurement for in-store technology that leads to customer satisfaction is suggested.
The relationship between in-store technology and customer loyalty is further analysed by finding if customer satisfaction leads to loyalty. This study showed a significant effect of customer satisfaction obtained through the usage of in-store technology on the level of customer loyalty. Furthermore, the relationship between the two constructs, repatronage and word of mouth, within the Sephora community. The researchers indeed confirm Söderlund (2006), and are in line with his theory about the two constructs impacting loyalty differently. The findings also indicate there is no difference on the perception of in-store technology and the distinct generations. Previous literature argues the opposite and state that younger users are more inclined to have a positive perception towards technology. In this context, the researchers found the age factor had no impact on the usage of in-store technology.
- ! -39

6.3 Managerial Contribution
By gaining an understanding of how in-store technologies are perceived from a consumer’s insight, firms can focus on implementing effective strategies to strengthen the overall customer satisfaction and to a latter extent the customer loyalty. This study provides practical relevance, as it helps managers understand the importance of blending the physical and digital experience and the effect on customer loyalty and therefore contributes to the phenomenon of phygitalization. It is no longer about providing one service on different platforms and channels, but combining those services. Through the usage of in-store technology, customers, moreover, firms can better understand the relationship between in-store technology, satisfaction and loyalty to justify the means of phygitalization as a competitive advantage. From a managerial point of view, this research contributes to several business related aspects. It highlights the necessity of taking into consideration the perceived usage of in-store technology by the experienced consumers, but also, by the non-experienced ones. In the case of this study, it can be observed that there were discrepancies between the two clusters. An experienced customer has a different approach to the in-store technology than a non-experienced customer, as for example in terms of the functionality or the customization of the in-store technology. Thus, this shows a challenge that retailers, such as Sephora, are confronted with. In-store technology is not only about attracting new customers to the actual usage of the in-store technology, but also captivating and retaining experienced consumer and creating a sense of fidelity. Technology and digitalization play an important role in society, however, this study has shown that in-store technology only makes sense when consciously introduced. This study confirms that with the contribution of the five constructs and with the help of in-store technology, customer satisfaction can be guaranteed. From a managerial point of view, the functionality aspect is especially of relevance for first time users or non-experienced consumers. Whereas an emphasis has to be put on customization of the in-store technology for experienced users. This can be done by giving importance to items such as the discovery of new products, the deep understanding of the customers need and consequently meeting their needs, the benefits and added value of the usage of the in-store technology, as well as the time spent on the in-store technology, as it seemed valuable for consumers to save time.
To further contribute to the managerial aspects, the study has shown that usage of in-store technology is perceived equally by younger and older consumers and therefore retailers should not focus on specific segments of generations. Lastly, depending on the desire and strategy of the company, the two loyalty constructs, word of mouth and repatronage can be used for strategic purposes in different ways in terms of loyalty programs. However, since no significant correlation has been demonstrated between frequency of visits and WoM/repatronage (see appendix), further research would be advantageous. The latter leads to the final chapter of this research, the limitations and further research recommendations.
- ! -40

6.4 Limitations and Further Research
There are several limitations to this study. One being that the study was based on a single retailer, Sephora, and its data collection, therefore delimited to the cosmetic industry. Due to the fact that this study was conducted through a convenience sampling method with a relatively small sample size, the results cannot be generalized to the phenomenon of phygitalization. It would be of an asset to further research about in-store technology on other fields and industries as well as conduct a questionnaire with a higher number of respondents within a probability sample in order to be able to generalize the data collected to the population. In terms of study design, the questionnaire was build upon a video, which framed the non-experienced respondents opinion, since it was the only reference given to them. This could be adjusted for further research by extending the knowledge of the non-experienced participants by adding more videos or other useful material. Additionally, a qualitative study could be of extra support to this quantitative results in order to gain better and more representative data. If time would have allowed it, the researchers would have been able to further analyze the two most decisive constructs (customization and functionality) and the differences between the experienced and non-experienced consumers in depth. In terms of analysis, a test of two correlations, that was not accessible through SPSS, between similar relationships could be advantageous in order to discover the power of significance within the experienced and non-experienced clusters. Furthermore, a stronger link between the frequency of visits, repatronage and word of mouth could be envisaged, as in the case of this study no correlation was found between the frequency of visits and repatronage intentions as well as the frequency of visits and word of mouth intentions. Future research could contribute to a better understanding on the impact of the two loyalty constructs. For the purpose of this study, the researches have decided to not further contribute to the factor of education in the perception of the usage of in-store technology. However, further research is suggested to integrate more demographics such as the educational background. This is due to the fact that previous studies indicates that people with higher levels of education are more likely to have more exposure to technology on a daily basis (Weijters et al. 2007; Burke, 2002).
- ! -41

7 REFERENCES
Anderson, E. W., Fornell, C. & Mazvancheryl, S. K. (2004). Customer Satisfaction and Shareholder Value, Journal of marketing, vol. 68, no. 4, pp.172–185.
Andreassen, T. W. (2001). From Disgust to Delight: Do Customers Hold a Grudge?, Journal of service research, vol. 4, no. 1, pp.39–49.
Babin, B. J., Darden W. R., Griffin M. (1994). Work and/or Fun: Measuring Hedonic and Utilitarian Shopping Value, Journal of Consumer Research, vol. 20, no. 4, pp. 644-657.
Backman, S.J. and Crompton, J.L. (1991), “The usefulness of selected variables for predicting activity loyalty”, Leisure Sciences, Vol. 13, pp. 205-20 Bäckström, K. & Johansson, U. (2006). Creating and Consuming Experiences in Retail Store Environments: Comparing Retailer and Consumer Perspectives, Journal of Retailing and Consumer Services, vol. 13, no. 6, pp.417–430.
Baker J. & Wakefield K. L. (1998). Excitement at the Mall: Determinants and Effects on Shopping Response, Journal of Retailing,vol. 74, no. 4, pp. 515-539
Baumann, C., Burton, S. and Elliot, G. (2005), “Determinants of customer loyalty and share of wallet in retail banking”, Journal of Financial Services Marketing, Vol. 9, pp. 231-48.
Bellenger D.N., Greenberg B. A., Robertson D. H. (1977). Shopping Center Patronage Motives, Journal of Retailing, vol. 53, pp. 29-38.
Berry, L. L., Seiders, K. & Grewal, D. (2002). Understanding Service Convenience, Journal of marketing, vol. 66, no. 3, pp.1–17.
Bitner, M. J. (1990). Evaluating service encounters: The effects of physical sur-roundings and employee responses, Journal of Marketing, vol.54, pp.69 – 82. Blanchard, R.F. and Galloway, R.L. (1994), “Quality in retail banking”, International Journal of Service Industry Management, Vol. 5 No. 4, pp. 5-23.
- ! -42

Bloch, P. H., Ridgway N. M., Dawson S. A. (1994). The Shopping Mall as Consumer Habitat, Journal of Retailing, vol. 70, no. 1, pp. 23-42.
Bloemer, J. M., & Kasper, H. D. (1995). The complex relationship between consumer satisfaction and brand loyalty. Journal of Economic Psychology, vol.16, pp.311 – 329
Bloemer, J.M., K.H. Pauwels, and H.D. Kasper (1996). There is More to Loyalty Than Just Satisfaction: The Effects of Satisfaction and Involvement on Brand Loyalty and Dealer Loyalty, Unpublished Working Paper, University of Limburg, Maastricht, Netherlands. Bolton, R. (1998), “A dynamic model of the duration of the customer’s relationship with a continuous service provider: the role of satisfaction”, Marketing Science, Vol. 17 No. 1 pp. 45-65. Bolton, R., Kannan, P.K. and Bramlett, M.D. (2000), “Implications of loyalty program membership and service experiences for customer retention and value”, Journal of the Academy of Marketing Science, Vol. 28 No. 1, pp. 95-108.
Bryman, A. & Bell, E. (2015). Business Research Methods, Oxford University Press, USA.
Burns, R. P. & Burns, R. (2008). Business Research Methods and Statistics Using SPSS, Sage.
Burke, R. R. (2002). Technology and the Customer Interface: What Consumers Want in the Physical and Virtual Store, Journal of the academy of Marketing Science, vol. 30, no. 4, pp.411–432.
Čater, B. & Čater, T. (2009). Relationship-Value-Based Antecedents of Customer Satisfaction and Loyalty in Manufacturing, Journal of Business & Industrial Marketing, vol. 24, no. 8, pp.585–597.
Childers, T. L., Carr, C. L., Peck, J. & Carson, S. (2002). Hedonic and Utilitarian Motivations for Online Retail Shopping Behavior, Journal of retailing, vol. 77, no. 4, pp.511–535.
Churchill Jr, G. A. & Surprenant, C. (1982). An Investigation into the Determinants of Customer Satisfaction, Journal of marketing research, pp.491–504.
- ! -43

Cronin Jr, J. J. & Taylor, S. A. (1992). Measuring Service Quality: A Reexamination and Extension, The journal of marketing, pp.55–68.
Cronin Jr, J. J. & Taylor, S. A. (1994). SERVPERF versus SERVQUAL: Reconciling Performance-Based and Perceptions-Minus-Expectations Measurement of Service Quality, The Journal of Marketing, pp.125–131.
Cronin, J. J., Jr., Brady, M. K., & Hult,G.T. M. (2000). Assessing the effects of quality, value, and customer satisfaction on consumer behavioral intentions in service environments, Journal of Retailing, vol. 76, pp. 193–218
Dabholkar, P. A. & Bagozzi, R. P. (2002). An Attitudinal Model of Technology-Based Self-
Service: Moderating Effects of Consumer Traits and Situational Factors, Journal of the academy of marketing science, vol. 30, no. 3, pp.184–201.
Dabholkar, P. A., Michelle Bobbitt, L. & Lee, E.-J. (2003). Understanding Consumer Motivation and Behavior Related to Self-Scanning in Retailing: Implications for Strategy and Research on Technology-Based Self-Service, International Journal of Service Industry Management, vol. 14, no. 1, pp.59–95.
Dabholkar, P. A., Thorpe, D. I. & Rentz, J. O. (1995). A Measure of Service Quality for Retail Stores: Scale Development and Validation, Journal of the Academy of marketing Science, vol. 24, no. 1, pp.3–16.
Davis, F. D., Bagozzi, R. P. & Warshaw, P. R. (1992). Extrinsic and Intrinsic Motivation to Use Computers in the workplace1, Journal of applied social psychology, vol. 22, no. 14, pp.1111–1132.
DeLone, W. H. & McLean, E. R. (1992). Information Systems Success: The Quest for the Dependent Variable, Information systems research, vol. 3, no. 1, pp.60–95.
Delone, W. H. & Mclean, E. R. (2004). Measuring E-Commerce Success: Applying the DeLone & McLean Information Systems Success Model, International Journal of Electronic Commerce, vol. 9, no. 1, pp.3147.
- ! -44

Dennis C., Brakus J., Alamanos E. (2013). The Wallpaper Matters: The Influence of the Content of Digital Ads on Customer in-Store Experience. Journal of Marketing Management, vol. 29, no. 3-4, pp. 338–355.
Dawson, S., Bloch P. H., Ridgway N. M. (1990). Shopping Motives, Emotional States, and Retail Outcomes, Journal of Retailing, vol. 66, pp. 408-427.
Day, G.S. (1969), “A two-dimensional concept of brand loyalty”, Journal of Advertising Research, Vol. 9 No. 3, pp. 29-35. Davis Jr, F. D. (1986). A Technology Acceptance Model for Empirically Testing New End-User Information Systems: Theory and Results, Available Online: https://www.researchgate.net/publication/35465050_A_Technology_Acceptance_Model_for_Empirically_Testing_New_End-User_Information_Systems [Accessed 10 April 2017]
Design Retail Online. (n.d.). Available Online: http://www.designretailonline.com/projects/technology/ [Accessed 16 May 2017].
Dick, A.S. and Basu, K. (1994), “Customer loyalty: toward an integrated conceptual framework”, Journal of the Academy of Marketing Science, Vol. 22 No. 2, pp. 99-113.
Donovan R. J., Rossiter J. R., (1982). Store Atmosphere: An Environmental Psychology Approach, Journal of Retailing, vol. 58, pp. 34-57.
Easterby-Smith, M., Thorpe, R. & Jackson, P. R. (2015). Management and Business Research,
Sage.
Etgar, M. (1978). The Effects of Forward Vertical Integration on Service Performance of a Distributive Industry, The Journal of Industrial Economics, pp.249–255.
Fornell, C. (1992). A National Customer Satisfaction Barometer: The Swedish Experience,
the Journal of Marketing, pp.6–21.
Fornell C., Johnson M.D., Anderson E.W., Cha J. and Everitt Bryant Eugene B. (1996). The American Customer Satisfaction Index: Nature, Purpose, and Findings, Journal of Marketing, vol. 60, no. 4, pp. 7-18.
- ! -45

Goodwin, D. R. & McElwee, R. E. (1999). Grocery Shopping and an Ageing Population:
Research Note, The International Review of Retail, Distribution and Consumer Research, vol. 9, no. 4, pp.403–409
Gremler, D.D. and Brown, S.W. (1999), “The loyalty ripple effect: appreciating the full value of customers”, Industrial Journal of Service Industry Management, Vol. 10 No. 3, pp. 271-91.
Gehrt, K. C. & Yale, L. J. (1993). The Dimensionality of the Convenience Phenomenon: A Qualitative Reexamination, Journal of Business and Psychology, vol. 8, no. 2, pp.163–180.
Grönroos, C. (1982). An Applied Service Marketing Theory, European journal of marketing, vol. 16, no. 7, pp.30–41.
Gronholdt, L., Martensen, A. & Kristensen, K. (2000). The Relationship between Customer Satisfaction and Loyalty: Cross-Industry Differences, Total quality management, vol. 11, no. 4–6, pp.509–514.
Gunasekaran, A. & Sandhu, M. (2010). Handbook on Business Information Systems, World Scientific.
Hallowell, R. (1996). The Relationships of Customer Satisfaction, Customer Loyalty, and Profitability: An Empirical Study, International journal of service industry management, vol. 7, no. 4, pp.27–42.
Hamilton, R. W. & Thompson, D. V. (2007). Is There a Substitute for Direct Experience? Comparing Consumers’ Preferences after Direct and Indirect Product Experiences, Journal of Consumer Research, vol. 34, no. 4, pp.546–555.
Heskett, J.L., Sasser, W.E. and Hart, C.W.L. (1990). Breakthrough Service, The Free Press, New York, NY.
Homburg, C. and Giering, A. (2001), Personal characteristics as moderators of the relationship between customer satisfaction and loyalty—an empirical analysis, Psychology and Marketing, vol. 18, pp.43–66.
Hui M. K., Bateson J. E. G. (1991). Perceived control and the effects of crowding and consumer choice on the service experience, Journal of Consumer Research, vol. 18 no. 2, pp. 174-84.
- ! -46

Inside CXM (2015). What’s The Difference Between Customer Experience And Customer Satisfaction? Available Online:http://www.insidecxm.com/whats-the-difference-between-customer-experience-and-custome -satisfaction/ [Accessed 27 March 2017]
Jiun-Sheng Chris Lin, Pei-ling Hsieh, (2006) "The role of technology readiness in
customers' perception and adoption of self-service technologies", International Journal of Service Industry Management, Vol. 17 Issue: 5, pp.497-517
Keenan, J. (2017). Sephora’s Formula for Creating Experiential Retail, Total Retail,
Available Online:http://www.mytotalretail.com/article/inside-sephoras-formula-creating-experiential-retail/ [Accessed 29 March 2017].
Kincade D. H., (2016). Quick Response Management System for the Apparel Industry:Definition through Technologies, Clothing and Textiles Research Journal, vol. 13, no. 4, pp. 245 - 251
Kim, J. & Forsythe, S. (2008). Adoption of Virtual Try-on Technology for Online Apparel Shopping, Journal of Interactive Marketing, vol. 22, no. 2, pp.45–59.
Kotler, P. & Zaltman, G. (1971). Social Marketing: An Approach to Planned Social Change, The Journal of Marketing, pp.3–12.
Kowinski, W. S. (1985). The Mailing of America, New York.
Kumar, N. & Ruan, R. (2006). On Manufacturers Complementing the Traditional Retail Channel with a Direct Online Channel, Quantitative Marketing and Economics, vol. 4, no. 3, pp.289–323
Lee, D. Y. & Lehto, M. R. (2013). User Acceptance of YouTube for Procedural Learning: An Extension of the Technology Acceptance Model, Computers & Education, vol. 61, pp.193–208.
Lewis, T. L. & Loker, S. (2017). Trying on the Future: Exploring Apparel Retail Employees’ Perspectives on Advanced In-Store Technologies, Fashion Practice, vol. 9, no. 1, pp.95–119.
- ! -47

Liljander, V., Gillberg, F., Gummerus, J. and van Riel, A. (2006). Technology readiness and the evaluation and adoption of self-service technologies, Journal of Retailing and Consumer Services, vol. 13, no. 3, pp. 177-91.
Lin, J.-S. C. & Hsieh, P.-L. (2011). Assessing the Self-Service Technology Encounters: Development and Validation of SSTQUAL Scale, Journal of Retailing, vol. 87, no. 2, pp.194–206.
Liu, C., Zhu, Q., Holroyd, K. A. & Seng, E. K. (2011). Status and Trends of Mobile-Health Applications for iOS Devices: A Developer’s Perspective, Journal of Systems and Software, vol. 84, no. 11, pp.2022–2033.
Lund, A. M. (2001). Measuring Usability with the USE Questionnaire 12.", Usability interface, vol. 8, no. 2, pp.3–6.
Macintosh, G. & Lockshin, L. S. (1997). Retail Relationships and Store Loyalty: A Multi-Level Perspective, International Journal of Research in marketing, vol. 14, no. 5, pp.487–497.
Matthew L. Meuter, Mary Jo Bitner, Amy L. Ostrom, Stephen W. Brown (2005) Choosing Among Alternative Service Delivery Modes: An Investigation of Customer Trial of Self-Service Technologies. Journal of Marketing: April 2005, Vol. 69, No. 2, pp. 61-83.
McGoldrick, P. J. & Thompson, M. G. (1992). The Role of Image in the Attraction of the out-of-Town Centre, International Review of Retail, Distribution and Consumer Research, vol. 2, no. 1, pp.81–98.
McKinney, V., Yoon, K. & Zahedi, F. ‘Mariam’. (2002). The Measurement of Web-Customer Satisfaction: An Expectation and Disconfirmation Approach, Information systems research, vol. 13, no. 3, pp.296–315.
Menon, P. (2016). Digital Beauty : How Sephora Leveraged Digital Technology to Overhaul the in-Store Experience. – Technology and Operations Management, Technology and Operations Management - A Course at Harvard Business School, Available Online: https://rctom.hbs.org/submission/digital-beauty-how-sephora-leveraged-digital-technology-to-overhaul-the-in-store-experience/ [Accessed 21 March 2017]
- ! -48

Meuter, M. L., Ostrom, A. L., Roundtree, R. I. & Bitner, M. J. (2000). Self-Service Technologies: Understanding Customer Satisfaction with Technology-Based Service Encounters, Journal of marketing, vol. 64, no. 3, pp.50–64.
Millennials Infographic. (2017). Goldman Sachs, Available Online: http://www.goldmansachs.com/our-thinking/pages/millennials/ [Accessed 16 May 2017].
Mittal, V. & Kamakura, W. A. (2001). Satisfaction, Repurchase Intent, and Repurchase Behavior: Investigating the Moderating Effect of Customer Characteristics, Journal of marketing research, vol. 38, no. 1, pp.131–142
Oliver, R. L. (1999). Whence Consumer Loyalty?, the Journal of Marketing, pp.33–44.
Paivio, A. (1991). Dual Coding Theory: Retrospect and Current Status, Canadian journal of
psychology, vol. 45, no. 3, pp.255–287.
Pantano, E. & Di Pietro, L. (2012). Understanding Consumer’s Acceptance of Technology-Based Innovations in Retailing, Journal of technology management & innovation,vol. 7, no. 4, pp.1–19.
Pantano, E. & Laria, G. (2012). Innovation in Retail Process: From Consumers’ Experience to Immersive Store Design, Journal of technology management & innovation, vol. 7, no. 3, pp.198–206
Pantano, E. (2014) ‘Innovation drivers in retail industry’, International Journal of Information Management, Vol. 34, No. 3, pp.344–350.
Pantano, E. and Di Pietro, L. (2012) ‘Understanding consumer’s acceptance of technology-based innovations in retailing’, Journal of Technology Management & Innovation, Vol. 7, No. 4, pp.1–19.
Parasuraman, A. (2000). Technology Readiness Index (TRI) a Multiple-Item Scale to Measure Readiness to Embrace New Technologies, Journal of service research, vol. 2, no. 4, pp.307–320.
Parasuraman, A., Zeithaml, V. A. & Berry, L. L. (1988). Servqual: A Multiple-Item Scale for Measuring Consumer Perc, Journal of retailing, vol. 64, no. 1, p.12.
- ! -49

Parasuraman, A., Zeithaml, V. A. & Berry, L. L. (1994). Reassessment of Expectations as a Comparison Standard in Measuring Service Quality: Implications for Further Research, the Journal of Marketing, pp.111–124.
Parasuraman, A., Zeithaml, V. A. & Malhotra, A. (2005). ES-QUAL a Multiple-Item Scale for Assessing Electronic Service Quality, Journal of service research, vol. 7, no. 3, pp.213–233.
Parise, S., Guinan, P. J. & Kafka, R. (2016). Solving the Crisis of Immediacy: How Digital Technology Can Transform the Customer Experience, Business Horizons, vol. 59, no. 4, pp.411–420
Park, E. & Kim, K. J. (2014). An Integrated Adoption Model of Mobile Cloud Services: Exploration of Key Determinants and Extension of Technology Acceptance Model, Telematics and Informatics, vol. 31, no. 3, pp.376–385.
Parrot K., & Ohashi, K. (2010). Measuring Word of Mouth in Real-Time: A Study of “Tweets” and Their Dynamic Relation to Movie Sales and Marketing Efforts, Master thesis, Department of Economics, Lund University, Available Online: https://lup.lub.lu.se/student-papers/search/publication/1626974 [Accessed 15 May 2017]
Parsons, A. G. (2002). Non-Functional Motives for Online Shoppers: Why We Click, Journal of Consumer Marketing, vol. 19, no. 5, pp.380–392
Perea y Monsuwé, T., Dellaert, B. G. & De Ruyter, K. (2004). What Drives Consumers to Shop Online? A Literature Review, International journal of service industry management, vol. 15, no. 1, pp.102–121.
Petterson, P. G. & Smith, T. (2003). A Cross-Cultural Study Of Switching Barriers And Propensity To Stay With Service Providers. Journal of Retailing, vol. 79, pp. 107–120.
Pine, B.J., Peppers, D. and Rogers, M. (1995), “Do you want to keep your customers forever?”, Harvard Business Review, March-April, pp. 103-14 Piotrowicz, W. & Cuthbertson, R. (2014). Introduction to the Special Issue Information Technology in Retail: Toward Omnichannel Retailing, International Journal of Electronic Commerce, vol. 18, no. 4, pp.5–16
- ! -50

Pritchard, M.P., Havitz, M.E. and Howard, D.R. (1999), “Analyzing the commitment-loyalty link in service industries”, Journal of the Academy of Marketing Science, Vol. 27 No. 3,pp. 333-48
Radomir, L. & Nistor, C. V. (2012). High-Educated Consumer Perceptions of Service Quality: An Assessment of the SSTQUAL Scale in the Romanian Banking Industry, Procedia Economics and Finance, vol. 3, pp.858–864.
Rigby, D. (2011). The Future of Shopping., Harvard Business Review, vol. 89, no. 12, pp.64–75.
Rust, R. T. & Oliver, R. W. (1994). The Death of Advertising, Journal of Advertising, vol. 23, no. 4, pp.71–77.
Rust, R. T. & Zahorik, A. J. (1993). Customer Satisfaction, Customer Retention, and Market Share, Journal of retailing, vol. 69, no. 2, pp.193–215.
Rundle-Thiele, S. and Mackay, M.M (2001). “Assessing the performance of brand loyalty measures”, Journal of Services Marketing, Vol. 15 No. 7, pp. 529-46
Scherer, A., Wünderlich, N. & Von Wangenheim, F. (2015). The Value of Self-Service: Long-
Term Effects of Technology-Based Self-Service Usage on Customer Retention., Mis Quarterly, vol. 39, no. 1, pp.177–200.
Seiders, K., Berry, L. L. & Gresham, L. G. (2000). Attention, Retailers! How Convenient Is Your Convenience Strategy?, Sloan Management Review, vol. 41, no. 3, p.79.
Seiders, K., Voss, G. B., Grewal, D. & Godfrey, A. L. (2005). Do Satisfied Customers Buy More? Examining Moderating Influences in a Retailing Context, Journal of marketing, vol. 69, no. 4, pp.26–43.
Shankar, V., Amy, K. Smith, A. K., & Rangaswamy, A. (2003). Customer satisfaction and loyalty in online and offline environments. International journal of research in marketing, 20, 153-175.
Simon, F. & Usunier, J.-C. (2007). Cognitive, Demographic, and Situational Determinants of Service Customer Preference for Personnel-in-Contact over Self-Service Technology, International Journal of Research in Marketing, vol. 24, no. 2, pp.163–173
- ! -51

Sîrbu, M. O., Saseanu, A. S. & Ghita, S. I. (2015). Consumer's Perception on the Use of Innovative Technologies in Creating Store Atmosphere, Amfiteatru Economic, vol. 17, no. 39, p.567.
Söderlund, M. (2006). Measuring Customer Loyalty with Multi-Item Scales: A Case for Caution, International Journal of Service Industry Management, vol. 17, no. 1, pp.76–98.
Trochim, W. M. (2006). Reliability & Validity.
Tyrimou, N. (2015). Four Ways That Technology Is Changing Beauty, Euromonitor International Blog, Available Online: http://blog.euromonitor.com/2015/06/four-ways-that-technology-is-changing-beauty.html [Accessed 21 March 2017]
Vel, K. P., Brobbey, C. A., Salih, A. & Jaheer, H. (2015). Data, Technology & Social Media:
Their Invasive Role in Contemporary Marketing. Brazilian Journal of Marketing, vol. 14, no. 4, pp.421–437
Wallstrom, A., Salehi-Sangari, E., Foster, T., Styven, M. E. & Strandberg, C. (2017). Managing
Retail in an Omnichannel Environment: Consumer Behavior, Trends, and Challenges, Developments in Marketing Science: Proceedings of the Academy of Marketing Science Creating Marketing Magic and Innovative Future Marketing Trends, p.243.
Walsh, G., Evanschitzky, H. & Wunderlich, M. (2008). Identification and Analysis of Moderator Variables: Investigating the Customer Satisfaction-Loyalty Link, European Journal of Marketing, vol. 42, no. 9/10, pp.977–1004.
Weijters, B., Rangarajan, D., Falk, T. & Schillewaert, N. (2007). Determinants and Outcomes of Customers’ Use of Self-Service Technology in a Retail Setting, Journal of Service Research, vol. 10, no. 1, pp.3–21
Yale, L. & Venkatesh, A. (1986). Toward the Construct of Convenience in Consumer Research,
NA-Advances in Consumer Research Volume 13.
Yang, Z. & Peterson, R. T. (2004). Customer Perceived Value, Satisfaction, and Loyalty: The Role of Switching Costs, Psychology & Marketing, vol. 21, no. 10, pp.799–822.
- ! -52

Yen, H.R. (2005). An attribute-based model of quality satisfaction for internet self-service technology, The Service Industries Journal, vol. 25, no. 5, pp. 641-59.
Yi, Y. & Zeithaml, V. A. (1990). A Critical Review of Consumer Satisfaction, Review of marketing, vol. 4, no. 1, pp.68–123.
Yüksel, A. & Rimmington, M. (1998). Customer-Satisfaction Measurement, The Cornell Hotel and Restaurant Administration Quarterly, vol. 39, no. 6, pp.60–70.
Zeithaml, V.A., Berry, L.L. and Parasuraman, A. (1996), “The behavioral consequences of service quality”, Journal of Marketing, vol. 60, pp. 31-46 Zhu, Z., Nakata, C., Sivakumar, K. & Grewal, D. (2013). Fix It or Leave It? Customer Recovery from Self-Service Technology Failures, Journal of Retailing, vol. 89, no. 1, pp.15–29
Zhu, F. X., Wymer, W. & Chen, I. (2002). IT-Based Services and Service Quality in Consumer Banking, International Journal of Service Industry Management, vol. 13, no. 1, pp.69–90.
- ! -53

8 APPENDIX
Appendix 1 - Usage of In-store technology Survey
1.1 Questions
- ! -54

1.2 Questions for experienced respondents of in-store technology at Sephora
- ! -55

- ! -56

- ! -57
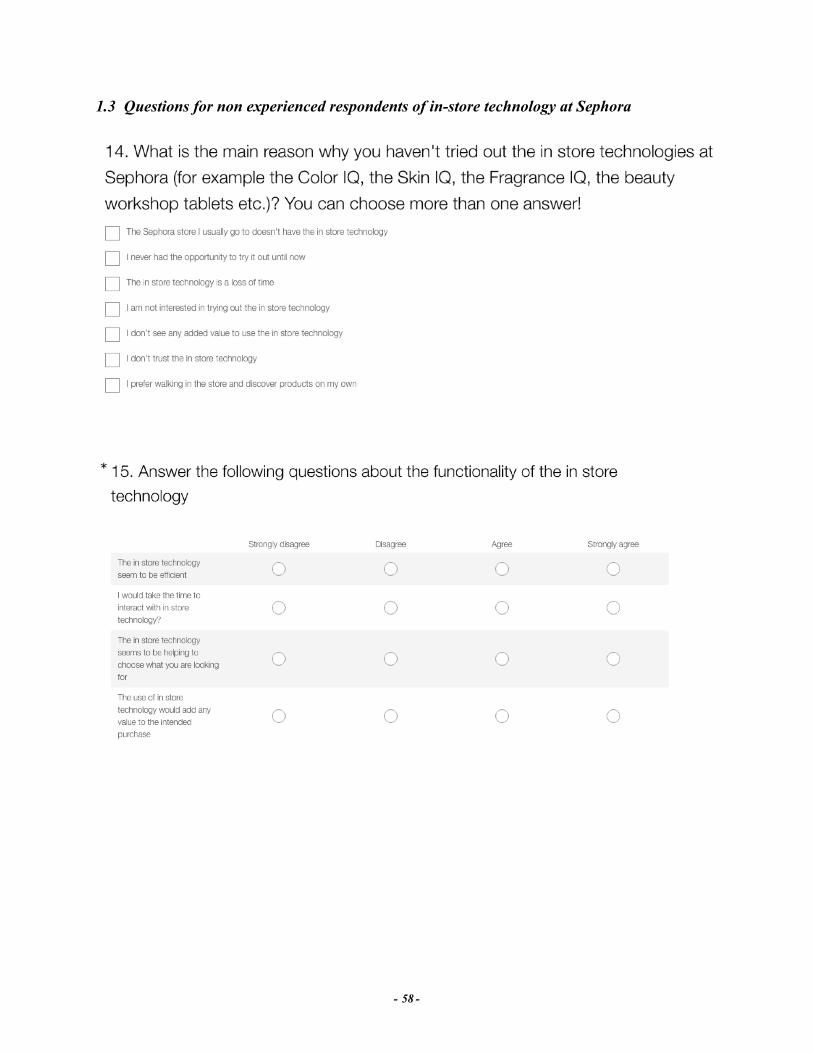
1.3 Questions for non experienced respondents of in-store technology at Sephora
- ! -58

!
- ! -59

- ! -60

Appendix 2 - Non-experienced consumers: SPSS outputs
2.1 Hypothesis 1: Bivariate analysis
- ! -61

2.2 Hypothesis 2: Bivariate analysis
2.3 Hypothesis 3: Bivariate analysis
2.4 Hypothesis 4: Bivariate analysis
- ! -62

2.5 Hypothesis 5: Bivariate analysis
2.6 Hypothesis 6: Bivariate analysis
2.7 Hypothesis 7: Bivariate analysis
- ! -63

2.8 Hypothesis 8: Bivariate analysis
2.9 Hypothesis 9: ANOVA
Appendix 3 - Experienced consumers: SPSS outputs
3.1 Hypothesis 1: Bivariate analysis
- ! -64

3.2 Hypothesis 2: Bivariate analysis
3.3 Hypothesis 3: Bivariate analysis
3.4 Hypothesis 4: Bivariate analysis
- ! -65

3.5 Hypothesis 5: Bivariate analysis
3.6 Hypothesis 6: Bivariate analysis
3.7 Hypothesis 7: Bivariate analysis
- ! -66

3.8 Hypothesis 8: Bivariate analysis
3.9 Hypothesis 9: ANOVA
- ! -67