Photometric Methods for Protein Determination
22
Biochemistry I Discussion and Lab BI/CH 421/621/527 Discussions: M 10-11 am, KCB 106 Tu 11 am -12 noon, SAR 300 W 10-11 am, SAR 300 Labs (SCI 162): W 8 am – 12 noon, 1 – 5 pm, 6 – 10 pm Th 8 am – 12 noon, 1 – 5 pm, 6 – 10 pm F 10 am – 2 pm, 3 – 7 pm M 11 am -3 pm, 4 – 8 pm Fall 2012 TF: Sarah Soltau, [email protected] Office Hours: M 12-1 pm & Tu 2:30-3:30 pm, SCI 161
Transcript of Photometric Methods for Protein Determination
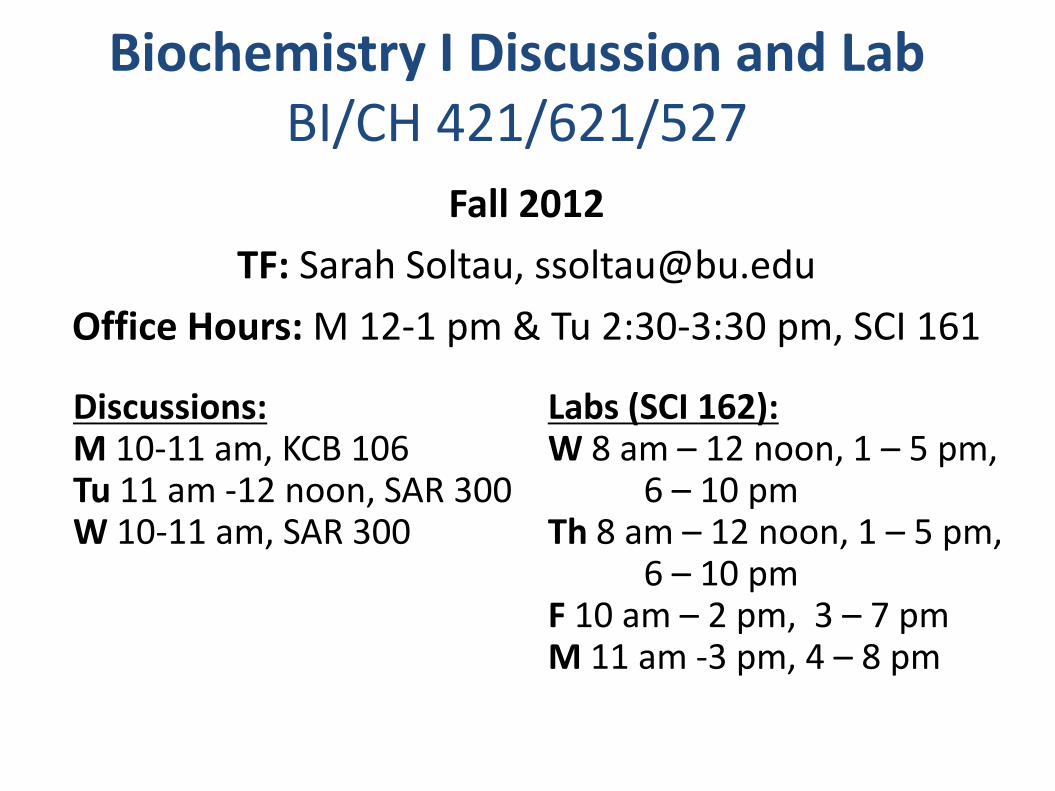
Biochemistry I Discussion and Lab BI/CH 421/621/527
Discussions: M 10-11 am, KCB 106 Tu 11 am -12 noon, SAR 300 W 10-11 am, SAR 300
Labs (SCI 162): W 8 am – 12 noon, 1 – 5 pm, 6 – 10 pm Th 8 am – 12 noon, 1 – 5 pm, 6 – 10 pm F 10 am – 2 pm, 3 – 7 pm M 11 am -3 pm, 4 – 8 pm
Fall 2012
TF: Sarah Soltau, [email protected]
Office Hours: M 12-1 pm & Tu 2:30-3:30 pm, SCI 161

Biochemistry Discussion
● Goal to provide information necessary to understand the lab and complete it efficiently
● Quiz at end of each discussion
● Lab Exam during last discussion section
● Lab Grading:
Item Weight
Discussion Quizzes 20%
Lab Write-Ups 60%
Comportment 10%
Lab Exam 10%

Biochemistry Lab Guidelines
● Need lab manual, safety glasses, and bound laboratory notebook
● Must wear closed-toed shoes and long pants, lab coats encouraged
● Read lab manual thoroughly BEFORE lab
● Write your own procedure into your lab notebook before coming lab – lab manuals will not be permitted in the lab
● Try to meet with lab partner before lab to plan out experiments ahead of time to finish on time
Biochemistry Lab Guidelines
● Problems in each chapter are optional
● Help to guide post-lab analysis in notebook section
● Answers are in appendix of each chapter
● Write down all data in Notebook section during lab
● Answer all calculations and questions in Notebook section
● Show all sample calculations

Biochemistry Lab Guidelines
● Can discuss with post-lab with your lab partner, but work must be done separately
● Academic integrity policy
● Any plagiarism is a violation and results in a zero on the assignment
● Plagiarism will be referred to the to Dean of Academic Affairs
● Labs due one week after completion in the lab – late penalty of 20% per day, weekends count as 2 days
● Labs will returned within 48 hours to boxes outside the lab, SCI 162

Laboratory Notebook Format ● Introduction
● Experimental Procedure
● Notebook Section
– Experimental Data
– Calculations
– Graphs, Pictures, Other results
– Answers to questions (NOT Problems, these are for your own benefit, answers are in the appendix)
● Discussions/Conclusions
No Pencil or White-Out in Lab Notebooks!
Chapter 1: Photometric Methods for Protein Determination
Purpose: To become familiar with three widely-used methods of determining the concentration of proteins in a solution
Methods:
●Lowry
●Dye-binding
●Direct UV absorbtion

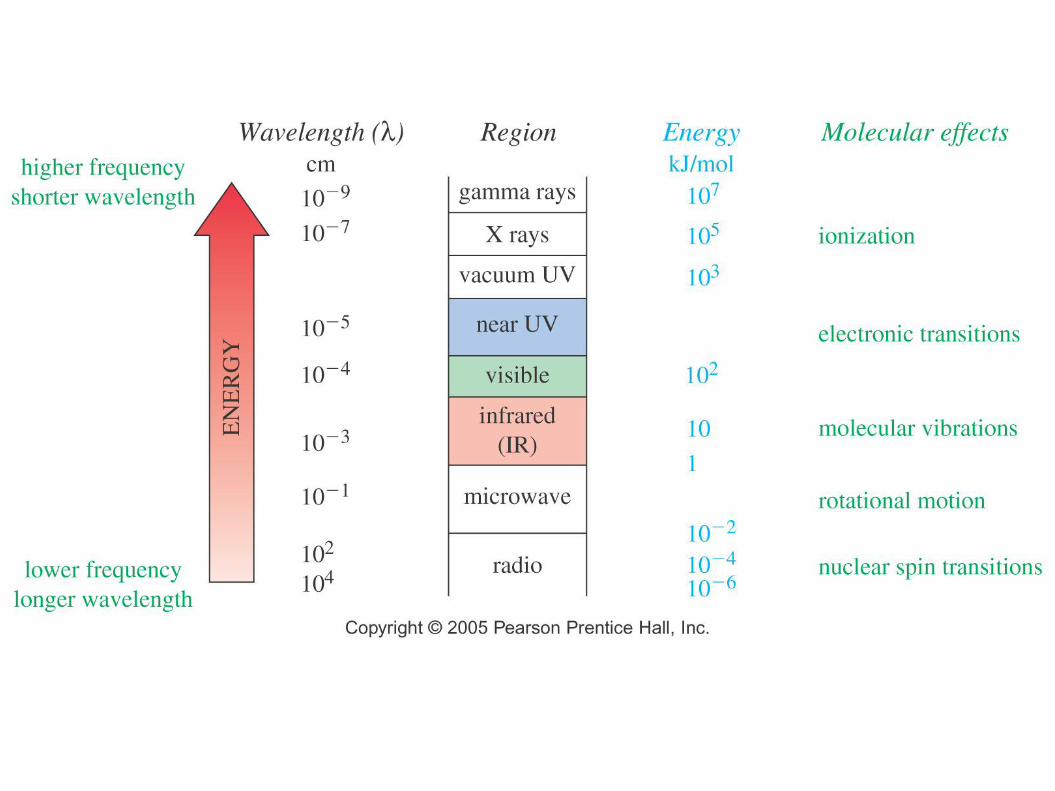
Review of Spectroscopy
● Electromagnetic radiation (EMR) ranges from high energy (cosmic rays) to low energy (radiowaves)
● E = hν
● h = 6.626 X 10⁻³⁴ J s
● ν = frequency of EMR
● The greater the frequency the greater the E
● Due to electronic configuration functional groups absorb EMR at different frequencies

Laboratory Measurements Use Wavelength
● Spectrophotometers
● UV/Vis measures Absorbance at λ
● c = λ ν
● Replacing ν in E equation
E = hc/λ
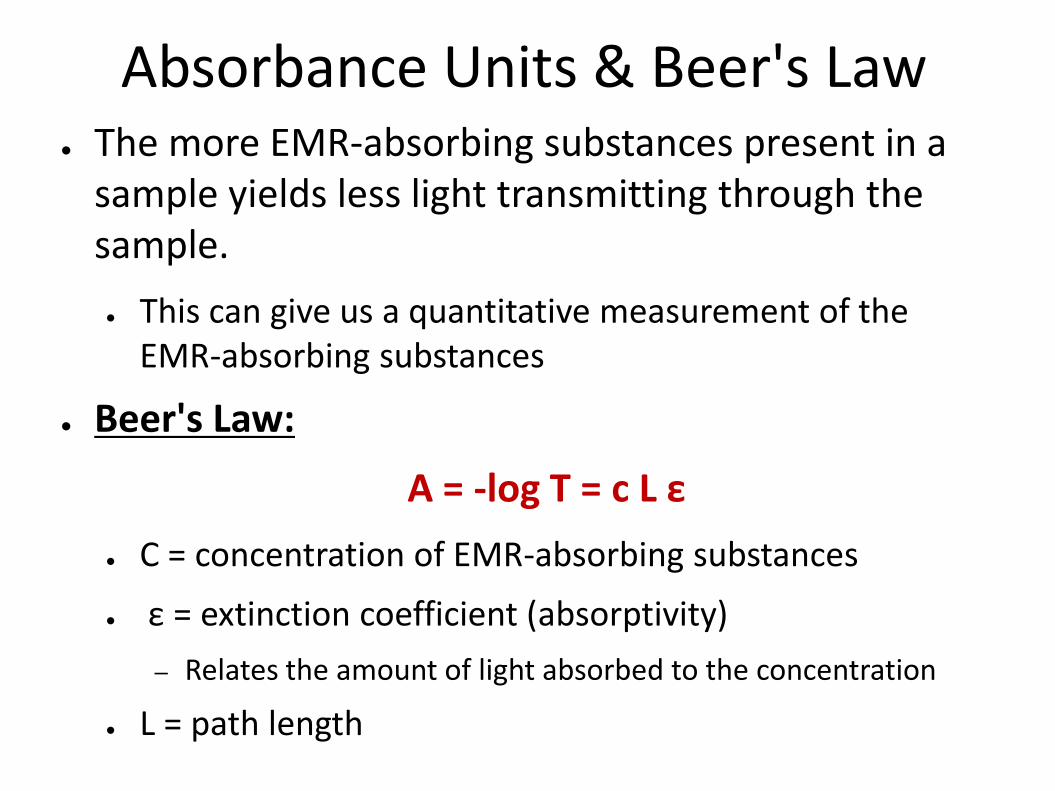
Absorbance Units & Beer's Law ● The more EMR-absorbing substances present in a
sample yields less light transmitting through the sample.
● This can give us a quantitative measurement of the EMR-absorbing substances
● Beer's Law:
A = -log T = c L ε
● C = concentration of EMR-absorbing substances
● ε = extinction coefficient (absorptivity)
– Relates the amount of light absorbed to the concentration
● L = path length

Proteins Absorb at 280 nm ● λmax in proteins is 280 nm due to Trp and Tyr
● The more Trp and Tyr, the greater the A of EMR
● However, different proteins contain different amounts of Tyr and Trp
● Direct UV absorption data cannot tell you [Protein] without ε
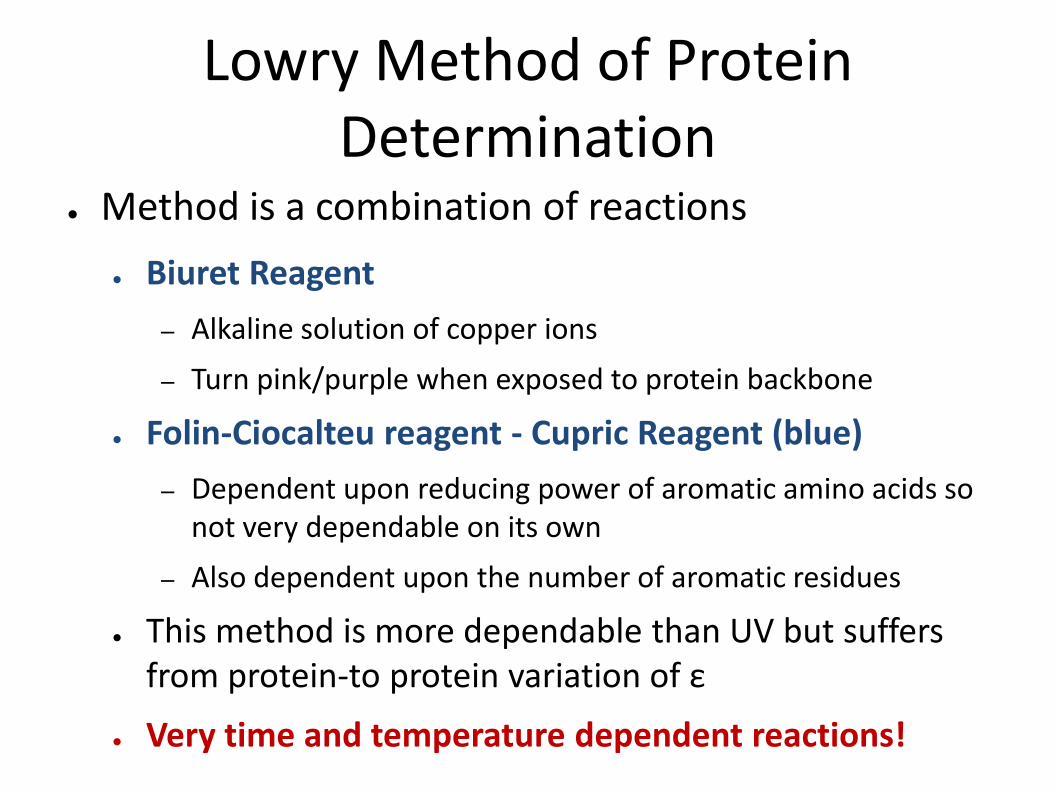
Lowry Method of Protein Determination
● Method is a combination of reactions
● Biuret Reagent
– Alkaline solution of copper ions
– Turn pink/purple when exposed to protein backbone
● Folin-Ciocalteu reagent - Cupric Reagent (blue)
– Dependent upon reducing power of aromatic amino acids so not very dependable on its own
– Also dependent upon the number of aromatic residues
● This method is more dependable than UV but suffers from protein-to protein variation of ε
● Very time and temperature dependent reactions!

Dye-Binding (Bradford) Assay
● A blue dye is used
● Coomassie Brilliant Blue G250
● Absorbs light at 465 nm (λmax)
● Upon binding protein absorbs light at 595 nm
● Small effects of buffer
– Blanking the dye with buffer compensates
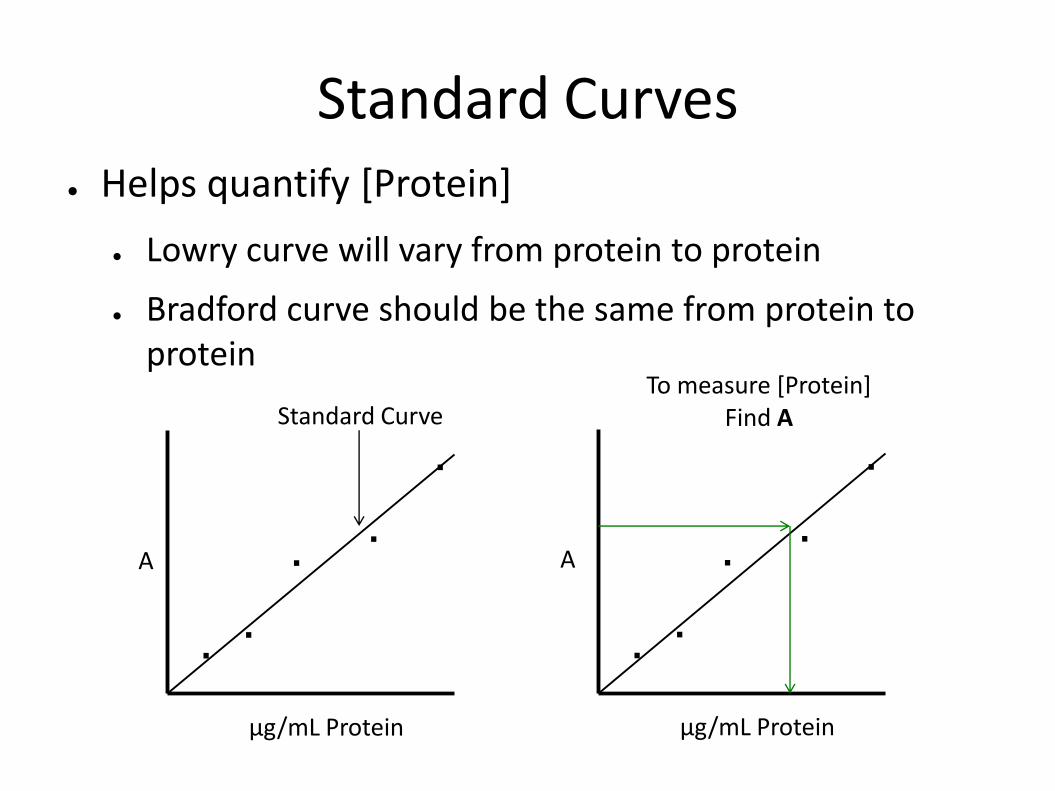
Standard Curves ● Helps quantify [Protein]
● Lowry curve will vary from protein to protein
● Bradford curve should be the same from protein to protein
A
µg/mL Protein
. .
. .
.
Standard Curve
A
µg/mL Protein
. .
. .
.
To measure [Protein] Find A
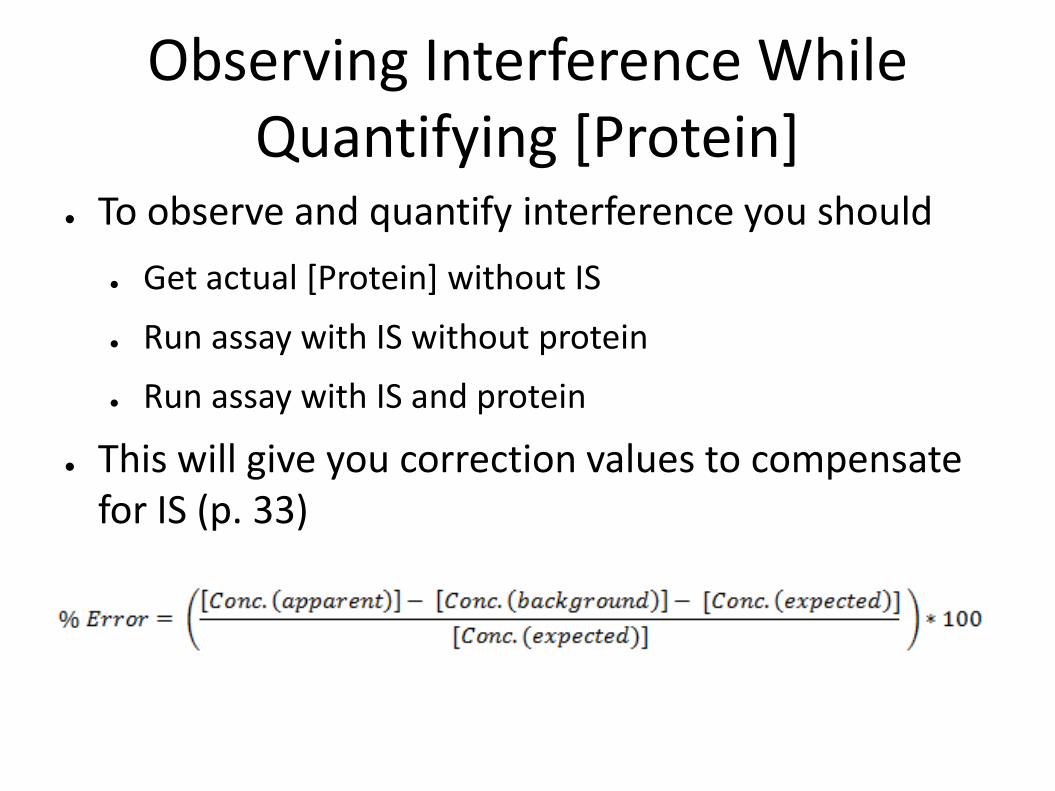
Observing Interference While Quantifying [Protein]
● To observe and quantify interference you should
● Get actual [Protein] without IS
● Run assay with IS without protein
● Run assay with IS and protein
● This will give you correction values to compensate for IS (p. 33)

Serial Dilutions
● Sometimes serial dilutions are needed to dilute a substance to a “workable” concentration
● Standard Dilution
M1V1 = M2V2
● To make 1.00 mL of a 0.10 mg/mL solution from a 1.0 mg/mL stock
● Use 0.100 mL of Stock and 0.900 mL appropriate buffer
● 0.100 mL is an easily-measured volume

Serial Dilutions ● To make a 10 ng/mL solution from the same stock
● Need 0.0000100 mL of Stock – not easily measured
● Serial dilution necessary
● Dilute from 1.0 mg/mL to 10 µg/mL
● Requires 10 µL of Stock and 990 µL buffer
● Dilute this Second Stock to 100 ng/mL
● Requires 10 µL of New Stock and 990 µL buffer
● Dilute Third stock 10-fold to 10 ng/mL
● Requires 100 µL Third Stock with 900 µL buffer

When May a Serial Dilution be Necessary?
A
µg/mL Protein
. .
. .
.
Your solution's A reading Is MUCH higher than the Standard Curve

Micropipets ● Use to dispense liquids > 1 mL
● P1000 : 200 µl – 1000 μl
● P200: 20 µl – 200 µl
● P20: 2 µl – 20 µl
● Push plunger to first stop to draw in liquid
● Release plunger slowly
● Push plunger to the second stop to release all liquid in the tip

What Should Be In Your Notebook Before Lab?

What Should Be In Your Notebook Before Lab?
● Introduction – 3-4 sentences, goals of experiment
● Procedure – In your own words, not copied from lab manual
● Setup/Materials
● Data tables and space to write down experimental results during lab


![Protein structure determination & prediction. Tertiary protein structure: protein folding Three main approaches: [1] experimental determination (X-ray.](https://static.fdocuments.us/doc/165x107/56649d605503460f94a41068/protein-structure-determination-prediction-tertiary-protein-structure-protein.jpg)

![Protein structure determination. Tertiary protein structure: protein folding Three main approaches: [1] experimental determination (X-ray crystallography,](https://static.fdocuments.us/doc/165x107/56649d3e5503460f94a17891/protein-structure-determination-tertiary-protein-structure-protein-folding.jpg)