Photometric and Spectroscopic Properties of Type Ia ...
33
Photometric and Spectroscopic Properties of Type Ia Supernova 2018oh with Early Excess Emission from the Kepler 2 Observations W. Li 1,2 , X. Wang 1 , J. Vinkó 3,4,5 , J. Mo 1 , G. Hosseinzadeh 2,6,7 , D. J. Sand 8 , J. Zhang 9,10,11 , H. Lin 1 PTSS/TNTS, T. Zhang 12 , L. Wang 13,14 , J. Zhang 1 , Z. Chen 1 , D. Xiang 1 , L. Rui 1 , F. Huang 1,15 , X. Li 1 , X. Zhang 1 , L. Li 1 , E. Baron 16 , J. M. Derkacy 16 , X. Zhao 17 , H. Sai 1 , K. Zhang 1,5 , L. Wang 12,18 LCO, D. A. Howell 2,6 , C. McCully 2 , I. Arcavi 2,6,19,77 , S. Valenti 20 , D. Hiramatsu 2,6 , J. Burke 2,6 KEGS, A. Rest 21,22 , P. Garnavich 23 , B. E. Tucker 24,25,26 , G. Narayan 21,78 , E. Shaya 27 , S. Margheim 28 , A. Zenteno 29 , A. Villar 7 UCSC, G. Dimitriadis 30 , R. J. Foley 30 , Y.-C. Pan 30 , D. A. Coulter 30 , O. D. Fox 21 , S. W. Jha 31 , D. O. Jones 30 , D. N. Kasen 32,33 , C. D. Kilpatrick 30 , A. L. Piro 34 , A. G. Riess 21,22 , C. Rojas-Bravo 30 ASAS-SN, B. J. Shappee 35 , T. W.-S. Holoien 34,79 , K. Z. Stanek 36,37 , M. R. Drout 34,80,81 , K. Auchettl 36,38 , C. S. Kochanek 36,37 , J. S. Brown 37 , S. Bose 39 , D. Bersier 40 , J. Brimacombe 41 , P. Chen 39 , S. Dong 39 , S. Holmbo 42 , J. A. Muñoz 43,44 , R. L. Mutel 45 , R. S. Post 46 , J. L. Prieto 47,48 , J. Shields 37 , D. Tallon 45 , T. A. Thompson 36,37 , P. J. Vallely 37 , S. Villanueva, Jr. 37 Pan-STARRS, S. J. Smartt 49 , K. W. Smith 50 , K. C. Chambers 51 , H. A. Flewelling 51 , M. E. Huber 51 , E. A. Magnier 51 , C. Z. Waters 51 , A. S. B. Schultz 51,52 , J. Bulger 51 , T. B. Lowe 51 , M. Willman 51 Konkoly/Texas, K. Sárneczky 3 , A. Pál 3 , J. C. Wheeler 14,53 , A. Bódi 3 , Zs. Bognár 3 , B. Csák 3 , B. Cseh 3 , G. Csörnyei 3 , O. Hanyecz 3 , B. Ignácz 3 , Cs. Kalup 3 , R. Könyves-Tóth 3 , L. Kriskovics 3 , A. Ordasi 3 , I. Rajmon 54 , A. Sódor 3 , R. Szabó 3,52 , R. Szakáts 3 , G. Zsidi 3 UniversityofArizona, P. Milne 8 , J. E. Andrews 8 , N. Smith 8 , C. Bilinski 8 Swift, P. J. Brown 14,55 ePESSTO, J. Nordin 56 , S. C. Williams 57 , L. Galbany 58 , J. Palmerio 59 , I. M. Hook 57 , C. Inserra 60 , K. Maguire 61 , Régis Cartier 62 , A. Razza 63,64 , C. P. Gutiérrez 65 UniversityofNorthCarolina, J. J. Hermes 66,80 , J. S. Reding 66 , B. C. Kaiser 66 ATLAS, J. L. Tonry 35 , A. N. Heinze 35 , L. Denneau 35 , H. Weiland 35 , B. Stalder 67 K2 Mission Team, and G. Barentsen 68,69 , J. Dotson 68 , T. Barclay 70,71 , M. Gully-Santiago 68,69 , C. Hedges 68,69 , A. M. Cody 68,69 , S. Howell 72 Kepler Spacecraft Team, J. Coughlin 72,73 , J. E. Van Cleve 72,73 , J. Vinícius de Miranda Cardoso 72,74 , K. A. Larson 75 , K. M. McCalmont-Everton 75 , C. A. Peterson 75 , S. E. Ross 75 , L. H. Reedy 76 , D. Osborne 76 , C. McGinn 76 , L. Kohnert 76 , L. Migliorini 76 , A. Wheaton 76 , B. Spencer 76 , C. Labonde 76 , G. Castillo 76 , G. Beerman 76 , K. Steward 76 , M. Hanley 76 , R. Larsen 76 , R. Gangopadhyay 76 , R. Kloetzel 76 , T. Weschler 76 , V. Nystrom 76 , J. Moffatt 76 , M. Redick 76 , K. Griest 76 , M. Packard 76 , M. Muszynski 76 , J. Kampmeier 76 , R. Bjella 76 , S. Flynn 76 , and B. Elsaesser 76 1 Physics Department and Tsinghua Center for Astrophysics (THCA), Tsinghua University, Beijing, 100084, Peopleʼs Republic of China 2 Las Cumbres Observatory, 6740 Cortona Dr. Ste. 102, Goleta, CA 93117-5575, USA 3 Konkoly Observatory, MTA CSFK, Konkoly Thege M. ut 15-17, Budapest, 1121, Hungary 4 Department of Optics & Quantum Electronics, University of Szeged, Dom ter 9, Szeged, 6720 Hungary 5 Department of Astronomy, University of Texas at Austin, Austin, TX 78712, USA 6 Department of Physics, University of California, Santa Barbara, CA 93106-9530, USA 7 Harvard-Smithsonian Center for Astrophysics, 60 Garden Street, Cambridge, MA 02138, USA 8 Steward Observatory, University of Arizona, 933 North Cherry Avenue, Rm. N204, Tucson, AZ 85721-0065, USA 9 Yunnan Observatories (YNAO), Chinese Academy of Sciences, Kunming 650216, Peopleʼs Republic of China 10 Key Laboratory for the Structure and Evolution of Celestial Objects, Chinese Academy of Sciences, Kunming 650216, Peopleʼs Republic of China 11 Center for Astronomical Mega-Science, Chinese Academy of Sciences, 20A Datun Road, Chaoyang District, Beijing, 100012, Peopleʼs Republic of China The Astrophysical Journal, 870:12 (33pp), 2019 January 1 https://doi.org/10.3847/1538-4357/aaec74 © 2018. The American Astronomical Society. All rights reserved. 1
Transcript of Photometric and Spectroscopic Properties of Type Ia ...
Photometric and Spectroscopic Properties of Type Ia Supernova 2018oh with EarlyExcess Emission from the Kepler 2 Observations
W. Li1,2, X. Wang
1, J. Vinkó
3,4,5, J. Mo
1, G. Hosseinzadeh
2,6,7, D. J. Sand
8, J. Zhang
9,10,11, H. Lin
1
PTSS/TNTS,T. Zhang
12, L. Wang
13,14, J. Zhang
1, Z. Chen
1, D. Xiang
1, L. Rui
1, F. Huang
1,15, X. Li
1, X. Zhang
1, L. Li
1, E. Baron
16,
J. M. Derkacy16, X. Zhao
17, H. Sai
1, K. Zhang
1,5, L. Wang
12,18
LCO,
D. A. Howell2,6, C. McCully
2, I. Arcavi
2,6,19,77, S. Valenti
20, D. Hiramatsu
2,6, J. Burke
2,6
KEGS,
A. Rest21,22
, P. Garnavich23
, B. E. Tucker24,25,26
, G. Narayan21,78
, E. Shaya27
, S. Margheim28
, A. Zenteno29, A. Villar
7
UCSC,
G. Dimitriadis30, R. J. Foley
30, Y.-C. Pan
30, D. A. Coulter
30, O. D. Fox
21, S. W. Jha
31, D. O. Jones
30, D. N. Kasen
32,33,
C. D. Kilpatrick30
, A. L. Piro34
, A. G. Riess21,22
, C. Rojas-Bravo30
ASAS-SN,
B. J. Shappee35, T. W.-S. Holoien
34,79, K. Z. Stanek
36,37, M. R. Drout
34,80,81, K. Auchettl
36,38, C. S. Kochanek
36,37,
J. S. Brown37
, S. Bose39
, D. Bersier40
, J. Brimacombe41, P. Chen
39, S. Dong
39, S. Holmbo
42, J. A. Muñoz
43,44,
R. L. Mutel45
, R. S. Post46, J. L. Prieto
47,48, J. Shields
37, D. Tallon
45, T. A. Thompson
36,37, P. J. Vallely
37,
S. Villanueva, Jr.37
Pan-STARRS,
S. J. Smartt49
, K. W. Smith50, K. C. Chambers
51, H. A. Flewelling
51, M. E. Huber
51, E. A. Magnier
51,
C. Z. Waters51
, A. S. B. Schultz51,52
, J. Bulger51
, T. B. Lowe51, M. Willman
51
Konkoly/Texas,K. Sárneczky
3, A. Pál
3, J. C. Wheeler
14,53, A. Bódi
3, Zs. Bognár
3, B. Csák
3, B. Cseh
3, G. Csörnyei
3, O. Hanyecz
3,
B. Ignácz3, Cs. Kalup
3, R. Könyves-Tóth
3, L. Kriskovics
3, A. Ordasi
3, I. Rajmon
54, A. Sódor
3, R. Szabó
3,52, R. Szakáts
3,
G. Zsidi3
UniversityofArizona,P. Milne
8, J. E. Andrews
8, N. Smith
8, C. Bilinski
8
Swift,
P. J. Brown14,55
ePESSTO,
J. Nordin56, S. C. Williams
57, L. Galbany
58, J. Palmerio
59, I. M. Hook
57, C. Inserra
60, K. Maguire
61, Régis Cartier
62,
A. Razza63,64
, C. P. Gutiérrez65
UniversityofNorthCarolina,J. J. Hermes
66,80, J. S. Reding
66, B. C. Kaiser
66
ATLAS,
J. L. Tonry35
, A. N. Heinze35
, L. Denneau35, H. Weiland
35, B. Stalder
67
K2 Mission Team,
and
G. Barentsen68,69
, J. Dotson68
, T. Barclay70,71
, M. Gully-Santiago68,69
, C. Hedges68,69
, A. M. Cody68,69
,
S. Howell72
Kepler Spacecraft Team,
J. Coughlin72,73
, J. E. Van Cleve72,73
, J. Vinícius de Miranda Cardoso72,74
, K. A. Larson75, K. M. McCalmont-Everton
75,
C. A. Peterson75, S. E. Ross
75, L. H. Reedy
76, D. Osborne
76, C. McGinn
76, L. Kohnert
76, L. Migliorini
76, A. Wheaton
76,
B. Spencer76, C. Labonde
76, G. Castillo
76, G. Beerman
76, K. Steward
76, M. Hanley
76, R. Larsen
76, R. Gangopadhyay
76,
R. Kloetzel76, T. Weschler
76, V. Nystrom
76, J. Moffatt
76, M. Redick
76, K. Griest
76, M. Packard
76, M. Muszynski
76, J. Kampmeier
76,
R. Bjella76, S. Flynn
76, and B. Elsaesser
76
1Physics Department and Tsinghua Center for Astrophysics (THCA), Tsinghua University, Beijing, 100084, Peopleʼs Republic of China
2Las Cumbres Observatory, 6740 Cortona Dr. Ste. 102, Goleta, CA 93117-5575, USA
3Konkoly Observatory, MTA CSFK, Konkoly Thege M. ut 15-17, Budapest, 1121, Hungary
4Department of Optics & Quantum Electronics, University of Szeged, Dom ter 9, Szeged, 6720 Hungary
5Department of Astronomy, University of Texas at Austin, Austin, TX 78712, USA
6Department of Physics, University of California, Santa Barbara, CA 93106-9530, USA
7Harvard-Smithsonian Center for Astrophysics, 60 Garden Street, Cambridge, MA 02138, USA
8Steward Observatory, University of Arizona, 933 North Cherry Avenue, Rm. N204, Tucson, AZ 85721-0065, USA9Yunnan Observatories (YNAO), Chinese Academy of Sciences, Kunming 650216, Peopleʼs Republic of China
10Key Laboratory for the Structure and Evolution of Celestial Objects, Chinese Academy of Sciences, Kunming 650216, Peopleʼs Republic of China
11Center for Astronomical Mega-Science, Chinese Academy of Sciences, 20A Datun Road, Chaoyang District, Beijing, 100012, Peopleʼs Republic of China
The Astrophysical Journal, 870:12 (33pp), 2019 January 1 https://doi.org/10.3847/1538-4357/aaec74
© 2018. The American Astronomical Society. All rights reserved.
1
12National Astronomical Observatory of China, Chinese Academy of Sciences, Beijing, 100012, Peopleʼs Republic of China
13Purple Mountain Observatory, Chinese Academy of Sciences, Nanjing 210034, Peopleʼs Republic of China
14George P. and Cynthia Woods Mitchell Institute for Fundamental Physics & Astronomy, Texas A&M University, Department of Physics and Astronomy, 4242
TAMU, College Station, TX 77843, USA15
Department of Astronomy, School of Physics and Astronomy, Shanghai Jiao Tong University, Shanghai 200240, Peopleʼs Republic of China16
Homer L. Dodge Department of Physics and Astronomy, University of Oklahoma, Norman, OK, USA17
School of Science, Tianjin University of Technology, Tianjin, 300384, Peopleʼs Republic of China18
Chinese Academy of Sciences South America Center for Astronomy, China-Chile Joint Center for Astronomy, Camino El Observatorio 1515, Las Condes,Santiago, Chile
19The Raymond and Beverly Sackler School of Physics and Astronomy, Tel Aviv University, Tel Aviv 69978, Israel
20Department of Physics, University of California, Davis, CA 95616, USA
21Space Telescope Science Institute, 3700 San Martin Drive, Baltimore, MD 21218, USA
22Department of Physics and Astronomy, Johns Hopkins University, Baltimore, MD 21218, USA
23Department of Physics, University of Notre Dame, 225 Nieuwland Science Hall, Notre Dame, IN 46556-5670, USA
24The Research School of Astronomy and Astrophysics, Mount Stromlo Observatory, Australian National University, Canberra, ACT 2611, Australia
25National Centre for the Public Awareness of Science, Australian National University, Canberra, ACT 2611, Australia
26The ARC Centre of Excellence for All-Sky Astrophysics in 3 Dimension (ASTRO 3D), Australia
27Astronomy Department, University of Maryland, College Park, MD 20742-2421, USA
28Gemini Observatory, Southern Operations Center, c/o AURA, Casilla 603, La Serena, Chile
29Cerro Tololo Inter-American Observatory, Casilla 603, La Serena, Chile
30Department of Astronomy and Astrophysics, University of California, Santa Cruz, CA 95064, USA
31Department of Physics and Astronomy, Rutgers, The State University of New Jersey, 136 Frelinghuysen Road, Piscataway, NJ 08854, USA
32Department of Astronomy, University of California, Berkeley, CA 94720-3411, USA
33Lawrence Berkeley National Laboratory, Berkeley, CA 94720, USA
34The Observatories of the Carnegie Institution for Science, 813 Santa Barbara St., Pasadena, CA 91101, USA
35Institute for Astronomy, University of Hawai’i, 2680 Woodlawn Drive, Honolulu, HI 96822, USA
36Center for Cosmology and AstroParticle Physics (CCAPP), The Ohio State University, 191 W. Woodruff Ave., Columbus, OH 43210, USA
37Department of Astronomy, The Ohio State University, 140 West 18th Avenue, Columbus, OH 43210, USA
38Department of Physics, The Ohio State University, 191 W. Woodruff Avenue, Columbus, OH 43210, USA
39Kavli Institute for Astronomy and Astrophysics, Peking University, Yi He Yuan Road 5, Hai Dian District, Beijing 100871, Peopleʼs Republic of China
40Astrophysics Research Institute, Liverpool John Moores University, 146 Brownlow Hill, Liverpool L3 5RF, UK
41Coral Towers Observatory, Cairns, QLD 4870, Australia
42Department of Physics and Astronomy, Aarhus University, Ny Munkegade 120, DK-8000 Aarhus C, Denmark43
Departamento de Astronomía y Astrofísica, Universidad de Valencia, E-46100 Burjassot, Valencia, Spain44
Observatorio Astronómico, Universidad de Valencia, E-46980 Paterna, Valencia, Spain45
Department of Physics and Astronomy, University of Iowa, Iowa City, IA 52242, USA46
Post Observatory, Lexington, MA 02421, USA47
Núcleo de Astronomía de la Facultad de Ingeniería, Universidad Diego Portales, Av. Ejército 441, Santiago, Chile48
Millennium Institute of Astrophysics, Santiago, Chile49
Astrophysics Research Centre, School of Mathematics and Physics, Queen’s University Belfast, Northern Ireland, BT7 1NN, UK50
Queen’s University Belfast, Northern Ireland, BT7 1NN, UK51
Institute for Astronomy, University of Hawaii at Manoa, 2680 Woodlawn Drive, Honolulu, HI 96822, USA52
MTA CSFK Lendület Near-Field Cosmology Research Group, Budapest, Hungary53
Department of Astronomy, University of Texas at Austin, Austin, TX 78712, USA54
Berzsenyi Dániel High School, Kárpát utca 49-53, Budapest, 1133, Hungary55
Department of Physics and Astronomy, Texas A&M University, 4242 TAMU, College Station, TX 77843, USA56
Institute of Physics, Humboldt-Universität zu Berlin, Newtonstr. 15, D-12489 Berlin, Germany57
Physics Department, Lancaster University, Lancaster LA1 4 YB, UK58
PITT PACC, Department of Physics and Astronomy, University of Pittsburgh, Pittsburgh, PA 15260, USA59
Sorbonne Universités, UPMC Univ. Paris 6 et CNRS, UMR 7095, Institut dAstrophysique de Paris, 98 bis bd Arago, F-75014 Paris, France60
Department of Physics and Astronomy, University of Southampton, Southampton, SO17 1BJ, UK61
Astrophysics Research Centre, School of Mathematics and Physics, Queen’s University Belfast, Belfast BT7 1NN, UK62
Cerro Tololo Inter-American Observatory, National Optical Astronomy Observatory, Casilla 603, La Serena, Chile63
European Southern Observatory, Alonso de Córdova 3107, Casilla 19, Santiago, Chile64
Departamento de Astronomía, Universidad de Chile, Camino El Observatorio 1515, Las Condes, Santiago, Chile65
University of Southampton, Southampton, SO17 1BJ, UK66
Department of Physics and Astronomy, University of North Carolina, Chapel Hill, NC 27599, USA67
LSST, 950 North Cherry Avenue, Tucson, AZ 85719, USA68
NASA Ames Research Center, Moffett Blvd., Mountain View, CA 94035, USA69
Bay Area Environmental Research Institute, P.O. Box 25, Moffett Field, CA 94035, USA70
NASA Goddard Space Flight Center, 8800 Greenbelt Rd., Greenbelt, MD 20771, USA71
University of Maryland, Baltimore County, 1000 Hilltop Cir., Baltimore, MD 21250, USA72
NASA Ames Research Center, Moffett Field, CA 94035, USA73
SETI Institute, 189 Bernardo Avenue, Mountain View, CA 94043, USA74
Universidade Federal de Campina Grande, Campina Grande, Brazil75
Ball Aerospace and Technologies Corp., Boulder, CO 80301, USA76
LASP, University of Colorado at Boulder, Boulder, CO 80303, USAReceived 2018 July 31; revised 2018 October 12; accepted 2018 October 12; published 2018 December 28
77Einstein Fellow.
78Lasker Fellow.
79Carnegie Fellow.
80Hubble Fellow.
81Dunlap Fellow.
2
The Astrophysical Journal, 870:12 (33pp), 2019 January 1 Li et al.
Abstract
Supernova (SN) 2018oh (ASASSN-18bt) is the first spectroscopically confirmed Type Ia supernova (SN Ia)observed in the Kepler field. The Kepler data revealed an excess emission in its early light curve, allowing us toplace interesting constraints on its progenitor system. Here we present extensive optical, ultraviolet, and near-infrared photometry, as well as dense sampling of optical spectra, for this object. SN 2018oh is relatively normal inits photometric evolution, with a rise time of 18.3±0.3 days and Δm15(B)=0.96±0.03 mag, but it seems tohave bluer B−V colors. We construct the “UVOIR” bolometric light curve having a peak luminosity of1.49×1043 erg s−1, from which we derive a nickel mass as 0.55±0.04Me by fitting radiation diffusion modelspowered by centrally located 56Ni. Note that the moment when nickel-powered luminosity starts to emerge is+3.85 days after the first light in the Kepler data, suggesting other origins of the early-time emission, e.g., mixingof 56Ni to outer layers of the ejecta or interaction between the ejecta and nearby circumstellar material or anondegenerate companion star. The spectral evolution of SN 2018oh is similar to that of a normal SN Ia but ischaracterized by prominent and persistent carbon absorption features. The CII features can be detected from theearly phases to about 3 weeks after the maximum light, representing the latest detection of carbon ever recorded inan SN Ia. This indicates that a considerable amount of unburned carbon exists in the ejecta of SN 2018oh and maymix into deeper layers.
Key words: supernovae: general – supernovae: individual (SN 2018oh)
1. Introduction
Type Ia supernovae (SNe Ia) have been used as standardizablecandles for measuring cosmic expansion, leading to the discoveryof the accelerating expansion of the universe and hence the“mysterious” dark energy (Riess et al. 1998; Perlmutter et al.1999). However, the exact nature of their progenitor systems isstill highly controversial (Wang et al. 2013; Maoz et al. 2014).Two popular scenarios have been proposed so far for SN Iaprogenitors. One is an explosion of a carbon–oxygen (CO) whitedwarf (WD) that accretes hydrogen- or helium-rich materials froma nondegenerate companion that could be a main-sequence star, ared giant, or even a helium star (Whelan & Iben 1973; Nomoto1982; Nomoto et al. 1997). This single-degenerate (SD) scenariois favored by possible detections of circumstellar material (CSM)
around some SNeIa (Hamuy et al. 2003; Aldering et al. 2006;Patat et al. 2007; Sternberg et al. 2011; Dilday et al. 2012;Maguire et al. 2013; Silverman et al. 2013). It is disfavored by thelack of narrow hydrogen emission lines in late-time spectra(Mattila et al. 2005; Leonard 2007; Shappee et al. 2013; Maguireet al. 2016). The other scenario involves the merging explosion oftwo WDs, dubbed a double-degenerate (DD) scenario (Iben &Tutukov 1984; Webbink 1984). The DD model has recentlygained more attention due to the observational findings that thereare no companion signatures for some SNe Ia, including thenearby object SN 2011fe and the supernova remnants SN 1006and SNR 0509-67.5 in the Large Magellanic Cloud, down to theluminosity that is much fainter than the Sun (Li et al. 2011;González Hernández et al. 2012; Schaefer & Pagnotta 2012).Some population synthesis calculations predict delay-timedistribution shapes for the birth rate of SNe Ia in the DDscenario, which are consistent with observations (Mennekens et al.2010; Toonen et al. 2012).The SNe Ia also show increasing diversity in their spectro-
scopic and photometric properties. For instance, members ofthe so-called high-velocity (HV) subclass are found to havelarger ejecta velocities, redder peak B−V colors, and slowerlate-time decline rates at bluer wavelengths than those withnormal ejecta velocities (Wang et al. 2008, 2009b; Foley &Kasen 2011; Foley et al. 2011; Foley 2012; Mandel et al.2014). The observed differences between the HV and normalSNeIa have been interpreted as a geometric consequence ofasymmetric explosions (Maeda et al. 2010; Maund et al. 2010).
However, the fact that the HV subclass tends to be associatedwith more metal-rich and luminous stellar environmentsindicates that SNe Ia likely arise from more than one progenitorpopulation (Wang et al. 2013).Very early observations of SNe Ia can provide clues to
distinguish different progenitor models. According to thetheoretical analysis by Kasen (2010), the collision betweenthe material ejected by the SN and a nondegenerate companionstar will produce extra emission, leading to a “bump” feature inthe early-time light curves. This amount depends on theviewing angle, companion size, and separation. Possibledetections of such bump features have been reported for SNe2012cg (Marion et al. 2016; although see Shappee et al.2018a), iPTF14atg (Cao et al. 2015), iPTF16abc (Miller et al.2018), and 2017cbv (Hosseinzadeh et al. 2017; although seeSand et al. 2018), indicating that they might have SDprogenitor systems. Of these, iPTF14atg is a peculiar low-luminosity SN like SN 2002es (Ganeshalingam et al. 2012) andis not representative of normal SNe Ia. Miller et al. (2018)suggested the early flux of iPTF16abc can be explained by thecollision of the SN with nearby material and/or strong mixingof 56Ni in the SN ejecta. For SN 2017cbv, however, thecollision of SN ejecta with a nondegenerate companion starmatches well with the optical observations but overpredicts theUV flux.The Kepler Space Telescope, observing with a time
resolution of 30 minutes, can be an extremely powerful toolfor finding excess early-time emission (Haas et al. 2010).Olling et al. (2015) studied the Kepler light curves of three SNeIa, and they found no signatures of ejecta–companioninteraction in the early phase of the explosions. This isconsistent with DD models. However, further studies of theseSNe were limited by the lack of prompt follow-up observationsby other facilities.An SN Ia in the face-on spiral galaxy UGC 4780 (see
Figure 1) at a distance of about ∼53Mpc (z∼0.0109), SN2018oh (ASASSN-18bt) provides us a rare opportunity toexamine the progenitor of an SN Ia system through theobserved properties based on both continuous Kepler data andextensive follow-up observations. This SN was discovered bythe All Sky Automated Survey for SuperNovae (ASAS-SN;Shappee et al. 2014) on 2018 February 4.41 (UT time is usedthroughout this paper) at R.A.=09h06m39 59, decl.=+19°
3
The Astrophysical Journal, 870:12 (33pp), 2019 January 1 Li et al.
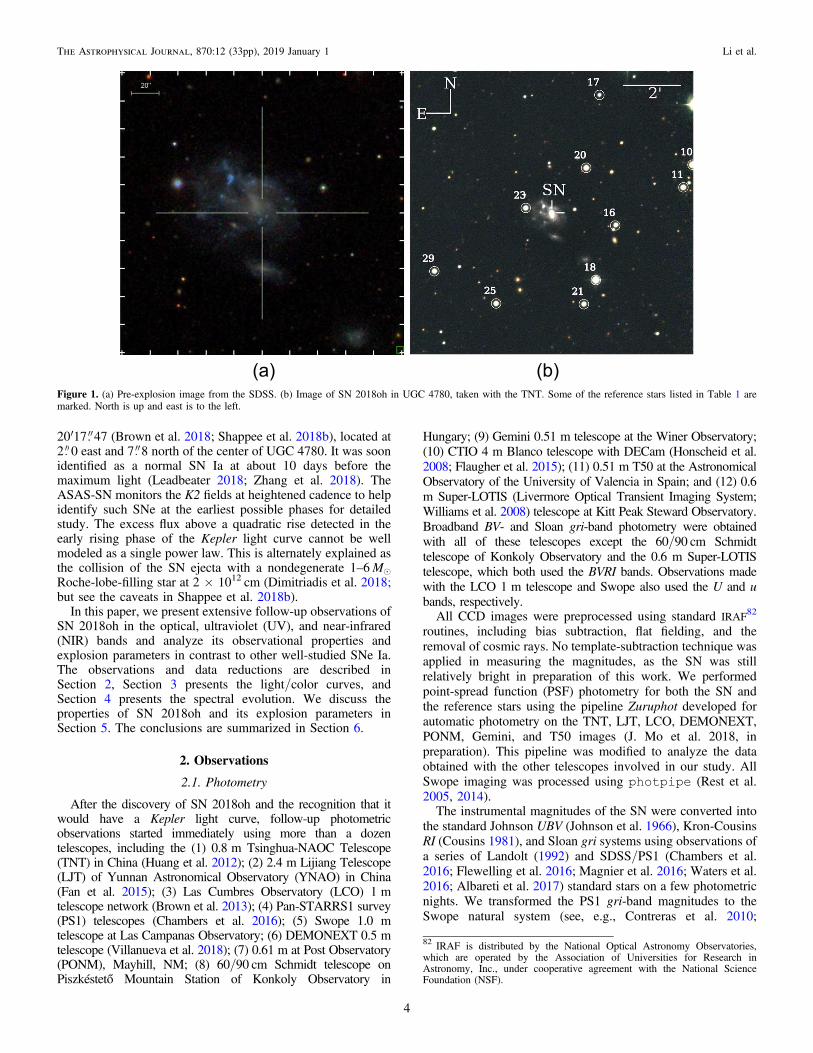
20′17 47 (Brown et al. 2018; Shappee et al. 2018b), located at2 0 east and 7 8 north of the center of UGC 4780. It was soonidentified as a normal SN Ia at about 10 days before themaximum light (Leadbeater 2018; Zhang et al. 2018). TheASAS-SN monitors the K2 fields at heightened cadence to helpidentify such SNe at the earliest possible phases for detailedstudy. The excess flux above a quadratic rise detected in theearly rising phase of the Kepler light curve cannot be wellmodeled as a single power law. This is alternately explained asthe collision of the SN ejecta with a nondegenerate 1–6Me
Roche-lobe-filling star at 2×1012 cm (Dimitriadis et al. 2018;but see the caveats in Shappee et al. 2018b).
In this paper, we present extensive follow-up observations ofSN 2018oh in the optical, ultraviolet (UV), and near-infrared(NIR) bands and analyze its observational properties andexplosion parameters in contrast to other well-studied SNe Ia.The observations and data reductions are described inSection 2, Section 3 presents the light/color curves, andSection 4 presents the spectral evolution. We discuss theproperties of SN 2018oh and its explosion parameters inSection 5. The conclusions are summarized in Section 6.
2. Observations
2.1. Photometry
After the discovery of SN 2018oh and the recognition that itwould have a Kepler light curve, follow-up photometricobservations started immediately using more than a dozentelescopes, including the (1) 0.8m Tsinghua-NAOC Telescope(TNT) in China (Huang et al. 2012); (2) 2.4m Lijiang Telescope(LJT) of Yunnan Astronomical Observatory (YNAO) in China(Fan et al. 2015); (3) Las Cumbres Observatory (LCO) 1mtelescope network (Brown et al. 2013); (4) Pan-STARRS1 survey(PS1) telescopes (Chambers et al. 2016); (5) Swope 1.0 mtelescope at Las Campanas Observatory; (6) DEMONEXT 0.5mtelescope (Villanueva et al. 2018); (7) 0.61 m at Post Observatory(PONM), Mayhill, NM; (8) 60/90 cm Schmidt telescope onPiszkéstető Mountain Station of Konkoly Observatory in
Hungary; (9) Gemini 0.51m telescope at the Winer Observatory;(10) CTIO 4 m Blanco telescope with DECam (Honscheid et al.
2008; Flaugher et al. 2015); (11) 0.51 m T50 at the AstronomicalObservatory of the University of Valencia in Spain; and (12) 0.6m Super-LOTIS (Livermore Optical Transient Imaging System;Williams et al. 2008) telescope at Kitt Peak Steward Observatory.Broadband BV- and Sloan gri-band photometry were obtainedwith all of these telescopes except the 60/90 cm Schmidt
telescope of Konkoly Observatory and the 0.6 m Super-LOTIStelescope, which both used the BVRI bands. Observations madewith the LCO 1m telescope and Swope also used the U and u
bands, respectively.All CCD images were preprocessed using standard IRAF
82
routines, including bias subtraction, flat fielding, and the
removal of cosmic rays. No template-subtraction technique wasapplied in measuring the magnitudes, as the SN was stillrelatively bright in preparation of this work. We performedpoint-spread function (PSF) photometry for both the SN andthe reference stars using the pipeline Zuruphot developed forautomatic photometry on the TNT, LJT, LCO, DEMONEXT,
PONM, Gemini, and T50 images (J. Mo et al. 2018, inpreparation). This pipeline was modified to analyze the dataobtained with the other telescopes involved in our study. AllSwope imaging was processed using photpipe (Rest et al.2005, 2014).The instrumental magnitudes of the SN were converted into
the standard Johnson UBV (Johnson et al. 1966), Kron-CousinsRI (Cousins 1981), and Sloan gri systems using observations ofa series of Landolt (1992) and SDSS/PS1 (Chambers et al.2016; Flewelling et al. 2016; Magnier et al. 2016; Waters et al.2016; Albareti et al. 2017) standard stars on a few photometricnights. We transformed the PS1 gri-band magnitudes to the
Swope natural system (see, e.g., Contreras et al. 2010;
Figure 1. (a) Pre-explosion image from the SDSS. (b) Image of SN 2018oh in UGC 4780, taken with the TNT. Some of the reference stars listed in Table 1 aremarked. North is up and east is to the left.
82IRAF is distributed by the National Optical Astronomy Observatories,
which are operated by the Association of Universities for Research inAstronomy, Inc., under cooperative agreement with the National ScienceFoundation (NSF).
4
The Astrophysical Journal, 870:12 (33pp), 2019 January 1 Li et al.

Krisciunas et al. 2017) using Supercal transformations asdescribed in Scolnic et al. (2015). The filter transmission curvesof different telescopes, which are not far from the standardones, are displayed in Figure 2. These filter transmissions aremultiplied by the CCD quantum efficiency and atmospherictransmission when information on the latter two is available.The Astrodon filters are used by the PONM and Geminiobservations. Tables 1 and 2 list the standard UBVRI and grimagnitudes of the comparison stars. The photometric results forthe different photometric systems are consistent to within 0.05mag after applying the color-term corrections. As theinstrumental responses from the different photometric systemsdo not show noticeable differences, as shown in Figure 2, wedid not apply additional corrections (i.e., S-corrections) to thephotometry due to the lack of telescope information such asCCD quantum efficiency and the mirror reflectivity for sometelescopes. The final calibrated U(u)BVRIgri magnitudes arepresented in Table 3.
The NIR photometry of SN 2018oh was obtained with twotelescopes, the 3.6 m ESO New Technology Telescope (NTT)with SOFI and the 1.3 m CTIO telescope with ANDICAM. TheJHK-band photometry from the NTT was reduced using theSOFI reduction pipeline and calibrated against the 2MASS starsin the field. The YJH-band images obtained with the CTIO1.3 mtelescope were first subtracted with the sky background and thenreduced with SExtractor (Bertin & Arnouts 1996). Magnitudeswere then calibrated with the 2MASS catalog in the JH bands
and the Pan-STARRS catalog in the Y band. The final NIRmagnitudes are listed in Table 4.SN 2018oh was also observed with the Ultraviolet/Optical
Telescope (UVOT; Roming et al. 2005) onboard theNeil Gehrels Swift Observatory (Swift; Gehrels et al. 2004).The space-based observations were obtained in the uvw1,uvm2, uvw2, U, B, and V filters, starting from 2018 February05.4. The Swift/UVOT data reduction is based on that of theSwift Optical Ultraviolet Supernova Archive (SOUSA; Brownet al. 2014). A 3″ aperture is used to measure the source countswith an aperture correction based on an average PSF.Magnitudes are computed using the zero points of Breeveldet al. (2011) for the UV and Poole et al. (2008) for the opticaland the 2015 redetermination of the temporal sensitivity loss.Table 5 lists the final background-subtracted UVOT UV/optical magnitudes. The instrumental response curves of theUVOT B and V bands are similar to those of the standardJohnson B and V bands. Therefore, our ground-based and Swiftphotometry of these two bands can be compared directly. Notethat some differences exist between the U-band observations ofSwift UVOT and LCO due to different transmission curves (seeFigure 2).
2.2. Spectroscopy
A total of 56 optical spectra were obtained from theXinglong 2.16 m telescope (+BFOSC), the LJT 2.4 m
Figure 2. Transmission curves of different telescopes. Curves are normalized to the peak. Black curves represent the standard filter transmission curves.
5
The Astrophysical Journal, 870:12 (33pp), 2019 January 1 Li et al.
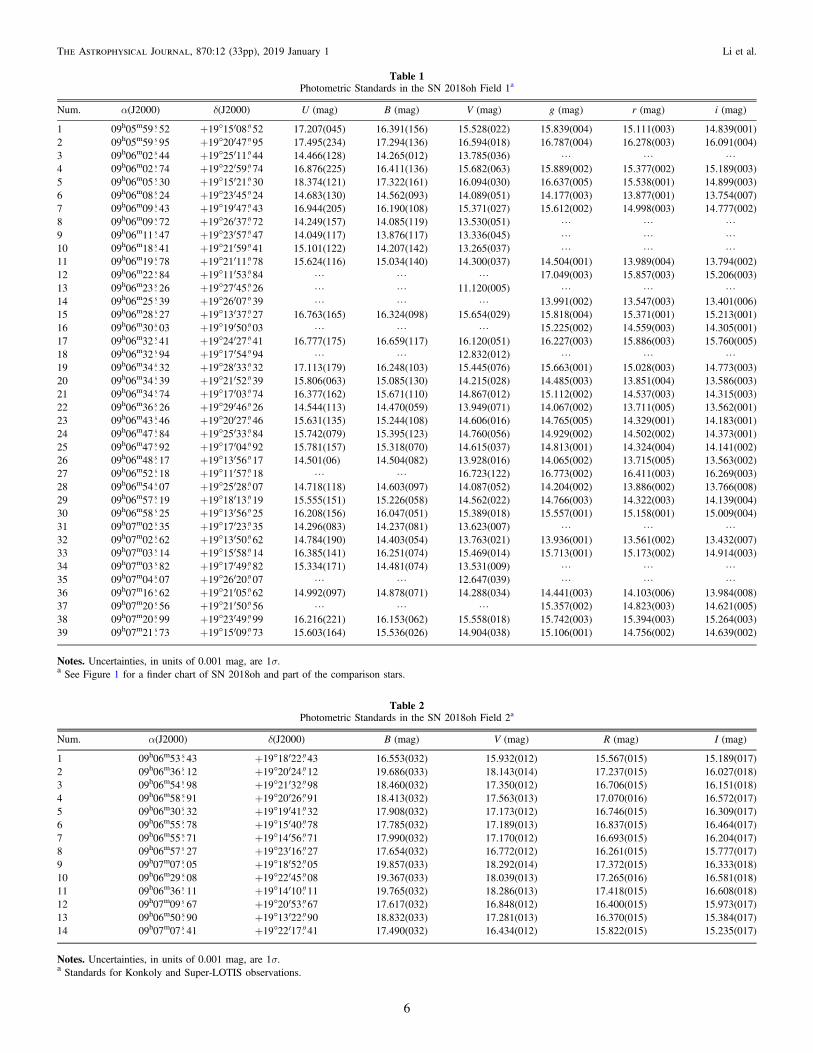
Table 1
Photometric Standards in the SN 2018oh Field 1a
Num. α(J2000) δ(J2000) U (mag) B (mag) V (mag) g (mag) r (mag) i (mag)
1 09h05m59 52 +19°15′08 52 17.207(045) 16.391(156) 15.528(022) 15.839(004) 15.111(003) 14.839(001)
2 09h05m59 95 +19°20′47 95 17.495(234) 17.294(136) 16.594(018) 16.787(004) 16.278(003) 16.091(004)
3 09h06m02 44 +19°25′11 44 14.466(128) 14.265(012) 13.785(036) L L L
4 09h06m02 74 +19°22′59 74 16.876(225) 16.411(136) 15.682(063) 15.889(002) 15.377(002) 15.189(003)
5 09h06m05 30 +19°15′21 30 18.374(121) 17.322(161) 16.094(030) 16.637(005) 15.538(001) 14.899(003)
6 09h06m08 24 +19°23′45 24 14.683(130) 14.562(093) 14.089(051) 14.177(003) 13.877(001) 13.754(007)
7 09h06m09 43 +19°19′47 43 16.944(205) 16.190(108) 15.371(027) 15.612(002) 14.998(003) 14.777(002)
8 09h06m09 72 +19°26′37 72 14.249(157) 14.085(119) 13.530(051) L L L
9 09h06m11 47 +19°23′57 47 14.049(117) 13.876(117) 13.336(045) L L L
10 09h06m18 41 +19°21′59 41 15.101(122) 14.207(142) 13.265(037) L L L
11 09h06m19 78 +19°21′11 78 15.624(116) 15.034(140) 14.300(037) 14.504(001) 13.989(004) 13.794(002)
12 09h06m22 84 +19°11′53 84 L L L 17.049(003) 15.857(003) 15.206(003)
13 09h06m23 26 +19°27′45 26 L L 11.120(005) L L L
14 09h06m25 39 +19°26′07 39 L L L 13.991(002) 13.547(003) 13.401(006)
15 09h06m28 27 +19°13′37 27 16.763(165) 16.324(098) 15.654(029) 15.818(004) 15.371(001) 15.213(001)
16 09h06m30 03 +19°19′50 03 L L L 15.225(002) 14.559(003) 14.305(001)
17 09h06m32 41 +19°24′27 41 16.777(175) 16.659(117) 16.120(051) 16.227(003) 15.886(003) 15.760(005)
18 09h06m32 94 +19°17′54 94 L L 12.832(012) L L L
19 09h06m34 32 +19°28′33 32 17.113(179) 16.248(103) 15.445(076) 15.663(001) 15.028(003) 14.773(003)
20 09h06m34 39 +19°21′52 39 15.806(063) 15.085(130) 14.215(028) 14.485(003) 13.851(004) 13.586(003)
21 09h06m34 74 +19°17′03 74 16.377(162) 15.671(110) 14.867(012) 15.112(002) 14.537(003) 14.315(003)
22 09h06m36 26 +19°29′46 26 14.544(113) 14.470(059) 13.949(071) 14.067(002) 13.711(005) 13.562(001)
23 09h06m43 46 +19°20′27 46 15.631(135) 15.244(108) 14.606(016) 14.765(005) 14.329(001) 14.183(001)
24 09h06m47 84 +19°25′33 84 15.742(079) 15.395(123) 14.760(056) 14.929(002) 14.502(002) 14.373(001)
25 09h06m47 92 +19°17′04 92 15.781(157) 15.318(070) 14.615(037) 14.813(001) 14.324(004) 14.141(002)
26 09h06m48 17 +19°13′56 17 14.501(06) 14.504(082) 13.928(016) 14.065(002) 13.715(005) 13.563(002)
27 09h06m52 18 +19°11′57 18 L L 16.723(122) 16.773(002) 16.411(003) 16.269(003)
28 09h06m54 07 +19°25′28 07 14.718(118) 14.603(097) 14.087(052) 14.204(002) 13.886(002) 13.766(008)
29 09h06m57 19 +19°18′13 19 15.555(151) 15.226(058) 14.562(022) 14.766(003) 14.322(003) 14.139(004)
30 09h06m58 25 +19°13′56 25 16.208(156) 16.047(051) 15.389(018) 15.557(001) 15.158(001) 15.009(004)
31 09h07m02 35 +19°17′23 35 14.296(083) 14.237(081) 13.623(007) L L L
32 09h07m02 62 +19°13′50 62 14.784(190) 14.403(054) 13.763(021) 13.936(001) 13.561(002) 13.432(007)
33 09h07m03 14 +19°15′58 14 16.385(141) 16.251(074) 15.469(014) 15.713(001) 15.173(002) 14.914(003)
34 09h07m03 82 +19°17′49 82 15.334(171) 14.481(074) 13.531(009) L L L
35 09h07m04 07 +19°26′20 07 L L 12.647(039) L L L
36 09h07m16 62 +19°21′05 62 14.992(097) 14.878(071) 14.288(034) 14.441(003) 14.103(006) 13.984(008)
37 09h07m20 56 +19°21′50 56 L L L 15.357(002) 14.823(003) 14.621(005)
38 09h07m20 99 +19°23′49 99 16.216(221) 16.153(062) 15.558(018) 15.742(003) 15.394(003) 15.264(003)
39 09h07m21 73 +19°15′09 73 15.603(164) 15.536(026) 14.904(038) 15.106(001) 14.756(002) 14.639(002)
Notes. Uncertainties, in units of 0.001 mag, are 1σ.aSee Figure 1 for a finder chart of SN 2018oh and part of the comparison stars.
Table 2
Photometric Standards in the SN 2018oh Field 2a
Num. α(J2000) δ(J2000) B (mag) V (mag) R (mag) I (mag)
1 09h06m53 43 +19°18′22 43 16.553(032) 15.932(012) 15.567(015) 15.189(017)
2 09h06m36 12 +19°20′24 12 19.686(033) 18.143(014) 17.237(015) 16.027(018)
3 09h06m54 98 +19°21′32 98 18.460(032) 17.350(012) 16.706(015) 16.151(018)
4 09h06m58 91 +19°20′26 91 18.413(032) 17.563(013) 17.070(016) 16.572(017)
5 09h06m30 32 +19°19′41 32 17.908(032) 17.173(012) 16.746(015) 16.309(017)
6 09h06m55 78 +19°15′40 78 17.785(032) 17.189(013) 16.837(015) 16.464(017)
7 09h06m55 71 +19°14′56 71 17.990(032) 17.170(012) 16.693(015) 16.204(017)
8 09h06m57 27 +19°23′16 27 17.654(032) 16.772(012) 16.261(015) 15.777(017)
9 09h07m07 05 +19°18′52 05 19.857(033) 18.292(014) 17.372(015) 16.333(018)
10 09h06m29 08 +19°22′45 08 19.367(033) 18.039(013) 17.265(016) 16.581(018)
11 09h06m36 11 +19°14′10 11 19.765(032) 18.286(013) 17.418(015) 16.608(018)
12 09h07m09 67 +19°20′53 67 17.617(032) 16.848(012) 16.400(015) 15.973(017)
13 09h06m50 90 +19°13′22 90 18.832(033) 17.281(013) 16.370(015) 15.384(017)
14 09h07m07 41 +19°22′17 41 17.490(032) 16.434(012) 15.822(015) 15.235(017)
Notes. Uncertainties, in units of 0.001 mag, are 1σ.aStandards for Konkoly and Super-LOTIS observations.
6
The Astrophysical Journal, 870:12 (33pp), 2019 January 1 Li et al.

Table 3
Ground-based Optical Photometry of SN 2018oh
Date aEpoch U (mag) B (mag) V (mag) R (mag) I (mag) g (mag) r (mag) i (mag) Telescope
2018 Jan 26.6 −18.1 L L L L L 20.852(223) L 21.025(269) PS1
2018 Jan 27.2 −17.5 L L L L L L L 19.039(009) Decam
2018 Jan 27.3 −17.4 L L L L L L L 18.957(008) Decam
2018 Feb 03.1 −10.6 L L L L L 15.500(010) L L ASAS-SN
2018 Feb 03.3 −10.4 L L L L L L L 15.671(004) PS1
2018 Feb 04.3 −9.4 L L L L L L L 15.446(004) PS1
2018 Feb 04.5 −9.2 L L L L L L L 15.389(003) PS1
2018 Feb 05.1 −8.6 L 14.982(025) 15.085(025) L L L 14.988(017) 15.305(025) DEMONEXT
2018 Feb 05.2 −8.5 L 14.940(026) 15.067(025) L L L 15.005(013) 15.262(024) PONM
2018 Feb 05.2 −8.5 L L 14.915(005) 14.832(006) 14.879(007) L L L slotis
2018 Feb 05.4 −8.3 L L L L L L L 15.264(010) PS1
2018 Feb 05.8 −7.9 L 14.818(031) 14.931(011) L L 14.707(005) 14.872(007) 15.089(009) TNT
2018 Feb 05.9 −7.8 L L L L L L 14.883(006) 15.142(008) LCO
2018 Feb 06.2 −7.5 L 14.789(031) 14.879(013) L L L 14.803(007) 15.101(006) PONM
2018 Feb 06.2 −7.5 15.615(013) 14.762(012) 14.722(010) L L 14.711(010) 14.835(008) 15.149(009) Swope
2018 Feb 06.2 −7.5 L L 14.771(005) 14.709(006) 14.774(006) L L L slotis
2018 Feb 06.5 −7.2 L 14.758(027) 14.857(024) L L L 14.789(016) 15.085(022) DEMONEXT
2018 Feb 06.6 −7.1 14.285(027) 14.723(016) 14.799(014) L L 14.610(003) 14.798(003) 15.089(006) LCO
2018 Feb 06.8 −6.9 14.213(062) 14.691(043) 14.818(015) 14.660(041) 14.662(029) L L L LJT
2018 Feb 06.8 −6.9 L 14.703(072) 14.724(027) 14.609(032) 14.637(035) L L L Konkoly
2018 Feb 07.2 −6.5 L 14.666(022) 14.783(016) L L L 14.688(013) 14.972(019) DEMONEXT
2018 Feb 07.2 −6.5 L 14.681(034) 14.797(014) L L L 14.725(004) 15.010(007) PONM
2018 Feb 07.2 −6.5 15.345(035) 14.600(012) 14.584(011) L L 14.531(010) 14.635(008) 14.985(009) Swope
2018 Feb 07.2 −6.5 L L 14.668(006) 14.569(006) 14.650(006) L L L slotis
2018 Feb 07.5 −6.2 14.173(026) 14.618(015) 14.697(014) L L 14.494(002) 14.702(003) 14.987(006) LCO
2018 Feb 07.7 −6.0 L 14.578(034) 14.701(020) L L 14.499(016) 14.713(018) 15.003(013) TNT
2018 Feb 08.2 −5.5 15.291(032) 14.469(011) 14.471(010) L L 14.408(010) 14.557(008) 14.926(008) Swope
2018 Feb 08.3 −5.4 L L L L L L 14.609(009) L Gemini
2018 Feb 08.4 −5.3 L L L L L 14.483(002) 14.613(002) L PS1
2018 Feb 08.5 −5.2 14.082(027) 14.529(015) 14.608(014) L L 14.409(002) 14.614(003) 14.947(006) LCO
2018 Feb 08.7 −5.0 L 14.514(030) 14.622(010) L L 14.421(003) 14.646(004) 14.963(006) TNT
2018 Feb 09.1 −4.6 L 14.521(025) 14.584(022) L L L 14.550(014) 14.940(026) DEMONEXT
2018 Feb 09.2 −4.5 14.030(027) 14.509(015) 14.549(013) L L 14.382(001) 14.551(002) 14.904(003) LCO
2018 Feb 09.2 −4.5 L 14.487(033) 14.591(012) L L L 14.540(004) 14.887(005) PONM
2018 Feb 09.2 −4.5 L L 14.450(004) 14.397(005) 14.555(006) L L L slotis
2018 Feb 09.3 −4.4 L L L L L 14.342(018) 14.556(019) L Gemini
2018 Feb 09.5 −4.2 L L L L L 14.359(002) L 14.926(003) PS1
2018 Feb 09.7 −4.0 L 14.411(030) 14.505(010) L L 14.327(003) 14.543(004) L TNT
2018 Feb 10.3 −3.4 L L L L L 14.266(008) 14.471(012) L Gemini
2018 Feb 10.5 −3.2 L L L L L 14.307(002) 14.476(002) L PS1
2018 Feb 10.5 −3.2 L 14.426(032) 14.520(032) L L L 14.511(027) L DEMONEXT
2018 Feb 10.7 −3.0 L 14.375(031) 14.483(010) L L 14.287(005) 14.528(008) 14.949(010) TNT
2018 Feb 10.9 −2.8 13.950(026) 14.323(015) 14.443(013) L L L 14.493(010) L LCO
2018 Feb 10.9 −2.8 L L L L L L 14.499(005) 14.936(007) LCO
2018 Feb 11.2 −2.5 L 14.383(022) 14.476(022) L L L 14.449(013) 14.905(024) DEMONEXT
2018 Feb 11.2 −2.5 L 14.352(028) 14.438(010) L L L 14.441(005) 14.884(007) PONM
2018 Feb 11.3 −2.3 L L L L L 14.273(002) L 14.961(003) PS1
2018 Feb 11.3 −2.4 L L L L L 14.235(014) 14.446(013) L Gemini
7
TheAstrophysic
alJournal,870:12(33pp),2019Jan
uary
1Liet
al.

Table 3
(Continued)
Date aEpoch U (mag) B (mag) V (mag) R (mag) I (mag) g (mag) r (mag) i (mag) Telescope
2018 Feb 11.7 −2.0 L 14.331(031) 14.435(010) L L 14.241(004) 14.498(005) 14.957(008) TNT
2018 Feb 11.9 −1.8 L 14.305(050) 14.406(045) 14.236(028) 14.453(030) L L L Konkoly
2018 Feb 12.1 −1.6 13.967(028) 14.389(022) 14.391(014) L L 14.231(001) 14.427(002) 14.920(004) LCO
2018 Feb 12.2 −1.5 15.215(010) 14.337(011) 14.281(010) L L 14.572(018) 14.398(008) 14.968(009) Swope
2018 Feb 12.3 −1.4 L L L L L 14.242(002) 14.402(002) L PS1
2018 Feb 12.3 −1.4 L L L L L 14.203(013) 14.424(024) L Gemini
2018 Feb 12.4 −1.3 L 14.333(022) 14.430(023) L L L 14.388(013) 14.897(020) DEMONEXT
2018 Feb 12.8 −0.9 L 14.300(030) 14.393(012) L L 14.220(003) 14.465(004) 14.982(004) TNT
2018 Feb 13.2 −0.5 13.973(028) 14.353(015) 14.338(014) L L 14.210(002) 14.378(002) L LCO
2018 Feb 13.2 −0.5 L 14.320(025) 14.388(018) L L L 14.383(016) 14.967(019) DEMONEXT
2018 Feb 13.2 −0.4 15.243(025) 14.287(011) 14.255(010) L L L L L Swope
2018 Feb 13.3 −0.4 L L L L L 14.196(012) 14.398(009) L Gemini
2018 Feb 13.5 −0.2 L 14.309(025) 14.385(012) L L L 14.400(008) 14.944(010) PONM
2018 Feb 13.6 −0.1 L L L L L 14.252(002) L 15.002(003) PS1
2018 Feb 13.7 +0.0 L 14.293(030) 14.376(009) L L 14.201(003) 14.450(003) 15.008(005) TNT
2018 Feb 14.3 +0.6 15.296(061) 14.345(011) 14.258(010) L L 14.215(012) 14.390(008) 15.059(010) Swope
2018 Feb 14.5 +0.8 L L L L L 14.225(002) L L PS1
2018 Feb 15.0 +2.3 14.081(027) 14.319(015) 14.383(014) L L 14.184(002) 14.422(003) 15.085(007) LCO
2018 Feb 15.2 +1.5 15.317(010) 14.354(011) 14.275(009) L L 14.256(008) 14.383(008) L Swope
2018 Feb 16.2 +2.5 15.410(023) 14.382(011) 14.290(009) L L 14.259(009) 14.392(008) 15.136(009) Swope
2018 Feb 16.3 +2.6 L 14.367(025) 14.413(010) L L L 14.400(007) 15.066(010) PONM
2018 Feb 16.9 +3.2 14.157(027) 14.364(016) 14.398(013) L L 14.200(002) 14.425(004) 15.106(009) LCO
2018 Feb 16.9 +3.2 L L L L L L 14.457(009) 15.152(009) LCO
2018 Feb 16.9 +3.2 L L 14.400(104) 14.279(030) 14.608(054) L L L Konkoly
2018 Feb 17.2 +3.5 14.230(031) 14.451(016) 14.411(013) L L 14.293(002) 14.437(002) 15.127(006) LCO
2018 Feb 17.2 +3.5 15.455(013) 14.380(011) 14.279(009) L L 14.272(009) 14.367(008) 15.149(010) Swope
2018 Feb 17.7 +4.0 L 14.400(042) 14.439(013) L L 14.293(009) 14.429(013) 15.129(027) LJT
2018 Feb 18.3 +4.6 L 14.448(029) 14.476(013) L L L 14.453(007) 15.146(016) PONM
2018 Feb 18.5 +4.8 L L L L L L 14.450(002) L PS1
2018 Feb 18.8 +5.2 L 14.439(052) 14.424(025) 14.284(029) 14.708(030) L L L Konkoly
2018 Feb 18.9 +5.2 L L L L L L 14.487(004) 15.193(009) LCO
2018 Feb 19.1 +5.4 14.326(027) 14.465(015) 14.455(013) L L 14.280(002) 14.489(003) 15.205(008) LCO
2018 Feb 19.6 +5.9 L 14.514(035) 14.507(011) L L 14.382(005) 14.506(004) 15.243(023) LJT
2018 Feb 20.2 +6.5 L 14.552(029) 14.540(014) L L L 14.549(015) 15.253(022) PONM
2018 Feb 20.2 +6.5 15.720(023) 14.516(011) 14.382(009) L L 14.423(008) 14.495(007) 15.320(008) Swope
2018 Feb 20.3 +6.6 L L L L L 14.418(002) 14.532(002) L PS1
2018 Feb 21.0 +8.3 L L L L L L 14.619(004) L T50
2018 Feb 21.2 +7.5 14.524(029) 14.646(016) 14.550(014) L L 14.450(002) 14.592(002) 15.345(005) LCO
2018 Feb 21.2 +7.5 15.862(126) 14.592(010) 14.432(008) L L 14.487(008) 14.585(007) L Swope
2018 Feb 21.3 +7.6 L L L L L 14.414(012) 14.594(026) L Gemini
2018 Feb 21.5 +7.8 L L L L L 14.472(002) L L PS1
2018 Feb 21.8 +8.1 L 14.637(049) 14.597(015) L L 14.490(009) 14.655(014) 15.420(028) LJT
2018 Feb 22.2 +8.5 14.641(027) 14.721(015) 14.599(014) L L 14.503(002) 14.668(002) 15.393(007) LCO
2018 Feb 22.2 +8.5 15.959(017) 14.627(011) 14.465(009) L L 14.522(008) 14.619(007) 15.453(009) Swope
2018 Feb 22.3 +8.6 L L L L L 14.467(028) L L Gemini
2018 Feb 22.7 +9.0 L 14.724(032) 14.635(016) L L 14.524(006) 14.759(008) 15.483(012) TNT
2018 Feb 23.2 +9.5 L 14.765(032) 14.689(012) L L L 14.727(004) 15.465(009) PONM
2018 Feb 23.2 +9.5 16.051(017) 14.700(011) 14.507(009) L L 14.544(008) 14.678(008) 15.532(009) Swope
8
TheAstrophysic
alJournal,870:12(33pp),2019Jan
uary
1Liet
al.

Table 3
(Continued)
Date aEpoch U (mag) B (mag) V (mag) R (mag) I (mag) g (mag) r (mag) i (mag) Telescope
2018 Feb 23.3 +9.6 L L L L L 14.516(011) 14.727(033) L Gemini
2018 Feb 23.4 +9.7 L 14.803(025) 14.660(026) L L L 14.735(019) 15.535(032) DEMONEXT
2018 Feb 23.7 +10.0 L 14.774(031) 14.648(010) L L 14.556(003) 14.785(005) L TNT
2018 Feb 23.9 +10.2 L L L L L L 14.829(009) L T50
2018 Feb 24.2 +10.5 14.793(027) 14.821(016) 14.726(015) L L 14.588(003) 14.820(007) 15.600(014) LCO
2018 Feb 24.3 +10.6 L 14.854(024) 14.745(019) L L L 14.773(016) 15.583(029) DEMONEXT
2018 Feb 24.6 +10.9 L 14.887(032) 14.758(012) L L 14.646(004) 14.899(006) 15.643(010) TNT
2018 Feb 24.9 +11.2 L L 14.649(126) 14.695(081) 15.102(039) L L L Konkoly
2018 Feb 25.2 +11.5 16.307(027) 14.866(012) 14.618(010) L L 14.652(009) 14.794(008) 15.686(009) Swope
2018 Feb 25.4 +11.7 14.885(032) 14.903(018) 14.769(017) L L 14.683(004) 14.947(008) L LCO
2018 Feb 25.8 +12.1 L L L L L L 14.944(010) 15.684(017) LCO
2018 Feb 25.8 +12.1 L L 14.809(076) 14.767(076) 15.171(035) L L L Konkoly
2018 Feb 26.1 +12.4 L 15.034(024) 14.841(026) L L L 14.956(023) 15.765(028) DEMONEXT
2018 Feb 26.2 +12.5 L 15.028(031) 14.856(013) L L L 14.969(006) 15.757(011) PONM
2018 Feb 26.2 +12.5 16.489(036) 14.973(013) 14.711(011) L L 14.791(010) 14.940(009) 15.847(011) Swope
2018 Feb 26.6 +12.9 L 15.070(032) 14.860(011) L L 14.780(006) 15.055(007) 15.827(012) TNT
2018 Feb 27.2 +13.5 L 15.088(027) 14.872(026) L L L 14.998(018) 15.742(030) DEMONEXT
2018 Feb 27.2 +13.5 16.564(035) 15.061(016) 14.790(013) L L 14.879(012) 15.019(012) 15.913(016) Swope
2018 Feb 27.3 +13.6 L L L L L L 14.992(013) L Gemini
2018 Feb 27.7 +14.0 L 15.159(045) 14.963(022) L L 14.964(014) L 15.932(056) LJT
2018 Mar 01.6 +15.9 L 15.323(038) 15.058(016) L L 15.025(012) 15.235(012) 15.941(020) TNT
2018 Mar 01.7 +16.0 L 15.312(043) 14.977(015) L L 15.062(013) 15.164(010) L LJT
2018 Mar 02.1 +16.4 15.489(054) 15.451(028) 15.035(021) L L 15.067(013) 15.201(015) 15.902(029) LCO
2018 Mar 02.2 +16.5 L 15.425(034) 15.062(034) L L L 15.157(028) 15.859(052) DEMONEXT
2018 Mar 02.3 +16.6 L L L L L 15.033(011) 15.189(017) L Gemini
2018 Mar 02.5 +16.8 L 15.590(089) L L L L L L TNT
2018 Mar 02.5 +16.8 L L L L L L 15.210(012) 15.897(016) LCO
2018 Mar 03.2 +17.5 L 15.499(032) 15.113(031) L L L 15.169(021) 15.874(031) DEMONEXT
2018 Mar 03.2 +17.5 L L L L L 15.126(009) 15.202(018) L Gemini
2018 Mar 03.9 +18.2 L L L L L L 15.213(008) 15.850(013) LCO
2018 Mar 04.2 +18.5 L L L L L 15.195(009) 15.221(012) L Gemini
2018 Mar 04.7 +19.0 L 15.706(036) 15.161(013) L L 15.228(008) 15.220(007) 15.827(013) TNT
2018 Mar 04.8 +19.1 L 15.708(068) 15.127(068) 15.025(025) 15.180(031) L L L Konkoly
2018 Mar 05.2 +19.5 L 15.739(026) 15.137(043) L L L 15.185(023) 15.764(039) DEMONEXT
2018 Mar 05.2 +19.5 L 15.782(033) 15.216(023) L L L 15.244(010) 15.850(020) PONM
2018 Mar 05.2 +19.5 L L L L L 15.265(012) 15.232(020) L Gemini
2018 Mar 05.5 +19.8 L 15.767(032) 15.196(011) L L 15.286(005) 15.219(007) 15.768(011) TNT
2018 Mar 05.9 +20.2 L L L L L L 15.244(007) 15.817(012) LCO
2018 Mar 06.2 +20.5 L L L L L 15.356(020) 15.249(022) L Gemini
2018 Mar 06.2 +20.5 L L 15.156(008) 15.108(009) 15.226(013) L L L slotis
2018 Mar 06.4 +20.7 L 15.859(040) 15.180(039) L L L 15.150(017) 15.726(031) DEMONEXT
2018 Mar 07.2 +21.5 L 15.945(032) 15.233(041) L L L 15.200(015) 15.736(031) DEMONEXT
2018 Mar 07.2 +21.5 L 15.970(029) 15.287(033) L L L 15.255(012) 15.749(017) PONM
2018 Mar 07.2 +21.5 L L L L L 15.437(012) 15.253(019) L Gemini
2018 Mar 07.2 +21.5 L L 15.200(006) 15.122(007) 15.253(008) L L L slotis
2018 Mar 07.8 +22.1 L 15.915(069) 15.236(041) 14.967(075) 15.106(059) L L L Konkoly
2018 Mar 08.1 +22.4 17.766(037) 15.984(014) 15.228(010) L L 15.577(010) 15.184(009) 15.761(010) Swope
2018 Mar 08.5 +22.8 L 16.113(032) 15.350(011) L L 15.566(004) 15.270(005) 15.780(007) TNT
9
TheAstrophysic
alJournal,870:12(33pp),2019Jan
uary
1Liet
al.
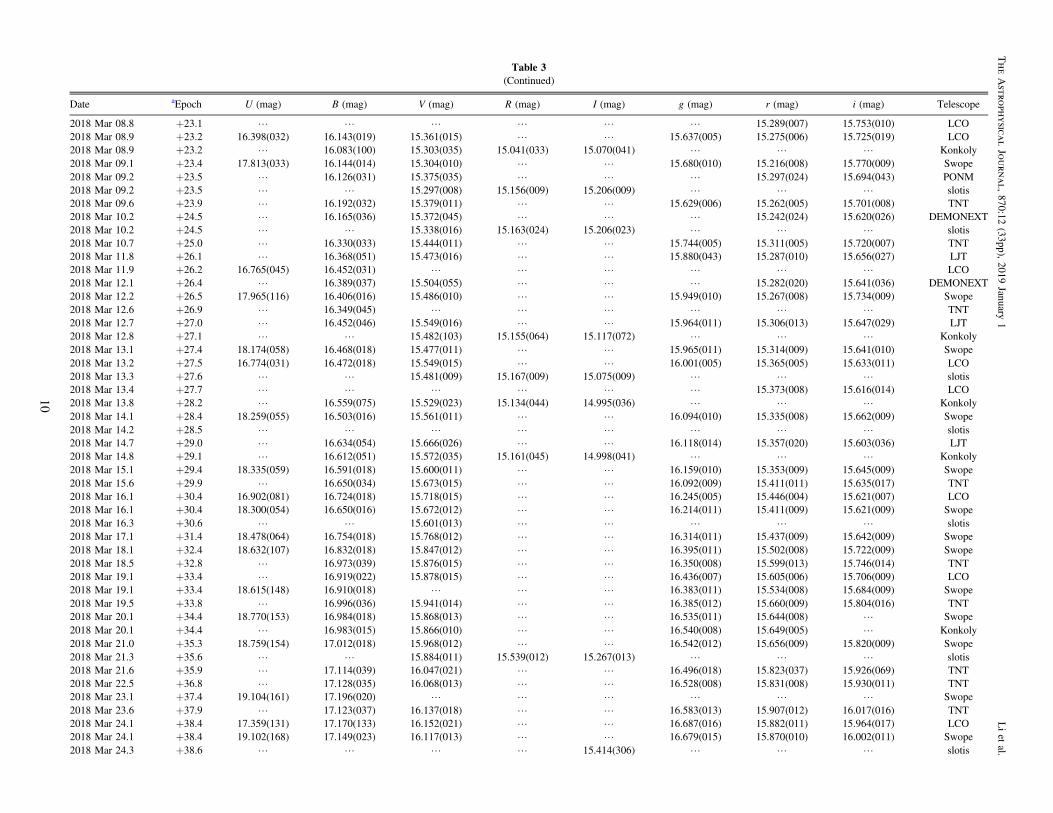
Table 3
(Continued)
Date aEpoch U (mag) B (mag) V (mag) R (mag) I (mag) g (mag) r (mag) i (mag) Telescope
2018 Mar 08.8 +23.1 L L L L L L 15.289(007) 15.753(010) LCO
2018 Mar 08.9 +23.2 16.398(032) 16.143(019) 15.361(015) L L 15.637(005) 15.275(006) 15.725(019) LCO
2018 Mar 08.9 +23.2 L 16.083(100) 15.303(035) 15.041(033) 15.070(041) L L L Konkoly
2018 Mar 09.1 +23.4 17.813(033) 16.144(014) 15.304(010) L L 15.680(010) 15.216(008) 15.770(009) Swope
2018 Mar 09.2 +23.5 L 16.126(031) 15.375(035) L L L 15.297(024) 15.694(043) PONM
2018 Mar 09.2 +23.5 L L 15.297(008) 15.156(009) 15.206(009) L L L slotis
2018 Mar 09.6 +23.9 L 16.192(032) 15.379(011) L L 15.629(006) 15.262(005) 15.701(008) TNT
2018 Mar 10.2 +24.5 L 16.165(036) 15.372(045) L L L 15.242(024) 15.620(026) DEMONEXT
2018 Mar 10.2 +24.5 L L 15.338(016) 15.163(024) 15.206(023) L L L slotis
2018 Mar 10.7 +25.0 L 16.330(033) 15.444(011) L L 15.744(005) 15.311(005) 15.720(007) TNT
2018 Mar 11.8 +26.1 L 16.368(051) 15.473(016) L L 15.880(043) 15.287(010) 15.656(027) LJT
2018 Mar 11.9 +26.2 16.765(045) 16.452(031) L L L L L L LCO
2018 Mar 12.1 +26.4 L 16.389(037) 15.504(055) L L L 15.282(020) 15.641(036) DEMONEXT
2018 Mar 12.2 +26.5 17.965(116) 16.406(016) 15.486(010) L L 15.949(010) 15.267(008) 15.734(009) Swope
2018 Mar 12.6 +26.9 L 16.349(045) L L L L L L TNT
2018 Mar 12.7 +27.0 L 16.452(046) 15.549(016) L L 15.964(011) 15.306(013) 15.647(029) LJT
2018 Mar 12.8 +27.1 L L 15.482(103) 15.155(064) 15.117(072) L L L Konkoly
2018 Mar 13.1 +27.4 18.174(058) 16.468(018) 15.477(011) L L 15.965(011) 15.314(009) 15.641(010) Swope
2018 Mar 13.2 +27.5 16.774(031) 16.472(018) 15.549(015) L L 16.001(005) 15.365(005) 15.633(011) LCO
2018 Mar 13.3 +27.6 L L 15.481(009) 15.167(009) 15.075(009) L L L slotis
2018 Mar 13.4 +27.7 L L L L L L 15.373(008) 15.616(014) LCO
2018 Mar 13.8 +28.2 L 16.559(075) 15.529(023) 15.134(044) 14.995(036) L L L Konkoly
2018 Mar 14.1 +28.4 18.259(055) 16.503(016) 15.561(011) L L 16.094(010) 15.335(008) 15.662(009) Swope
2018 Mar 14.2 +28.5 L L L L L L L L slotis
2018 Mar 14.7 +29.0 L 16.634(054) 15.666(026) L L 16.118(014) 15.357(020) 15.603(036) LJT
2018 Mar 14.8 +29.1 L 16.612(051) 15.572(035) 15.161(045) 14.998(041) L L L Konkoly
2018 Mar 15.1 +29.4 18.335(059) 16.591(018) 15.600(011) L L 16.159(010) 15.353(009) 15.645(009) Swope
2018 Mar 15.6 +29.9 L 16.650(034) 15.673(015) L L 16.092(009) 15.411(011) 15.635(017) TNT
2018 Mar 16.1 +30.4 16.902(081) 16.724(018) 15.718(015) L L 16.245(005) 15.446(004) 15.621(007) LCO
2018 Mar 16.1 +30.4 18.300(054) 16.650(016) 15.672(012) L L 16.214(011) 15.411(009) 15.621(009) Swope
2018 Mar 16.3 +30.6 L L 15.601(013) L L L L L slotis
2018 Mar 17.1 +31.4 18.478(064) 16.754(018) 15.768(012) L L 16.314(011) 15.437(009) 15.642(009) Swope
2018 Mar 18.1 +32.4 18.632(107) 16.832(018) 15.847(012) L L 16.395(011) 15.502(008) 15.722(009) Swope
2018 Mar 18.5 +32.8 L 16.973(039) 15.876(015) L L 16.350(008) 15.599(013) 15.746(014) TNT
2018 Mar 19.1 +33.4 L 16.919(022) 15.878(015) L L 16.436(007) 15.605(006) 15.706(009) LCO
2018 Mar 19.1 +33.4 18.615(148) 16.910(018) L L L 16.383(011) 15.534(008) 15.684(009) Swope
2018 Mar 19.5 +33.8 L 16.996(036) 15.941(014) L L 16.385(012) 15.660(009) 15.804(016) TNT
2018 Mar 20.1 +34.4 18.770(153) 16.984(018) 15.868(013) L L 16.535(011) 15.644(008) L Swope
2018 Mar 20.1 +34.4 L 16.983(015) 15.866(010) L L 16.540(008) 15.649(005) L Konkoly
2018 Mar 21.0 +35.3 18.759(154) 17.012(018) 15.968(012) L L 16.542(012) 15.656(009) 15.820(009) Swope
2018 Mar 21.3 +35.6 L L 15.884(011) 15.539(012) 15.267(013) L L L slotis
2018 Mar 21.6 +35.9 L 17.114(039) 16.047(021) L L 16.496(018) 15.823(037) 15.926(069) TNT
2018 Mar 22.5 +36.8 L 17.128(035) 16.068(013) L L 16.528(008) 15.831(008) 15.930(011) TNT
2018 Mar 23.1 +37.4 19.104(161) 17.196(020) L L L L L L Swope
2018 Mar 23.6 +37.9 L 17.123(037) 16.137(018) L L 16.583(013) 15.907(012) 16.017(016) TNT
2018 Mar 24.1 +38.4 17.359(131) 17.170(133) 16.152(021) L L 16.687(016) 15.882(011) 15.964(017) LCO
2018 Mar 24.1 +38.4 19.102(168) 17.149(023) 16.117(013) L L 16.679(015) 15.870(010) 16.002(011) Swope
2018 Mar 24.3 +38.6 L L L L 15.414(306) L L L slotis
10
TheAstrophysic
alJournal,870:12(33pp),2019Jan
uary
1Liet
al.
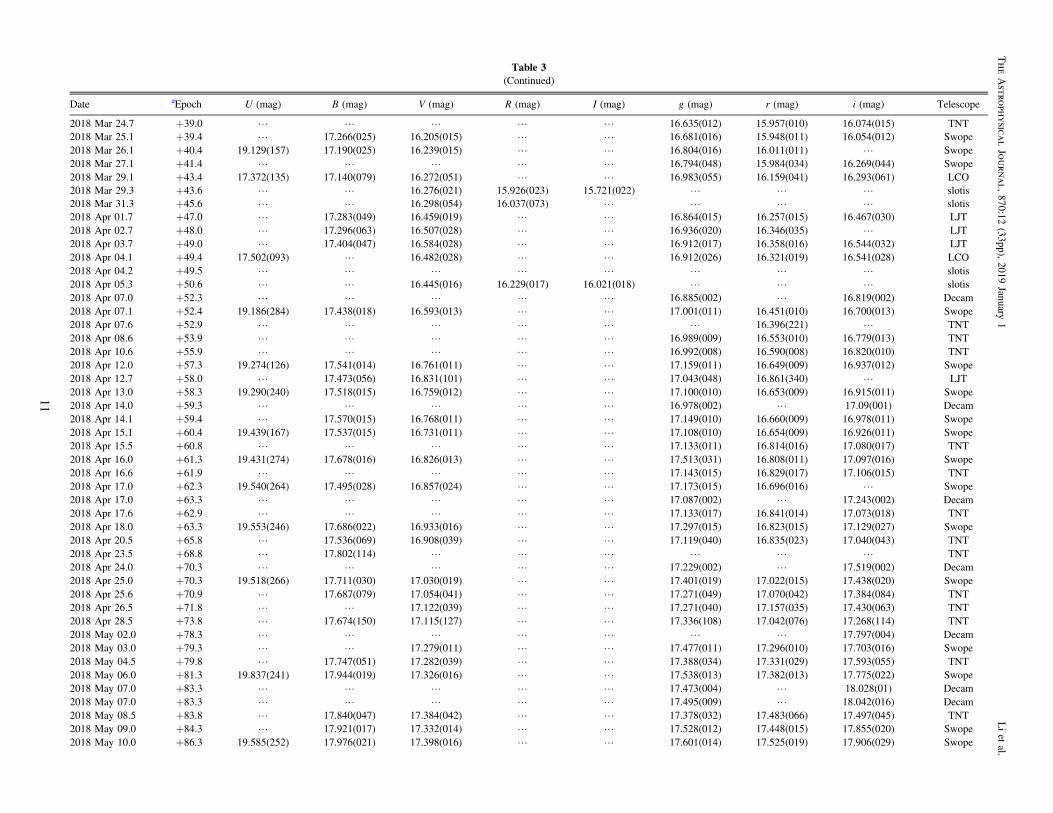
Table 3
(Continued)
Date aEpoch U (mag) B (mag) V (mag) R (mag) I (mag) g (mag) r (mag) i (mag) Telescope
2018 Mar 24.7 +39.0 L L L L L 16.635(012) 15.957(010) 16.074(015) TNT
2018 Mar 25.1 +39.4 L 17.266(025) 16.205(015) L L 16.681(016) 15.948(011) 16.054(012) Swope
2018 Mar 26.1 +40.4 19.129(157) 17.190(025) 16.239(015) L L 16.804(016) 16.011(011) L Swope
2018 Mar 27.1 +41.4 L L L L L 16.794(048) 15.984(034) 16.269(044) Swope
2018 Mar 29.1 +43.4 17.372(135) 17.140(079) 16.272(051) L L 16.983(055) 16.159(041) 16.293(061) LCO
2018 Mar 29.3 +43.6 L L 16.276(021) 15.926(023) 15.721(022) L L L slotis
2018 Mar 31.3 +45.6 L L 16.298(054) 16.037(073) L L L L slotis
2018 Apr 01.7 +47.0 L 17.283(049) 16.459(019) L L 16.864(015) 16.257(015) 16.467(030) LJT
2018 Apr 02.7 +48.0 L 17.296(063) 16.507(028) L L 16.936(020) 16.346(035) L LJT
2018 Apr 03.7 +49.0 L 17.404(047) 16.584(028) L L 16.912(017) 16.358(016) 16.544(032) LJT
2018 Apr 04.1 +49.4 17.502(093) L 16.482(028) L L 16.912(026) 16.321(019) 16.541(028) LCO
2018 Apr 04.2 +49.5 L L L L L L L L slotis
2018 Apr 05.3 +50.6 L L 16.445(016) 16.229(017) 16.021(018) L L L slotis
2018 Apr 07.0 +52.3 L L L L L 16.885(002) L 16.819(002) Decam
2018 Apr 07.1 +52.4 19.186(284) 17.438(018) 16.593(013) L L 17.001(011) 16.451(010) 16.700(013) Swope
2018 Apr 07.6 +52.9 L L L L L L 16.396(221) L TNT
2018 Apr 08.6 +53.9 L L L L L 16.989(009) 16.553(010) 16.779(013) TNT
2018 Apr 10.6 +55.9 L L L L L 16.992(008) 16.590(008) 16.820(010) TNT
2018 Apr 12.0 +57.3 19.274(126) 17.541(014) 16.761(011) L L 17.159(011) 16.649(009) 16.937(012) Swope
2018 Apr 12.7 +58.0 L 17.473(056) 16.831(101) L L 17.043(048) 16.861(340) L LJT
2018 Apr 13.0 +58.3 19.290(240) 17.518(015) 16.759(012) L L 17.100(010) 16.653(009) 16.915(011) Swope
2018 Apr 14.0 +59.3 L L L L L 16.978(002) L 17.09(001) Decam
2018 Apr 14.1 +59.4 L 17.570(015) 16.768(011) L L 17.149(010) 16.660(009) 16.978(011) Swope
2018 Apr 15.1 +60.4 19.439(167) 17.537(015) 16.731(011) L L 17.108(010) 16.654(009) 16.926(011) Swope
2018 Apr 15.5 +60.8 L L L L L 17.133(011) 16.814(016) 17.080(017) TNT
2018 Apr 16.0 +61.3 19.431(274) 17.678(016) 16.826(013) L L 17.513(031) 16.808(011) 17.097(016) Swope
2018 Apr 16.6 +61.9 L L L L L 17.143(015) 16.829(017) 17.106(015) TNT
2018 Apr 17.0 +62.3 19.540(264) 17.495(028) 16.857(024) L L 17.173(015) 16.696(016) L Swope
2018 Apr 17.0 +63.3 L L L L L 17.087(002) L 17.243(002) Decam
2018 Apr 17.6 +62.9 L L L L L 17.133(017) 16.841(014) 17.073(018) TNT
2018 Apr 18.0 +63.3 19.553(246) 17.686(022) 16.933(016) L L 17.297(015) 16.823(015) 17.129(027) Swope
2018 Apr 20.5 +65.8 L 17.536(069) 16.908(039) L L 17.119(040) 16.835(023) 17.040(043) TNT
2018 Apr 23.5 +68.8 L 17.802(114) L L L L L L TNT
2018 Apr 24.0 +70.3 L L L L L 17.229(002) L 17.519(002) Decam
2018 Apr 25.0 +70.3 19.518(266) 17.711(030) 17.030(019) L L 17.401(019) 17.022(015) 17.438(020) Swope
2018 Apr 25.6 +70.9 L 17.687(079) 17.054(041) L L 17.271(049) 17.070(042) 17.384(084) TNT
2018 Apr 26.5 +71.8 L L 17.122(039) L L 17.271(040) 17.157(035) 17.430(063) TNT
2018 Apr 28.5 +73.8 L 17.674(150) 17.115(127) L L 17.336(108) 17.042(076) 17.268(114) TNT
2018 May 02.0 +78.3 L L L L L L L 17.797(004) Decam
2018 May 03.0 +79.3 L L 17.279(011) L L 17.477(011) 17.296(010) 17.703(016) Swope
2018 May 04.5 +79.8 L 17.747(051) 17.282(039) L L 17.388(034) 17.331(029) 17.593(055) TNT
2018 May 06.0 +81.3 19.837(241) 17.944(019) 17.326(016) L L 17.538(013) 17.382(013) 17.775(022) Swope
2018 May 07.0 +83.3 L L L L L 17.473(004) L 18.028(01) Decam
2018 May 07.0 +83.3 L L L L L 17.495(009) L 18.042(016) Decam
2018 May 08.5 +83.8 L 17.840(047) 17.384(042) L L 17.378(032) 17.483(066) 17.497(045) TNT
2018 May 09.0 +84.3 L 17.921(017) 17.332(014) L L 17.528(012) 17.448(015) 17.855(020) Swope
2018 May 10.0 +86.3 19.585(252) 17.976(021) 17.398(016) L L 17.601(014) 17.525(019) 17.906(029) Swope
11
TheAstrophysic
alJournal,870:12(33pp),2019Jan
uary
1Liet
al.
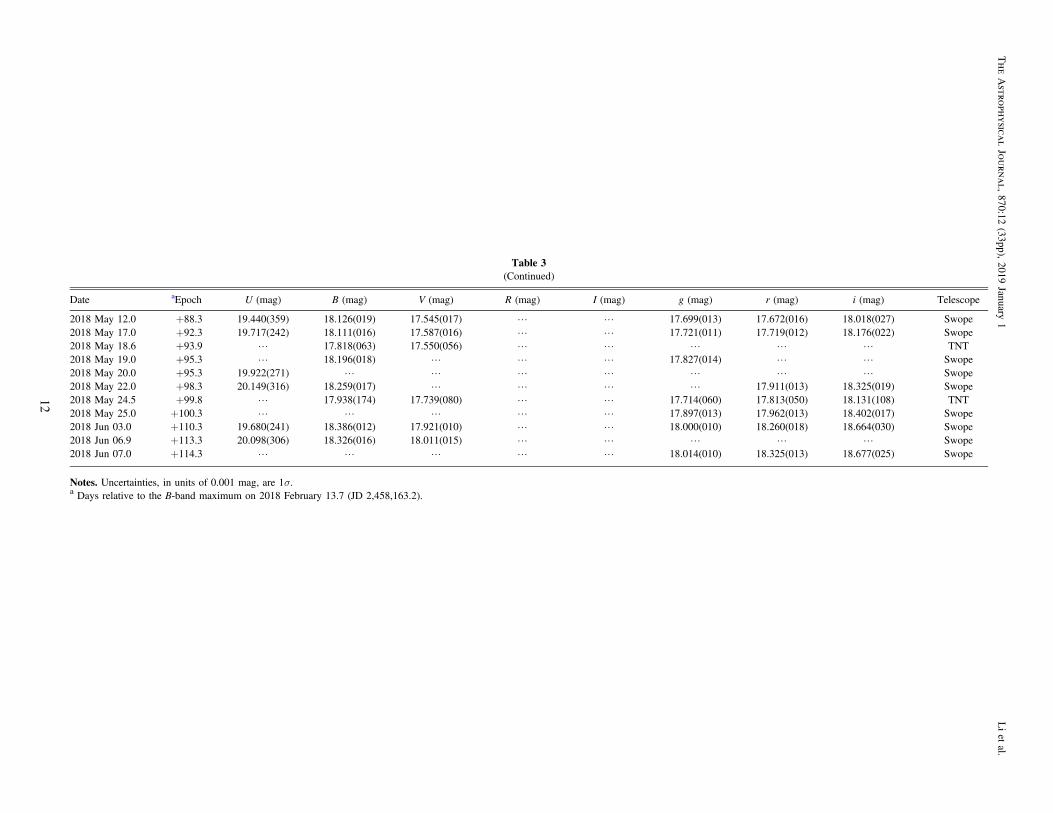
Table 3
(Continued)
Date aEpoch U (mag) B (mag) V (mag) R (mag) I (mag) g (mag) r (mag) i (mag) Telescope
2018 May 12.0 +88.3 19.440(359) 18.126(019) 17.545(017) L L 17.699(013) 17.672(016) 18.018(027) Swope
2018 May 17.0 +92.3 19.717(242) 18.111(016) 17.587(016) L L 17.721(011) 17.719(012) 18.176(022) Swope
2018 May 18.6 +93.9 L 17.818(063) 17.550(056) L L L L L TNT
2018 May 19.0 +95.3 L 18.196(018) L L L 17.827(014) L L Swope
2018 May 20.0 +95.3 19.922(271) L L L L L L L Swope
2018 May 22.0 +98.3 20.149(316) 18.259(017) L L L L 17.911(013) 18.325(019) Swope
2018 May 24.5 +99.8 L 17.938(174) 17.739(080) L L 17.714(060) 17.813(050) 18.131(108) TNT
2018 May 25.0 +100.3 L L L L L 17.897(013) 17.962(013) 18.402(017) Swope
2018 Jun 03.0 +110.3 19.680(241) 18.386(012) 17.921(010) L L 18.000(010) 18.260(018) 18.664(030) Swope
2018 Jun 06.9 +113.3 20.098(306) 18.326(016) 18.011(015) L L L L L Swope
2018 Jun 07.0 +114.3 L L L L L 18.014(010) 18.325(013) 18.677(025) Swope
Notes. Uncertainties, in units of 0.001 mag, are 1σ.aDays relative to the B-band maximum on 2018 February 13.7 (JD 2,458,163.2).
12
TheAstrophysic
alJournal,870:12(33pp),2019Jan
uary
1Liet
al.

telescope (+YFOSC), the Lick 3 m Shane telescope (+KAST;
Miller & Stone 1993), the SOAR 4.1 m telescope (+Goodman
Spectrograph; Clemens et al. 2004), the Bok 2.3 m telescope,
the HET 10 m telescope (+LRS2; Chonis et al. 2016), the
MMT 6.5 m telescope, the Magellan 6.5 m telescope, the LCO
2.0 m telescopes (+FLOYDS), NTT (+EFOSC2; Buzzoni
et al. 1984; Smartt et al. 2015),83 and the APO 3.5 m telescope
(+DIS). These spectra covered the phases from −8.5 to +83.8
days after the maximum light. A log of the spectra is given in
Table 6. All spectra were reduced using standard IRAF
routines. Flux calibration of the spectra was performed using
spectrophotometric standard stars observed at similar airmass
on the same night as the SN. The spectra were corrected for
atmospheric extinction using the extinction curves of local
observatories; in most cases, the telluric lines were removed.
All of the spectra presented in this paper will be made available
via WISeREP (Yaron & Gal-Yam 2012).
2.3. K2 Photometry
We performed an independent photometric analysis on the
Kepler long-cadence imaging data by involving the FITSH
package (Pál 2012) and using our former experience with
photometry of stars appearing in the vicinity of background
galaxies (Molnár et al. 2015). Astrometric jitters were derived
using a dozen nearby K2 stamps (see also Molnár et al. 2015;
Pál et al. 2015), and the derived information is used afterward
to perform frame registration at a subpixel level with an
effective pixel scale of 1 0 pixel–1. Pre-explosion images with
small pointing errors were used to construct a background
reference image prior to applying image subtraction. This
construction is based on median averaging of the first 400
frames that were taken days before the explosion. During the
subsequent differential aperture photometry, this median-
combined image was used as a template frame. In order to
correct for various systematic effects, including instrumental
artifacts and intrinsic background-level variations such as the
rolling-band issue (see, e.g., Shappee et al. 2018b), we
Table 4
NIR Photometry of SN 2018oh
Date aEpoch Y (mag) J (mag) H (mag) K (mag)
2018 Feb 07.2 −6.5 15.571(051) 14.900(061) 15.196(111) L
2018 Feb 09.2 −4.5 15.442(049) 14.767(061) 15.215(121) L
2018 Feb 13.2 −0.5 15.778(047) 14.891(058) 15.208(100) L
2018 Feb 15.2 +1.5 L 15.032(055) 15.361(124) L
2018 Feb 16.2 +2.5 16.136(069) 15.106(067) 15.581(159) L
2018 Feb 17.2 +3.5 L 15.177(051) 15.347(070) 14.986(098)
2018 Feb 18.2 +4.5 16.344(079) 15.385(074) 15.715(156) L
2018 Feb 20.1 +6.4 16.627(108) 15.600(079) 15.488(114) L
2018 Feb 21.1 +7.4 L 15.603(052) 15.424(070) 15.234(098)
2018 Feb 23.2 +9.5 16.570(099) 16.026(100) 15.562(147) L
2018 Feb 25.1 +11.4 16.848(099) 16.607(112) 15.648(113) L
2018 Mar 03.2 +17.5 16.757(110) 16.854(163) 15.597(111) L
2018 Mar 05.1 +19.4 16.428(090) 16.883(194) 15.481(125) L
2018 Mar 08.1 +22.4 16.195(054) 16.462(134) 15.152(108) L
2018 Mar 09.1 +23.4 L 16.340(054) 15.164(071) 15.086(098)
2018 Mar 11.1 +25.4 15.856(041) 16.564(120) 15.175(098) L
2018 Mar 27.1 +41.4 L 16.380(057) 15.651(071) 15.757(100)
2018 Apr 08.0 +53.3 L 17.258(059) 16.234(073) 16.238(102)
Notes. Uncertainties, in units of 0.001 mag, are 1σ.aDays relative to B-band maximum on 2018 February 13.7 (JD 2,458,163.2).
Table 5
Swift Photometry of SN 2018oh
Date aEpoch uvw2 (mag) uvm2 (mag) uvw1 (mag) U (mag) B (mag) V (mag)
2018 Feb 05.4 −8.3 17.117(092) 18.04(146) 15.783(065) 14.228(045) 14.784(045) 14.804(061)
2018 Feb 06.8 −6.9 16.889(087) 17.981(116) 15.499(066) 13.955(044) 14.611(044) 14.688(063)
2018 Feb 07.5 −6.2 16.967(096) 17.98(135) 15.394(069) 13.912(044) 14.501(044) 14.675(067)
2018 Feb 10.4 −3.3 16.647(086) 17.73(116) 15.295(066) 13.714(043) 14.305(043) 14.247(054)
2018 Feb 17.0 +4.3 16.848(102) 17.708(132) 15.678(078) 14.147(047) 14.36(043) 14.251(056)
2018 Feb 19.4 +5.7 17.042(083) 17.805(1) 15.784(066) 14.291(046) 14.4(043) 14.4(057)
2018 Feb 22.7 +9.0 17.448(11) L 16.279(076) 14.735(052) 14.66(044) L
2018 Feb 26.4 +12.7 17.586(098) 18.003(107) 16.498(077) 15.153(058) 14.911(046) 14.719(06)
2018 Mar 11.5 +25.8 18.374(117) 18.645(121) 17.595(099) 16.792(082) 16.332(063) 15.416(064)
2018 Mar 17.1 +31.4 18.351(125) 18.55(133) 17.861(119) 16.887(091) 16.719(07) 15.663(071)
Notes. Uncertainties, in units of 0.001 mag.aDays relative to B-band maximum on 2018 February 13.7 (JD 2,458,163.2).
83NTT spectra were reduced using the PESSTO pipeline (Smartt et al. 2015).
13
The Astrophysical Journal, 870:12 (33pp), 2019 January 1 Li et al.

performed an additional background estimation on the
subtracted images. Finally, the background-subtracted instru-
mental light curve was calibrated to physical units by
comparing with synthetic photometry computed with the
SNCOSMO code (Barbary et al. 2016). This was obtained using
the Kepler bandpass on the extended SALT 2 templates with
the light-curve parameters derived in Section 3.3. The resulting
K2 light curve agreed well within the error bars of those
Table 6
Log of Spectroscopic Observations of SN 2018oh
UT Date MJD Epocha Range (Å) Res. (Å) Inst.
2018 Feb 05.2 58,154.2 −8.5 3640–10298 4.0 HET
2018 Feb 05.2 58,154.2 −8.5 3640–5220 2.0 SOAR
2018 Feb 05.5 58,154.5 −8.2 3300–10000 10.0 LCO
2018 Feb 06.2 58,155.2 −7.5 3380–10320 15.8 NTT
2018 Feb 06.7 58,155.7 −7.0 3498–9173 25.0 LJT
2018 Feb 07.2 58,156.2 −6.5 3190–10914 7.0 Shane
2018 Feb 07.3 58,156.3 −6.4 3640–7977 10.0 Bok
2018 Feb 07.3 58,156.3 −6.4 3685–9315 21.2 NTT
2018 Feb 08.2 58,157.2 −5.5 3640–10298 4.0 HET
2018 Feb 08.3 58,157.3 −5.4 3180–11252 7.0 Shane
2018 Feb 09.4 58,158.4 −4.3 3250–10000 10.0 LCO
2018 Feb 09.5 58,158.5 −4.2 3986–8834 15.0 XLT
2018 Feb 10.1 58,159.1 −3.6 3640–5220 2.8 SOAR
2018 Feb 10.3 58,159.3 −3.4 3799–9627 15.0 APO
2018 Feb 11.7 58,160.7 −2.0 3976–8830 15.0 XLT
2018 Feb 13.6 58,162.6 −0.1 3966–8816 15.0 XLT
2018 Feb 14.2 58,163.2 +0.5 3380–10320 15.8 NTT
2018 Feb 14.2 58,163.2 +0.5 3640–5220 2.8 SOAR
2018 Feb 14.6 58,163.6 +0.9 3249–10000 10.0 LCO
2018 Feb 15.5 58,164.5 +1.8 3976–8831 2.8 XLT
2018 Feb 16.3 58,165.3 +2.6 3380–7520 15.8 NTT
2018 Feb 16.6 58,165.6 +2.9 3975–8831 15.0 XLT
2018 Feb 18.7 58,167.7 +5.0 3958–8812 15.0 XLT
2018 Feb 19.2 58,168.2 +5.5 3380–7520 15.8 NTT
2018 Feb 19.5 58,168.5 +5.8 3959–8816 15.0 XLT
2018 Feb 20.5 58,169.5 +6.8 3400–10000 10.0 LCO
2018 Feb 21.7 58,170.7 +8.0 3981–8835 15.0 XLT
2018 Feb 22.2 58,171.2 +8.5 3380–7520 15.8 NTT
2018 Feb 27.7 58,176.7 +14.0 3501–9166 25.0 LJT
2018 Mar 01.7 58,178.7 +16.0 3501–9155 25.0 LJT
2018 Mar 06.2 58,183.2 +20.5 5601–6905 1.5 MMT
2018 Mar 07.4 58,184.4 +21.7 3250–10000 10.0 LCO
2018 Mar 08.2 58,185.2 +22.5 3380–10320 15.8 NTT
2018 Mar 09.6 58,186.6 +23.9 3961–8815 15.0 XLT
2018 Mar 11.6 58,188.6 +25.9 3899–9299 10.0 LCO
2018 Mar 12.7 58,189.7 +27.0 3497–9166 25.0 LJT
2018 Mar 14.2 58,191.2 +28.5 3752–9208 2.0 Magellan
2018 Mar 15.6 58,192.6 +29.9 3600–9999 10.0 LCO
2018 Mar 19.4 58,196.4 +33.7 3249–9999 10.0 LCO
2018 Mar 19.7 58,196.7 +34.0 3503–9165 25.0 LJT
2018 Mar 22.1 58,199.1 +36.4 3500–9040 6.0 SOAR
2018 Mar 23.5 58,200.5 +37.8 3965–8822 15.0 XLT
2018 Mar 23.7 58,200.7 +38.0 3492–9160 25.0 LJT
2018 Mar 24.1 58,201.1 +38.4 3380–10320 15.8 NTT
2018 Mar 25.0 58,202.0 +39.3 3966–8822 15.0 XLT
2018 Apr 06.1 58,214.1 +51.4 3715–8061 10.0 Bok
2018 Apr 06.1 58,214.1 +51.4 3380–10320 15.8 NTT
2018 Apr 07.5 58,215.5 +52.8 3966–8822 15.0 XLT
2018 Apr 21.0 58,229.0 +66.3 3560–8948 6.0 SOAR
2018 Apr 21.0 58,229.0 +66.3 3380–10320 15.8 NTT
2018 Apr 25.0 58,233.0 +70.3 3180–11252 7.0 Shane
2018 Apr 27.6 58,235.6 +72.9 3966–8822 15.0 XLT
2018 Apr 27.6 58,235.6 +72.9 3492–9160 25.0 LJT
2018 May 02.6 58,240.6 +77.9 3966–8822 15.0 XLT
2018 May 08.0 58,246.0 +83.3 3180–11252 7.0 Shane
2018 May 08.5 58,246.5 +83.8 3966–8822 15.0 XLT
Note.aDays relative to B-band maximum on 2018 February 13.7 (JD 2,458,163.2).
14
The Astrophysical Journal, 870:12 (33pp), 2019 January 1 Li et al.

presented in Dimitriadis et al. (2018) and Shappee et al.(2018b).
3. Light Curves
3.1. UV/Optical Light Curves
Figures 3 and 5 show the optical, UV, and NIR light curvesof SN 2018oh. The optical light curves have a nearly dailycadence from ∼10 days before to about 100 days after themaximum light of the B band. The earliest detections of this SNcan actually be traced back to the PS1 images taken on 2018January 26.56, corresponding to −18.1 days relative to thepeak, when the g- and i-band magnitudes were 20.85±0.22and 21.03±0.27, respectively. We take MJD 58,144.37±0.04 as the explosion time, which is the average of the valuesadopted in Dimitriadis et al. (2018) and Shappee et al. (2018b).Like other normal SNe Ia, the light curves of SN 2018oh show
prominent shoulders in the R/r bands and secondary peaks inthe I/i and NIR YJHK bands, and they reached their peaksslightly earlier in the I/i, YJHK, and UV bands relative to theB band.Using a polynomial fit to the observed light curves, we find
that SN 2018oh reached a peak magnitude of Bmax=14.31±0.03 mag and Vmax=14.37±0.03 mag on MJD 58,162.7±0.3 (2018 February 13.7) and 58,163.7±0.3, respectively.The post-maximum decline rate in the B band, Δm15(B), is0.96±0.03 mag. The results for all of the UBVRIgriYJHK-band light curves are reported in Table 7. Results from standardlight-curve models like MLCS2k2 (Jha et al. 2007), SALT 2(Guy et al. 2010), and SNooPy2 (Burns et al. 2011) will beused to derive the distance to the SN and discussed inSection 3.3.In Figure 4, we compare the light curves of SN 2018oh with
other well-observed SNe Ia that have similar Δm15(B). The
Figure 3. The NIR, optical, and UV light curves of SN 2018oh. The vertical dot-dashed line marks the date for the B-band maximum light, tBmax=MJD58,162.7±0.3 (2018 February 13.7).
15
The Astrophysical Journal, 870:12 (33pp), 2019 January 1 Li et al.

comparison sample includes SN 2002fk (Δm15(B)=1.02±0.04 mag; Cartier et al. 2014), SN 2003du (Δm15(B)= 1.02±0.03 mag; Stanishev et al. 2007), SN 2005cf (Δm15(B)=1.07±0.03 mag; Wang et al. 2009a), SN 2011fe
(Δm15(B)=1.10±0.02 mag; Munari et al. 2013), SN 2012cg
(Δm15(B)=1.04±0.03; Munari et al. 2013), SN 2013dy
(Δm15(B)=0.92±0.03; Pan et al. 2015), and SN 2017cbv
(Δm15(B)=1.06±0.03; Hosseinzadeh et al. 2017). The morph-
ology of the light curves of SN 2018oh closely resembles to that of
SN 2003du and SN 2013dy, with Δm15(B) lying between these
two comparison SNe Ia.
Figure 6 shows that the optical color evolution of SN 2018oh
is similar to that of the comparison sample. At t−10 days,
both the U−B and B−V colors become progressively redder
until t∼4–5 weeks after the maximum light. The V−I colorinitially becomes bluer until t∼+10 days; it then turns redder,
reaching the reddest color at t∼+35 days. After t∼+35
days, both the B−V and V−I curve colors become bluer. In
the very early phases (at t−14 days), however, the color
evolution of the SN is scattered. For instance, SN 2011fe
evolved from very red colors toward blue ones, while SN
2017cbv (and perhaps SN 2012cg) shows the opposite trend.
Figure 4. Comparison of the optical light curves of SN 2018oh to other well-observed SNe Ia with similar decline rates. The light curves of the comparison SNe Ia arenormalized to match the peak magnitudes of SN 2018oh.
16
The Astrophysical Journal, 870:12 (33pp), 2019 January 1 Li et al.

Bluer colors seen in the early phase of some SNe Ia have beeninterpreted as a result of interactions between the ejecta and acompanion star, supporting the SD progenitor scenario (Brownet al. 2012; Marion et al. 2016; Hosseinzadeh et al. 2017). It isnot clear whether SN 2018oh had such blue colors due to thelack of color information at very early times. It shows relativelybluer B−V colors than the comparison SNe Ia, but it is redderin the U−B and V−I colors. The slightly redder U−Bcolor seen in SN 2018oh could be related to stronger CaIIH&K and iron-group element (IGE) absorption at shorterwavelengths. We do not show the gri-band color evolution dueto the lack of data in these bands for most of our comparisonsample, but SN2018oh shows a similar evolutionary trend toSN2017cbv in its g−r and r−i colors at comparable
Figure 5. Comparison of the UV light curves of SN 2018oh with other well-observed SNe Ia with similar decline rates. The magnitudes and phases of all SNe Ia arenormalized to the corresponding values at maximum light.
Figure 6. The U−B, B−V, and V−I color curves of SN 2018oh compared with those of SNe 2002fk, 2003du, 2005cf, 2011fe, 2012cg, 2013dy, and 2017cbv. Allof the comparison SNe have been dereddened. The dash-dotted line in the B−V panel shows the unreddened Lira–Phillips loci and updated version from Burns et al.(2014). The data sources are cited in the text.
Table 7
Photometry Parameters of SN 2018oh
Band λeff (Å) tmax (MJD) mpeak (mag) Δm15 (mag)
uvw2 2030 58,161.2±0.2 16.67±0.07 1.08±0.49
uvm2 2228 58,164.1±0.8 17.71±0.05 0.49±0.46
uvw1 2589 58,160.5±0.1 15.31±0.07 1.32±0.45U 3663 58,161.1±0.1 13.98±0.01 1.19±0.12
B 4360 58,162.9±0.1 14.32±0.01 0.96±0.02
V 5446 58,164.1±0.1 14.37±0.01 0.63±0.06R 6414 58,163.7±0.2 14.21±0.01 0.69±0.09
I 7979 58,161.7±0.2 14.47±0.02 0.64±0.15
g 4640 58,163.6±0.2 14.22±0.01 0.82±0.07
r 6122 58,163.3±0.1 14.38±0.01 0.70±0.08
i 7440 58,160.4±0.1 14.91±0.01 0.85±0.07
17
The Astrophysical Journal, 870:12 (33pp), 2019 January 1 Li et al.

phases. Dimitriadis et al. (2018) showed the very early g−icolor and concluded that before t∼−10 days, SN2018ohlooks bluer than SN2011fe and is similar to SN 2017cbv.
Milne et al. (2013) found that the near-UV (NUV) colors ofSNe Ia can be divided into NUV-blue and NUV-red groups.
We compare SN2018oh with these two groups in Figure 7. Asshown in Figure 7, SN2018oh belongs to the NUV-blue
group, consistent with the finding of Milne et al. (2013) that thedetection of CII (see Section 4.3) is common among the NUV-blue SNe Ia and rare among NUV-red SNe Ia. SN 2018oh has a
normal velocity and low velocity gradient of SiII λ6355absorption features, which also follows the same trend as the
NUV-blue group (Milne et al. 2013). These groupings (or thepositions of SNe along a continuum of NUV colors) areaffected by reddening but still present for SNe Ia with low
reddening (Brown et al. 2017).We also compare the color evolution of SN 2018oh with SN
2005cf (Wang et al. 2009a), SN 2017cbv (Wang et al., in
preparation), and SN 2011fe (Matheson et al. 2012) in the NIRbands, as shown in Figure 8. SN 2017cbv is bluer in both NIR
colors before maximum, and SN 2018oh is bluer aroundmaximum in V−H. The last two V−J points of SN 2018ohare significantly redder than the others.
3.2. Reddening Correction
The Galactic extinction toward SN 2018oh is estimated asAV (Gal)=0.124 mag (Schlafly & Finkbeiner 2011), corresp-onding to - =( )E B V 0.040G mag for a Cardelli et al. (1989)extinction law with RV=3.1. As SN 2018oh appears close tothe projected center of its host galaxy, it is necessary toexamine the reddening due to the host galaxy. After correctionsfor the Galactic extinction, the B−V colors at peak andt=+35 days are found to be −0.10±0.03 and 1.02 ±0.04 mag, respectively, which are consistent with typical valuesof unreddened SNe Ia with comparable Δm15(B) (Phillips et al.1999; Jha et al. 2007; Wang et al. 2009a; Burns et al. 2014).Similarly, if we fit the B−V evolution over the phases fromt=30 to 90 days past the peak (Lira–Phillips relation; Phillipset al. 1999) using Burns et al. (2014), we derive a reddening of−0.06±0.04 and 0.06±0.04 mag, respectively. Finally, wedid not find any evidence for Na I D (λ5890) absorption due tothe host galaxy. We thus conclude that there is no significanthost galaxy extinction, even though the SN is located near theprojected center of its host galaxy.
3.3. Light-curve Fitting
We adopt SALT 2.4 (Betoule et al. 2014) as our primarylight-curve fitter because it has the most flexibility in fittingmultiband light curves taken in different photometric systems,and the most recent calibrations include the dependence on thehost galaxy stellar mass. We also use SNooPy2 (Burns et al.2011) and MLCS2k2 (Jha et al. 2007) to verify the distances(see also Vinko et al. 2018).The final, best-fit results are shown in Figures 9 and 10.
Table 8 summarizes the light-curve parameters and the inferreddistance moduli. The distance moduli from the SALT 2.4 best-fit parameters are derived using the calibration by Betoule et al.(2014). The stellar mass of the host of SN2018oh (UGC04780) is ~( )M Mlog 6.910 stellar (see Section 5.1) and istaken into account as a “mass-step” correction of ∼0.06 mag inthe Betoule et al. (2014) calibration. The distance moduli listedin the last row of Table 8 are brought to a common Hubbleconstant of H0=73 km s−1Mpc−1
(Riess et al. 2016, 2018).It is readily seen that the distances from the three independent
light-curve fitting codes are in excellent agreement. We adopt theSALT 2.4 distance modulus of μ0=33.61±0.05 mag,corresponding to 52.7±1.2 Mpc, as the final result in ourfollowing analysis.
4. Optical Spectra
Figure 11 displays the spectral evolution of SN 2018oh. Theearlier spectra are dominated by absorption features of Si, Ca, S,and Fe. Near maximum light, the spectral evolution follows thatof a normal SNIa, with the distinctive “W”-shaped SII linesnear 5400Å, the blended lines of FeII and SiII near 4500Å,and the prominent CaII absorption feature near 8300Å. A weakabsorption feature that can be attributed to CII λ6580 is seen onthe red edge of the SiII λ6355 absorption feature for a long time(see discussion in Section 4.3). We discuss the spectral evolutionof SN 2018oh in detail in the following subsections.
4.1. Temporal Evolution of the Spectra
In Figure 12, we compare the spectra of SN 2018oh with thoseof SNe Ia having similar decline rates at several epochs. The
Figure 7. The uvm2–uvw1 and uvw1–v colors of SN2018oh compared to agroup of NUV-blue and NUV-red SNe (see, e.g., Milne et al. 2013).
Table 8
Best-fit Parameters from the Applied Light-curve Fitters
Parameter SALT 2.4 SNooPy2 MLCS2k2
Tmax(B) (MJD) 58,163.34 (0.02) 58,162.67 (0.05) 58,162.70 (0.02)
x0 0.038 (0.001) L L
x1 0.879 (0.012) L L
C −0.09 (0.010) L L
-( )E B V host L 0.00 (0.01) 0.00 (0.01)
Δm15 L 0.865 (0.060) L
ΔMLCS L L −0.100 (0.08)
μ0 (mag) 33.614 (0.05) 33.62 (0.22) 33.57 (0.06)
18
The Astrophysical Journal, 870:12 (33pp), 2019 January 1 Li et al.
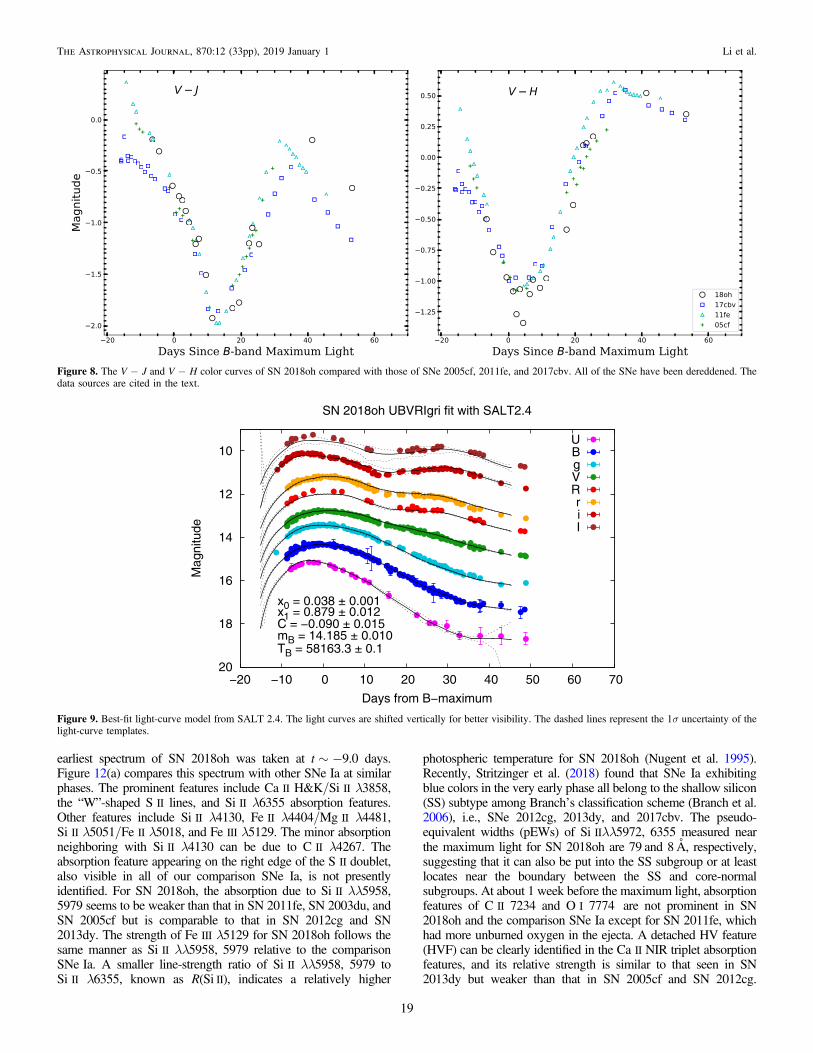
earliest spectrum of SN 2018oh was taken at t∼−9.0 days.Figure 12(a) compares this spectrum with other SNe Ia at similarphases. The prominent features include CaII H&K/SiII λ3858,the “W”-shaped SII lines, and SiII λ6355 absorption features.Other features include SiII λ4130, FeII λ4404/MgII λ4481,SiII λ5051/FeII λ5018, and FeIII λ5129. The minor absorptionneighboring with SiII λ4130 can be due to CII λ4267. Theabsorption feature appearing on the right edge of the SII doublet,also visible in all of our comparison SNe Ia, is not presentlyidentified. For SN 2018oh, the absorption due to SiII λλ5958,5979 seems to be weaker than that in SN 2011fe, SN 2003du, andSN 2005cf but is comparable to that in SN 2012cg and SN2013dy. The strength of FeIII λ5129 for SN 2018oh follows thesame manner as SiII λλ5958, 5979 relative to the comparisonSNeIa. A smaller line-strength ratio of SiII λλ5958, 5979 toSiII λ6355, known as R(Si II), indicates a relatively higher
photospheric temperature for SN 2018oh (Nugent et al. 1995).Recently, Stritzinger et al. (2018) found that SNe Ia exhibitingblue colors in the very early phase all belong to the shallow silicon(SS) subtype among Branch’s classification scheme (Branch et al.2006), i.e., SNe 2012cg, 2013dy, and 2017cbv. The pseudo-equivalent widths (pEWs) of SiIIλλ5972, 6355 measured nearthe maximum light for SN 2018oh are 79 and 8Å, respectively,suggesting that it can also be put into the SS subgroup or at leastlocates near the boundary between the SS and core-normalsubgroups. At about 1 week before the maximum light, absorptionfeatures of CII 7234 and OI 7774 are not prominent in SN2018oh and the comparison SNe Ia except for SN 2011fe, whichhad more unburned oxygen in the ejecta. A detached HV feature(HVF) can be clearly identified in the CaII NIR triplet absorptionfeatures, and its relative strength is similar to that seen in SN2013dy but weaker than that in SN 2005cf and SN 2012cg.
Figure 9. Best-fit light-curve model from SALT 2.4. The light curves are shifted vertically for better visibility. The dashed lines represent the 1σ uncertainty of thelight-curve templates.
Figure 8. The V−J and V−H color curves of SN 2018oh compared with those of SNe 2005cf, 2011fe, and 2017cbv. All of the SNe have been dereddened. Thedata sources are cited in the text.
19
The Astrophysical Journal, 870:12 (33pp), 2019 January 1 Li et al.
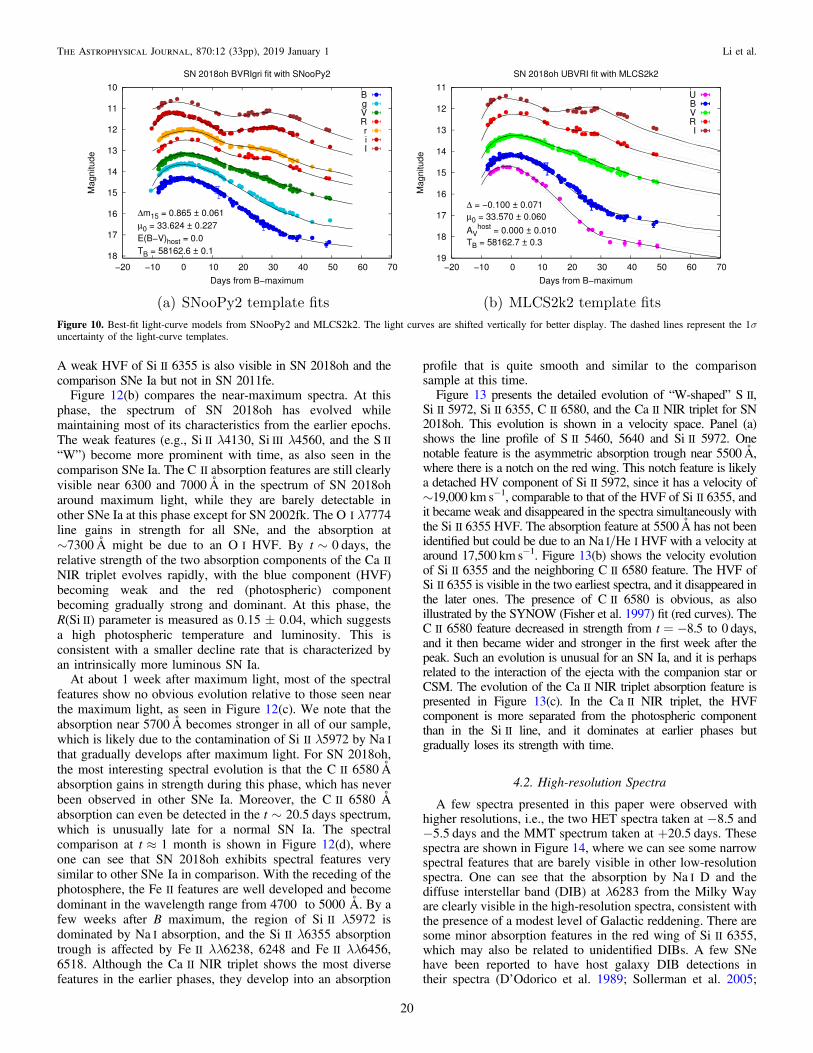
A weak HVF of SiII 6355 is also visible in SN 2018oh and thecomparison SNe Ia but not in SN 2011fe.
Figure 12(b) compares the near-maximum spectra. At thisphase, the spectrum of SN 2018oh has evolved whilemaintaining most of its characteristics from the earlier epochs.The weak features (e.g., Si II λ4130, Si III λ4560, and the S II
“W”) become more prominent with time, as also seen in thecomparison SNe Ia. The CII absorption features are still clearlyvisible near 6300 and 7000Å in the spectrum of SN 2018oharound maximum light, while they are barely detectable inother SNe Ia at this phase except for SN 2002fk. The OI λ7774line gains in strength for all SNe, and the absorption at
∼7300Å might be due to an OI HVF. By t∼0 days, therelative strength of the two absorption components of the CaIINIR triplet evolves rapidly, with the blue component (HVF)becoming weak and the red (photospheric) componentbecoming gradually strong and dominant. At this phase, theR(Si II) parameter is measured as 0.15±0.04, which suggestsa high photospheric temperature and luminosity. This isconsistent with a smaller decline rate that is characterized byan intrinsically more luminous SN Ia.
At about 1 week after maximum light, most of the spectralfeatures show no obvious evolution relative to those seen nearthe maximum light, as seen in Figure 12(c). We note that the
absorption near 5700Å becomes stronger in all of our sample,which is likely due to the contamination of SiII λ5972 by Na Ithat gradually develops after maximum light. For SN 2018oh,
the most interesting spectral evolution is that the CII 6580Åabsorption gains in strength during this phase, which has never
been observed in other SNe Ia. Moreover, the CII 6580 Åabsorption can even be detected in the t∼20.5 days spectrum,which is unusually late for a normal SN Ia. The spectralcomparison at t≈1 month is shown in Figure 12(d), whereone can see that SN 2018oh exhibits spectral features verysimilar to other SNeIa in comparison. With the receding of thephotosphere, the FeII features are well developed and become
dominant in the wavelength range from 4700 to 5000Å. By afew weeks after B maximum, the region of SiII λ5972 isdominated by Na I absorption, and the SiII λ6355 absorptiontrough is affected by FeII λλ6238, 6248 and FeII λλ6456,6518. Although the CaII NIR triplet shows the most diversefeatures in the earlier phases, they develop into an absorption
profile that is quite smooth and similar to the comparisonsample at this time.Figure 13 presents the detailed evolution of “W-shaped” SII,
SiII 5972, SiII 6355, CII 6580, and the CaII NIR triplet for SN2018oh. This evolution is shown in a velocity space. Panel (a)shows the line profile of SII 5460, 5640 and SiII 5972. Onenotable feature is the asymmetric absorption trough near 5500Å,where there is a notch on the red wing. This notch feature is likelya detached HV component of SiII 5972, since it has a velocity of∼19,000 km s−1, comparable to that of the HVF of SiII 6355, andit became weak and disappeared in the spectra simultaneously withthe SiII 6355 HVF. The absorption feature at 5500Å has not beenidentified but could be due to an Na I/HeI HVF with a velocity ataround 17,500 km s−1. Figure 13(b) shows the velocity evolutionof SiII 6355 and the neighboring CII 6580 feature. The HVF ofSiII 6355 is visible in the two earliest spectra, and it disappeared inthe later ones. The presence of CII 6580 is obvious, as alsoillustrated by the SYNOW (Fisher et al. 1997) fit (red curves). TheCII 6580 feature decreased in strength from t=−8.5 to 0 days,and it then became wider and stronger in the first week after thepeak. Such an evolution is unusual for an SN Ia, and it is perhapsrelated to the interaction of the ejecta with the companion star orCSM. The evolution of the CaII NIR triplet absorption feature ispresented in Figure 13(c). In the CaII NIR triplet, the HVFcomponent is more separated from the photospheric componentthan in the SiII line, and it dominates at earlier phases butgradually loses its strength with time.
4.2. High-resolution Spectra
A few spectra presented in this paper were observed withhigher resolutions, i.e., the two HET spectra taken at −8.5 and−5.5 days and the MMT spectrum taken at +20.5 days. Thesespectra are shown in Figure 14, where we can see some narrowspectral features that are barely visible in other low-resolutionspectra. One can see that the absorption by Na I D and thediffuse interstellar band (DIB) at λ6283 from the Milky Wayare clearly visible in the high-resolution spectra, consistent withthe presence of a modest level of Galactic reddening. There aresome minor absorption features in the red wing of SiII 6355,which may also be related to unidentified DIBs. A few SNehave been reported to have host galaxy DIB detections intheir spectra (D’Odorico et al. 1989; Sollerman et al. 2005;
Figure 10. Best-fit light-curve models from SNooPy2 and MLCS2k2. The light curves are shifted vertically for better display. The dashed lines represent the 1σuncertainty of the light-curve templates.
20
The Astrophysical Journal, 870:12 (33pp), 2019 January 1 Li et al.

Cox & Patat 2008; Phillips et al. 2013; Welty et al. 2014). Theabsence of NaI D and DIB absorption components from UGC4780 is consistent with SN 2018oh suffering negligiblereddening within the host galaxy. A weak, narrow Hα emissionthat is likely from the host galaxy feature can be clearly seen inboth the HET and MMT spectra.
4.3. Carbon Features
There are CII features clearly detected in SN 2018oh, and theyseem to persist for an unusually long time compared to other
known SNe Ia. As shown in Figure 15, the CII 6580 absorption
feature can be detected in the spectra from t=−8.5 to+20.5 days.The CII 4267 and CII 7234 absorptions are also detectable in the
spectra84 from t=−8.5 to +8.0 days. Identifying these carbon
features is justified by the agreement in velocity at early phases (see
Figure 11. Spectral evolution of SN 2018oh (some spectra are not displayed due to limited space). The spectra have been corrected for the redshift of the host galaxy(vhel=3270 km s−1
) and reddening, and the slopes of the continuum are calibrated by the photometry. For better display, the spectra have been shifted vertically byarbitrary amounts. The epochs on the right side of the spectra represent the phases in days from B-band maximum light. The colors of the spectra indicate theinstrument used for the observations, as shown at the bottom of the figure.
84Note that there is an instrumental trough around λ4150 in the HET spectra
that nearly coincides with the expected position of the C II λ4267 feature, andthis makes it difficult to judge whether the presence of this feature is real or not.Nevertheless, a weak C II λ4267 feature can be still identified in the −7.5dspectrum taken by NTT, as shown in the top left panel of Figure 15.
21
The Astrophysical Journal, 870:12 (33pp), 2019 January 1 Li et al.

Figure 15) and the SYNOW spectral models. It should be notedthat the SYNOW velocities shown in Figure 13 are higher than themeasured values by∼2000 km s−1 (see Table 9). This offset is dueto low optical depths at the line centers in the SYNOW fitsproducing a steep drop in optical depths blueward of the best-fitvelocity, resulting in minimal absorption bluer than the line center,which shifts the apparent minimum in the line profile.
Silverman & Filippenko (2012) measured the velocity ratiobetween C II λ6580 and SiII λ6355 and found a median valueof 1.05 at phases earlier than 4 days from maximum. For SN2018oh, this ratio is 1.05−1.00 at t−4 days, consistent withSilverman & Filippenko (2012). However, the C/Si velocityratio keeps decreasing after t−4 days and reaches about0.85±0.06 at t∼+20.5 days for SN 2018oh, which suggeststhat unburned carbon may be more strongly mixed than siliconand extends deep into the ejecta.
Folatelli et al. (2012) calculated the pEW evolution of C II
6580 using SYNOW synthetic spectra with different unburnedcarbon mass. The pEW is found to grow monotonically withthe mass of carbon. For SN 2018oh, the CII 6580 absorptionhas a pEW ∼4 and 2Å around −4.3 and −2.0 days,respectively, which is very similar to that of the syntheticspectra with ≈0.03Me of unburned carbon in the ejecta.
4.4. Ejecta Velocity
We measured the ejecta velocities from the blueshiftedabsorption features of SiII λ6355, SII λ5468, CII λ6580, CIIλ7234, OI λ7774, and the CaII NIR triplet lines, and thevelocity evolution is shown in Figure 16. All velocities havebeen corrected for the host galaxy redshift. The photosphericvelocity of SiII 6355, characterized by a linear decline from∼11,000 to ∼8000 km s−1, is comparable to that of otherintermediate-mass elements at similar phases. Assuming ahomologous expansion of the ejecta, this indicates a complexdistribution of carbon in the ejecta. However, it is possible thatthe position of CII 6580 absorption in late-time spectra mightbe contaminated by other unknown elements. The best-fit CIIvelocities from SYNOW show an offset by ∼2000 km s−1
relative to the measured values, and this suggests that carbon isdetached until ∼+5 days from the maximum light. After that,the SYNOW velocity of CII becomes comparable to thephotospheric values, matching that of SiII 6355.The HVFs of SiII λ6355, O I λ7774, and the CaII IR triplet
have been systematically examined in the spectra of SNe Ia(Childress et al. 2014; Maguire et al. 2014; Silverman et al.2015; Zhao et al. 2015, 2016). The HVFs of both SiII λ6355
Figure 12. Spectra of SN 2018oh at t∼−9, −4, 0, and +8 days and +1 month after B maximum, along with the comparable-phase spectra of SNe 2002fk (Blondinet al. 2012), 2003du (Stanishev et al. 2007), 2005cf (Garavini et al. 2007; Wang et al. 2009a), 2011fe (Mazzali et al. 2014; Zhang et al. 2016), 2012cg (Marion et al.2016), and 2013dy (Zheng et al. 2013; Pan et al. 2015; Zhai et al. 2016). All spectra have been corrected for reddening and the redshift of the host galaxy. For clarity,the spectra were arbitrarily shifted in the vertical direction. The SYNOW fitting result of the t∼−9 days spectrum of SN 2018oh is also overplotted in panel (a).
22
The Astrophysical Journal, 870:12 (33pp), 2019 January 1 Li et al.

and the CaII IR triplet can be clearly identified in the earlyspectra of SN 2018oh. Since the region overlapping with theoxygen absorption has lower spectral quality for our early data,the O HVF cannot be clearly identified. The velocitiesmeasured for the HVFs identified for SiII λ6355 and the CaIINIR triplet can reach about 19,000–22,000 km s−1, far abovethe photosphere. According to recent studies by Zhao et al.(2015, 2016), the HVFs cannot be explained by ionization and/or thermal processes alone, and different mechanisms are
required for the creation of HVF-forming regions. Mulligan &Wheeler (2017, 2018) showed that a compact circumstellarshell having 0.01Me is capable of producing the observedHVF component of the CaII NIR triplet.In Figure 17, we compare the SiII velocity evolution of SN
2018oh with some well-observed SNe Ia. The vsi evolution ofSN 2018oh is comparable to that of SN 2005cf and SN 2011fe,as shown in Figure 17. At around the B-band maximum light,SN 2018oh has an expansion velocity of 10,300 km s−1, which
Figure 13. The “W-shaped” SII, SiII λ5972, SiII λ6355, C II λ6580, and CaII IR triplet evolution of SN 2018oh. The velocity is defined relative to the restwavelength of (a) HeI λ5876 (upper axis: SiII λ5972), (b) C II λ6580, and (c) CaII λ8542. The black solid lines label spectral features, while the gray dashed linesindicate the velocity evolution trend for the corresponding lines. Overplotted red curves in panel (b) represent the best-fitting results from SYNOW.
23
The Astrophysical Journal, 870:12 (33pp), 2019 January 1 Li et al.

can be clearly put into the normal velocity (NV) groupaccording to the classification scheme proposed by Wang et al.(2009b). The velocity gradient of SiII λ6355 during the first 10days after tBmax is measured as v̇Si=69±4 km s−1 day−1,which locates just around the boundary between HV-gradient(HVG) and low-velocity-gradient (LVG) objects (Benetti et al.2005). A relatively fast velocity decline might be due to thecollision of the ejecta with the nearby companion, as suggestedby the early light curve observed by Kepler (Dimitriadis et al.2018) or CSM. However, Shappee et al. (2018b) found that asingle power-law rise with a nondegenerate companion or CSMinteraction cannot well reproduce the early Kepler lightcurve. They derived that, at a radius of 4×1015 cm from theprogenitor, the CSM density ρCSM is less than 4.5×105 cm−3.
5. Discussion
5.1. Origin of Persistent Carbon Absorption
The unburned carbon features in early spectra can help todiscriminate between various explosion mechanisms or pro-genitor models for SNe Ia. Previous studies show that the CIIsignatures can be detected in 20%–30% of SNe Ia with agesyounger than ∼−4 days from the maximum light, and >40%of SNe Ia have unburned carbon before −10 days (Parrent et al.2011; Thomas et al. 2011; Silverman & Filippenko 2012;Maguire et al. 2014). The latest detection was at t=−4.4 daysfor SN 2008sl. In a late study, SN 2002fk showed carbonabsorption lasting ∼+7 days after maximum (Cartier et al.2014), and the 2002cx-like SN iPTF14atg showed CII λ6580absorption until about +2 weeks after maximum (Cao et al.2015).
The carbon absorption persists in the spectra of SN 2018ohfor an unusually long time. To examine this abnormal behavior,we further compare the CII 6580 evolution of SN 2018oh withsome well-known SNe Ia with prominent carbon absorptionfeatures, including SN 2002fk, SN 2009dc, SN 2011fe, SN
2013dy, and iPTF14atg, in Figure 18. The CII absorption is
strong in the t=−8.5 and −5.5 days spectra of SN 2018oh.
After that, the CII 6580 tends to become flattened, which was
not seen in other normal SNe Ia. The strength of the carbon
absorption features is found to decrease with time (except for
the period at t=−13 to −11 days from the maximum light;
Silverman & Filippenko 2012). However, the strength of the
CII λ6580 absorption of SN 2018oh increases after the B
maximum.For SN 2012cg and SN 2017cbv, the CII λ6580 of the
former lasted until −8 days (Silverman et al. 2012), while it
disappeared in the t=−13 days spectrum of the latter
(Hosseinzadeh et al. 2017). The super-Chandrasekhar (SC)
SN Ia–like SN 2009dc is known to show prominent carbon
absorption (Howell et al. 2006; Scalzo et al. 2010; Silverman
et al. 2011; Taubenberger et al. 2011). The C II 4267 absorption
is difficult to identify due to several Fe-group features in this
wavelength region. It was previously identified in SNLS
03D3bb and SN 2006D (Howell et al. 2006; Thomas et al.
2007), while Scalzo et al. (2010) proposed that this feature
might be due to CrII absorption. However, this feature in SN
2018oh has a similar velocity and strength evolution to that of
C II 6580 until t∼+8.0 days (see Figure 15), unlike SN
2009dc (Taubenberger et al. 2011). This gives us more
confidence in the identification of C II 4267 absorption in SN
2018oh.In theory, the pulsating delayed-detonation (PDD) model
predicts the presence of carbon in the outer ejecta during the
pulsation period (Hoeflich et al. 1996). Dessart et al. (2014)
claimed that PDD can leave more unburned carbon than
standard delayed-detonation models and thus produce promi-
nent CII lines in the spectra. However, these CII features
should disappear within 1 week after explosion. Their models
can reproduce the strong CII lines of SN 2013dy but cannot
explain the long-lasting CII lines seen in SN 2018oh.
Figure 14. High-resolution spectra taken by the MMT and HET. Some narrow spectral features are labeled. The upper axis shows the observed wavelength. The insetshows the region of the NaI D doublet absorption features due to the Milky Way and the host galaxy.
24
The Astrophysical Journal, 870:12 (33pp), 2019 January 1 Li et al.

Heringer et al. (2017) suggested that the emission of iron
near 6100Åcan smear out the CII 6580 absorption. Thus, a
smaller amount of IGEs in the outer ejecta could explain the
prominent carbon feature in SN 2018oh, which could be due to
stringent abundance stratification or lower metallicity for the
progenitor. For example, SN 2013cv was a transitional SN Ia
between normal and SC SNe Ia with persistent CII 6580 and
7234 until 1 week after maximum. It has high UV luminosity,
and its early-phase spectra were absent of FeII/III features,
suggestive of strong stratified structure in the explosion ejecta
and hence the progenitor (Cao et al. 2016). Exhibiting
relatively weaker FeIII λ5129 than SN 2003du, SN 2005cf,
and SN 2011fe (Section 4.1), SN 2018oh has blue UV color
(see Figure 7), which suggests that it suffered less mixing in the
explosion ejecta.As an alternative explanation for the abundance stratifica-
tion, it is possible that the progenitor of SN 2018oh has lower
metallicity. In order to study the properties of the host galaxy,
Figure 15. The C II λ4267, λ6580, and λ7234 evolution of SN 2018oh in velocity space. Three lines in each subplot are from one spectrum. The purple line in the topleft panel displays the C II λ4267 feature from the −7.5 days spectrum taken by NTT. The gray lines indicate the approximate velocity of the three features.
Table 9
SYNOW Fitting Parameters of SN 2018oh
Phase Tbb
SiII
λ6355 (HV) SiII λ6355 CII λ6580
CaII
λ8498 (HV) CaII λ8498 SII λ5454 OI λ7774 FeIII λ5129 FeIII λ4404(days) (kK) (103 km s−1
) (103 km s−1) (103 km s−1
) (103 km s−1) (103 km s−1
) (103 km s−1) (103 km s−1
) (103 km s−1) (103 km s−1
)
−8.0 10.20 14.13 11.90 14.00 19.25 12.56 10.40 10.69 10.29 9.81
−5.5 11.20 14.49 11.80 14.00 18.36 11.12 10.34 11.16 10.18 9.81
−3.0 11.81 13.77 11.95 14.50 18.65 11.86 9.63 9.77 9.88 10.15
+0.0 10.45 12.28 11.10 12.00 18.76 10.64 9.52 9.37 10.06 10.08
+5.0 9.79 12.60 9.75 10.00 19.59 12.17 9.57 10.68 10.18 9.67
+8.0 9.41 12.61 9.42 9.67 19.48 11.32 9,79 10.58 10.12 10.15
+14.0 9.43 L 10.15 8.16 L 12.43 9.74 10.69 10.06 9.54
25
The Astrophysical Journal, 870:12 (33pp), 2019 January 1 Li et al.

we downloaded the spectrum from the SDSS DR14 (Abolfathi
et al. 2018). It corresponds to the light that falls within the 2″
diameter fiber that is pointed at the center of the galaxy. Thus,
to estimate the total mass of the galaxy, we scaled the synthetic
broadband magnitudes measured from the spectrum to match
the real photometric measurements of the integrated light of the
galaxy (modelMag parameter). However, this procedure has
a caveat: it makes the assumption that the mass-to-light ratio
(M/L) obtained from the spectrum (and hence representative of
the area inside the fiber) is the same as the one outside the fiber.
Then, following Galbany et al. (2014), we performed simple
stellar population (SSP) synthesis to the spectrum with
STARLIGHT (Cid Fernandes et al. 2005) using the Granada-
MILES bases (González Delgado et al. 2015) and fit all of
the emission lines with Gaussian profiles in the subtracted
gas-phase spectrum. We estimated a stellar mass of
log10(Mstellar/Me)∼ 6.87± 0.12, a star formation rate (SFR)
of 5.54± 0.36 10−4Me yr−1, and a subsolar oxygen abun-
dance 12 + log10(O/H) of 8.49± 0.09 dex using the O3N2
calibration from Pettini & Pagel (2004), confirming that
UGC04780 is actually a metal-poor galaxy. These findings
are in total agreement with reported numbers in the SDSS
DR14 from different methods and codes.85 In comparison,
Shappee et al. (2018b) derived a larger mass of ´-+4.68 0.610.33
10 M8 from GALEX and PS1 photometry; they suggested that
this value can be regarded as an upper limit, which is thus not
inconsistent with our determination.Based on the above discussions, we suggest that the outer
ejecta of SN 2018oh may have few IGEs as a result of less
mixing and/or a metal-poor progenitor, which could explain
the presence of a prominent and persistent CII 6580 absorptionfeature in the spectra.
5.2. Bolometric Light Curves and Explosion Parameters
The extensive photometric observations of SN 2018ohenable us to construct a UVOIR “bolometric” light curvespanning the wavelength region from 0.16 to 2.3 μm. Thespectral energy distribution (SED) includes the uvw2, uvm2,uvw1, U, g, r, i, Y, J, H, and K bands. We interpolated the UV,optical, and NIR photometry from their neighboring epochs orthe corresponding template light curves whenever necessary.The final SED evolution is displayed in Figure 19. Adoptingthe distance d=52.7±1.2 Mpc from Section 3.3, thebolometric luminosity evolution is shown in the left panel ofFigure 20. Like other comparison SNe Ia (except for SN2005cf), SN 2018oh reached its peak about 1.5 days earlierthan the B-band maximum. The overall shape of the light curveis quite similar to that of SN 2017cbv and shows an apparentlyslower rise compared to SN 2003du.To estimate the nickel mass and other physical parameters of
the ejecta, we apply the radiation diffusion model of Arnett(1982; see also Chatzopoulos et al. 2012). Adopting theconstant opacity approximation, we fit the bolometric lightcurve using the Minim code (Chatzopoulos et al. 2013). The fitparameters are the time of “first light” t0 (see below), the initialmass of the radioactive nickel MNi, the light-curve timescale tlc,and the gamma-ray leaking timescale tγ (see, e.g., Chatzopouloset al. 2012 for details).If t0 is constrained to the moment of first light in the Kepler
data (MJD 58,144.3± 0.1), we get MNi=0.662±0.003Me,tlc=14.89±0.07 days, and tγ=39.56±0.18 days. Themodel light curve is plotted as a green dashed line togetherwith the observations in the right panel of Figure 20. It is seenthat this model poorly fits the light curve, because it deviatesfrom the observed data systematically before and around
Figure 16. Evolution of the expansion velocity of SN 2018oh as measured from the absorption minimum of SiII λ6355, SII 5640, CII 6580, CII 7234, OI 7774, andthe CaII NIR triplet. The inset plot illustrates the HV components of three features.
85http://skyserver.sdss.org/dr14/en/tools/explore/parameters.aspx?
id=1237667430628982959&spec=2573869371524933632&apid=&fieldId=0x112d13f880b60000&ra=136.664749886541&dec=19.3362515108894&plateId=2573807249117964288
26
The Astrophysical Journal, 870:12 (33pp), 2019 January 1 Li et al.
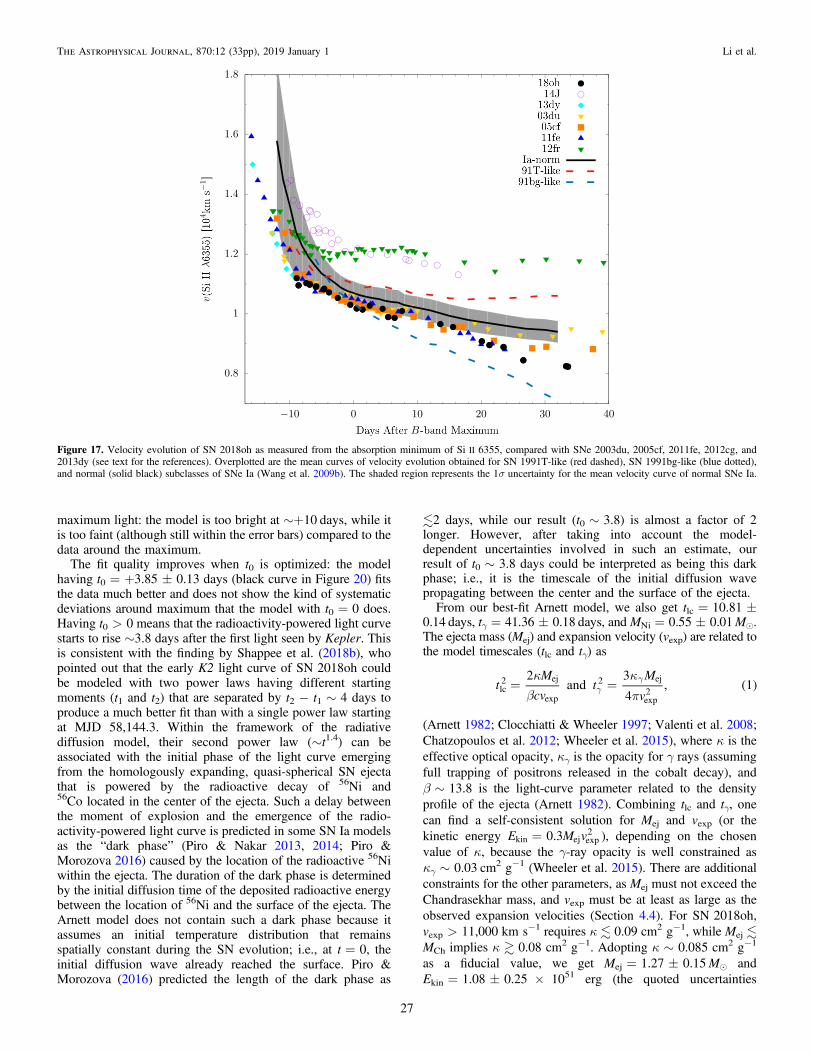
maximum light: the model is too bright at ∼+10 days, while itis too faint (although still within the error bars) compared to thedata around the maximum.
The fit quality improves when t0 is optimized: the modelhaving t0=+3.85±0.13 days (black curve in Figure 20) fitsthe data much better and does not show the kind of systematicdeviations around maximum that the model with t0=0 does.Having t0>0 means that the radioactivity-powered light curvestarts to rise ∼3.8 days after the first light seen by Kepler. Thisis consistent with the finding by Shappee et al. (2018b), whopointed out that the early K2 light curve of SN2018oh couldbe modeled with two power laws having different startingmoments (t1 and t2) that are separated by t2−t1∼4 days toproduce a much better fit than with a single power law startingat MJD 58,144.3. Within the framework of the radiativediffusion model, their second power law (∼t1.4) can beassociated with the initial phase of the light curve emergingfrom the homologously expanding, quasi-spherical SN ejectathat is powered by the radioactive decay of 56Ni and56Co located in the center of the ejecta. Such a delay betweenthe moment of explosion and the emergence of the radio-activity-powered light curve is predicted in some SN Ia modelsas the “dark phase” (Piro & Nakar 2013, 2014; Piro &Morozova 2016) caused by the location of the radioactive 56Niwithin the ejecta. The duration of the dark phase is determinedby the initial diffusion time of the deposited radioactive energybetween the location of 56Ni and the surface of the ejecta. TheArnett model does not contain such a dark phase because itassumes an initial temperature distribution that remainsspatially constant during the SN evolution; i.e., at t=0, theinitial diffusion wave already reached the surface. Piro &Morozova (2016) predicted the length of the dark phase as
2 days, while our result (t0∼3.8) is almost a factor of 2longer. However, after taking into account the model-dependent uncertainties involved in such an estimate, ourresult of t0∼3.8 days could be interpreted as being this darkphase; i.e., it is the timescale of the initial diffusion wavepropagating between the center and the surface of the ejecta.From our best-fit Arnett model, we also get tlc=10.81±
0.14 days, tγ=41.36±0.18 days, andMNi=0.55±0.01Me.The ejecta mass (Mej) and expansion velocity (vexp) are related tothe model timescales (tlc and tγ) as
kb
k
p= =g
g( )t
M
cvt
M
v
2and
3
4, 1lc
2 ej
exp
2 ej
exp2
(Arnett 1982; Clocchiatti & Wheeler 1997; Valenti et al. 2008;
Chatzopoulos et al. 2012; Wheeler et al. 2015), where κ is the
effective optical opacity, κγ is the opacity for γ rays (assuming
full trapping of positrons released in the cobalt decay), and
β∼13.8 is the light-curve parameter related to the density
profile of the ejecta (Arnett 1982). Combining tlc and tγ, one
can find a self-consistent solution for Mej and vexp (or the
kinetic energy =E M v0.3kin ej exp2 ), depending on the chosen
value of κ, because the γ-ray opacity is well constrained as
κγ∼0.03 cm2g−1(Wheeler et al. 2015). There are additional
constraints for the other parameters, as Mej must not exceed the
Chandrasekhar mass, and vexp must be at least as large as the
observed expansion velocities (Section 4.4). For SN2018oh,vexp>11,000 kms−1 requires κ 0.09 cm2g−1, while Mej MCh implies κ 0.08 cm2g−1. Adopting κ∼0.085 cm2g−1
as a fiducial value, we get Mej=1.27±0.15Me and
Ekin=1.08±0.25 × 1051 erg (the quoted uncertainties
Figure 17. Velocity evolution of SN 2018oh as measured from the absorption minimum of SiII 6355, compared with SNe 2003du, 2005cf, 2011fe, 2012cg, and2013dy (see text for the references). Overplotted are the mean curves of velocity evolution obtained for SN 1991T-like (red dashed), SN 1991bg-like (blue dotted),and normal (solid black) subclasses of SNe Ia (Wang et al. 2009b). The shaded region represents the 1σ uncertainty for the mean velocity curve of normal SNe Ia.
27
The Astrophysical Journal, 870:12 (33pp), 2019 January 1 Li et al.

reflect the upper and lower value of κ given above). These
values are close to the typical ejecta masses and kinetic
energies for SNe Ia (e.g., Scalzo et al. 2014a, 2014b).The uncertainty in the true explosion date has a consequence
for the nickel mass estimate. Our first model having t0 fixed to
the moment of first light in the K2 light curve gives MNi∼0.66Me, which is very similar to the estimate ofMNi=0.64±0.04Me based on “Arnett’s rule” (Arnett 1982; Arnett et al.
1985; Branch & Tammann 1992; Stritzinger & Leibundgut
2005; Chatzopoulos et al. 2012). Both of these estimates
predict ∼0.1Me higher nickel mass than our best-fit Arnett
model described above, due to the ∼3.5 days longer rise time to
maximum light. Since this model gives a much better
description of the evolution of the bolometric light curve, we
adopt its final nickel mass of MNi=0.55±0.04Me. This is
very similar to the estimate of ∼0.57Me for SN 2011fe (Zhang
et al. 2016) and smaller than the estimates of 0.77±0.11Me
for SN 2005cf (Wang et al. 2009a) and 0.68±0.14Me for SN
2003du (Stanishev et al. 2007).
All of these are based on the assumption that the bolometric
light curve of SN2018oh is entirely powered by the Ni–Co
radioactive decay located centrally within the ejecta (Arnett 1982).
The early linear rise of the flux observed by Kepler, which could
be due to either the interaction with a close companion star
(Dimitriadis et al. 2018) or the presence of radioactive 56Ni in the
outer layers of the ejecta and/or interaction with a nearby CSM
(Shappee et al. 2018b), suggests that the assumptions of the Arnett
model are not entirely fulfilled. For example, in the interaction
model, the flux from the early shock may contribute to the full
bolometric light curve nonnegligibly, even around and after
maximum light. Subtracting the prediction of the shock-interac-
tion model by Kasen (2010), assuming a Roche-lobe-filling
companion at A∼2×1012 cm from the exploding white dwarf
(Dimitriadis et al. 2018) and an optimal viewing angle, would
yield MNi=0.54±0.01Me, tlc=10.96±0.17 days, and
tγ=37.89±0.17 days. Thus, whileMNi and tlc are not changed
significantly, the post-maximum contribution from the shock
may slightly decrease the γ-ray leaking timescale. Finally, one
Figure 18. The C II λ6580 evolution of SN 2018oh compared to that of SN 2003du, SN 2011fe, iPTF14atg, and SN 2002fk. The gray dashed lines indicate thevelocity evolution trend for the corresponding lines.
28
The Astrophysical Journal, 870:12 (33pp), 2019 January 1 Li et al.
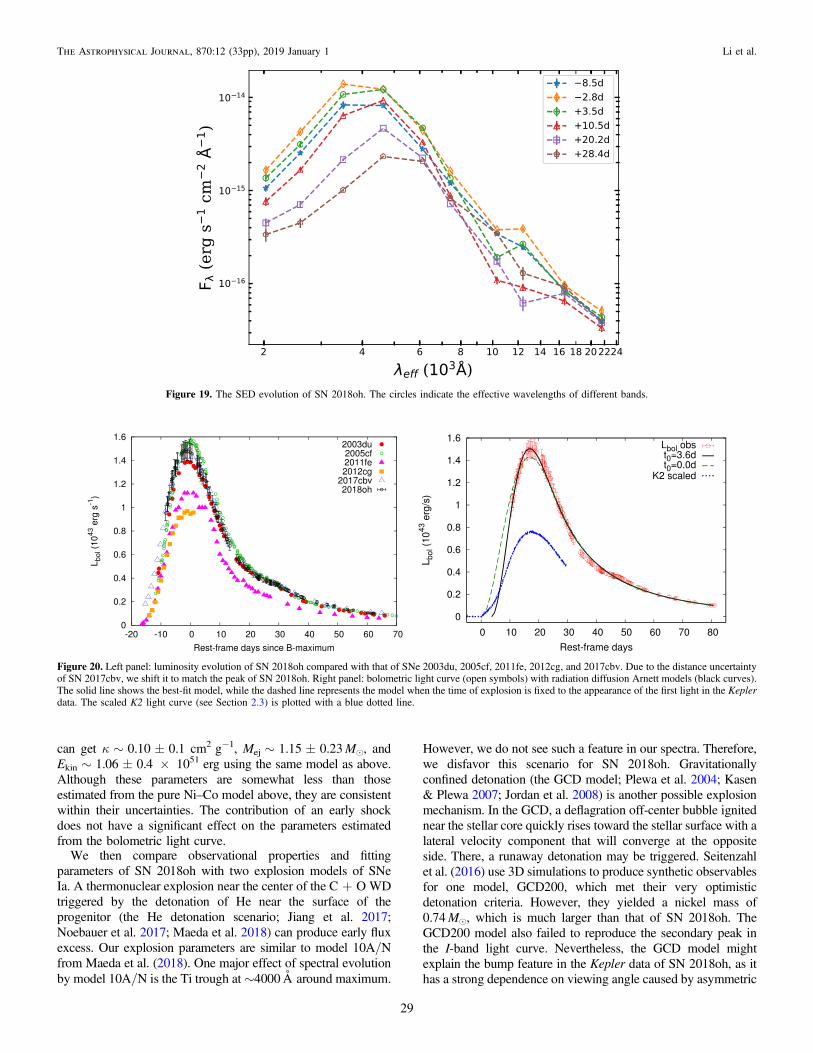
can get κ∼0.10±0.1 cm2g−1, Mej∼1.15±0.23Me, and
Ekin∼1.06±0.4 × 1051 erg using the same model as above.
Although these parameters are somewhat less than those
estimated from the pure Ni–Co model above, they are consistent
within their uncertainties. The contribution of an early shock
does not have a significant effect on the parameters estimated
from the bolometric light curve.We then compare observational properties and fitting
parameters of SN 2018oh with two explosion models of SNe
Ia. A thermonuclear explosion near the center of the C+O WD
triggered by the detonation of He near the surface of the
progenitor (the He detonation scenario; Jiang et al. 2017;
Noebauer et al. 2017; Maeda et al. 2018) can produce early flux
excess. Our explosion parameters are similar to model 10A/Nfrom Maeda et al. (2018). One major effect of spectral evolution
by model 10A/N is the Ti trough at∼4000Åaround maximum.
However, we do not see such a feature in our spectra. Therefore,
we disfavor this scenario for SN 2018oh. Gravitationally
confined detonation (the GCD model; Plewa et al. 2004; Kasen
& Plewa 2007; Jordan et al. 2008) is another possible explosion
mechanism. In the GCD, a deflagration off-center bubble ignited
near the stellar core quickly rises toward the stellar surface with a
lateral velocity component that will converge at the opposite
side. There, a runaway detonation may be triggered. Seitenzahl
et al. (2016) use 3D simulations to produce synthetic observables
for one model, GCD200, which met their very optimistic
detonation criteria. However, they yielded a nickel mass of
0.74Me, which is much larger than that of SN 2018oh. The
GCD200 model also failed to reproduce the secondary peak in
the I-band light curve. Nevertheless, the GCD model might
explain the bump feature in the Kepler data of SN 2018oh, as it
has a strong dependence on viewing angle caused by asymmetric
Figure 19. The SED evolution of SN 2018oh. The circles indicate the effective wavelengths of different bands.
Figure 20. Left panel: luminosity evolution of SN 2018oh compared with that of SNe 2003du, 2005cf, 2011fe, 2012cg, and 2017cbv. Due to the distance uncertaintyof SN 2017cbv, we shift it to match the peak of SN 2018oh. Right panel: bolometric light curve (open symbols) with radiation diffusion Arnett models (black curves).The solid line shows the best-fit model, while the dashed line represents the model when the time of explosion is fixed to the appearance of the first light in the Keplerdata. The scaled K2 light curve (see Section 2.3) is plotted with a blue dotted line.
29
The Astrophysical Journal, 870:12 (33pp), 2019 January 1 Li et al.

deflagration ashes. The UV flux is expected to enhance if the SNwas observed at a viewing angle near the detonation ignitionside. However, this specific viewing angle does not producesynthetic spectra that are consistent with the observed ones overmultiple epochs. Thus, we conclude that the current GCD200model cannot explain the bulk properties of SN 2018oh.
6. Conclusion
We present extensive follow-up photometry and spectrosc-opy for SN 2018oh, the first spectroscopically confirmed SN Ia(at a distance of 52.7 Mpc) observed by Kepler. SN 2018ohreached its B-band peak on MJD=58,162.7±0.3 with anapparent magnitude of Bmax=14.31±0.03 and an absolutemagnitude of M B
max =−19.47±0.10. It has normal photo-metric evolution, with a rise time of 18.3±0.3 days andΔm15(B)=0.96±0.03 mag, but it seems to have a relativelybluer B−V color.
Using three light-curve models, we derive a distance to thehost galaxy of UGC 4780 as d=52.7±1.2 Mpc. UGC 04780is a star-forming dwarf galaxy with ~( )M Mlog10 stellar
6.87 0.12 and a low metallicity. Based on the extensiveUV/optical/NIR photometry, we established the genericbolometric light curve of SN 2018oh. Fitting Arnett’s radiationdiffusion model powered by radioactive decay of Ni and Co tothe bolometric light curve, we derived a peak luminosity ofLpeak=1.49×1043 erg s−1 with a synthesized nickel massMNi=0.55±0.04Me. The moment when the luminositybegin to emerge in the radiation diffusion model, t0, is found tobe +3.85 days after explosion. This is consistent with thehypotheses explored by Dimitriadis et al. (2018) and Shappeeet al. (2018b) that the early flux is either due to interactionbetween the ejecta and some nearby material (a nondegeneratecompanion star or a CSM) or a noncentral location of theradioactive 56Ni within the ejecta, and it does not emergedirectly from the SN ejecta. In addition, we also explored twoSN Ia explosion models, He detonation and gravitationallyconfined detonation, though neither of them can fully explainthe properties of SN 2018oh.
The overall spectral evolution of SN 2018oh is similar to thatof normal SNe Ia like SN 2003du, but there are still someinteresting features that distinguish it from other SNe Ia. Forinstance, the line-strength ratio of SiII λλ5958, 5979 to SiIIλ6355 (R(Si II)) is found to increase from the early phase tot=−4 days and then decrease toward the maximum light,suggesting a fluctuation of the photospheric temperatureconsistent with the line profile change of CII 6580. We canput SN 2018oh into the Branch SS subtype or at the boundarybetween SS and core-normal subtypes based on the pEWs of SiIIλλ5972, 6355, similar to a few other SNe Ia showing excessemissions in the early phase in Stritzinger et al. (2018). Thevelocity of SiII 6355 (i.e., ∼10,300± 200 km s−1 at t∼0 days)suggests that SN 2018oh belongs to the normal subclass, but itshows a somewhat larger velocity gradient (near the boundarybetween the LVG and HVG groups) after the maximum light.The basic parameters of SN 2018oh are listed in Table 10.
The most striking spectral feature identified for SN 2018oh isthe long-lasting C II absorption. We can identify C II 4267, 6580,and 7234 in early spectra, which all have similar velocity andstrength evolution from t∼−9 to+8 days. During this phase, thevelocity of CII 6580 and 4267 decreases from ∼11,700 to∼8,000 km s−1, suggesting a strong mixing of carbon in theexploding ejecta. The CII 6580 absorption can even be detected
in the t=+20.5 days spectrum, which is never seen in other SNeIa. The origin of the persistent carbon in SN 2018oh is unclear butmay be related to the nature of progenitor systems such as lowermetallicity. Detailed modeling is needed to clarify this issue.
This work is supported by Ma Huateng Foundation. Weacknowledge the support of the staff of the Lijiang 2.4 m andXinglong 2.16 m telescopes. Funding for the LJT has beenprovided by Chinese Academy of Sciences and the People’sGovernment of Yunnan Province. The LJT is jointly operatedand administrated by Yunnan Observatories and the Center forAstronomical Mega-Science, CAS. This work is supported bythe National Natural Science Foundation of China (NSFCgrants 11325313, 11633002, and 11761141001), the NationalProgram on Key Research and Development Project (grant No.2016YFA0400803), and the Tsinghua University InitiativeScientific Research Program (20161080144). This work wasalso partially supported by the Collaborating Research Program(OP201702) of the Key Laboratory of the Structure andEvolution of Celestial Objects, Chinese Academy of Sciences.This work is sponsored (in part) by the Chinese Academy ofSciences (CAS) through a grant to the CAS South AmericaCenter for Astronomy (CASSACA) in Santiago, Chile. J-JZ issupported by the NSFC (grants 11403096 and 11773067), theKey Research Program of the CAS (grant No. KJZD-EW-M06), the Youth Innovation Promotion Association of the CAS(grant 2018081), and the CAS “Light of West China” Program.FH is supported by the Collaborating Research Program(OP201702) of the Key Laboratory of the Structure andEvolution of Celestial Objects, Chinese Academy of Sciences.This work makes use of observations from Las Cumbres
Observatory. DAH, CM, and GH are supported by the USNational Science Foundation under grant 1313484. Support forIA was provided by NASA through the Einstein FellowshipProgram, grant PF6-170148. The work made use of Swift/UVOT data reduced by P. J. Brown and released in the SwiftOptical/Ultraviolet Supernova Archive (SOUSA). SOUSA issupported by NASA’s Astrophysics Data Analysis Programthrough grant NNX13AF35G. Research by DJS is supported byNSF grants AST-1821967, 1821987, 1813708, and 1813466.This work includes data obtained with the Swope Telescope
at Las Campanas Observatory, Chile, as part of the SwopeTime Domain Key Project (PI: Piro; co-PIs: Shappee, Drout,Madore, Phillips, Foley, and Hsiao). We thank I. Thompson
Table 10
Parameters of SN 2018oh
Parameter Value
Photometric
Bmax 14.32±0.01 mag
Bmax-Vmax −0.09±0.02 mag
-( )E B V host 0.00±0.04 mag
Δm15(B) 0.96±0.03 mag
tmax(B) 58,162.7±0.3 days
t0 58,144.37±0.04 days
τrise 18.3±0.3 days
Lbolmax 1.49×1043 erg s−1
M Ni56 0.55±0.04 Me
Spectroscopic
v0(Si II) 10,300±300 km s−1
v̇(Si II) 69±4 km s−1day−1
R(SiII) 0.15±0.04
30
The Astrophysical Journal, 870:12 (33pp), 2019 January 1 Li et al.
and the Carnegie Observatory Time Allocation Committee forapproving the Swope project and scheduling this program.Parts of this research were supported by the AustralianResearch Council Centre of Excellence for All Sky Astro-physics in 3 Dimensions (ASTRO 3D) through project numberCE170100013. EB and JD acknowledge partial support fromNASA grant NNX16AB5G.
JV and his group at Konkoly Observatory are supported bythe project “Transient Astrophysical Objects” GINOP 2.3.2-15-2016-00033 of the National Research, Development andInnovation Office (NKFIH), Hungary, funded by the EuropeanUnion, and by the “Lendület” Program of the HungarianAcademy of Sciences, project Nos. LP2012-31 and LP2018-7/2018. This project has been supported by NKFIH grantK-115709. ZsB acknowledges the support provided by theNational Research, Development and Innovation Fund ofHungary, financed under the PD_17 funding scheme, projectNo. PD123910. Support for JJH was provided by NASAthrough Hubble Fellowship grant #HST-HF2-51357.001-A,awarded by the Space Telescope Science Institute, which isoperated by the Association of Universities for Research inAstronomy, Inc., under NASA contract NAS5-26555, as wellas NASA K2 Cycle 4 grant NNX17AE92G.
Based on observations obtained at the Southern Astrophy-sical Research (SOAR) telescope, which is a joint project of theMinistério da Ciência, Tecnologia, e Inovação da RepúblicaFederativa do Brasil, the U.S. National Optical AstronomyObservatory, the University of North Carolina at Chapel Hill,and Michigan State University.
Based in part on observations collected at the EuropeanOrganisation for Astronomical Research in the SouthernHemisphere under ESO program 199.D-0143. LG wassupported in part by the US National Science Foundationunder grant AST-1311862. KM acknowledges support fromthe STFC through an Ernest Rutherford Fellowship and EUHorizon 2020 ERC grant No. 758638. CPG acknowledgessupport from EU/FP7-ERC grant No. [615929].
We thank the Las Cumbres Observatory and its staff for itscontinuing support of the ASAS-SN project. ASAS-SN issupported by the Gordon and Betty Moore Foundation throughgrant GBMF5490 to Ohio State University and NSF grantAST-1515927. Development of ASAS-SN has been supportedby NSF grant AST-0908816, the Mt. Cuba AstronomicalFoundation, the Center for Cosmology and AstroParticlePhysics at Ohio State University, the Chinese Academy ofSciences South America Center for Astronomy (CASSACA),the Villum Foundation, and George Skestos.
SB, PC, and SD acknowledge Project 11573003, supportedby NSFC. This research uses data obtained through theTelescope Access Program (TAP), which has been funded bythe Strategic Priority Research Program–The Emergence ofCosmological Structures of the Chinese Academy of Sciences(grant No. 11 XDB09000000) and the Special Fund forAstronomy from the Ministry of Finance. The UCSC group issupported in part by NASA grants NNG17PX03C and80NSSC18K0303, NSF grant AST-1518052, the Gordon &Betty Moore Foundation, the Heising-Simons Foundation, andfellowships from the Alfred P. Sloan Foundation and the Davidand Lucile Packard Foundation to RJF.
This paper includes data collected by the K2 mission.Funding for the K2 mission is provided by the NASA ScienceMission directorate. KEGS is supported in part by NASA K2
cycle 4 and 5 grants NNX17AI64G and 80NSSC18K0302,respectively. AR and his groups are supported in part by HSTgrants GO-12577 and HST AR-12851.Software: IRAF (Tody 1986, 1993), Minim (Chatzopoulos
et al. 2013), FITSH (Pál 2012), SNCOSMO (Barbary et al.2016), PESSTO pipeline (Smartt et al. 2015), SALT2.4(Betoule et al. 2014), SNooPy2 (Burns et al. 2011), MLCS2k2(Jha et al. 2007), photpipe (Rest et al. 2005, 2014), SYNOW(Fisher et al. 1997), STARLIGHT (Cid Fernandes et al. 2005),SExtractor (Bertin & Arnouts 1996).
ORCID iDs
X. Wang https://orcid.org/0000-0002-7334-2357J. Vinkó https://orcid.org/0000-0001-8764-7832G. Hosseinzadeh https://orcid.org/0000-0002-0832-2974D. J. Sand https://orcid.org/0000-0003-4102-380XJ. Zhang https://orcid.org/0000-0002-8296-2590E. Baron https://orcid.org/0000-0001-5393-1608L. Wang https://orcid.org/0000-0002-1094-3817C. McCully https://orcid.org/0000-0001-5807-7893I. Arcavi https://orcid.org/0000-0001-7090-4898S. Valenti https://orcid.org/0000-0001-8818-0795P. Garnavich https://orcid.org/0000-0003-4069-2817G. Narayan https://orcid.org/0000-0001-6022-0484E. Shaya https://orcid.org/0000-0002-3234-8699S. Margheim https://orcid.org/0000-0001-8205-9441A. Villar https://orcid.org/0000-0002-5814-4061D. A. Coulter https://orcid.org/0000-0003-4263-2228O. D. Fox https://orcid.org/0000-0003-2238-1572S. W. Jha https://orcid.org/0000-0001-8738-6011D. O. Jones https://orcid.org/0000-0002-6230-0151C. D. Kilpatrick https://orcid.org/0000-0002-5740-7747A. L. Piro https://orcid.org/0000-0001-6806-0673T. W.-S. Holoien https://orcid.org/0000-0001-9206-3460K. Auchettl https://orcid.org/0000-0002-4449-9152C. S. Kochanek https://orcid.org/0000-0001-6017-2961J. S. Brown https://orcid.org/0000-0002-1885-6419S. Bose https://orcid.org/0000-0003-3529-3854D. Bersier https://orcid.org/0000-0001-7485-3020J. A. Muñoz https://orcid.org/0000-0001-9833-2959R. L. Mutel https://orcid.org/0000-0003-1511-6279J. L. Prieto https://orcid.org/0000-0003-0943-0026J. Shields https://orcid.org/0000-0002-1560-5286S. J. Smartt https://orcid.org/0000-0002-8229-1731K. C. Chambers https://orcid.org/0000-0001-6965-7789H. A. Flewelling https://orcid.org/0000-0002-1050-4056M. E. Huber https://orcid.org/0000-0003-1059-9603E. A. Magnier https://orcid.org/0000-0002-7965-2815C. Z. Waters https://orcid.org/0000-0003-1989-4879J. Bulger https://orcid.org/0000-0003-4641-2003K. Sárneczky https://orcid.org/0000-0003-0926-3950A. Pál https://orcid.org/0000-0001-5449-2467J. C. Wheeler https://orcid.org/0000-0003-1349-6538Zs. Bognár https://orcid.org/0000-0002-8493-9781O. Hanyecz https://orcid.org/0000-0002-9415-5219R. Szabó https://orcid.org/0000-0002-3258-1909R. Szakáts https://orcid.org/0000-0002-1698-605XP. Milne https://orcid.org/0000-0002-0370-157XP. J. Brown https://orcid.org/0000-0001-6272-5507S. C. Williams https://orcid.org/0000-0002-4237-3994L. Galbany https://orcid.org/0000-0002-1296-6887I. M. Hook https://orcid.org/0000-0002-2960-978X
31
The Astrophysical Journal, 870:12 (33pp), 2019 January 1 Li et al.

C. Inserra https://orcid.org/0000-0002-3968-4409C. P. Gutiérrez https://orcid.org/0000-0002-7252-4351J. L. Tonry https://orcid.org/0000-0003-2858-9657A. N. Heinze https://orcid.org/0000-0003-3313-4921B. Stalder https://orcid.org/0000-0003-0973-4900G. Barentsen https://orcid.org/0000-0002-3306-3484J. Dotson https://orcid.org/0000-0003-4206-5649T. Barclay https://orcid.org/0000-0001-7139-2724M. Gully-Santiago https://orcid.org/0000-0002-4020-3457C. Hedges https://orcid.org/0000-0002-3385-8391A. M. Cody https://orcid.org/0000-0002-3656-6706S. Howell https://orcid.org/0000-0002-2532-2853
References
Abolfathi, B., Aguado, D. S., Aguilar, G., et al. 2018, ApJS, 235, 42Albareti, F. D., Allende Prieto, C., Almeida, A., et al. 2017, ApJS, 233, 25Aldering, G., Antilogus, P., Bailey, S., et al. 2006, ApJ, 650, 510Arnett, W. D. 1982, ApJ, 253, 785Arnett, W. D., Branch, D., & Wheeler, J. C. 1985, Natur, 314, 337Barbary, K., Barclay, T., Biswas, R., et al. 2016, SNCosmo: Python library for
supernova cosmology, Astrophysics Source Code Library, ascl:1611.017Benetti, S., Cappellaro, E., Mazzali, P. A., et al. 2005, ApJ, 623, 1011Bertin, E., & Arnouts, S. 1996, A&A, 117, 393Betoule, M., Kessler, R., Guy, J., et al. 2014, A&A, 568, A22Blondin, S., Matheson, T., Kirshner, R. P., et al. 2012, AJ, 143, 126Branch, D., Dang, L. C., Hall, N., et al. 2006, PASP, 118, 560Branch, D., & Tammann, G. A. 1992, ARA&A, 30, 359Breeveld, A. A., Landsman, W., Holland, S. T., et al. 2011, in AIP Conf. Ser.
1358, Gamma-Ray Bursts 2010 (Melville, NY: AIP), 373Brown, J. S., Stanek, K. Z., Vallely, P., et al. 2018, ATel, 11253Brown, P. J., Breeveld, A. A., Holland, S., Kuin, P., & Pritchard, T. 2014,
Ap&SS, 354, 89Brown, P. J., Dawson, K. S., de Pasquale, M., et al. 2012, ApJ, 753, 22Brown, P. J., Landez, N. J., Milne, P. A., & Stritzinger, M. D. 2017, ApJ,
836, 232Brown, T. M., Baliber, N., Bianco, F. B., et al. 2013, PASP, 125, 1031Burns, C. R., Stritzinger, M., Phillips, M. M., et al. 2011, AJ, 141, 19Burns, C. R., Stritzinger, M., Phillips, M. M., et al. 2014, ApJ, 789, 32Buzzoni, B., Delabre, B., Dekker, H., et al. 1984, Msngr, 38, 9Cao, Y., Johansson, J., Nugent, P. E., et al. 2016, ApJ, 823, 147Cao, Y., Kulkarni, S. R., Howell, D. A., et al. 2015, Natur, 521, 328Cardelli, J. A., Clayton, G. C., & Mathis, J. S. 1989, ApJ, 345, 245Cartier, R., Hamuy, M., Pignata, G., et al. 2014, ApJ, 789, 89Chambers, K. C., Magnier, E. A., Metcalfe, N., et al. 2016, arXiv:1612.05560Chatzopoulos, E., Wheeler, J. C., & Vinko, J. 2012, ApJ, 746, 121Chatzopoulos, E., Wheeler, J. C., Vinko, J., Horvath, Z. L., & Nagy, A. 2013,
ApJ, 773, 76Childress, M. J., Filippenko, A. V., Ganeshalingam, M., & Schmidt, B. P.
2014, MNRAS, 437, 338Chonis, T. S., Hill, G. J., Lee, H., et al. 2016, Proc. SPIE, 9908, 99084CCid Fernandes, R., Mateus, A., Sodré, L., Stasińska, G., & Gomes, J. M. 2005,
MNRAS, 358, 363Clemens, J. C., Crain, J. A., & Anderson, R. 2004, Proc. SPIE, 5492, 331Clocchiatti, A., & Wheeler, J. C. 1997, ApJ, 491, 375Contreras, C., Hamuy, M., Phillips, M. M., et al. 2010, AJ, 139, 519Cousins, A. W. J. 1981, SAAOC, 6, 4Cox, N. L. J., & Patat, F. 2008, A&A, 485, L9D’Odorico, S., di Serego Alighieri, S., Pettini, M., et al. 1989, A&A, 215, 21Dessart, L., Blondin, S., Hillier, D. J., & Khokhlov, A. 2014, MNRAS,
441, 532Dilday, B., Howell, D. A., Cenko, S. B., et al. 2012, Sci, 337, 942Dimitriadis, G., Foley, R. J., Rest, A., et al. 2018, ApJL, 870, L1Fan, Y.-F., Bai, J.-M., Zhang, J.-J., et al. 2015, RAA, 15, 918Fisher, A., Branch, D., Nugent, P., & Baron, E. 1997, ApJL, 481, L89Flaugher, B., Diehl, H. T., Honscheid, K., et al. 2015, AJ, 150, 150Flewelling, H. A., Magnier, E. A., Chambers, K. C., et al. 2016, arXiv:1612.
05243Folatelli, G., Phillips, M. M., Morrell, N., et al. 2012, ApJ, 745, 74Foley, R. J. 2012, ApJ, 748, 127Foley, R. J., & Kasen, D. 2011, ApJ, 729, 55Foley, R. J., Sanders, N. E., & Kirshner, R. P. 2011, ApJ, 742, 89
Galbany, L., Stanishev, V., Mourão, A. M., et al. 2014, A&A, 572, A38Ganeshalingam, M., Li, W., Filippenko, A. V., et al. 2012, ApJ, 751, 142Garavini, G., Nobili, S., Taubenberger, S., et al. 2007, A&A, 471, 527Gehrels, N., Chincarini, G., Giommi, P., et al. 2004, ApJ, 611, 1005González Delgado, R. M., García-Benito, R., Pérez, E., et al. 2015, A&A,
581, A103González Hernández, J. I., Ruiz-Lapuente, P., Tabernero, H. M., et al. 2012,
Natur, 489, 533Guy, J., Sullivan, M., Conley, A., et al. 2010, A&A, 523, A7Haas, M. R., Batalha, N. M., Bryson, S. T., et al. 2010, ApJL, 713, L115Hamuy, M., Phillips, M. M., Suntzeff, N. B., et al. 2003, Natur, 424, 651Heringer, E., van Kerkwijk, M. H., Sim, S. A., & Kerzendorf, W. E. 2017, ApJ,
846, 15Hoeflich, P., Khokhlov, A., Wheeler, J. C., et al. 1996, ApJL, 472, L81Honscheid, K., DePoy, D. L. & for the DES Collaboration 2008,
arXiv:0810.3600Hosseinzadeh, G., Sand, D. J., Valenti, S., et al. 2017, ApJL, 845, L11Howell, D. A., Sullivan, M., Nugent, P. E., et al. 2006, Natur, 443, 308Huang, F., Li, J.-Z., Wang, X.-F., et al. 2012, RAA, 12, 1585Iben, I., Jr., & Tutukov, A. V. 1984, ApJS, 54, 335Jha, S., Riess, A. G., & Kirshner, R. P. 2007, ApJ, 659, 122Jiang, J.-A., Doi, M., Maeda, K., et al. 2017, Natur, 550, 80Johnson, H. L., Mitchell, R. I., Iriarte, B., & Wisniewski, W. Z. 1966, CoLPL,
4, 99Jordan, G. C., IV, Fisher, R. T., Townsley, D. M., et al. 2008, ApJ, 681, 1448Kasen, D. 2010, ApJ, 708, 1025Kasen, D., & Plewa, T. 2007, ApJ, 662, 459Krisciunas, K., Contreras, C., Burns, C. R., et al. 2017, AJ, 154, 211Landolt, A. U. 1992, AJ, 104, 340Leadbeater, R. 2018, Transient Name Server Classification Report 159, https://
wis-tns.weizmann.ac.il/object/2018oh/classification-certLeonard, D. C. 2007, ApJ, 670, 1275Li, W., Bloom, J. S., Podsiadlowski, P., et al. 2011, Natur, 480, 348Maeda, K., Benetti, S., Stritzinger, M., et al. 2010, Natur, 466, 82Maeda, K., Jiang, J.-a., Shigeyama, T., & Doi, M. 2018, ApJ, 861, 78Magnier, E. A., Schlafly, E. F., Finkbeiner, D. P., et al. 2016, arXiv:1612.
05242Maguire, K., Sullivan, M., Pan, Y.-C., et al. 2014, MNRAS, 444, 3258Maguire, K., Sullivan, M., Patat, F., et al. 2013, MNRAS, 436, 222Maguire, K., Taubenberger, S., Sullivan, M., & Mazzali, P. A. 2016, MNRAS,
457, 3254Mandel, K. S., Foley, R. J., & Kirshner, R. P. 2014, ApJ, 797, 75Maoz, D., Mannucci, F., & Nelemans, G. 2014, ARA&A, 52, 107Marion, G. H., Brown, P. J., Vinkó, J., et al. 2016, ApJ, 820, 92Matheson, T., Joyce, R. R., Allen, L. E., et al. 2012, ApJ, 754, 19Mattila, S., Lundqvist, P., Sollerman, J., et al. 2005, A&A, 443, 649Maund, J. R., Höflich, P., Patat, F., et al. 2010, ApJL, 725, L167Mazzali, P. A., Sullivan, M., Hachinger, S., et al. 2014, MNRAS, 439, 1959Mennekens, N., Vanbeveren, D., De Greve, J. P., & De Donder, E. 2010,
A&A, 515, A89Miller, A. A., Cao, Y., Piro, A. L., et al. 2018, ApJ, 852, 100Miller, J. S., & Stone, R. P. S. 1993, Lick Obs. Tech. Rep. 66, Lick Obs.,
Santa CruzMilne, P. A., Brown, P. J., Roming, P. W. A., Bufano, F., & Gehrels, N. 2013,
ApJ, 779, 23Molnár, L., Pál, A., Plachy, E., et al. 2015, ApJ, 812, 2Mulligan, B. W., & Wheeler, J. C. 2017, MNRAS, 467, 778Mulligan, B. W., & Wheeler, J. C. 2018, MNRAS, 476, 1299Munari, U., Henden, A., Belligoli, R., et al. 2013, NewA, 20, 30Noebauer, U. M., Kromer, M., Taubenberger, S., et al. 2017, MNRAS,
472, 2787Nomoto, K. 1982, ApJ, 253, 798Nomoto, K., Iwamoto, K., & Kishimoto, N. 1997, Sci, 276, 1378Nugent, P., Phillips, M., Baron, E., Branch, D., & Hauschildt, P. 1995, ApJL,
455, L147Olling, R. P., Mushotzky, R., Shaya, E. J., et al. 2015, Natur, 521, 332Pál, A. 2012, MNRAS, 421, 1825Pál, A., Szabó, R., Szabó, G. M., et al. 2015, ApJL, 804, L45Pan, Y.-C., Foley, R. J., Kromer, M., et al. 2015, MNRAS, 452, 4307Parrent, J. T., Thomas, R. C., Fesen, R. A., et al. 2011, ApJ, 732, 30Patat, F., Chandra, P., Chevalier, R., et al. 2007, Sci, 317, 924Perlmutter, S., Aldering, G., Goldhaber, G., et al. 1999, ApJ, 517, 565Pettini, M., & Pagel, B. E. J. 2004, MNRAS, 348, L59Phillips, M. M., Lira, P., Suntzeff, N. B., et al. 1999, AJ, 118, 1766Phillips, M. M., Simon, J. D., Morrell, N., et al. 2013, ApJ, 779, 38Piro, A. L., & Morozova, V. S. 2016, ApJ, 826, 96
32
The Astrophysical Journal, 870:12 (33pp), 2019 January 1 Li et al.

Piro, A. L., & Nakar, E. 2013, ApJ, 769, 67Piro, A. L., & Nakar, E. 2014, ApJ, 784, 85Plewa, T., Calder, A. C., & Lamb, D. Q. 2004, ApJL, 612, L37Poole, T. S., Breeveld, A. A., Page, M. J., et al. 2008, MNRAS, 383, 627Rest, A., Scolnic, D., Foley, R. J., et al. 2014, ApJ, 795, 44Rest, A., Stubbs, C., Becker, A. C., et al. 2005, ApJ, 634, 1103Riess, A. G., Casertano, S., Yuan, W., et al. 2018, ApJ, 855, 136Riess, A. G., Filippenko, A. V., Challis, P., et al. 1998, AJ, 116, 1009Riess, A. G., Macri, L. M., Hoffmann, S. L., et al. 2016, ApJ, 826, 56Roming, P. W. A., Kennedy, T. E., Mason, K. O., et al. 2005, SSRv, 120, 95Sand, D. J., Graham, M. L., Botyánszki, J., et al. 2018, ApJ, 863, 24Scalzo, R., Aldering, G., Antilogus, P., et al. 2014a, MNRAS, 440, 1498Scalzo, R. A., Aldering, G., Antilogus, P., et al. 2010, ApJ, 713, 1073Scalzo, R. A., Ruiter, A. J., & Sim, S. A. 2014b, MNRAS, 445, 2535Schaefer, B. E., & Pagnotta, A. 2012, Natur, 481, 164Schlafly, E. F., & Finkbeiner, D. P. 2011, ApJ, 737, 103Scolnic, D., Casertano, S., Riess, A., et al. 2015, ApJ, 815, 117Seitenzahl, I. R., Kromer, M., Ohlmann, S. T., et al. 2016, A&A, 592, A57Shappee, B. J., Holoinen, T. W.-S., Drout, M. R., et al. 2018b, ApJ, 870, 13Shappee, B. J., Piro, A. L., Stanek, K. Z., et al. 2018a, ApJ, 855, 6Shappee, B. J., Prieto, J. L., Grupe, D., et al. 2014, ApJ, 788, 48Shappee, B. J., Stanek, K. Z., Pogge, R. W., & Garnavich, P. M. 2013, ApJL,
762, L5Silverman, J. M., & Filippenko, A. V. 2012, MNRAS, 425, 1917Silverman, J. M., Ganeshalingam, M., Cenko, S. B., et al. 2012, ApJL, 756, L7Silverman, J. M., Ganeshalingam, M., Li, W., et al. 2011, MNRAS, 410, 585Silverman, J. M., Nugent, P. E., Gal-Yam, A., et al. 2013, ApJS, 207, 3Silverman, J. M., Vinkó, J., Marion, G. H., et al. 2015, MNRAS, 451, 1973Smartt, S. J., Valenti, S., Fraser, M., et al. 2015, A&A, 579, A40Sollerman, J., Cox, N., Mattila, S., et al. 2005, A&A, 429, 559Stanishev, V., Goobar, A., Benetti, S., et al. 2007, A&A, 469, 645Sternberg, A., Gal-Yam, A., Simon, J. D., et al. 2011, Sci, 333, 856
Stritzinger, M., & Leibundgut, B. 2005, A&A, 431, 423Stritzinger, M. D., Shappee, B. J., Piro, A. L., et al. 2018, ApJL, 864, L35Taubenberger, S., Benetti, S., Childress, M., et al. 2011, MNRAS, 412, 2735Thomas, R. C., Aldering, G., Antilogus, P., et al. 2007, ApJL, 654, L53Thomas, R. C., Aldering, G., Antilogus, P., et al. 2011, ApJ, 743, 27Tody, D. 1986, Proc. SPIE, 627, 733Tody, D. 1993, adass II, 52, 173Toonen, S., Nelemans, G., & Portegies Zwart, S. 2012, A&A, 546, A70Valenti, S., Benetti, S., Cappellaro, E., et al. 2008, MNRAS, 383, 1485Villanueva, S., Jr., Gaudi, B. S., Pogge, R. W., et al. 2018, PASP, 130, 015001Vinko, J., Ordasi, A., Szalai, T., et al. 2018, PASP, 130, 064101Wang, X., Filippenko, A. V., Ganeshalingam, M., et al. 2009b, ApJL, 699,
L139Wang, X., Li, W., Filippenko, A. V., et al. 2008, ApJ, 675, 626Wang, X., Li, W., Filippenko, A. V., et al. 2009a, ApJ, 697, 380Wang, X., Wang, L., Filippenko, A. V., Zhang, T., & Zhao, X. 2013, Sci,
340, 170Waters, C. Z., Magnier, E. A., Price, P. A., et al. 2016, arXiv:1612.05245Webbink, R. F. 1984, ApJ, 277, 355Welty, D. E., Ritchey, A. M., Dahlstrom, J. A., & York, D. G. 2014, ApJ,
792, 106Wheeler, J. C., Johnson, V., & Clocchiatti, A. 2015, MNRAS, 450, 1295Whelan, J., & Iben, I., Jr. 1973, ApJ, 186, 1007Williams, G. G., Milne, P. A., Park, H. S., et al. 2008, in AIP Conf. Ser. 1000,
Gamma-Ray Bursts 2007 (Melville, NY: AIP), 535Yaron, O., & Gal-Yam, A. 2012, PASP, 124, 668Zhai, Q., Zhang, J.-J., Wang, X.-F., et al. 2016, AJ, 151, 125Zhang, J., Xin, Y., Li, W., et al. 2018, ATel, 11267Zhang, K., Wang, X., Zhang, J., et al. 2016, ApJ, 820, 67Zhao, X., Maeda, K., Wang, X., et al. 2016, ApJ, 826, 211Zhao, X., Wang, X., Maeda, K., et al. 2015, ApJS, 220, 20Zheng, W., Silverman, J. M., Filippenko, A. V., et al. 2013, ApJL, 778, L15
33
The Astrophysical Journal, 870:12 (33pp), 2019 January 1 Li et al.