
PhotoAffinity Bits: A Photoaffinity-Based Fragment ...
57
doi.org/10.26434/chemrxiv.12053445.v1 PhotoAffinity Bits: A Photoaffinity-Based Fragment Screening Platform for Efficient Identification of Protein Ligands emma grant, david fallon, michael hann, ken fantom, chad quinn, Francesca Zappacosta, Roland S. Annan, Chun-wa Chung, Paul Bamborough, david dixon, peter stacey, David House, Vipulkumar patel, Nicholas C. O. Tomkinson, jacob bush Submitted date: 31/03/2020 • Posted date: 01/04/2020 Licence: CC BY 4.0 Citation information: grant, emma; fallon, david; hann, michael; fantom, ken; quinn, chad; Zappacosta, Francesca; et al. (2020): PhotoAffinity Bits: A Photoaffinity-Based Fragment Screening Platform for Efficient Identification of Protein Ligands. ChemRxiv. Preprint. https://doi.org/10.26434/chemrxiv.12053445.v1 Advances in genomic analyses enable the identification of new proteins that are associated with disease. To validate these targets, tool molecules are required to demonstrate that a ligand can have a disease-modifying effect. Currently, as tools are reported for only a fraction of the proteome, platforms for ligand discovery are essential to leverage insights from genomic analyses. Fragment screening offers an efficient approach to explore chemical space, however, it remains challenging to develop techniques that are both sufficiently high-throughput and sensitive. We present a fragment screening platform, termed PhABits (PhotoAffinity Bits), which utilises a library of photoreactive fragments to covalently capture fragment-protein interactions. Hits can be profiled to determine potency and site of crosslinking, and subsequently developed as reporters in a competitive displacement assay to identify novel hit matter. We envision that the PhABits will be widely applicable to novel protein targets, identifying starting points in the development of therapeutics. File list (2) download file view on ChemRxiv PhABits_manuscript_ChemRxiv.pdf (1.64 MiB) download file view on ChemRxiv SI_ChemRxiv_PhABits.pdf (1.56 MiB)
Transcript of PhotoAffinity Bits: A Photoaffinity-Based Fragment ...

doi.org/10.26434/chemrxiv.12053445.v1
PhotoAffinity Bits: A Photoaffinity-Based Fragment Screening Platformfor Efficient Identification of Protein Ligandsemma grant, david fallon, michael hann, ken fantom, chad quinn, Francesca Zappacosta, Roland S. Annan,Chun-wa Chung, Paul Bamborough, david dixon, peter stacey, David House, Vipulkumar patel, Nicholas C. O.Tomkinson, jacob bush
Submitted date: 31/03/2020 • Posted date: 01/04/2020Licence: CC BY 4.0Citation information: grant, emma; fallon, david; hann, michael; fantom, ken; quinn, chad; Zappacosta,Francesca; et al. (2020): PhotoAffinity Bits: A Photoaffinity-Based Fragment Screening Platform for EfficientIdentification of Protein Ligands. ChemRxiv. Preprint. https://doi.org/10.26434/chemrxiv.12053445.v1
Advances in genomic analyses enable the identification of new proteins that are associated with disease. Tovalidate these targets, tool molecules are required to demonstrate that a ligand can have a disease-modifyingeffect. Currently, as tools are reported for only a fraction of the proteome, platforms for ligand discovery areessential to leverage insights from genomic analyses. Fragment screening offers an efficient approach toexplore chemical space, however, it remains challenging to develop techniques that are both sufficientlyhigh-throughput and sensitive. We present a fragment screening platform, termed PhABits (PhotoAffinityBits), which utilises a library of photoreactive fragments to covalently capture fragment-protein interactions.Hits can be profiled to determine potency and site of crosslinking, and subsequently developed as reporters ina competitive displacement assay to identify novel hit matter. We envision that the PhABits will be widelyapplicable to novel protein targets, identifying starting points in the development of therapeutics.
File list (2)
download fileview on ChemRxivPhABits_manuscript_ChemRxiv.pdf (1.64 MiB)
download fileview on ChemRxivSI_ChemRxiv_PhABits.pdf (1.56 MiB)

PhotoAffinity Bits: A photoaffinity-based fragment screening
platform for efficient identification of protein ligands
Emma. K. Grant1, 2, David J. Fallon1, 2, Michael M. Hann1, Ken G. M. Fantom1, Chad Quinn3, Francesca Zappacosta3, Roland S. Annan3, Chun-wa Chung1, Paul Bamborough1, David P. Dixon1, Peter Stacey1, David House1, Vipulkumar K. Patel1, Nicholas C. O. Tomkinson2, Jacob T. Bush1*
1. GlaxoSmithKline, Gunnels Wood Road, Stevenage, Hertfordshire, SG1 2NY, UK.
2. Pure and Applied Chemistry, University of Strathclyde, 295 Cathedral Street, Glasgow, G1 1XL, UK
3. GlaxoSmithKline, South Collegeville Road, Collegeville, PA 19426, U.S
Advances in genomic analyses enable the identification of new proteins that are associated with disease. To validate these targets, tool molecules are required to demonstrate that a ligand can have a disease-modifying effect. Currently, as tools are reported for only a fraction of the proteome, platforms for ligand discovery are essential to leverage insights from genomic analyses. Fragment screening offers an efficient approach to explore chemical space, however, it remains challenging to develop techniques that are both sufficiently high-throughput and sensitive. We present a fragment screening platform, termed PhABits (PhotoAffinity Bits), which utilises a library of photoreactive fragments to covalently capture fragment-protein interactions. Hits can be profiled to de-termine potency and site of crosslinking, and subsequently developed as reporters in a competitive displacement assay to identify novel hit matter. We envision that the PhABits will be widely applicable to novel protein targets, identifying starting points in the development of therapeutics.
INTRODUCTION
Advances in human genome sequencing technologies now enable genome-wide association studies (GWAS) across large populations, providing insights into the genetic origins of dis-ease.1 The combination of GWAS with functional genomic anal-yses (e.g. CRISPR-Cas9 screens), allows identification of path-ways and targets with therapeutic potential.2 Prior to the initi-ation of drug discovery efforts, validation of these targets is re-quired, often involving the use of chemogenomic tool mole-cules to build confidence that a ligand can cause a disease-modifying effect.3-4 For a large proportion of the proteome no tool molecules have been reported, therefore, platforms for rapid ligand discovery are required to enable translation of ge-nomic analyses into medicines.5
The scientific community has typically relied upon high-throughput screening (HTS) for the identification of tool mole-cules, which is often slow and resource intensive.6 Binding-driven assays, such as Affinity Selection Mass Spectrometry (ASMS) and DNA Encoded Libraries (DELs) have recently been developed to accelerate ligand discovery through the efficient screening of large libraries (106–1012 compounds).7-16 While these approaches are powerful, they employ lead-like libraries (MW>300) that generate hits that may suffer from sub-optimal ligand efficiency and can prove challenging to optimise. Addi-tionally, the upfront investment in library generation, and sam-ple handling, limits the accessibility of this screening strategy to the broader scientific community.6
Fragment-based lead discovery (FBLD) offers a complemen-tary approach. The use of low molecular weight fragments
enables effective coverage of chemical space with a smaller number of molecules, to identify weak but highly efficient in-teractions.17-19 Fragment hits can subsequently be optimised into more potent binders with drug-like properties, as has been demonstrated by the discovery of numerous clinical can-didates by FBLD (e.g. FDA approved therapeutics: vemuraf-enib,20 venetoclax,21 and erdafitinib22).23-25 The primary chal-lenge associated with fragment screening is the requirement for highly sensitive screening technologies to detect weak frag-ment-protein interactions.26 Historically, fragment screening has relied upon NMR monitoring techniques and surface plas-mon resonance (SPR), but these approaches are often resource intensive.27 Furthermore, methods for hit validation and bind-ing site identification (e.g. structural studies) are then required to enable the appropriate triaging and optimisation of frag-ment hits. Evolution of next generation fragment screening technologies would facilitate more rapid discovery of protein ligands.
The use of electrophilic fragment libraries has emerged within chemical biology as a powerful approach for the identi-fication of fragment-protein interactions.28-30 Electrophilic fragments covalently modify the protein, facilitating the use of intact protein liquid chromatography-mass spectrometry (LC-MS) for rapid and robust screening of libraries (~103 com-pounds) to identify binders.28 Covalent fragments that target cysteine residues have been identified and successfully opti-mised to cell-active tool compounds for proteins including e.g. HOIP and KRas.31-32 A limitation of these libraries is that a cys-teine residue must be present in the vicinity of the binding site, and therefore, only a subset of proteins can be targeted.33-34

Strategies that enable reaction with a wider range of amino acid residues would expand the number of ‘ligandable’ pockets that can be pursued, and broaden the applicability of the ap-proach.
Photoaffinity labelling has proved useful for the capture of reversible ligand-protein interactions.35-37 Upon irradiation with UV light, photoreactive warheads can covalently crosslink to proximal protein residues, providing a broad method for the covalent capture of reversible ligand-protein binding. Cra-vatt and co-workers recently reported the use of photoreac-tive fragments for the identification of fragment-protein inter-actions in live cells.38 This proof-of-concept study highlights an opportunity to screen libraries of fragments in cells to build a fragment-protein interaction database across the proteome. However, the current throughput and sensitivity of the MS-based proteomic readout, as well as the large dynamic range of the proteome, limits the broad adoption of this approach. We hypothesised that the use of photoreactive fragment li-braries in a biochemical setting would improve the throughput and enable targeted screening against proteins of interest. Such an approach would build upon electrophilic fragments, with the advantage of being applicable to all protein pockets.
Here we report a fragment screening platform, PhABits, where a library of photoreactive fragments are screened in the presence of purified protein. Hits can be detected by intact protein LC-MS enabling identification of known and new chemotypes. Follow-up studies allow determination of binding affinities and the sites of crosslinking. In order to develop frag-ments into more potent binders, hit PhABits can subsequently be employed as reporter ligands in a MS-based displacement assay. The PhABit platform enables efficient identification of fragment-protein interactions for binding sites that do not con-tain cysteine residues. Moreover, the approach enabled rapid detection of fragment hits for KRas4BG12D, which is widely con-sidered to be a poorly tractable target.39
RESULTS
Assembling a photoreactive fragment library
We anticipated that irradiation of a library of photoreactive fragments in the presence of purified protein, would enable photocapture of weak non-covalent fragment-protein binding, which could then be detected by intact mass spectrometry (Figure 1A). The photocapture event occurs as a two-step pro-cess: first, non-covalent fragment-protein binding, character-ised by a KD, and second, UV-induced photocrosslinking to cap-ture any reversible interactions, characterised by a crosslinking efficiency. Photoreactive intermediates (e.g. carbenes) rapidly crosslink or are quenched, and therefore photocrosslinking represents a snapshot of the status of the reversible binding equilibrium (Figure 1C). This contrasts with electrophilic librar-ies where the warhead has a longer lifetime and the extent of modification is time-dependent. A small alkyl diazirine photo-reactive group was selected as the crosslinking moiety to min-imise any perturbation to binding of the fragment warhead.40-
41 A diverse set of 650 amine containing fragments was se-lected from the GSK amine collection (aromatic ring count ≤2; H-bond donors/acceptors ≤4; heavy atoms ≤15; MW≤200),
using clustering on chemical fingerprints (Figure 1B). A high-throughput synthetic protocol was employed to couple the amine fragments to a carboxylic acid-functionalised diazirine (R1). Reaction mixtures were directly purified by strong cation exchange (SCX) cartridge, followed by deprotection and re-verse phase chromatography where required. This workflow enabled the rapid generation of a library of 556 PhABits (Figure 1B). Analysis of the library’s properties confirmed that the frag-ments covered a chemical space comparable to other commer-cially available libraries (Supplementary Figure 1).28
Photoreactive fragment screening
The PhABit library was screened against a diverse panel of six proteins: myoglobin, lysozyme, carbonic anhydrase, BRD4-BD1, BCL6 and KRas4BG12D. The library was incubated with re-combinant protein (1 µM, 4 °C, 15 min, 200 µM PhABit) before irradiation with UV light (302 nm, 10 min), and direct analysis by intact protein LC-MS (Figure 1C). The resulting mass spectra were analysed to identify PhABits that had covalently modified the protein, leading to an additional peak at a mass of [pro-tein+PhABit-N2]. A range of crosslinking yields (0–53%) were observed and hits were classed as strong (>5% crosslinking) or moderate (1.5–5% crosslinking). In general, the crosslinking yields for hits were low, which could have resulted from either low site occupancy or poor crosslinking due to orientation of the diazirine / quenching of the carbene. Consequently, cross-linking yield was not used as a measure of binding affinity and all hits were followed up. A small number of PhABits (~1%) showed multiple crosslinking events, suggesting that the PhABit was bound to a number of different sites on the pro-tein, or potentially formed a long-lived reactive species ena-bling multiple modifications to take place via diffusion-based crosslinking. This behaviour was indicative of non-selective binding and therefore not considered hits (Figure 1D).
Analysis of the screens generated variable hit rates across the proteins with lysozyme yielding the highest number of crosslinking PhABits (47%), in contrast to myoglobin with very few binders (<3%) (Figure 1E). A number of warheads previ-ously reported to bind to the proteins were identified as hits, including two dimethyl isoxazole fragments for BRD4-BD1 (see inhibitor iBET-15142), and a series of sulfonamides for carbonic anhydrase (see dorzolamide,43 methazolamide44 and acetazo-lamide45). These hits provided early validation that the PhABit screen could identify true fragment binders.
Promiscuity and non-specific crosslinking
A key concern in fragment screening is deconvolution of spe-cific versus non-specific interactions. In traditional fragment screening, the latter is usually associated with high lipophilicity or low solubility of the fragment. Electrophilic fragment screens can yield non-selective hits due to high reactivity of the electrophilic warhead, leading to labelling of surface-exposed cysteine residues.28 An analogous consideration for pho-toaffinity labelling is that the reactive intermediate formed upon irradiation should be appropriately short-lived to avoid diffusion-based crosslinking that is not driven by binding affin-ity. The majority of the PhABits did not crosslink to the proteins screened, indicating that the reactive intermediate was rapidly

quenched. However, ten PhABits were found to crosslink to all proteins screened and 58 crosslinked to at least four proteins. These could represent privileged scaffolds that are accommo-dated by many protein pockets, or be due to non-specific crosslinking either through lipophilic interactions with the pro-tein or formation of long-lived reactive species.
To further investigate the specificity of the 89 PhABits that crosslinked to BRD4-BD1, the screen was repeated in the pres-ence of the BET inhibitor JQ1, which binds within the acetyl ly-sine pocket.46 JQ1 (10 µM) was incubated with hit PhABits (200 µM) and BRD4-BD1 (1 µM) before irradiation and analysis by LC-MS (Figure 2A). For 68 PhABits, >50% displacement was ob-served, indicating that these fragments bind selectively to the
acetyl lysine binding pocket. Of the remaining 21 fragments that were not displaced, 19 crosslinked to at least three of the other tested proteins, suggesting non-specific crosslinking. Physicochemical analysis of these fragments did not highlight any properties that would typically cause non-specific binding, e.g. high lipophilicity or low solubility (Supplementary Figure 2). Therefore, it may be that these PhABits form a long-lived intermediate, leading to diffusion-induced crosslinking. In all subsequent screening analyses these PhABits were omitted.
Confirmation and characterisation of BRD4 PhABit hits
BRD4-BD1 was selected for in-depth analysis of the screen-ing results and follow-up studies on the hits. BRD4 is a member
Figure 1: Photoreactive fragment screening. A: General structure of the PhABit compounds, highlighting the three key functionalities. B: Selection of the amines for the PhABit library and subsequent one-step synthetic protocol, giving access to 556 PhABits. C: Schematic of workflow used to screen the PhABit platform against recombinant proteins of interest. Proteins (1 µM) are incubated (4 °C, 15 min) with PhABit (200 µM) before UV irradiation (302 nm, 10 min) and analysis by intact LC-MS. D: Examples of spectra obtained during analysis of the PhABit screen of BRD4-BD1, (*) indicates the expected mass of BRD4-BD1 and crosslinked PhABit. E: Heat map of the PhABit screen against recombinant proteins: myoglobin, lysozyme, carbonic anhydrase, KRas4BG12D, BRD4-BD1 and BCL6. Known binding motifs to both BRD4-BD1 and carbonic anhydrase that were identified in the screens are highlighted.

of the bromodomain and extra-terminal domain (BET) family of proteins,47 which are involved in epigenetic regulation and are potential therapeutic targets for the treatment of disease, including cancer and inflammation.48-49 The BRD4-BD1 PhABit screen afforded 68 hits (12%) that were displaced by JQ1, which gave strong (13), and moderate (55) crosslinking. Hits included the aforementioned dimethyl isoxazoles 3 and 4, other 5-membered heterocycles (e.g. 6 and 7), acetyl lysine mi-metics (1 and 9) and less typical structures (5 and 8), which could represent novel binding motifs for the acetyl lysine pocket (Figure 2B). Orthogonal confirmation of non-covalent binding to the acetyl lysine binding site was performed using a BRD4-BD1 TR-FRET competition assay. Six of the nine hits (2–4, 6 and 8–9) were found to inhibit bromodomain-substrate binding with weak to moderate affinity (pIC50 values 4.0–5.7, Figure 2C).
In order to identify hit fragments in the development of therapeutics, the contribution of the photoreactive warhead to binding affinity was investigated. A primary goal of the PhABit platform was to identify hits that can subsequently be developed without the photoaffinity label. A key considera-tion, therefore, was the contribution of the photoreactive war-head to the binding affinity. Analogues of hit PhABits were syn-thesised with acetyl- and butanoyl-amides in place of the pho-toreactive group to explore the impact this had on potency (10–19, Supplementary Figure 3). A decrease of less than 0.6 log units in the TR-FRET assay was observed upon truncating to the acetylamide analogues, and potency was typically recov-ered in the butanoylamide analogues (Figure 2C). The reten-tion of potency upon removal of the photoreactive moiety con-firmed binding was driven by reversible fragment-protein in-teractions.
The PhABit screen proved straightforward to implement, al-lowing expedient screening via LC-MS, to identify fragment-protein interactions. The PhABits were directly applied to a panel of proteins without the requirement for assay optimisa-tion, which is a distinct advantage over many other fragment screening strategies. Further, none of the proteins screened here contain an exposed cysteine, thus highlighting the ad-vantage of photoreactive fragments over cysteine-reactive ap-proaches, by now enabling the identification of binders for any ligandable protein pocket.
FOLLOW-UP STUDIES
Determination of potency of hit PhABits
We anticipated that a key feature of the PhABit platform would be the opportunity to perform follow-up studies to fur-ther characterise the hits and enable appropriate triaging. First, concentration-response studies were performed to measure PhABit binding affinity. Hit PhABits were incubated at a range of concentrations with BRD4-BD1 (1 µM) before irradi-ation and analysis by LC-MS. In all cases, a concentration-de-pendent reduction in the crosslinking yield was observed (Fig-ure 3A). The resulting curves could be fit to calculate pKD val-ues, and enabled deconvolution of the crosslinking event; the gradient of the curve is determined by the non-covalent KD of the fragment, while the plateau represents the maximum crosslinking efficiency of the PhABit (Figure 3B). Importantly, this maximum is independent of the potency of the fragment, and only measures crosslinking efficiency versus other carbene quenching processes. Thus, concentration-response studies enabled differentiation of weak binders with high crosslinking
Figure 2: Confirmation and characterisation of BRD4 PhABit hits. A: Intact MS spectra of single shot displacement of two PhABits showing without JQ1 (blue) and pre-incubation with JQ1 (10 µM) (red). B: Intact MS spectra and structures of hit PhABits for BRD4-BD1. C: TR-FRET data for selected PhABits and acetyl- and butanoyl-amide analogues.
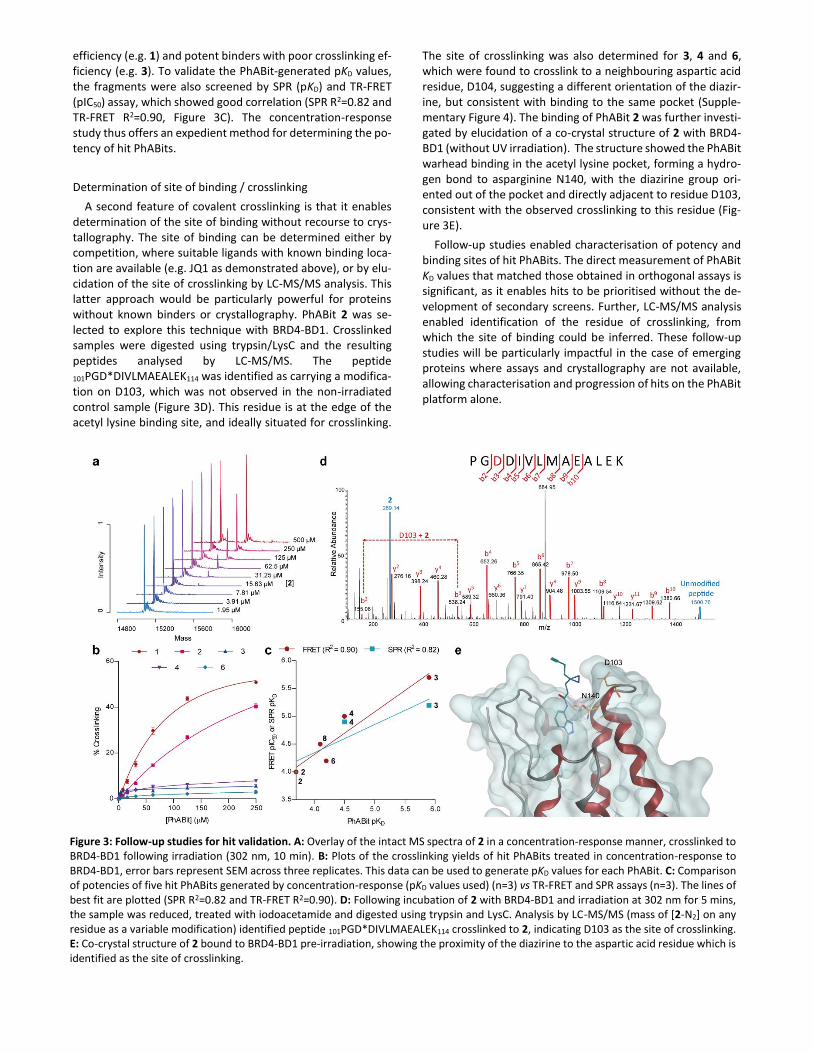
efficiency (e.g. 1) and potent binders with poor crosslinking ef-ficiency (e.g. 3). To validate the PhABit-generated pKD values, the fragments were also screened by SPR (pKD) and TR-FRET (pIC50) assay, which showed good correlation (SPR R2=0.82 and TR-FRET R2=0.90, Figure 3C). The concentration-response study thus offers an expedient method for determining the po-tency of hit PhABits.
Determination of site of binding / crosslinking
A second feature of covalent crosslinking is that it enables determination of the site of binding without recourse to crys-tallography. The site of binding can be determined either by competition, where suitable ligands with known binding loca-tion are available (e.g. JQ1 as demonstrated above), or by elu-cidation of the site of crosslinking by LC-MS/MS analysis. This latter approach would be particularly powerful for proteins without known binders or crystallography. PhABit 2 was se-lected to explore this technique with BRD4-BD1. Crosslinked samples were digested using trypsin/LysC and the resulting peptides analysed by LC-MS/MS. The peptide
101PGD*DIVLMAEALEK114 was identified as carrying a modifica-tion on D103, which was not observed in the non-irradiated control sample (Figure 3D). This residue is at the edge of the acetyl lysine binding site, and ideally situated for crosslinking.
The site of crosslinking was also determined for 3, 4 and 6, which were found to crosslink to a neighbouring aspartic acid residue, D104, suggesting a different orientation of the diazir-ine, but consistent with binding to the same pocket (Supple-mentary Figure 4). The binding of PhABit 2 was further investi-gated by elucidation of a co-crystal structure of 2 with BRD4-BD1 (without UV irradiation). The structure showed the PhABit warhead binding in the acetyl lysine pocket, forming a hydro-gen bond to asparginine N140, with the diazirine group ori-ented out of the pocket and directly adjacent to residue D103, consistent with the observed crosslinking to this residue (Fig-ure 3E).
Follow-up studies enabled characterisation of potency and binding sites of hit PhABits. The direct measurement of PhABit KD values that matched those obtained in orthogonal assays is significant, as it enables hits to be prioritised without the de-velopment of secondary screens. Further, LC-MS/MS analysis enabled identification of the residue of crosslinking, from which the site of binding could be inferred. These follow-up studies will be particularly impactful in the case of emerging proteins where assays and crystallography are not available, allowing characterisation and progression of hits on the PhABit platform alone.
Figure 3: Follow-up studies for hit validation. A: Overlay of the intact MS spectra of 2 in a concentration-response manner, crosslinked to BRD4-BD1 following irradiation (302 nm, 10 min). B: Plots of the crosslinking yields of hit PhABits treated in concentration-response to BRD4-BD1, error bars represent SEM across three replicates. This data can be used to generate pKD values for each PhABit. C: Comparison of potencies of five hit PhABits generated by concentration-response (pKD values used) (n=3) vs TR-FRET and SPR assays (n=3). The lines of best fit are plotted (SPR R2=0.82 and TR-FRET R2=0.90). D: Following incubation of 2 with BRD4-BD1 and irradiation at 302 nm for 5 mins, the sample was reduced, treated with iodoacetamide and digested using trypsin and LysC. Analysis by LC-MS/MS (mass of [2-N2] on any residue as a variable modification) identified peptide 101PGD*DIVLMAEALEK114 crosslinked to 2, indicating D103 as the site of crosslinking. E: Co-crystal structure of 2 bound to BRD4-BD1 pre-irradiation, showing the proximity of the diazirine to the aspartic acid residue which is identified as the site of crosslinking.

Development of a fragment-based PROTAC for BRD4
It was anticipated that the PhABit platform could be an ex-pedient approach to identify warheads for the development of bifunctional molecules, such as PROteolysis TArgeting Chime-ras (PROTACs). PROTACs have recently emerged as a therapeu-tic strategy, inducing protein degradation by hijacking compo-nents of the ubiquitin-proteasome system.50 Three PROTACs (P1-P3), derived from PhABits 3, 4 and 8, were synthesised containing a PEG linker conjugated to a VHL-ligase binder (Fig-ure 4A; for synthesis see Supplementary Figure 5).50 Degrada-tion of BRD4 was subsequently measured in HEK293 cells using a HiBiT assay protocol.51-52 The higher affinity PROTACs P1 (pIC50=5.5) and P2 (pIC50=5.9) induced degradation above 1 µM (Figure 4B), while PROTAC P3 (pIC50=4.7), did not degrade BRD4 up to 10 µM, suggesting insufficient fragment affinity. Analysis of the cellular ATP levels indicated that the PROTAC ligands did not inhibit cell growth. Additionally, pre-treatment of the cells with epoxomicin (proteasome inhibitor) reduced degradation of BRD4, supporting degradation via the pro-teasome (Supplementary Figure 6). The experiment thus high-lights that more potent PhABits could be directly employed for the development of PROTACs, to degrade proteins by recruit-ing components of the ubiquitin-proteasome system. Since the PhABit platform identifies binders and not necessarily inhibi-tors, coupling this screening methodology with the generation of PROTACs could be an attractive strategy to enable degrada-tion of proteins where inhibition proves challenging (e.g. pro-tein-protein interactions (PPIs) and transcription factors).
PHOTOAFFINITY SCREENING TECHNOLOGY
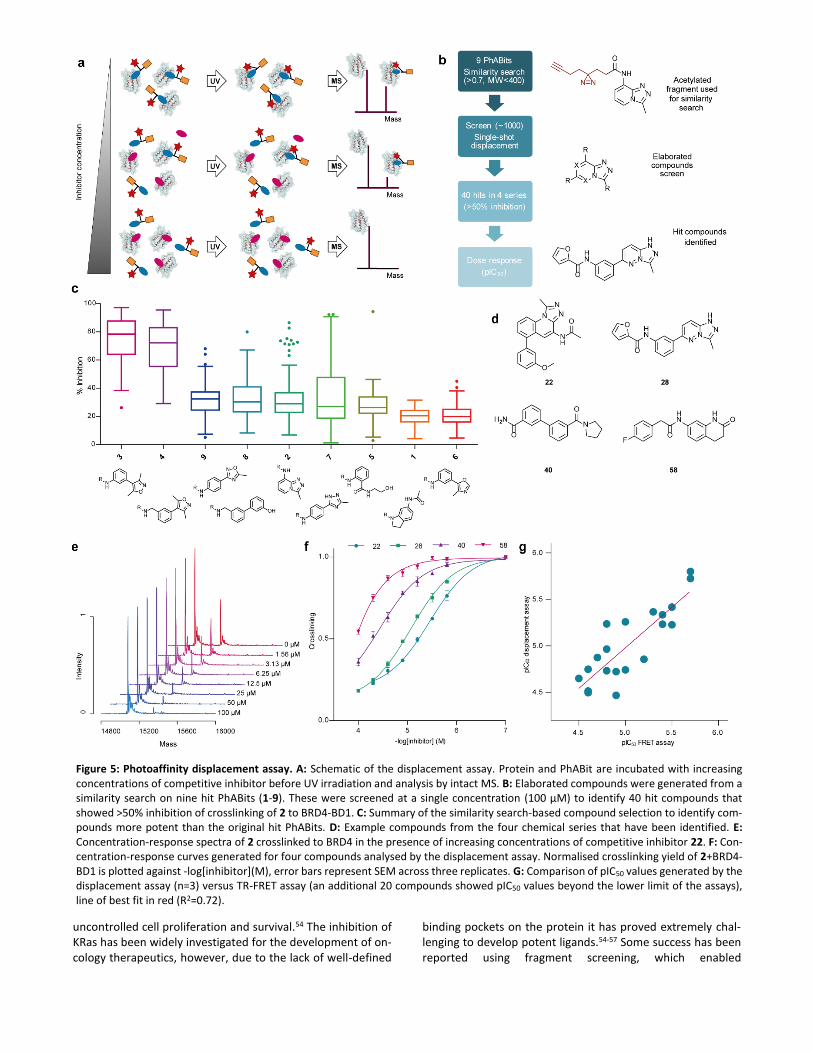
In the validation of protein targets of interest, rapid devel-opment of fragment hits towards more potent tool molecules is essential. It was anticipated that hits from the PhABit screen could be used as reporters for site-specific displacement as-says to enable immediate screening. Compounds that compete with the reporter PhABit would induce a concentration-de-pendent reduction in crosslinking, enabling calculation of pIC50 values (Figure 5A).53 A proof-of-concept study was performed using PhABit 2 to develop a binding assay for BRD4-BD1 (Figure 5B). A library of ~1000 compounds was selected based on a
similarity search (Tanimoto, >0.7, MW<400 Da) from the hit PhABits identified previously (1–9). The compounds were incu-bated with PhABit 2 and BRD4-BD1 before irradiation and anal-ysis by LC-MS to determine crosslinking yield. A range of cross-linking inhibition was observed from 1–100%, with >50% ob-served for 208 compounds (21% of the total screen) (Figure 5C). The majority of these hits were derived from dimethyli-soxazole PhABits 3 and 4, consistent with the presence of this motif in a number of BET targeting series in the GSK compound collection. The remaining 40 hit compounds (20–59) were de-rived from PhABits 2, 7, 8 and 9 and grouped into four chemical series (Figure 5D). Compounds 22 and 28 are structurally re-lated to the pan-bromodomain binder bromosporin and had previously been identified as binding to BRD4-BD1. Compound 58 mimics the acetylated native ligand and relates to other re-ported acetyl lysine mimetics, while compound 40 does not re-semble known BRD4 binders.
Determination of compound potency using the PhABit dis-placement assay could be achieved using concentration-re-sponse studies. However, advancement from single concentra-tion screening to concentration-response measurements (pIC50) was limited by the throughput of LC-MS analysis (7.7 min per sample). The protocol was therefore transferred to RapidFireTM MS, which uses a desalting cartridge rather than liquid chromatography, enabling analysis at a rate of just 12 seconds per sample. This acceleration in throughput signifi-cantly improved the scope of the screening approach.
The 40 selected compounds from the single concentration screen were followed-up in concentration-response mode (100–1.56 µM) with analysis by RapidFireTM MS. The crosslink-ing yield was found to decrease with increasing concentration of elaborated compounds, consistent with competitive dis-placement (Figure 5E). The data showed good reproducibility across three replicates and the pIC50 values generated were measured across a range of 4–6 (Figure 5F). Values were cor-rected using the Cheng-Prusoff equation to obtain pKi values, based on the pKD value of 2 measured previously (pKD=3.7, Fig-ure 3B/C). To validate the resulting binding affinities, the 40 compounds were also screened in the TR-FRET assay. The as-says showed good correlation (R2=0.72) confirming that the PhABit-based displacement screen was a reliable screening method (Figure 5G).
The direct employment of hit PhABits as reporters in a pho-toaffinity displacement assay is a key advantage of the plat-form, enabling the screening of elaborated compound librar-ies. The adoption of RapidFireTM-MS provided a crucial increase in the throughput of the assay enabling rapid progression to-ward more potent tool molecules, on a timescale and resource load that competes with traditional assay development.
APPLICATION TO OTHER TARGETS
To explore the range of applicability of the PhABit platform, we subsequently applied it to KRas, which has been widely re-ported as a protein with low tractability towards small mole-cule binders.39 KRas oncogenic driver mutations are found in 30% of cancers. The mutations result in constitutive activation of KRas and downstream signalling pathways which promote
Figure 4: Development of a fragment-based PROTAC for BRD4. A: Structures of the VHL-BRD4 PhABit-derived PROTACs P1-P3, and corresponding TR-FRET-derived pIC50 values. B: Degradation curves of P1-P3 as measured in the HiBiT assay. P1 and P2 show a maximum degradation of 28% and 16% respectively (n=2).
uncontrolled cell proliferation and survival.54 The inhibition of KRas has been widely investigated for the development of on-cology therapeutics, however, due to the lack of well-defined
binding pockets on the protein it has proved extremely chal-lenging to develop potent ligands.54-57 Some success has been reported using fragment screening, which enabled
Figure 5: Photoaffinity displacement assay. A: Schematic of the displacement assay. Protein and PhABit are incubated with increasing concentrations of competitive inhibitor before UV irradiation and analysis by intact MS. B: Elaborated compounds were generated from a similarity search on nine hit PhABits (1-9). These were screened at a single concentration (100 µM) to identify 40 hit compounds that showed >50% inhibition of crosslinking of 2 to BRD4-BD1. C: Summary of the similarity search-based compound selection to identify com-pounds more potent than the original hit PhABits. D: Example compounds from the four chemical series that have been identified. E: Concentration-response spectra of 2 crosslinked to BRD4 in the presence of increasing concentrations of competitive inhibitor 22. F: Con-centration-response curves generated for four compounds analysed by the displacement assay. Normalised crosslinking yield of 2+BRD4-BD1 is plotted against -log[inhibitor](M), error bars represent SEM across three replicates. G: Comparison of pIC50 values generated by the displacement assay (n=3) versus TR-FRET assay (an additional 20 compounds showed pIC50 values beyond the lower limit of the assays), line of best fit in red (R2=0.72).

identification of micromolar, and recently submicromolar, lig-ands to a shallow pocket between the switch I/II regions of KRas.57 KRas fragment screening has typically employed HSQC NMR with 15N-labelled protein, which is resource intensive. We explored whether the PhABit library could provide an alterna-tive approach to identify fragment binders and their binding sites.
KRas4BG12D was incubated with the PhABit library (1 µM, 4 °C, 15 min, 200 µM PhABit) before irradiation and analysis by LC-MS. The results were compared to the screening of BRD4-BD1 and BCL6, to identify 11 unique hits for KRas, of which four were of particular interest (60-63, Figure 6A/B). These hits ex-emplified two chemotypes: 2-heterocyclic pyridines (60 and 61) and an indole warhead (62 and 63). The indoles are similar to previously reported KRas binders identified by NMR studies, suggesting the screen has identified true hits.54 The 2-
heterocyclic pyridines do not resemble known ligands and therefore represent novel KRas binding motifs.
The binding site of indole hit 62 was explored by LC-MS/MS analysis of crosslinked KRas4BG12D. Three modified peptides were identified corresponding to crosslinking on three differ-ent residues on the same peptide (57DTAGQE*E*Y*SAMoxR68, Figure 6C). These residues, E62, E63 and Y64, lie at the loop of the switch I/II region, directly adjacent to the binding site of ligands reported previously (e.g. 64, PDB ID:4EPY, Figure 6D).54 This pocket is of functional significance in interacting with SOS1/2, the guanine nucleotide exchange factors (GEFs), which promote formation of the active KRas state.39 Thus, the PhABit platform enabled expedient identification of fragment binders to a protein of low tractability, and provided insight into the binding site of hit PhABits without the need for re-course to NMR and crystallography.
Figure 6: Application of the PhABit platform to KRas. A: Intact MS spectra of hit PhABits for KRas following irradiation with UV light. B: Structures of the four selected hit PhABits for KRasG12D. C: LC-MS/MS spectrum of the tryptic derived peptide 58DTAQE*E*Y*SAMR69 cross-linked to 62 indicating E63, E64 and Y65 as the sites of crosslinking. D: Co-crystal structure of compound 64 bound to KRasG12V, highlighting the amino acid residues which underwent crosslinking with 62. E: Compounds identified previously as binding to KRasG12D. F: Concentra-tion-response curves generated for 64 and 65 analysed by displacement assay. Normalised crosslinking yield of 62+KRasG12D is plotted against -log[inhibitor](M), error bars represent SEM across three replicates.

A challenge associated with KRas has been access to assays to enable efficient screening of compounds libraries. We ex-plored the use of the photoaffinity displacement assay to measure IC50 values of compounds of interest. A range of con-centrations of previously reported KRas binders 64 and 65 (Fig-ure 6E) were incubated with KRas4BG12D (1 µM) and hit PhABit 62 (1 mM) before irradiation. The crosslinking yields were de-termined by LC-MS to afford the expected concentration-de-pendent decrease in crosslinking (Figure 6F). The generated IC50 values of 170 µM (64) and 90 µM (65) were consistent with reported values (64 = 340 µM, and 65 = 190 µM), which were determined by HSQC NMR using 15N-labelled KRasG12D.54 This displacement assay therefore provides an efficient method for screening ligands against the switch I/II region binding site.
Identification of KRas fragment binders using the PhABit platform has demonstrated its utility as a screening approach for challenging protein targets. Rapid follow-up studies by LC-MS/MS enabled straightforward identification of the site of binding, which was consistent with previously reported crys-tallographic studies. Additionally, hits provided immediate ac-cess to an assay to profile published compounds, which could prove useful for further KRas inhibitor development studies.
CONCLUSIONS
We describe a fragment screening platform (PhABits) that uses a photoreactive group (diazirine) to capture fragment-protein binding. The approach is straightforward to implement and can be directly applied to purified proteins without the re-quirements of more traditional assay development. The PhABits, along with other covalent fragment approaches, offer rapid assessment of tractability and tool generation on time-scales suitable for application to the large numbers of targets emerging from functional genomics analyses. In this way, the platform complements other binding assay approaches, such as ASMS and DELs, which are not typically compatible with fragments.
In addition to identifying hits, the platform enables determi-nation of potency and site of binding, providing actionable in-formation before optimisation of secondary assays and crystal-lography. Furthermore, hit PhABits can immediately be used as reporters in displacement assays to screen libraries of com-pounds to identify more potent binders in a site-specific man-ner. These tools may also prove valuable in qualifying hits from complementary approaches, such as DELs and ASMS. We have also demonstrated their utility for rapid access to PROTAC lig-ands.
A limitation of the approach is that proteins must first be amenable to analysis by MS. Additionally, low crosslinking yields can inhibit the detection of hits. Advances in protein mass spectrometry and development of photoreactive groups with improved crosslinking yields will improve the applicability of the approach. We anticipate the accessibility of the PhABit workflow will enable efficient identification of fragment bind-ers to emerging biological targets. Furthermore, the informa-tive output of the various follow-up studies will facilitate the rapid development of tool molecules for disease biology and target validation studies.
ASSOCIATED CONTENT
Biochemical methods, synthetic methods and characterisation, crystallography and supplementary figures. This material is availa-ble free of charge via the Internet at http://pubs.acs.org.
AUTHOR INFORMATION
Corresponding Author
Notes The authors declare no competing financial interest.
ACKNOWLEDGMENT
We would like to thank the GlaxoSmithKline/University of Strath-clyde Collaborative PhD programme for funding this work. Addi-tionally, we would like to thank Heather Barnett, Natalie Wella-way, Daniel Tune, Pawel Slade and Alexander Vos for contributing to the synthesis of the PhABit library, Jiajun Ren for synthesis of PhABit analogues and Diana Klimaszewska for contribution to run-ning of the HiBiT and ATP assays. We thank the EPSRC for funding via Prosperity Partnership EP/S035990/1, the SCI for funding via a 2018 Scholarship (EKG) and the Scottish Funding Council for a Postgraduate and Early Career Researcher Exchanges (PECRE) grant (H17014) (DJF).
REFERENCES
1. Tam, V.; Patel, N.; Turcotte, M.; Bossé, Y.; Paré, G.; Meyre, D., Benefits and limitations of genomewide association studies. Nat. Rev. Genet. 2019, 20, 467-484. 2. Behan, F. M.; Iorio, F.; Picco, G.; Goncalves, E.; Beaver, C. M.; Migliardi, G.; Santos, R.; Rao, Y.; Sassi, F.; Pinnelli, M.; Ansari, R.; Harper, S.; Jackson, D. A.; McRae, R.; Pooley, R.; Wilkinson, P.; van der Meer, D.; Dow, D.; Buser-Doepner, C.; Bertotti, A.; Trusolino, L.; Stronach, E. A.; Saez-Rodriguez, J.; Yusa, K.; Garnett, M. J., Prioritization of cancer therapeutic targets using CRISPR-Cas9 screens. Nature 2019, 568 (7753), 511-516. 3. Drewes, G.; Knapp, S., Chemoproteomics and Chemical Probes for Target Discovery. Trends Biotechnol. 2018, 36 (12), 1275-1286. 4. Garbaccio, R. M.; Parmee, E. R., The impact of chemical probes in drug discovery: A pharmaceutical industry perspective. Cell Chem. Bio. 2016, 23, 10-17. 5. Antolin, A. A.; Tym, J. E.; Komianou, A.; Collins, I.; Workman, P.; Al-Lazikani, B., Objective, Quantitative, Data-Driven Assessment of Chemical Probes. Cell Chem. Bio. 2018, 25 (2), 194-205. 6. Favalli, N.; Bassi, G.; Scheuermann, J.; Neri, D., DNA-encoded chemical libraries - achievements and remaining challenges. FEBS Lett. 2018, 592 (12), 2168-2180. 7. Yuen, L. H.; Dana, S.; Liu, Y.; Bloom, S. I.; Thorsell, A. G.; Neri, D.; Donato, A. J.; Kireev, D.; Schuler, H.; Franzini, R. M., A Focused DNA-Encoded Chemical Library for the Discovery of Inhibitors of NAD(+)-Dependent Enzymes. J. Am. Chem. Soc. 2019, 141 (13), 5169-5181. 8. Dickson, P.; Kodadek, T., Chemical composition of DNA-encoded libraries, past present and future. Org. Biomol. Chem. 2019, 17 (19), 4676-4688. 9. Goodnow, R. A., Jr.; Dumelin, C. E.; Keefe, A. D., DNA-encoded chemistry: enabling the deeper sampling of chemical space. Nat. Rev. Drug Discov. 2017, 16 (2), 131-147.
10. Machutta, C. A.; Kollmann, C. S.; Lind, K. E.; Bai, X.; Chan, P. F.; Huang, J.; Ballell, L.; Belyanskaya, S.; Besra, G. S.; Barros-Aguirre, D.; Bates, R. H.; Centrella, P. A.; Chang, S. S.; Chai, J.; Choudhry, A. E.; Coffin, A.; Davie, C. P.; Deng, H.; Deng, J.; Ding, Y.; Dodson, J. W.; Fosbenner, D. T.; Gao, E. N.; Graham, T. L.; Graybill, T. L.; Ingraham, K.; Johnson, W. P.; King, B. W.; Kwiatkowski, C. R.; Lelievre, J.; Li, Y.; Liu, X.; Lu, Q.; Lehr, R.; Mendoza-Losana, A.; Martin, J.; McCloskey, L.; McCormick, P.; O'Keefe, H. P.; O'Keeffe, T.; Pao, C.; Phelps, C. B.; Qi, H.; Rafferty, K.; Scavello, G. S.; Steiginga, M. S.; Sundersingh, F. S.; Sweitzer, S. M.; Szewczuk, L. M.; Taylor, A.; Toh, M. F.; Wang, J.; Wang, M.; Wilkins, D. J.; Xia, B.; Yao, G.; Zhang, J.; Zhou, J.; Donahue, C. P.; Messer, J. A.; Holmes, D.; Arico-Muendel, C. C.; Pope, A. J.; Gross, J. W.; Evindar, G., Prioritizing multiple therapeutic targets in parallel using automated DNA-encoded library screening. Nat. Commun. 2017, 8, 16081. 11. Kutilek, V. D.; Andrews, C. L.; Richards, M. P.; Xu, Z.; Sun, T.; Chen, Y.; Hashke, A.; Smotrov, N.; Fernandez, R.; Nickbarg, E. B.; Chamberlin, C.; Sauvagnat, B.; Curran, P. J.; Boinay, R.; Saradjian, P.; Allen, S. J.; Byrne, N.; Elsen, N. L.; Ford, R. E.; Hall, D. L.; Kornienko, M.; Rickert, K. W.; Sharma, S.; Shipman, J. M.; Lumb, K. J.; Coleman, K.; Dandliker, P. J.; Kariv, I.; Beutel, B., Integration of Affinity Selection-Mass Spectrometry and Functional Cell-Based Assays to Rapidly Triage Druggable Target Space within the NF-kappaB Pathway. J. Biomol. Screen. 2016, 21 (6), 608-619. 12. Harris, P. A.; King, B. W.; Bandyopadhyay, D.; Berger, S. B.; Campobasso, N.; Capriotti, C. A.; Cox, J. A.; Dare, L.; Dong, X.; Finger, J. N.; Grady, L. C.; Hoffman, S. J.; Jeong, J. U.; Kang, J.; Kasparcova, V.; Lakdawala, A. S.; Lehr, R.; McNulty, D. E.; Nagilla, R.; Ouellette, M. T.; Pao, C. S.; Rendina, A. R.; Schaeffer, M. C.; Summerfield, J. D.; Swift, B. A.; Totoritis, R. D.; Ward, P.; Zhang, A.; Zhang, D.; Marquis, R. W.; Bertin, J.; Gough, P. J., DNA-Encoded Library Screening Identifies Benzo[b][1,4]oxazepin-4-ones as Highly Potent and Monoselective Receptor Interacting Protein 1 Kinase Inhibitors. J. Med. Chem. 2016, 59 (5), 2163-2178. 13. Deng, H.; Zhou, J.; Sundersingh, F. S.; Summerfield, J.; Somers, D.; Messer, J. A.; Satz, A. L.; Ancellin, N.; Arico-Muendel, C. C.; Sargent Bedard, K. L.; Beljean, A.; Belyanskaya, S. L.; Bingham, R.; Smith, S. E.; Boursier, E.; Carter, P.; Centrella, P. A.; Clark, M. A.; Chung, C. W.; Davie, C. P.; Delorey, J. L.; Ding, Y.; Franklin, G. J.; Grady, L. C.; Herry, K.; Hobbs, C.; Kollmann, C. S.; Morgan, B. A.; Pothier Kaushansky, L. J.; Zhou, Q., Discovery, SAR, and X-ray Binding Mode Study of BCATm Inhibitors from a Novel DNA-Encoded Library. ACS Med. Chem. Lett. 2015, 6 (8), 919-924. 14. Arico-Muendel, C.; Zhu, Z.; Dickson, H.; Parks, D.; Keicher, J.; Deng, J.; Aquilani, L.; Coppo, F.; Graybill, T.; Lind, K.; Peat, A.; Thomson, M., Encoded library technology screening of hepatitis C virus NS4B yields a small-molecule compound series with in vitro replicon activity. Antimicrob. Agents Chemother. 2015, 59 (6), 3450-3459. 15. Litovchick, A.; Dumelin, C.; Habeshian, S.; Gikunju, D.; Guié, M. A.; Centrella, P.; Zhang, Y.; Sigel, E. A.; Cuozzo, J. W.; Keefe, A. D.; Clark, M. A., Encoded Library Synthesis Using Chemical Ligation and the Discovery of sEH Inhibitors from a 334-Million Member Library. Sci. Rep. 2015, 5, 10916. 16. O'Connell, T. N.; Ramsay, J.; Rieth, S. F.; Shapiro, M. J.; Stroh, J. G., Solution-based indirect affinity selection mass spectrometry--a general tool for high-throughput screening of pharmaceutical compound libraries. Anal. Chem. 2014, 86 (15), 7413-7420. 17. Congreve, M.; Carr, R.; Murray, C.; Jhoti, H., A ‘Rule of Three’ for fragment-based lead discovery? Drug Discovery Today 2003, 8 (19), 876-877.
18. Reymond, J. L., The chemical space project. Acc. Chem. Res. 2015, 48 (3), 722-730. 19. Schuffenhauer, A.; Ruedisser, S.; Marzinzik, A.; Jahnke, W.; Selzer, P.; Jacoby, E., Library Design for Fragment Based Screening. Curr. Top. Med. Chem. 2005, 5 (8), 751-762. 20. Fisher, R.; Larkin, J., Vemurafenib: a new treatment for BRAF-V600 mutated advanced melanoma. Cancer Manag. Res. 2012, 4, 243-252. 21. Yap, J. L.; Chen, L.; Lanning, M. E.; Fletcher, S., Expanding the Cancer Arsenal with Targeted Therapies: Disarmament of the Antiapoptotic Bcl-2 Proteins by Small Molecules. J. Med. Chem. 2017, 60 (3), 821-838. 22. Markham, A., Erdafitinib: First Global Approval. Drugs 2019, 79 (9), 1017-1021. 23. Mortenson, P. N.; Erlanson, D. A.; de Esch, I. J. P.; Jahnke, W.; Johnson, C. N., Fragment-to-Lead Medicinal Chemistry Publications in 2017. J. Med. Chem. 2019, 62, 3857-3872. 24. Johnson, C. N.; Erlanson, D. A.; Jahnke, W.; Mortenson, P. N.; Rees, D. C., Fragment-to-Lead Medicinal Chemistry Publications in 2016. J. Med. Chem. 2017, 61 (5), 1774-1784. 25. Johnson, C. N.; Erlanson, D. A.; Murray, C. W.; Rees, D. C., Fragment-to-Lead Medicinal Chemistry Publications in 2015. J. Med. Chem. 2016, 60 (1), 89-99. 26. Schiebel, J.; Radeva, N.; Krimmer, S. G.; Wang, X.; Stieler, M.; Ehrmann, F. R.; Fu, K.; Metz, A.; Huschmann, F. U.; Weiss, M. S.; Mueller, U.; Heine, A.; Klebe, G., Six Biophysical Screening Methods Miss a Large Proportion of Crystallographically Discovered Fragment Hits: A Case Study. ACS Chem. Biol. 2016, 11 (6), 1693-1701. 27. Chen, I.-J.; Hubbard, R. E., Lessons for fragment library design: analysis of output from multiple screening campaigns. J. Comput. Aided Mol. Des. 2009, 23 (603-620). 28. Resnick, E.; Bradley, A.; Gan, J.; Douangamath, A.; Krojer, T.; Sethi, R.; Geurink, P. P.; Aimon, A.; Amitai, G.; Bellini, D.; Bennett, J.; Fairhead, M.; Fedorov, O.; Gabizon, R.; Gan, J.; Guo, J.; Plotnikov, A.; Reznik, N.; Ruda, G. F.; Diaz-Saez, L.; Straub, V. M.; Szommer, T.; Velupillai, S.; Zaidman, D.; Zhang, Y.; Coker, A. R.; Dowson, C. G.; Barr, H.; Wang, C.; Huber, K. V. M.; Brennan, P. E.; Ovaa, H.; von Delft, F.; London, N., Rapid covalent-probe discovery by electrophile-fragment screening. J. Am. Chem. Soc. 2019, (141), 8951-8968. 29. Craven, G. B.; Affron, D. P.; Allen, C. E.; Matthies, S.; Greener, J. G.; Morgan, R. M. L.; Tate, E. W.; Armstrong, A.; Mann, D. J., High-Throughput Kinetic Analysis for Target-Directed Covalent Ligand Discovery. Angew. Chem. Int. Ed. Engl. 2018, 57 (19), 5257-5261. 30. Bush, J. T.; Lesniak, R. K.; Yeh, T. L.; Belle, R.; Kramer, H.; Tumber, A.; Chowdhury, R.; Flashman, E.; Mecinovic, J.; Schofield, C. J., Small-molecules that covalently react with a human prolyl hydroxylase - towards activity modulation and substrate capture. Chem. Commun. (Camb) 2019, 55 (8), 1020-1023. 31. Shin, Y.; Jeong, J. W.; Wurz, R. P.; Achanta, P.; Arvedson, T.; Bartberger, M. D.; Campuzano, I. D. G.; Fucini, R.; Hansen, S. K.; Ingersoll, J.; Iwig, J. S.; Lipford, J. R.; Ma, V.; Kopecky, D. J.; McCarter, J.; San Miguel, T.; Mohr, C.; Sabet, S.; Saiki, A. Y.; Sawayama, A.; Sethofer, S.; Tegley, C. M.; Volak, L. P.; Yang, K.; Lanman, B. A.; Erlanson, D. A.; Cee, V. J., Discovery of N-(1-Acryloylazetidin-3-yl)-2-(1H-indol-1-yl)acetamides as Covalent Inhibitors of KRAS(G12C). ACS Med. Chem. Lett. 2019, 10 (9), 1302-1308. 32. Johansson, H.; Isabella Tsai, Y. C.; Fantom, K.; Chung, C. W.; Kumper, S.; Martino, L.; Thomas, D. A.; Eberl, H. C.; Muelbaier, M.; House, D.; Rittinger, K., Fragment-Based Covalent Ligand

Screening Enables Rapid Discovery of Inhibitors for the RBR E3 Ubiquitin Ligase HOIP. J. Am. Chem. Soc. 2019, 141 (6), 2703-2712. 33. Tuley, A.; Fast, W., The Taxonomy of Covalent Inhibitors. Biochemistry 2018, 57 (24), 3326-3337. 34. Chen, K.; Kurgan, L., Investigation of Atomic Level Patterns in Protein—Small Ligand Interactions. PLoS ONE 2009, 4 (2), e4473. 35. Bush, J. T.; Walport, L. J.; McGouran, J. F.; Leung, I. K. H.; Berridge, G.; van Berkel, S. S.; Basak, A.; Kessler, B. M.; Schofield, C. J., The Ugi four-component reaction enables expedient synthesis and comparison of photoaffinity probes. Chem. Sci. 2013, 4, 4115-4120. 36. Sherratt, A. R.; Nasheri, N.; McKay, C. S.; O’Hara, S.; Hunt, A.; Ning, Z.; Figeys, D.; Goto, N. K.; Pezacki, J. P., A New Chemical Probe for Phosphatidylinositol Kinase Activity. ChemBioChem 2014, 15, 1253-1256. 37. Desrochers, G. F.; Cornacchia, C.; McKay, C. S.; Pezacki, J. P., Activity-Based Phosphatidylinositol Kinase Probes Detect Changes to Protein-Protein Interactions During Hepatitis C Virus Replication. ACS Infect. Dis. 2018, 4 (5), 752-757. 38. Parker, C. G.; Galmozzi, A.; Wang, Y.; Correia, B. E.; Sasaki, K.; Joslyn, C. M.; Kim, A. S.; Cavallaro, C. L.; Lawrence, R. M.; Johnson, S. R.; Narvaiza, I.; Saez, E.; Cravatt, B. F., Ligand and Target Discovery by Fragment-Based Screening in Human Cells. Cell 2017, 168, 527-541. 39. Kessler, D.; Gmachl, M.; Mantoulidis, A.; Martin, L. J.; Zoephel, A.; Mayer, M.; Gollner, A.; Covini, D.; Fischer, S.; Gerstberger, T.; Gmaschitz, T.; Goodwin, C.; Greb, P.; Häring, D.; Hela, W.; Hoffmann, J.; Karolyi-Oezguer, J.; Knesl, P.; Kornigg, S.; Koegl, M.; Kousek, R.; Lamarre, L.; Moser, F.; Munico-Martinez, S.; Peinsipp, C.; Phan, J.; Rinnenthal, J.; Sai, J.; Salamon, C.; Scherbantin, Y.; Schipany, K.; Schnitzer, R.; Schrenk, A.; Sharps, B.; Siszler, G.; Sun, Q.; Waterson, A.; Wolkerstorfer, B.; Zeeb, M.; Pearson, M.; Fesik, S. W.; McConnell, D. B., Drugging an undruggable pocket on KRAS. PNAS 2019, 116, 15823-15829. 40. Ziemianowicz, D. S.; Bomgarden, R.; Etienne, C.; Schriemer, D. C., Amino Acid Insertion Frequencies Arising from Photoproducts Generated Using Aliphatic Diazirines. J. Am. Soc. Mass Spectrom. 2017, 28 (10), 2011-2021. 41. Lumb, J. G.; Halloran, M. W., Recent Applications of Diazirines in Chemical Proteomics. Chem. Eur. J. 2019, 25, 4885-4898. 42. Mirguet, O.; Lamotte, Y.; Donche, F.; Toum, J.; Gellibert, F.; Bouillot, A.; Gosmini, R.; Nguyen, V. L.; Delannee, D.; Seal, J.; Blandel, F.; Boullay, A. B.; Boursier, E.; Martin, S.; Brusq, J. M.; Krysa, G.; Riou, A.; Tellier, R.; Costaz, A.; Huet, P.; Dudit, Y.; Trottet, L.; Kirilovsky, J.; Nicodeme, E., From ApoA1 upregulation to BET family bromodomain inhibition: discovery of I-BET151. Bioorg. Med. Chem. Lett. 2012, 22 (8), 2963-2967. 43. Balfour, J. A.; Wilde, M. I., Dorzolamide: A Review of its Pharmacology and Therapeutic Potential in the Management of Glaucoma and Ocular Hypertension. Drugs and Aging 1997, 10, 384-403. 44. Ilies, M. A.; Masereel, B.; Rolin, S.; Scozzafava, A.; Campeanu, G.; Cimpeanu, V.; T.Supuran, C., Carbonic Anhydrase inhibitors: aromatic and heterocyclic sulfonamides incorporating adamantyl moieties with strong anticonvulsant activity. Bioorg. Med. Chem. 2004, 12, 2717-2726. 45. Kassamali, R.; Sica, D. A., Acetazolamide: a forgotten diuretic agent. Cardiol. Rev. 2011, 19 (6), 276-278. 46. Filippakopoulos, P.; Qi, J.; Picaud, S.; Shen, Y.; Smith, W. B.; Fedorov, O.; Morse, E. M.; Keates, T.; Hickman, T. T.; Felletar,
I.; Philpott, M.; Munro, S.; McKeown, M. R.; Wang, Y.; Christie, A. L.; West, N.; Cameron, M. J.; Schwartz, B.; Heightman, T. D.; Thangue, N. L.; French, C. A.; Wiest, O.; Kung, A. L.; Knapp, S.; Bradner, J. E., Selective inhibition of BET bromodomains. Nature 2010, 468, 1067-1073. 47. Law, R. P.; Atkinson, S. J.; Bamborough, P.; Chung, C. W.; Demont, E. H.; Gordon, L. J.; Lindon, M.; Prinjha, R. K.; Watson, A. J. B.; Hirst, D. J., Discovery of Tetrahydroquinoxalines as Bromodomain and Extra-Terminal Domain (BET) Inhibitors with Selectivity for the Second Bromodomain. J. Med. Chem. 2018, 61 (10), 4317-4334. 48. Liu, Z.; Wang, P.; Chen, H.; Wold, E. A.; Tian, B.; Brasier, A. R.; Zhou, J., Drug Discovery Targeting Bromodomain-Containing Protein 4. J. Med. Chem. 2017, 60 (11), 4533-4558. 49. Filippakopoulos, P.; Qi, J.; Picaud, S.; Shen, Y.; Smith, W. B.; Fedorov, O.; Morse, E. M.; Keates, T.; Hickman, T. T.; Felletar, I.; Philpott, M.; Munro, S.; McKeown, M. R.; Wang, Y.; Christie, A. L.; West, N.; Cameron, M. J.; Schwartz, B.; Heightman, T. D.; La Thangue, N.; French, C. A.; Wiest, O.; Kung, A. L.; Knapp, S.; Bradner, J. E., Selective inhibition of BET bromodomains. Nature 2010, 468 (7327), 1067-73. 50. Zengerle, M.; Chan, K. H.; Ciulli, A., Selective Small Molecule Induced Degradation of the BET Bromodomain Protein BRD4. ACS Chem. Biol. 2015, 10 (8), 1770-1777. 51. Promega, Nano-Glo® HiBiT Lytic Detection System. Technical Manual, N3030. 52. Promega, CellTiter-Glo® Luminescent Cell Viability Assay. Technical Manual, G7570. 53. Grant, E. K.; Fallon, D. J.; Eberl, H. C.; G.M.Fantom, K.; Zappacosta, F.; Messenger, C.; Tomkinson, N. C. O.; Bush, J. T., A Photoaffinity Displacement Assay and Probes to Study the Cyclin‐Dependent Kinase Family. Angew. Chem. Int. Ed. Engl. 2019, 58, 17322-17327. 54. Sun, Q.; Burke, J. P.; Phan, J.; Burns, M. C.; Olejniczak, E. T.; Waterson, A. G.; Lee, T.; Rossanese, O. W.; Fesik, S. W., Discovery of small molecules that bind to K-Ras and inhibit Sos-mediated activation. Angew. Chem. Int. Ed. Engl. 2012, 51 (25), 6140-6143. 55. Cruz-Migoni, A.; Canning, P.; Quevedo, C. E.; Bataille, C. J. R.; Bery, N.; Miller, A.; Russell, A. J.; Phillips, S. E. V.; Carr, S. B.; Rabbitts, T. H., Structure-based development of new RAS-effector inhibitors from a combination of active and inactive RAS-binding compounds. PNAS 2019, 116, 2545-2550. 56. Quevedo, C. E.; Cruz-Migoni, A.; Bery, N.; Miller, A.; Tanaka, T.; Petch, D.; Bataille, C. J. R.; Lee, L. Y. W.; Fallon, P. S.; Tulmin, H.; Ehebauer, M. T.; Fernandez-Fuentes, N.; Russell, A. J.; Carr, S. B.; Phillips, S. E. V.; Rabbitts, T. H., Small molecule inhibitors of RAS-effector protein interactions derived using an intracellular antibody fragment. Nat. Commun. 2018, 9 (1), 3169-3180. 57. Maurer, T.; Garrenton, L. S.; Oh, A.; Pitts, K.; Anderson, D. J.; Skelton, N. J.; Fauber, B. P.; Pan, B.; Malek, S.; Stokoe, D.; Ludlam, M. J.; Bowman, K. K.; Wu, J.; Giannetti, A. M.; Starovasnik, M. A.; Mellman, I.; Jackson, P. K.; Rudolph, J.; Wang, W.; Fang, G., Small-molecule ligands bind to a distinct pocket in Ras and inhibit SOS-mediated nucleotide exchange activity. PNAS 2012, 109 (14), 5299-5304.

12

download fileview on ChemRxivPhABits_manuscript_ChemRxiv.pdf (1.64 MiB)

PhotoAffinity Bits: A photoaffinity-based fragment screening platform for efficient identification of protein
ligands
Emma. K. Grant, David J. Fallon, Michael M. Hann, Ken G. M. Fantom, Chad Quinn, Francesca Zappacosta, Roland S. Annan, Chun-wa Chung, Paul Bamborough, David P. Dixon, Peter
Stacey, David House, Vipulkumar K. Patel, Nicholas C. O. Tomkinson, Jacob T. Bush*
1
Contents 1. Supplemental figures ..................................................................................................................................... 3
2. General Experimental .................................................................................................................................... 7
2.1 Irradiation ..................................................................................................................................................... 7
2.2 Nuclear magnetic resonance (NMR) spectroscopy ...................................................................................... 7
2.3 Liquid chromatography-mass spectrometry (LC-MS) for small molecules .................................................. 7
2.3.1 LC-MS with an acidic modifier (Method A) ........................................................................................... 7
2.3.2 LC-MS with a basic modifier (Method B – [CSH~2min_HPH]) .............................................................. 7
2.4 Mass directed automated preparative HPLC (MDAP) .................................................................................. 8
2.5 Characterisation assays ................................................................................................................................ 8
2.5.1 Time-resolved fluorescence resonance energy transfer (TR-FRET) assay ............................................ 9
2.5.2 Surface Plasmon Resonance (SPR) assay .............................................................................................. 9
2.5.3 ChromLogD7.4 ...................................................................................................................................... 9
2.5.4 Solubility ............................................................................................................................................... 9
2.6 Intact Protein LC-MS .................................................................................................................................. 10
2.7 Intact Protein RapidFire MS ....................................................................................................................... 11
3. Selection of amine functionalised fragments .............................................................................................. 12
4. Synthesis of the PhABit library ..................................................................................................................... 13
4.1 Synthetic Schemes ..................................................................................................................................... 13
4.2 Synthesis..................................................................................................................................................... 13
4.2.1 General Procedure A: 0.100 mmol scale parallel synthesis by amide coupling .................................. 13
4.2.2 Reverse phase purification protocol ................................................................................................... 13
4.2.3 Tert-butyloxycarbonyl (BOC)-deprotection protocol .......................................................................... 14
4.3 Hit PhABits from screens against BRD4-BD1 and KRasG12D ........................................................................ 14
4.3.1 BRD4-BD1 Hits ..................................................................................................................................... 14
4.3.2 KRas Hits ............................................................................................................................................. 17
5. PhABit platform screening protocol ............................................................................................................ 19
6. Follow-up studies ......................................................................................................................................... 20
6.1 Concentration response studies for hit PhABits with BRD4-BD1 ............................................................... 20
6.2 PhABit analogues ........................................................................................................................................ 22
6.2.1 Synthetic Scheme ................................................................................................................................ 22
6.2.2 General procedure B: 0.100 mmol scale parallel synthesis by amide coupling .................................. 22
6.2.3 Acetyl analogues ................................................................................................................................. 23
6.2.4 Butanoyl analogues ............................................................................................................................. 24
6.2.5 TR-FRET assay data for PhABit analogues ........................................................................................... 25
6.3 Displacement of hit PhABits for BRD4-BD1 with (+)-JQ1 ........................................................................... 25
6.4 Liquid chromatography with tandem mass spectrometry (LC-MS/MS) studies to identify the site of crosslinking of hit PhABits ................................................................................................................................ 26
6.5 Crystallographic data of PhABit 2 bound to BRD4-BD1 .............................................................................. 27
6.6 Development of a fragment PROTAC for BRD4 .......................................................................................... 28
2
6.6.1 Synthetic schemes .............................................................................................................................. 28
6.6.2 Synthesis of PROTACs ......................................................................................................................... 29
6.6.3 TR-FRET assay data for PROTACs ........................................................................................................ 31
6.6.4 HiBiT assay protocol ............................................................................................................................ 31
7. PhotoAffinity Screening Technology ............................................................................................................ 33
7.1 Selection of elaborated compounds .......................................................................................................... 33
7.2 General Experimental for single-shot screening ........................................................................................ 33
7.3 Photoaffinity assay against BRD4-BD1 ....................................................................................................... 33
7.3.1 Data tables of crosslinking yields from the photoaffinity displacement assay ................................... 34
7.4 Displacement assay against KRas ........................................................................................................ 38
7.4.1 Synthesis of competitor compounds 64 and 65 ................................................................................. 38
7.4.2 General procedure .............................................................................................................................. 39
7.4.3 Data tables of crosslinking yields of PhABit 62 in the photoaffinity displacement assay ................... 40
8. References ................................................................................................................................................... 41

3
1. Supplemental figures
SI Figure 1: Binned properties of the acetyl-capped fragment set. A: Diversity distribution, showing the Extended
Connectivity Fingerprints (ECFP4) Tanimoto similarity score between each compound and its most similar
neighbour. This 2D metric disregards stereochemistry. B-H: Molecular weight, hydrogen bond donors/acceptors,
aromatic ring, sp3 atom ratio, chiral centre, and rotatable bond counts.
4
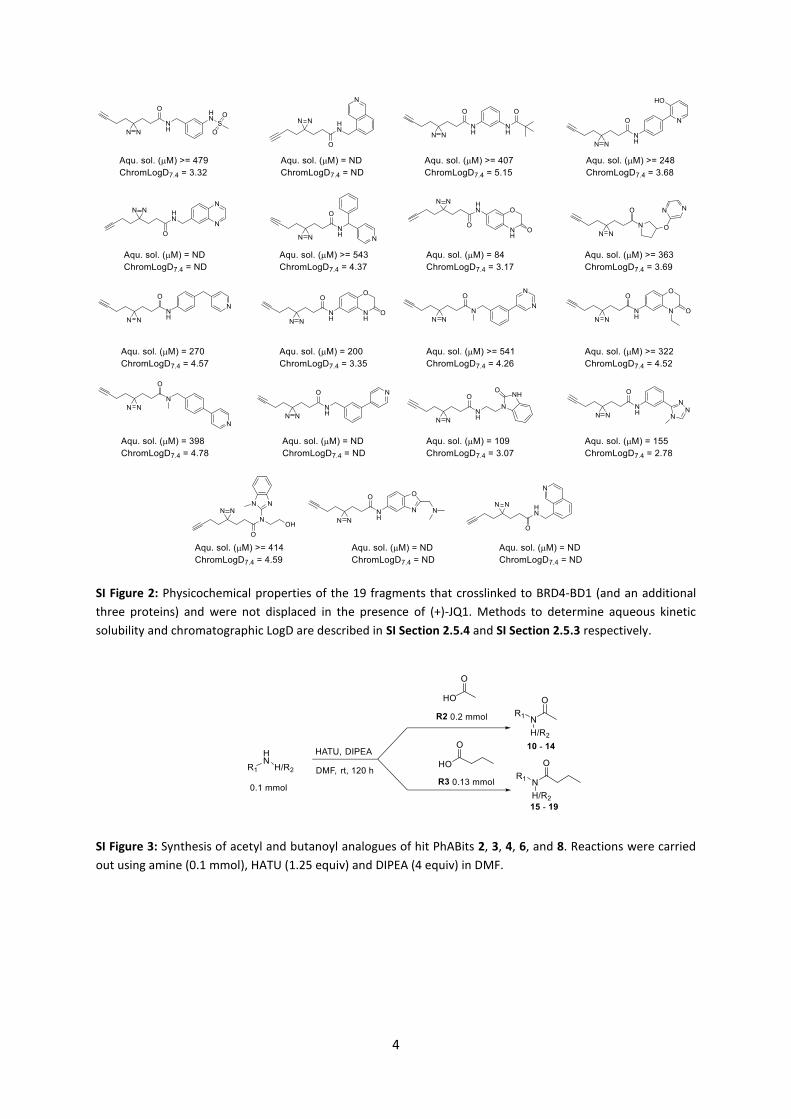
SI Figure 2: Physicochemical properties of the 19 fragments that crosslinked to BRD4-BD1 (and an additional
three proteins) and were not displaced in the presence of (+)-JQ1. Methods to determine aqueous kinetic
solubility and chromatographic LogD are described in SI Section 2.5.4 and SI Section 2.5.3 respectively.
SI Figure 3: Synthesis of acetyl and butanoyl analogues of hit PhABits 2, 3, 4, 6, and 8. Reactions were carried
out using amine (0.1 mmol), HATU (1.25 equiv) and DIPEA (4 equiv) in DMF.

5
SI Figure 4: LC-MS/MS spectra of the trypsin/lysC derived peptides 101PGDD*IVLMAEALEK114 crosslinked to 3, 4,
and 6 indicating D104 as the site of crosslinking.

6
SI Figure 5: Synthesis of PROTACs P1-P3.
SI Figure 6: A: Cytotoxicity data for P1-P3 as measured in the HiBit assay (methods detailed in SI Section 6.6.4),
n=2 (including technical replicates). B: Degradation of BRD4 following pre-treatment with epoxomicin
(proteasome inhibitor), n=2 (including technical replicates).

7
2. General Experimental Solvents were anhydrous and reagents purchased from commercial suppliers were used as received.
2.1 Irradiation Irradiation was carried out using an Analytik Jena CL-1000 Ultraviolet Crosslinker (8 Watt, P/N 95-0230-02 with
UV-B bulbs, P/N 34-0042-01) at 302 nm in Greiner 384 white low volume plates (#784076) or Greiner 384 PP F-
bottom plates (#781201). Following irradiation plates were sealed with C.A.S plates seals (#12812447) prior to
analysis.
2.2 Nuclear magnetic resonance (NMR) spectroscopy
Nuclear Magnetic Resonance spectra were recorded at ambient temperature using standard pulse methods on
a Bruker AVII-600 (1H = 400 and 600 MHz) in d6-DMSO or CDCl3 and referenced to residual undeuterated solvent.
2.3 Liquid chromatography-mass spectrometry (LC-MS) for small molecules Liquid chromatography-mass spectrometry was carried out on an Acquity UPLC CSH C-18 column (internal
diameter: 50 mm × 2.1 mm, packing diameter: 1.7 µm) at 40 °C with a 0.5 µL injection volume. The UV detection
was a summed signal from wavelengths between 210 nm and 350 nm. Mass detection was performed with
Alternate-scan Positive and Negative Electrospray on a Waters ZQ instrument, with a scan range of 100–1000
Da or 100–1200 Da (high mass range method). Scan time was 0.27 s with an inter-scan delay of 0.10 s.
2.3.1 LC-MS with an acidic modifier (Method A)
Sample was eluted using a gradient shown in SI Table 1 with a flow rate of 1.0 mL/min.
- Solvent A (0.1% v/v solution of formic acid in water) and solvent B (0.1% v/v solution of formic acid in
acetonitrile).
SI Table 1: Low pH gradient for LC-MS analysis
Time (min) Solvent A (%) Solvent B (%)
0 97 3 1.5 5 95
1.9 5 95
2.0 97 3
2.3.2 LC-MS with a basic modifier (Method B – [CSH~2min_HPH])
Sample was eluted using a gradient shown in SI Table 2 with a flow rate of 1.0 mL/min.
- Solvent A (0.1% v/v 10 mM ammonium bicarbonate in water adjusted to pH 10 with ammonia
solution) and solvent B (0.1% v/v ammonia in acetonitrile).

8
SI Table 2: High pH gradient for LC-MS analysis
2.4 Mass directed automated preparative HPLC (MDAP)
Mass directed Autoprep was conducted on a Waters® ZQ MS using alternate scan positive and negative
electrospray ionisation and a summed UV wavelength of 210–350 nm. Mass detection was over the range 150–
1000 Da. The scan time was 0.5 s with an inter-scan delay of 0.2 s. Two procedures were used:
Low pH: Sunfire® C18 column (100 mm x 19.0 mm, 5.00 μm packing diameter, 20.0 mL/min flow rate) using a
gradient elution at ambient temperature with the mobile phases of water with 0.1 % formic acid by volume (v/v)
and acetonitrile containing 0.1 % formic acid by volume (v/v).
High pH: XSelect C18 column (100 mm x 19.0 mm, 5.00 μm packing diameter, 20.0 mL/min flow rate) using a
gradient elution at ambient temperature using mobile phases of water with 0.1% 10 mM ammonium
bicarbonate by volume (v/v) adjusted to pH 10 with ammonia solution and 0.1% v/v ammonia in acetonitrile.
The gradient of acetonitrile required to elute product was determined by the LC-MS retention time. The
following methods were selected dependent on the retention time of desired material:
SI Table 3: MDAP methods
Method Flow rate (mL / min) % Acetonitrile LC-MS tR (min)
A 40 0–30 0.40–0.65
B 40 15–55 0.65–0.90
C 40 30–85 0.90–1.16
D 40 50–99 1.16–1.40
E 40 80–99 1.40–2.00
2.5 Characterisation assays
Protein stock solutions:
6H-Tev-BRD4 (44-168) produced as part of the GSK/GenScript collaboration
KRas4B-G12D-C118S (1-169) produced as part of the GSK/GenScript collaboration
hBCL6-Flag-6H-Avi 3Cmut (5-129) produced as part of the GSK/GenScript collaboration
Time (min) Solvent A (%) Solvent B (%)
0.00 97 3
0.05 97 3
1.5 5 95
1.9 5 95
2.00 97 3

9
Carbonic anhydrase isozyme II from bovine erythrocytes (Sigma Aldrich, CAS:9001-03-0, Lot:SLBV8282)
Myoglobin from equine heart (Sigma Aldrich, CAS:100684-32-02, Lot:SLBF8560V)
Lysozyme from chicken egg white (Sigma-Aldrich, CAS:9048-46-8, Lot:BCBV6782)
2.5.1 Time-resolved fluorescence resonance energy transfer (TR-FRET) assay
BRD4-BD1 recombinant protein was produced using published protocols.1 The TR-FRET assay for the BRD4-BD1
domain was performed following published protocols.2
2.5.2 Surface Plasmon Resonance (SPR) assay
SPR-based small molecule binding assays were performed using a Biacore 4000 instrument using a CM5 chip at
25 °C. SPR buffer (10 mM 4-(2-hydroxyethyl)-1-piperazineethanesulfonic acid (HEPES), 150 mM NaCl pH 7.4, 3
mM 2,2',2'',2'''-(ethane-1,2-diyldinitrilo)tetraacetic acid (EDTA), 0.05% polyethylene glycol sorbitan
monolaurate (Tween 20), 200 µM tris(2-carboxyethyl)phosphine (TCEP)) was used as running buffer for
immobilisation, where the chip surface was activated with 0.2 M N-ethyl-N'-(diethylaminopropyl)-carbodiimide
(EDC) and 0.05 M N-hydroxysuccimide (NHS), and BRD4-BD1/2 coupled by injecting for 4 min at 100 µg/mL in
10 mM sodium malonate (pH 6 at 2 M) + 1 mM TCEP.1 Along with a reference activated, but uncoupled surface,
this surface was quenched using a 7 min injection of 1 M ethanolamine pH 8.5, resulting in approximately 9,000
RU BRD4-BD1/2 immobilised. Binding interactions were assayed after switching to SPR buffer containing 1%
dimethylsulfoxide (DMSO). Compounds of interest were assayed as three-fold 10-point dilution series from 10
µl down with 90 s injections and 300 s for dissociation. Solvent correction was carried out at the start, end and
every 99 cycles, using samples covering 0.4 to 1.8% DMSO in SPR buffer. Results (after reference surface
subtraction), were exported from Biacore Evaluation and analysed in a custom analysis template in TIBCO
Spotfire v10.3, where binding data at equilibrium across a dose-response was fitted to a 3-parameter logistic
model to obtain pKd values.
2.5.3 ChromLogD7.4
Chromatographic hydrophobicity index (ChiLogD7.4) was determined by fast-gradient HPLC, according to
literature procedures,3 using a Waters Aquity UPLC System, Phenomenex Gemini NX 50 × 2 mm, 3 μm HPLC
column, 0−100% pH 7.40 ammonium acetate buffer/acetonitrile gradient. Retention time was compared to
standards of known pH to derive the Chromatographic Hydrophobicity Index (CHI). ChromLogD = 0.0857CHI − 2.
2.5.4 Solubility
Compounds to be tested (10 mM, 5 µL in DMSO) were diluted to 100 µL in PBS (pH 7.4), equilibrated for 1 hour
at room temperature and filtered through Millipore Multiscreen HTS-PCF filter plates (MSSL BPC). The filtrate
was quantified using a suitably calibrated Charged Aerosol Detector.4

10
2.6 Intact Protein LC-MS
Intact protein masses were recorded by LC-MS using an Agilent G6224 time-of-flight (ToF) Accurate Mass Series
mass spectrometer, interfaced with an Agilent 1200 series liquid chromatography and sample handling system.
The protein sample was injected using an Agilent 1200 series AutoSampler (Model No. G1367B) with a 10 µL
injection volume and maintained at a temperature of 10 °C. Chromatography was carried out on an Agilent Bio-
HPLC PLRP-S (1000Å, 5 µm × 50 mm × 1.0 mm, PL1312-1502) reverse phase HPLC column at 70 °C. Using an
Agilent 1200 series binary pump system (Model No. G1312B) the sample was eluted at 0.5 mL/min using a
gradient system from Solvent A (water, 0.2% (v/v) formic acid) to Solvent B (acetonitrile, 0.2% (v/v) formic acid)
according to the following conditions:
SI Table 4: Elution gradient (% B) used for intact protein LC-MS
The eluent was injected directly into an Agilent ToF mass spectrometer (Model No. G6224A) using a dual ESI
source and scanning between 600-3200 Da with a scan rate of 1.03 s in positive mode. The following MS
parameters were used: capillary voltage limit – 4200; desolvation temperature – 340 °C; drying gas flow – 8.0
l/min. Data acquisition was carried out in 2 GHz Extended Dynamic range mode. Spectra were processed using
Mass Hunter Qualitative Analysis™ B06.00 (Agilent) software with the Maximum Entropy method employed.
The total ion chromatograms (TIC) were extracted (region containing protein) and the summed scans were
deconvoluted (using a maximum entropy algorithm) over a m/z range with an expected mass range dependent
on the protein (SI Table 5).
SI Table 5: Deconvolution conditions for target proteins examined in this work
Protein m/z range Expected mass range
BRD4-BD1 850-2200 14000-17000
KRas4BG12D 850-2000 18000-21000
BCL6 850-2000 17000-21000
Myoglobin 800-2200 16000-18000
Lysozyme 1000-2500 13000-16000
Carbonic Anhydrase 750-1800 28000-31000
The deconvoluted spectra were exported as csv files and analysed using R Studio software to generate pdf files
of the spectra. The peak height for unmodified protein and labelled protein were recorded and used to calculate
percentage photocrosslinking using the equation:
Time (min) % B
0 20
0.5 20
0.51 40
2.5 80
2.51 100
4 100
4.01 20
4.5 20

11
% = ((intensity of crosslinked protein)/(intensity of protein only+(intensity of crosslinked protein)))*100
2.7 Intact Protein RapidFire MS An Agilent RapidFire 360 microfluidic system equipped with three 1100 isocratic pumps and a RapidFire C4 Type
A solid-phase extraction (SPE) cartridge (G9203-80103) was used for sample introduction. Samples were
sequentially analysed by aspirating with vacuum for 250 ms to fill the sample loop (10 µl) directly from a 384-
well microtiter plate. Samples were loaded onto the SPE cartridge and washed using 0.1% (v/v) formic acid
(solvent A) at a flow rate of 1.50 mL/ min for 3500 ms and eluted using 40% acetonitrile in water (v/v) with 0.1%
(v/v) formic acid (solvent B) at a flow rate of 1.0 mL/min for 4000 ms. Concurrent with sample elution, the sample
loop was washed with solvent B at a flow rate of 1.25 mL/min. The system was re-equilibrated using solvent A
at a flow rate of 1.5 mL/min for 500 ms. Sample needle washes were performed between injections and blank
washes performed after each plate row of samples. The entire sampling cycle was approximately 12 s per well
enabling the analysis of a 384-well plate in approximately 77 min. Mass spectrometric data were acquired on
an Agilent 6220 time-of-flight (ToF) MS system, operated with a dual electrospray ionization (ESI) source ion
source, in positive ionization mode. The instrument parameters were as follows: gas temperature 300°C, drying
gas 13 L/min, nebulizer 45 psi, capillary 5.0 kV, fragmentor 290 V, skimmer 65 V, and octopole RF 300 V peak-
to-peak. Data were acquired at the rate of 5 spectra/s. The mass range was calibrated using the Agilent positive
ion tune mix, over the m/z range 300–3200. Agilent RapidFire v4.0 and Agilent MassHunter B.04.00 software
were employed for data acquisition and processing. The total ion chromatograms (TIC) were extracted (region
containing protein) and the summed scans were deconvoluted over a m/z range with an expected mass range
dependent on the protein (SI Table 6).
SI Table 6: Deconvolution conditions for BRD4-BD1
Protein m/z range Expected mass range
BRD4-BD1 600-2000 14500-16000
The deconvoluted spectra were exported as csv files and analysed using R Studio software to generate pdf files
of the spectra. The peak height for unmodified protein and labelled protein were recorded and used to calculate
percentage photocrosslinking using the equation:
% = ((intensity of crosslinked protein)/(intensity of protein only+(intensity of crosslinked protein)))*100

12
3. Selection of amine functionalised fragments
A list of available commercial and proprietary primary or secondary amine building blocks were filtered to meet
‘fragment’ properties (aromatic ring count ≤2; H-bond donors/acceptors ≤4; heavy atoms ≤15; molecular weight
(MW)≤200), having removed protecting groups where present. The structures were next passed through
substructure filters developed in-house by GSK to remove undesirable chemical functionalities from screening
hits.5 Building blocks were then clustered using several independent methods. For clustering purposes, the
linking amine was capped with an actinium atom prior to clustering to add significance to the attachment point.
Several clustering methods were tested and two selected for use: Jarvis-Patrick algorithm with a path-based
fingerprint (ChemAxon FP7), and 2D topological pharmacophore fingerprints (ProSAR implemented within MOE,
with the actinium atom defining the attachment point).6-9 Clusters were examined and building blocks
considered to add no value were removed. Re-clustering was then performed and one or two compounds
selected from each cluster, usually the smallest or simplest, resulting in a list of 470 diverse amines and 281
anilines. Of these, 650 were available as solids.
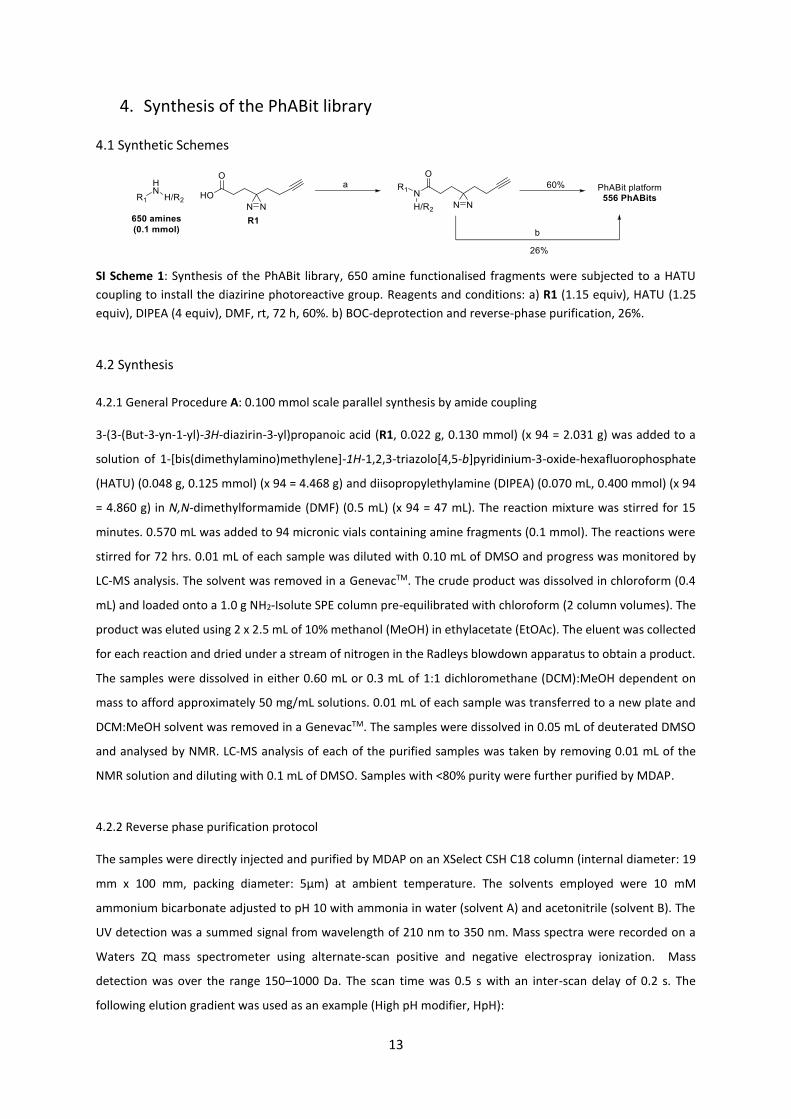
13
4. Synthesis of the PhABit library
4.1 Synthetic Schemes
SI Scheme 1: Synthesis of the PhABit library, 650 amine functionalised fragments were subjected to a HATU
coupling to install the diazirine photoreactive group. Reagents and conditions: a) R1 (1.15 equiv), HATU (1.25
equiv), DIPEA (4 equiv), DMF, rt, 72 h, 60%. b) BOC-deprotection and reverse-phase purification, 26%.
4.2 Synthesis
4.2.1 General Procedure A: 0.100 mmol scale parallel synthesis by amide coupling
3-(3-(But-3-yn-1-yl)-3H-diazirin-3-yl)propanoic acid (R1, 0.022 g, 0.130 mmol) (x 94 = 2.031 g) was added to a
solution of 1-[bis(dimethylamino)methylene]-1H-1,2,3-triazolo[4,5-b]pyridinium-3-oxide-hexafluorophosphate
(HATU) (0.048 g, 0.125 mmol) (x 94 = 4.468 g) and diisopropylethylamine (DIPEA) (0.070 mL, 0.400 mmol) (x 94
= 4.860 g) in N,N-dimethylformamide (DMF) (0.5 mL) (x 94 = 47 mL). The reaction mixture was stirred for 15
minutes. 0.570 mL was added to 94 micronic vials containing amine fragments (0.1 mmol). The reactions were
stirred for 72 hrs. 0.01 mL of each sample was diluted with 0.10 mL of DMSO and progress was monitored by
LC-MS analysis. The solvent was removed in a GenevacTM. The crude product was dissolved in chloroform (0.4
mL) and loaded onto a 1.0 g NH2-Isolute SPE column pre-equilibrated with chloroform (2 column volumes). The
product was eluted using 2 x 2.5 mL of 10% methanol (MeOH) in ethylacetate (EtOAc). The eluent was collected
for each reaction and dried under a stream of nitrogen in the Radleys blowdown apparatus to obtain a product.
The samples were dissolved in either 0.60 mL or 0.3 mL of 1:1 dichloromethane (DCM):MeOH dependent on
mass to afford approximately 50 mg/mL solutions. 0.01 mL of each sample was transferred to a new plate and
DCM:MeOH solvent was removed in a GenevacTM. The samples were dissolved in 0.05 mL of deuterated DMSO
and analysed by NMR. LC-MS analysis of each of the purified samples was taken by removing 0.01 mL of the
NMR solution and diluting with 0.1 mL of DMSO. Samples with <80% purity were further purified by MDAP.
4.2.2 Reverse phase purification protocol
The samples were directly injected and purified by MDAP on an XSelect CSH C18 column (internal diameter: 19
mm x 100 mm, packing diameter: 5μm) at ambient temperature. The solvents employed were 10 mM
ammonium bicarbonate adjusted to pH 10 with ammonia in water (solvent A) and acetonitrile (solvent B). The
UV detection was a summed signal from wavelength of 210 nm to 350 nm. Mass spectra were recorded on a
Waters ZQ mass spectrometer using alternate-scan positive and negative electrospray ionization. Mass
detection was over the range 150–1000 Da. The scan time was 0.5 s with an inter-scan delay of 0.2 s. The
following elution gradient was used as an example (High pH modifier, HpH):

14
SI Table 7: MDAP conditions for a high pH modifier
Time (min) Flow rate (mL / min) % A % B 0 40 70 30 1 40 70 30
20 40 15 85 20.5 40 1 99 25 40 1 99
The gradient of acetonitrile required to elute product was determined by the LC-MS retention time. The
following methods were selected dependent on the retention time of desired material:
SI Table 8: MDAP methods
Following purification, the relevant fractions were combined and concentrated to dryness under a flow of
nitrogen in vials using a Radley’s plate blowdown unit.
4.2.3 Tert-butyloxycarbonyl (BOC)-deprotection protocol
Samples were re-dissolved in dichloromethane (DCM) (0.3 mL) at room temperature and trifluoroacetic acid
(TFA) (0.3 mL) was added to the solution. The vials were capped and stood at room temperature for 1 hr before
the solvent was removed under a stream of nitrogen in a Radleys blowdown apparatus (TFA salt assumed).
4.3 Hit PhABits from screens against BRD4-BD1 and KRasG12D
4.3.1 BRD4-BD1 Hits
3-(3-(But-3-yn-1-yl)-3H-diazirin-3-yl)-N-(4-(5-methyl-1,2,4-oxadiazol-3-yl)phenyl) propanamide (1)
General Procedure A afforded 3-(3-(but-3-yn-1-yl)-3H-diazirin-3-yl)-N-(4-(5-methyl-1,2,4-oxadiazol-3-yl)phenyl)
propanamide (1) (30.5 mg, 0.094 mmol, 92%) as an off-white solid. δH (600 MHz, d-DMSO) 10.22 (1H, s), 7.93
(2H, dd, J=8.7, 1.9 Hz), 7.74 (2H, dd, J=8.8, 2.1 Hz), 2.83–2.79 (1H, m), 2.64 (3H, s), 2.18 (2H, t, J=7.7 Hz), 2.05–
2.00 (2H, m), 1.78 (2H, t, J=7.7 Hz), 1.62 (2H, t, J=7.3 Hz); LC-MS (Method [CSH~2min_HPH]): tR = 1.07 min, 97%
by UV, [M+H]+ found: 323.0.
Method Flow rate (mL / min) % B to % B LCMS tR (min) A 40 0–30 0.40–0.65 B 40 15–55 0.65–0.90 C 40 30–85 0.90–1.16 D 40 50–99 1.16–1.40 E 40 80–99 1.40–2.00

15
3-(3-(But-3-yn-1-yl)-3H-diazirin-3-yl)-N-(3-methyl-[1,2,4]triazolo[4,3-a]pyridin-8-yl)propanamide (2)
General Procedure A followed by reverse phase purification (Section 4.2) afforded 3-(3-(but-3-yn-1-yl)-3H-
diazirin-3-yl)-N-(3-methyl-[1,2,4]triazolo[4,3-a]pyridin-8-yl)propanamide (2) (3.3 mg, 0.01 mmol, 9%) as an off-
white solid. δH (600 MHz, d-DMSO) 8.06 (1H, d, J=7.0 Hz), 8.00 (1H, d, J=7.0 Hz), 6.95–6.91 (1H, m), 2.82–2.78
(1H, m), 2.69 (3H, s), 2.43 (2H, t, J=7.5 Hz), 2.05–2.01 (2H, m), 1.75 (2H, t, J=7.5 Hz), 1.65–1.61 (2H, m); LC-MS
(Method [CSH~2min_HPH]): tR = 0.79 min, 90% by UV, [M+H]+ found: 296.0.
3-(3-(But-3-yn-1-yl)-3H-diazirin-3-yl)-N-(3-(3,5-dimethylisoxazol-4-yl)phenyl) propanamide (3)
General Procedure A afforded 3-(3-(but-3-yn-1-yl)-3H-diazirin-3-yl)-N-(3-(3,5-dimethylisoxazol-4-yl)phenyl)
propanamide (3) (30.1 mg, 0.089 mmol, 87%) as an off-white solid. δH (600 MHz, d-DMSO) 10.04 (1H, s), 7.59
(1H, s), 7.56–7.52 (1H, m), 7.41–7.35 (1H, m), 7.05 (1H, d, J=7.5 Hz), 2.82–2.78 (1H, m), 2.40 (3H, s), 2.22 (3H, s),
2.15 (2H, t, J=7.5 Hz), 2.05–1.99 (2H, m), 1.77 (2H, t, J=7.5 Hz), 1.61 (2H, t, J=7.3 Hz); LC-MS (Method
[CSH~2min_HPH]): tR = 1.12 min, 97% by UV, [M+H]+ found: 336.0.
3-(3-(But-3-yn-1-yl)-3H-diazirin-3-yl)-N-(3-(3,5-dimethylisoxazol-4-yl)benzyl)propanamide (4)
General Procedure A afforded 3-(3-(but-3-yn-1-yl)-3H-diazirin-3-yl)-N-(3-(3,5-dimethylisoxazol-4-yl)benzyl)
propanamide (4) (28.9 mg, 0.082 mmol, 74%) as an off-white solid. δH (600 MHz, d-DMSO) 7.44–7.40 (1H, m),
7.28–7.24 (3H, m), 4.32 (2H, d, J=5.9 Hz), 2.81–2.79 (1H, m), 2.40 (3H, s), 2.22 (3H, s), 2.01–1.96 (4H, m), 1.72–
1.68 (2H, m), 1.59–1.55 (2 H, m); LC-MS (Method [CSH~2min_HPH]): tR = 1.05 min, 90% by UV, [M+H]+ found:
350.0.
2-(3-(3-(But-3-yn-1-yl)-3H-diazirin-3-yl)propanamido)-N-(2-hydroxyethyl)benzamide (5)
General Procedure A followed by reverse phase purification (Section 4.2) afforded 2-(3-(3-(but-3-yn-1-yl)-3H-
diazirin-3-yl)propanamido)-N-(2-hydroxyethyl)benzamide (5) (2.8 mg, 0.01 mmol, 8%) as an off-white solid. δH
(600 MHz, d-DMSO) 8.32–8.25 (1H, m), 7.45 (1H, d, J=7.7 Hz), 7.18–7.11 (1H, m), 6.69 (1H, d, J=7.7 Hz), 6.45–
3.39 (1H, m), 6.36 (1H, s), 4.11 - 4.16 (2H, m), 3.45–3.38 (2H, m), 2.80–2.78 (1H, m), 2.19–2.13 (2H, m), 1.98–
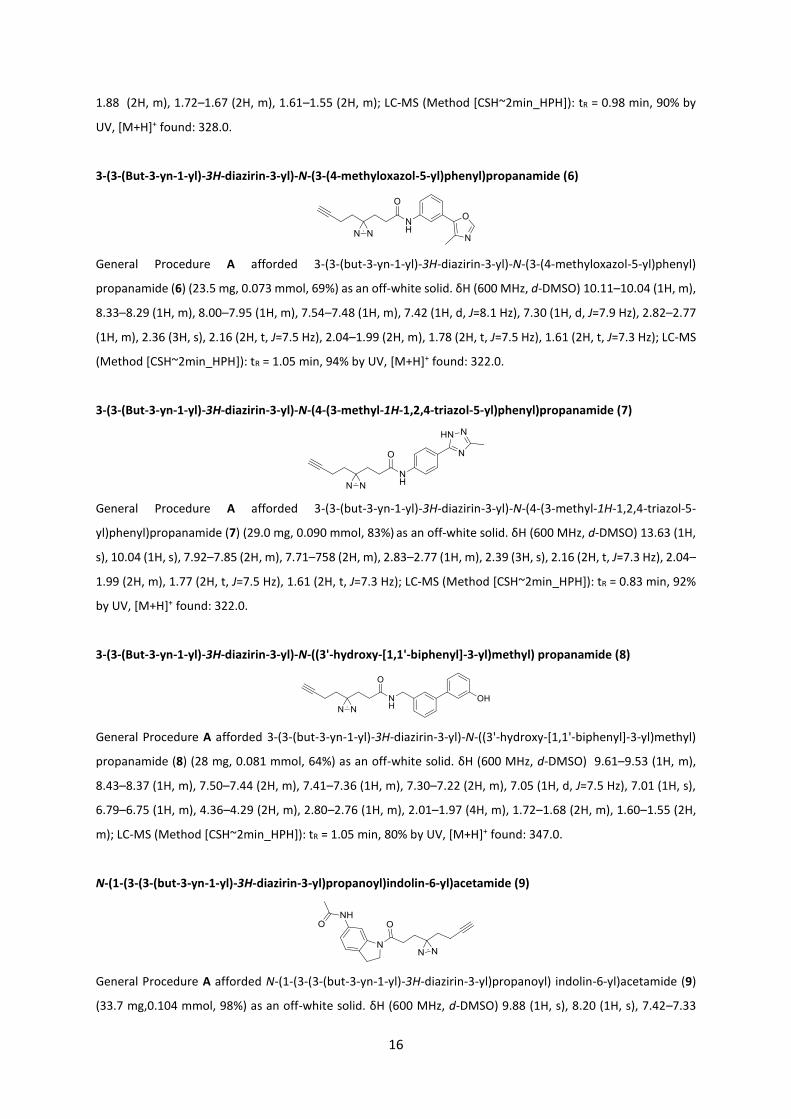
16
1.88 (2H, m), 1.72–1.67 (2H, m), 1.61–1.55 (2H, m); LC-MS (Method [CSH~2min_HPH]): tR = 0.98 min, 90% by
UV, [M+H]+ found: 328.0.
3-(3-(But-3-yn-1-yl)-3H-diazirin-3-yl)-N-(3-(4-methyloxazol-5-yl)phenyl)propanamide (6)
General Procedure A afforded 3-(3-(but-3-yn-1-yl)-3H-diazirin-3-yl)-N-(3-(4-methyloxazol-5-yl)phenyl)
propanamide (6) (23.5 mg, 0.073 mmol, 69%) as an off-white solid. δH (600 MHz, d-DMSO) 10.11–10.04 (1H, m),
8.33–8.29 (1H, m), 8.00–7.95 (1H, m), 7.54–7.48 (1H, m), 7.42 (1H, d, J=8.1 Hz), 7.30 (1H, d, J=7.9 Hz), 2.82–2.77
(1H, m), 2.36 (3H, s), 2.16 (2H, t, J=7.5 Hz), 2.04–1.99 (2H, m), 1.78 (2H, t, J=7.5 Hz), 1.61 (2H, t, J=7.3 Hz); LC-MS
(Method [CSH~2min_HPH]): tR = 1.05 min, 94% by UV, [M+H]+ found: 322.0.
3-(3-(But-3-yn-1-yl)-3H-diazirin-3-yl)-N-(4-(3-methyl-1H-1,2,4-triazol-5-yl)phenyl)propanamide (7)
General Procedure A afforded 3-(3-(but-3-yn-1-yl)-3H-diazirin-3-yl)-N-(4-(3-methyl-1H-1,2,4-triazol-5-
yl)phenyl)propanamide (7) (29.0 mg, 0.090 mmol, 83%) as an off-white solid. δH (600 MHz, d-DMSO) 13.63 (1H,
s), 10.04 (1H, s), 7.92–7.85 (2H, m), 7.71–758 (2H, m), 2.83–2.77 (1H, m), 2.39 (3H, s), 2.16 (2H, t, J=7.3 Hz), 2.04–
1.99 (2H, m), 1.77 (2H, t, J=7.5 Hz), 1.61 (2H, t, J=7.3 Hz); LC-MS (Method [CSH~2min_HPH]): tR = 0.83 min, 92%
by UV, [M+H]+ found: 322.0.
3-(3-(But-3-yn-1-yl)-3H-diazirin-3-yl)-N-((3'-hydroxy-[1,1'-biphenyl]-3-yl)methyl) propanamide (8)
General Procedure A afforded 3-(3-(but-3-yn-1-yl)-3H-diazirin-3-yl)-N-((3'-hydroxy-[1,1'-biphenyl]-3-yl)methyl)
propanamide (8) (28 mg, 0.081 mmol, 64%) as an off-white solid. δH (600 MHz, d-DMSO) 9.61–9.53 (1H, m),
8.43–8.37 (1H, m), 7.50–7.44 (2H, m), 7.41–7.36 (1H, m), 7.30–7.22 (2H, m), 7.05 (1H, d, J=7.5 Hz), 7.01 (1H, s),
6.79–6.75 (1H, m), 4.36–4.29 (2H, m), 2.80–2.76 (1H, m), 2.01–1.97 (4H, m), 1.72–1.68 (2H, m), 1.60–1.55 (2H,
m); LC-MS (Method [CSH~2min_HPH]): tR = 1.05 min, 80% by UV, [M+H]+ found: 347.0.
N-(1-(3-(3-(but-3-yn-1-yl)-3H-diazirin-3-yl)propanoyl)indolin-6-yl)acetamide (9)
General Procedure A afforded N-(1-(3-(3-(but-3-yn-1-yl)-3H-diazirin-3-yl)propanoyl) indolin-6-yl)acetamide (9)
(33.7 mg,0.104 mmol, 98%) as an off-white solid. δH (600 MHz, d-DMSO) 9.88 (1H, s), 8.20 (1H, s), 7.42–7.33

17
(1H, m), 7.11 (1H, d, J=7.9 Hz), 4.05 (2H, t, J=8.3 Hz), 3.06 (2H, t, J=8.3 Hz), 2.84–2.77 (1H, m), 2.29 (2H, t, J=7.2
Hz), 2.06–1.97 (5H, m), 1.74 (2H, t, J=7.2 Hz), 1.64 (2H, t, J=7.2 Hz); LC-MS (Method [CSH~2min_HPH]): tR = 0.98
min, 94% by UV, [M+H]+ found: 324.0.
4.3.2 KRas Hits
3-(3-(But-3-yn-1-yl)-3H-diazirin-3-yl)-N-(6-(4-methylpiperazin-1-yl)pyridin-3-yl)propanamide (60)
General Procedure A afforded 3-(3-(but-3-yn-1-yl)-3H-diazirin-3-yl)-N-(6-(4-methylpiperazin-1-yl)pyridin-3-
yl)propanamide (60) (20.9 mg, 0.061 mmol, 57%) as an off-white solid. δH (600 MHz, d-DMSO) 9.79–9.74 (1H,
m), 8.26–8.21 (1H, m), 7.75–7.71 (1H, m), 6.79 (1H, d, J=9.0 Hz), 3.39–3.37 (4H, m), 2.83–2.79 (1H, m), 2.38 (4H,
t, J=4.7 Hz), 2.20 (3H, s), 2.10 (2H, t, J=7.7 Hz), 2.03–1.99 (2H, m), 1.74 (2H, t, J=7.5 Hz), 1.60 (2H, t, J=7.3 Hz); LC-
MS (Method [CSH~2min_HPH]): tR = 0.88 min, 92% by UV, [M+H]+ found: 340.0.
3-(3-(But-3-yn-1-yl)-3H-diazirin-3-yl)-N-(6-morpholinopyridin-3-yl)propanamide (61)
General Procedure A afforded 3-(3-(but-3-yn-1-yl)-3H-diazirin-3-yl)-N-(6-morpholinopyridin-3-yl)propanamide
(61) (25.3 mg, 0.077 mmol, 72%) as an off-white solid. δH (600 MHz, d-DMSO) 9.79 (1H, s), 8.29–8.25 (1H, m),
7.80–7.74 (1H, m), 6.80 (1H, d, J=9.0 Hz), 3.71–3.67 (4H, m), 3.36–3.34 (4H, m), 2.84–2.79 (1H, m), 2.11 (2H, t,
J=7.7 Hz), 2.04–2.00 (2H, m), 1.75 (2H, t, J=7.7 Hz), 1.61 (2H, t, J=7.5 Hz); LC-MS (Method [CSH~2min_HPH]): tR
= 0.89 min, 93% by UV, [M+H]+ found: 327.0.
1-(4-(1H-indol-3-yl)piperidin-1-yl)-3-(3-(but-3-yn-1-yl)-3H-diazirin-3-yl)propan-1-one (62)
General Procedure A followed by reverse phase purification afforded 1-(4-(1H-indol-3-yl)piperidin-1-yl)-3-(3-
(but-3-yn-1-yl)-3H-diazirin-3-yl)propan-1-one (62) (13.4 mg, 0.038 mmol, 37%) as an off-white solid. δH (600
MHz, d-DMSO) 7.60–7.54 (1H, m), 7.37–7.31 (1H, m), 7.10–7.03 (2H, m), 7.00–6.93 (1H, m), 4.50 (1H, d, J=11.3
Hz), 3.92 (1H, d, J=12.4 Hz), 3.07–3.02 (2H, m), 2.83–2.78 (1H, m), 2.74–2.68 (1H, m), 2.24–2.15 (2H, m), 2.04–
1.91 (4H, m), 1.55–1.72 (5H, m), 1.49–1.45 (1H, m); LC-MS (Method [CSH~2min_HPH]): tR = 1.16 min, 85% by
UV, [M+H]+ found: 348.0.

18
(S)-3-(3-(but-3-yn-1-yl)-3H-diazirin-3-yl)-N-(1-hydroxy-3-(1H-indol-3-yl)propan-2-yl)propanamide (63)
General Procedure A followed by reverse phase purification afforded (S)-3-(3-(but-3-yn-1-yl)-3H-diazirin-3-yl)-
N-(1-hydroxy-3-(1H-indol-3-yl)propan-2-yl)propanamide (63) (3.1 mg, 0.009 mmol, 23%) as an off-white solid.
δH (600 MHz, d-DMSO) 7.64–7.60 (1H, m), 7.36–7.28 (1H, m), 7.12–7.07 (2H, m), 7.02–6.94 (1H, m), 4.27–4.17
(1H, m), 3.62–3.54 (2H, m), 3.08–3.01 (1H, m), 2.94–2.87 (1H, m), 2.24 (1H, t, J=2.8 Hz), 2.02–1.95 (4H, m), 1.65–
1.59 (2H, m), 1.56–1.51 (2H, m); LC-MS (Method [CSH~2min_HPH]): tR = 0.90 min, 90% by UV, [M+H]+ found:
338.0.

19
5. PhABit platform screening protocol The 556 PhABit compounds were plated in 384 well plates as 20 mM stock solutions in DMSO.
Example procedure: 150 nL of PhABit compound in DMSO was transferred into a Greiner 384 low volume plate
(#784076) using a Labcyte Echo 555 Liquid Handler®. BRD4-BD1 (1 µM, 15 µL in PBS) was added to the wells and
incubated at 4 °C for 15 min. The plate was irradiated at 302 nm for 10 min on ice as described in SI Section 2.1.
The plate was sealed, centrifuged (1000 rpm, 1 min) and sampled directly for intact protein LC-MS analysis using
the methods described in SI Section 2.6.

20
6. Follow-up studies
6.1 Concentration response studies for hit PhABits with BRD4-BD1 Seven hit PhABits (1–6, and 8) with BRD4-BD1 were selected for follow-up concentration response studies.
Example procedure: 150 nL of compound (variable concentration in DMSO) was transferred into a Greiner 384
low volume plate (#784076) using a Labcyte Echo 555 Liquid Handler®. 15 µL of a solution containing BRD4-BD1
1 µM in phosphate-buffered saline (PBS) was added to the wells containing competitor compound and incubated
at 4 °C for 15 min. The plate was irradiated at 302 nm for 10 min on ice. The plate was sealed, centrifuged (1000
rpm, 1 min) and sampled directly for intact protein LC-MS analysis using the methods described in SI Section
2.6. This experiment was performed in triplicate. The crosslinking yields for the seven PhABits at each
concentration are shown in SI Table 9. These values were plotted in Graphpad Prism® 5.0.4 software to generate
concentration response curves and pKD values. Lines were fitted using non-linear regression with the ‘one site
total’ model implemented on Prism. The curves were constrained to the estimated maximum crosslinking yield
for each PhABit and are shown in SI Table 10 along with the TR-FRET (SI Section 2.5.1) and SPR (SI Section 2.5.2)
assay data.
SI Table 9: Crosslinking yields of selected hit PhABits (1–6, and 8) in concentration response to BRD4-BD1
Concentration of PhABit (µM) Crosslinking Yield (%) 1
2
n=1 n=2 n=3
n=1 n=2 n=3
250 51.3 51.0 50.4
39.5 42.6 39.2
125 43.8 45.1 42.5
26.3 27.5 27.3
62.5 30.5 32.0 26.8
13.9 15.4 14.9
31.3 15.6 17.1 12.9
6.6 7.4 6.4
15.6 8.6 8.2 6.0
2.7 2.8 2.8
7.8 4.3 4.4 3.5
1.3 1.6 1.4
3.9 2.2 1.9 1.5
0.6 0.8 0.7
2.0 1.2 1.7 0.9
0.5 0.5 0.6
1.0 0.7 0.9 0.6
0.4 0.6 0.6
3 4 n=1 n=2 n=3 n=1 n=2 n=3
250 6.8 4.8 5.4 8.1 7.6 125 5.5 4.1 4.9 5.5 5.7 7.4 62.5 3.5 2.7 4.4 4.5 4.0 7.0 31.3 3.6 4.3 5.1 3.3 3.0 4.6 15.6 3.9 4.0 4.1 2.4 2.4 3.2 7.8 3.5 3.4 3.6 1.7 1.3 1.6 3.9 3.6 2.5 2.9 1.0 1.0 1.5 2.0 2.3 1.8 2.2 0.4 0.6 1.2 1.0 1.5 1.0 1.3 0.3 0.3 0.9
5 6 n=1 n=2 n=3 n=1 n=2 n=3
250 5.3 4.6 4.7 4.0 3.3 1.7 125 3.8 3.9 3.6 2.9 2.3 1.3

21
62.5 3.4 2.1 3.4 2.1 1.6 1.5 31.3 2.2 2.5 2.2 1.3 1.0 1.0 15.6 1.6 1.7 1.9 0.7 0.6 0.7 7.8 1.2 1.4 1.4 0.5 0.6 0.9 3.9 0.7 1.0 0.8 0.3 0.5 0.4 2.0 0.6 0.6 0.7 0.3 0.4 0.5 1.0 0.3 0.6 0.4 0.2 0.3 0.4
8 n=1 n=2 n=3
250 3.3 3.6 3.5 125 2.9 4.1 3.4 62.5 1.7 2.4 2.6 31.3 1.1 1.2 1.5 15.6 0.4 0.5 0.5 7.8 0.4 0.5 0.4 3.9 0.4 0.4 0.6 2.0 0.4 0.4 0.5 1.0 0.4 0.4 0.6
SI Table 10: Potency data for hit PhABits in concentration response, TR-TRET and SPR assays
Compound KD pKD TR-FRET (pIC50) SPR (pKD) 1 121.2 3.9 <3.6 - 2 187.0 3.7 4.0 4.0 3 1.3 5.9 5.7 5.2 4 30.0 4.5 5.0 4.9 5 17.4 4.8 <3.6 - 6 61.1 4.2 4.2 - 7 ND ND <3.6 - 8 83.0 4.1 4.5 - 9 ND ND 4.1 4.2

22
6.2 PhABit analogues
6.2.1 Synthetic Scheme
SI Scheme 2: Synthesis of selected PhABit analogues. Reagents and conditions: a) HATU (1.25 mmol), DIPEA (0.4
mmol), DMF, rt, 72 h.
6.2.2 General procedure B: 0.100 mmol scale parallel synthesis by amide coupling
Acetyl analogues: Acetic acid (R2, 0.011 mL, 0.2 mmol) was added to a solution of 1-
[bis(dimethylamino)methylene]-1H-1,2,3-triazolo[4,5-b]pyridinium-3-oxide-hexafluorophosphate (0.048 g,
0.125 mmol) and diisopropylethylamine (0.070 mL, 0.400 mmol) in N,N-dimethylformamide (0.5 mL).
Butanoyl analogues: Butyric acid (R3, 0.012 mL, 0.13 mmol) was added to a solution of 1-
[bis(dimethylamino)methylene]-1H-1,2,3-triazolo[4,5-b]pyridinium-3-oxide-hexafluoro phosphate (0.048 g,
0.125 mmol) and diisopropylethylamine (0.070 mL, 0.400 mmol) in N,N-dimethylformamide (0.5 mL).
The reaction mixture was stirred for 15 minutes. 0.570 mL was added to micronic vials containing amine
fragments (0.1 mmol). The reactions were stirred for 72 hrs. 0.01 mL of each sample was diluted with 0.10 mL
of DMSO and progress was monitored by LC-MS analysis. The solvent was removed in a GenevacTM. The crude
product was dissolved in chloroform (0.4 mL) and loaded onto a 1.0 g NH2-Isolute SPE column pre-equilibrated
with chloroform (2 column volumes). The product was eluted using 2 x 2.5 mL of 10% MeOH in EtOAc. The eluent
was collected and dried under a stream of nitrogen in a Radleys blowdown. The samples were dissolved in either
0.60 mL or 0.3 mL of 1:1 DCM:MeOH dependent on mass to afford approximately 50 mg/mL solutions. 0.01 mL
of each sample was transferred to a new plate and DCM:MeOH solvent was removed in a GenevacTM. The
samples were dissolved in 0.05 mL of deuterated DMSO and analysed by NMR. LC-MS samples were taken of
each of the purified samples by removing 0.01 mL of the NMR solution and diluting with 0.1 mL of DMSO. Any
analogues that required further purification or deprotection were treated as described in SI Section 4.2.2 and SI
Section 4.2.3.

23
6.2.3 Acetyl analogues
N-(3-methyl-[1,2,4]triazolo[4,3-a]pyridin-8-yl)acetamide (10)
General procedure B afforded N-(3-methyl-[1,2,4]triazolo[4,3-a]pyridin-8-yl)acetamide (10) (3.2 mg, 0.017
mmol, 16%) as an off-white solid. δH (600 MHz, d-DMSO) 10.32 (1H, s), 8.05 (1H, d, J=7.0 Hz), 7.99 (1H, d, J=7.2
Hz), 6.97–6.91 (1H, m), 2.69 (3H, s), 2.23–2.21 (3H, m); LC-MS (Method [CSH~2min_HPH]): tR = 0.48 min, 95% by
UV, [M+H]+ found: 191.2.
N-(3-(3,5-dimethylisoxazol-4-yl)phenyl)acetamide (11)
General procedure B afforded N-(3-(3,5-dimethylisoxazol-4-yl)phenyl)acetamide (11) (18.4 mg, 0.080 mmol,
76%) as an off-white solid. δH (600 MHz, d-DMSO) 10.03 (1H, br s) 7.61–7.60 (1H, m), 7.58–7.56 (1 H, m), 7.42–
7.37 (1H, m), 7.06–7.08 (1H, m), 2.41 (3H, s), 2.23 (3H, s), 2.06 (3H, s); LC-MS (Method [CSH~2min_HPH]): tR =
0.81 min, 95% by UV, [M+H]+ found: 231.1.
N-(3-(3,5-dimethylisoxazol-4-yl)benzyl)acetamide (12)
General procedure B afforded N-(3-(3,5-dimethylisoxazol-4-yl)benzyl)acetamide (12) (14.2 mg, 0.058 mmol,
55%) as an off-white solid. δH (600 MHz, d-DMSO) 8.38 (1H, s), 7.45–7.41 (1H, m), 7.28–7.24 (3H, m), 4.30 (2H,
d, J=5.9 Hz), 2.40 (3H, s), 2.22 (3H, s), 1.89 - 1.89 (3H, m); LC-MS (Method [CSH~2min_HPH]): tR = 0.77 min, 95%
by UV, [M+H]+ found: 244.1.
N-(3-(4-methyloxazol-5-yl)phenyl)acetamide (13)
General procedure B afforded N-(3-(4-methyloxazol-5-yl)phenyl)acetamide (13) (18.8 mg, 0.087 mmol, 83%) as
an off-white solid. δH (600 MHz, d-DMSO) 10.09 (1H, s), 8.33 (1H, s), 7.98 (1H, s), 7.56–7.52 (1 H, m), 7.43–7.40
(1H, m), 7.31–7.27 (1H, m), 2.37 (3H, s), 2.08–2.06 (3H, m); LC-MS (Method [CSH~2min_HPH]): tR = 0.73 min,
95% by UV, [M+H]+ found: 217.1.

24
N-((3'-hydroxy-[1,1'-biphenyl]-3-yl)methyl)acetamide (14)
General procedure B afforded N-((3'-hydroxy-[1,1'-biphenyl]-3-yl)methyl)acetamide (14) (8.7 mg, 0.036 mmol,
34%) as an off-white solid. δH (600 MHz, d-DMSO) 8.40–8.36 (1H, m), 7.50–7.42 (2H, m), 7.42–7.37 (1H, m),
7.28–7.22 (2H, m), 7.04 (1 H, d, J=7.3 Hz), 7.00 (1H, s), 6.77 (1H, d, J=8.1 Hz), 4.31 (2H, d, J=5.9 Hz), 1.91–1.87
(3H, m); LC-MS (Method [CSH~2min_HPH]): tR = 0.78 min, 95% by UV, [M+H]+ found: 242.2.
6.2.4 Butanoyl analogues
N-(3-methyl-[1,2,4]triazolo[4,3-a]pyridin-8-yl)butyramide (15)
General procedure B afforded N-(3-methyl-[1,2,4]triazolo[4,3-a]pyridin-8-yl)butyramide (15) (6.5 mg, 0.030
mmol, 28%) as an off-white solid. δH (600 MHz, d-DMSO) 10.22–10.20 (1H, m), 8.05 (1H, d, J=7.2 Hz), 8.01 (1H,
d, J=7.2 Hz), 6.95–6.89 (1H, m), 2.69 (3H, s), 2.53–2.52 (2H, m), 1.66–1.61 (2H, m), 0.94–0.91 (3H, m); LC-MS
(Method [CSH~2min_HPH]): tR = 0.64 min, 95% by UV, [M+H]+ found: 219.2.
N-(3-(3,5-dimethylisoxazol-4-yl)phenyl)butyramide (16)
General procedure B afforded N-(3-(3,5-dimethylisoxazol-4-yl)phenyl)butyramide (16) (21.6 mg, 0.084 mmol,
79%) as an off-white solid. δH (600 MHz, d-DMSO) 9.98–9.95 (1H, m), 7.63 (1H, s), 7.59 (1H, d, J=7.9 Hz), 7.41–
7.36 (1H, m), 7.04 (1H, d, J=7.7 Hz), 2.41 (3H, s), 2.30 (2H, t, J=7.3 Hz), 2.23 (3H, s), 1.66–1.58 (2H, m), 0.95–0.90
(3H, m); LC-MS (Method [CSH~2min_HPH]): tR = 0.98 min, 95% by UV, [M+H]+ found: 258.1.
N-(3-(3,5-dimethylisoxazol-4-yl)benzyl)butyramide (17)
General procedure B afforded N-(3-(3,5-dimethylisoxazol-4-yl)benzyl)butyramide (17) (18.5 mg, 0.068 mmol,
65%) as an off-white solid. δH (600 MHz, d-DMSO) 8.34 (1H, s), 7.44–7.40 (1H, m), 7.26–7.23 (3H, m), 4.32 (2H,
d, J=5.9 Hz), 2.40 (3H, s), 2.22 (3H, s), 2.13 (2H, t, J=7.3 Hz), 1.58–1.52 (2H, m), 0.89–0.84 (3H, m); LC-MS (Method
[CSH~2min_HPH]): tR = 0.91 min, 95% by UV, [M+H]+ found: 273.2.

25
N-(3-(4-methyloxazol-5-yl)phenyl)butyramide (18)
General procedure B afforded N-(3-(4-methyloxazol-5-yl)phenyl)butyramide (18) (22.1 mg, 0.090 mmol, 86%) as
an off-white solid. δH (600 MHz, d-DMSO) 10.02 (1H, s), 8.33 (1H, s), 8.01 (1H, s), 7.55 (1H, d, J=8.2 Hz), 7.43–
7.38 (1H, m), 7.29 (1H, d, J=8.0 Hz), 2.37 (3H, s), 2.31 (2H, t, J=7.2 Hz), 1.66–1.62 (2H, m), 0.96–0.90 (3H, m); LC-
MS (Method [CSH~2min_HPH]): tR = 0.91 min, 95% by UV, [M+H]+ found: 245.2.
N-((3'-hydroxy-[1,1'-biphenyl]-3-yl)methyl)butyramide (19)
General procedure B afforded N-((3'-hydroxy-[1,1'-biphenyl]-3-yl)methyl)butyramide (19) (7.8 mg, 0.029 mmol,
28%) as an off-white solid. δH (600 MHz, d-DMSO) 8.33 (1H, s), 7.48–7.44 (2H, m), 7.43–7.37 (1H, m), 7.28–7.22
(1H, m), 7.22 (1H, d, J=7.6 Hz), 7.04–7.02 (1H, m), 7.02–6.96 (1H, m), 6.80–6.73 (1H, m), 4.33 (2H, d, J=5.9 Hz),
2.14 (2H, t, J=7.2 Hz), 1.58–1.54 (2H, m), 0.90–0.85 (3H, m); LC-MS (Method [CSH~2min_HPH]): tR = 0.92 min,
95% by UV, [M+H]+ found: 269.3.
6.2.5 TR-FRET assay data for PhABit analogues PhABit analogues 10-19 were tested in a BRD4-BD1 TR-FRET assay as described in SI Section 2.5.1. SI Table 11: TR-FRET assay data for PhABit analogues
Compound pIC50 10 3.7 11 5.1 12 5.0 13 3.7 14 4.0 15 5.0 16 5.7 17 5.1 18 3.9 19 <3.6
6.3 Displacement of hit PhABits for BRD4-BD1 with (+)-JQ1 Example procedure: 150 nL of compound was transferred into a Greiner 384 low volume plate (#784076) using
a Labcyte Echo 555 Liquid Handler®. 15 µL of a solution containing BRD4-BD1 1 µM and (+)-JQ1 10 µM in PBS
was added to the wells containing competitor compound and incubated at 4 °C for 15 min. The plate was
irradiated at 302 nm for 10 min on ice. The plate was sealed, centrifuged (1000 rpm, 1 min) and sampled directly
for intact protein LC-MS analysis using the methods described in SI Section 2.6. Compounds which showed ≥50%
displacement were classified as being displaced. The results for the displacement are shown below:

26
SI Table 12: Displacement of hit PhABits to BRD4-BD1 using (+)-JQ1
Type of crosslinking No. of compounds Displaced (≥50%) 68
Not displaced 21
6.4 Liquid chromatography with tandem mass spectrometry (LC-MS/MS) studies to identify the site of crosslinking of hit PhABits Crosslinking site(s) were determined on recombinant human KRAS4BG12D and BRD4-BD1 using the following
protein constructs: KRas4B 1-169 G12D/C118S and BRD4-BD1 (BRD4 44-168) (GenScript/GSK collaboration).
Protein samples (3 µM) were incubated with a PhABit (200 µM) or DMSO in either 50 mM HEPES or PBS (10%)
for 15 min and subsequently irradiated for 5 min at 302 nm. Samples (1 µg) were separated by sodium dodecyl
sulfate–polyacrylamide gel electrophoresis (SDS-PAGE) to remove the excess of unbound compound. Bands
corresponding to KRAS4BG12D and BRD4-BD1 were excised and reduced with 10 mM TCEP (30 min at 65°C) in 100
mM ammonium bicarbonate. After removal of the reducing solution, samples were alkylated with 10 mM
iodoacetamide (30 min at room temperature) in 100 mM ammonium bicarbonate. Samples were digested for
16 hours at 37 °C with trypsin 1:20 E:S (2.5 µl trypsin (Promega) (20 µg/mL)) in 100 mM ammonium bicarbonate.
Following trypsin digestion, KRAS4BG12D samples were further digested with 1:20 E:S ApsN (2 µl AspN (Promega)
(25 µg/mL)) and BRD4-BD1 samples were further digested with 1:10 E:S Lys-C (5 µl Lys-C (Promega) (20 µg/mL)).
Samples were digested for 3 hours at 37 °C. After removal of the supernatant, peptides were extracted using
acetonitrile (2x 50 µl). Combined supernatants were concentrated under vacuum in a SpeeVac and acidified to
a final concentration of 0.1% formic acid prior to injection into the LC-MS system.
Digested samples were injected on an Easy nLC1000 ultra-high performance liquid chromatography (UHPLC)
system (Thermo Scientific). The nanoLC was interfaced to a Q- Exactive Hybrid Quadrupole-Orbitrap Mass
Spectrometer (Thermo Scientific). Peptides were separated on a 25 cm x 75 μm ID, Acclaim PepMap C18, 3 μm
particle column (Thermo Scientific) using a 40 min gradient of 2-30% acetonitrile/0.2% formic acid and a flow of
300 nL/min. MS-based peptide sequencing data were acquired using data dependent LC-MS/MS (top 10 method,
scan range 400-2000 m/z, resolution 70,000, automatic gain control (AGC) target 1e6). Higher-energy collisional
dissociation (HCD) MS/MS spectra were acquired at a resolution of 17500 (AGC target 5e4). The normalised
collision energy (CE) for HCD was set to either 23 or 30. A lower CE was used to preserve the integrity of the
bound PhABit and facilitate the identification of the modified site. Alternatively, samples were analysed with a
Parallel Reaction Monitoring (PRM) method using a 1.0 m/z isolation window on the precursor value and a CE
of 27.
Uninterpreted spectra were searched for peptide matches against the KRAS4BG12D or BRD4-BD1 sequences using
the Mascot software (Version 2.6.0) (Matrix Science) using a 5 ppm mass tolerance for peptide precursors and
20 mDa mass tolerance for fragment ions. Oxidation on methionine (M) and PhABit-N2 modification on any
residue were allowed as variable modifications. Carbamidomethylation on cysteine was used as fixed
modification. Labelled peptides identified by database search were analysed by targeted LC-MS/MS using a PRM
method and the MS/MS spectra manually validated to ensure exact assignment of the site of modification.

27
6.5 Crystallographic data of PhABit 2 bound to BRD4-BD1 5 µl of compound at 100 mM DMSO stock concentration was added to 25 µL of TEV-cleaved Brd4 (44-145) and
incubated on ice for 20 min. The complex was centrifuged at 4 °C for 15 min at 13 krpm on a benchtop centrifuge
before setting up in 100 nL + 100 nL sitting drops using a 96-well MRC plate. Crystals grown with a well solution
of 20% w/v polyethylene glycol (PEG) 3350, 0.2 M NaBr at 20 °C were cryoprotected using well solution with
20% ethylene glycol prior to flash freezing in liquid nitrogen. Data from a single crystal was collected at 100 K on
id30a1 at the European Synchrotron Research Facilities (ESRF) at Grenoble and processed to 1.44 Å using XDS10
and AIMLESS11,12 within AutoProc.13 A molecular replacement solution was determined using Phaser and a
previously determined in-house structure, as a starting model. The P212121 cell (α=β=γ=90˚, a=37.158 Å,
b=44.019 Å, c=78.198 Å) has one molecule in the asymmetric unit (ASU). Manual model building was performed
using COOT14 and refined using REFMAC15 with twin refinement within the CCP4 software suite.16 There was
clear difference density for the ligand in the acetylated lysine binding site, allowing the ligand to be well
modelled within the conserved site. There was good density for the core of the ligand, and although this was
weaker for the diazirine moiety, its placement was still clear. The statistics for the data collection and refined
co-ordinates are given in SI Table 13. The final crystal structures are deposited in the Protein Data Bank under
the accession codes XXX.
SI Table 13: Data collection statistics and refined coordinates of BRD4-BD1/PhABit 2 (* highest resolution shell
is shown in parenthesis)
(collection on a single
crystal)
BRD4-BD1 / PhABit 2
Data Collection Space group P212121
Cell dimensions a, b, c (Å) 37.158, 44.019, 78.198
() 90.000, 90.000, 90.000
Resolution (Å) 38.359-1.44 (1.469-1.44)
Rmerge 0.075 (0.431)
CC (1/2) 0.997 (0.779)
I/I 9.1 (2.1)
Completeness (%) 98.7 (99.3)
Redundancy 3.1 (3.0)
Refinement Resolution (Å) 38.359-1.444
No. reflections 71974 (3466)
No. uniq reflections 23412 (1152)
Rfree/ Rwork 0.210/0.185
No. atoms 1343
Protein 1066
Ligand/ion 22
Water 243
B-factors Protein 12.90
Ligand/ion 18.12
Water 25.84
R.m.s deviations Bond lengths (Å) 0.0034
Bond angles (º) 1.158

28
Fofc OMIT map around ligand 2Fofc OMIT map around ligand
Active site density shown contoured at ±3.0
sigma (blue/red), +1.5 sigma (cyan) Active site density shown contoured at +1.0 sigma
(blue), +0.5 sigma (cyan)
6.6 Development of a fragment PROTAC for BRD4
6.6.1 Synthetic schemes
SI Scheme 3: Synthesis of PROTACs. Reagents and conditions: a) HATU (1.15 equiv.), DIPEA (4 equiv.), DMF, rt, 2
h, R6=56%. b) HATU (1.25 equiv.), DIPEA (4 equiv.), DMF, rt, 16 h, P1=54%, P2=21%, P3=17%.

29
6.6.2 Synthesis of PROTACs
12-(((S)-1-((2S,4R)-4-hydroxy-2-((4-(4-methylthiazol-5-yl)benzyl)carbamoyl)pyrrolidin-1-yl)-3,3-dimethyl-1-
oxobutan-2-yl)amino)-12-oxododecanoic acid (R6)
To a solution of (2S,4R)-1-((S)-2-amino-3,3-dimethylbutanoyl)-4-hydroxy-N-(4-(4-methylthiazol-5-
yl)benzyl)pyrrolidine-2-carboxamide hydrochloride (R4, 405 mg, 0.867 mmol), dodecanedioic acid (R5, 599 mg,
2.60 mmol) and diisopropylethylamine (0.606 mL, 3.47 mmol) in N,N-dimethylformamide (DMF) (10 mL) was
added 1-[bis(dimethylamino)methylene]-1H-1,2,3-triazolo[4,5-b]pyridinium-3-oxide-hexafluoro phosphate
(379 mg, 0.997 mmol) at room temperature. The reaction mixture was stirred for 2 hours until completion. The
solution was concentrated under a stream of nitrogen and purified by mass directed Autoprep. The relevant
fractions were combined and concentrated to dryness under vacuum to afford 12-(((S)-1-((2S,4R)-4-hydroxy-2-
((4-(4-methylthiazol-5-yl)benzyl)carbamoyl)pyrrolidin-1-yl)-3,3-dimethyl-1-oxobutan-2-yl)amino)-12-
oxododecanoic acid (R6) (310 mg, 0.482 mmol, 56% yield) as a colourless oil. LC-MS (Method [CSH~2min_For]):
tR = 1.06 min, 65% by UV, [M+H]+ found: 641.5. Used without further purification.
N1-(3-(3,5-dimethylisoxazol-4-yl)phenyl)-N12-((S)-1-((2S,4R)-4-hydroxy-2-((4-(4-methylthiazol-5-
yl)benzyl)carbamoyl)pyrrolidin-1-yl)-3,3-dimethyl-1-oxobutan-2-yl)dodecanediamide (P1)
To a solution of 3-(3,5-dimethylisoxazol-4-yl)aniline (24 mg, 0.125 mmol), (R6) 12-(((S)-1-((2S,4R)-4-hydroxy-2-
((4-(4-methylthiazol-5-yl)benzyl)carbamoyl)pyrrolidin-1-yl)-3,3-dimethyl-1-oxobutan-2-yl)amino)-12-
oxododecanoic acid (70 mg, 0.109 mmol), and 1-[bis(dimethylamino)methylene]-1H-1,2,3-triazolo[4,5-
b]pyridinium-3-oxide-hexafluorophosphate (52 mg, 0.136 mmol) in N,N-dimethylformamide (DMF) (1.5 mL) was
added diisopropylethylamine (0.076 mL, 0.436 mmol). The solution was stirred in a microwave vial at rt
overnight. The reaction mixture was directly purified by mass directed AutoPrep on an XSelect C18 CSH column
using acetonitrile water with an ammonium bicarbonate modifier. Appropriate fractions were combined and
concentrated to dryness in vacuo to afford a clear solid, (P1) N1-(3-(3,5-dimethylisoxazol-4-yl)phenyl)-N12-((S)-
1-((2S,4R)-4-hydroxy-2-((4-(4-methylthiazol-5-yl)benzyl)carbamoyl)pyrrolidin-1-yl)-3,3-dimethyl-1-oxobutan-2-
yl)dodecanediamide (48 mg, 0.059 mmol, 54% yield). νmax (neat)/cm-1: 3289, 2925, 2854, 1626, 1538, 1432, 1244,

30
795; δH (400 MHz, d-CDCl3) 8.73 (1H, s), 7.79 (1H, s), 7.61 (1H, s), 7.47–7.32 (8H, m), 7.02–6.96 (1H, m), 6.22
(1H, d, J=8.8 Hz), 4.72 (1H, t, J=7.9 Hz), 4.61–4.51 (3H, m), 4.36 (1H, dd, J=14.9, 5.4 Hz), 4.09 (1H, d, J=11.5 Hz),
3.66–3.59 (1H, m), 2.53 (3H, s), 2.43–2.39 (1H, m), 2.42 (3H, s), 2.39–2.35 (2H, m), 2.29 (3H, s), 2.22–2.17 (2H,
m), 1.76–1.70 (2H, m), 1.63–1.55 (2H, m), 1.40–1.25 (13H, m), 0.95 (9H, s); δC (101 MHz, d-CDCl3) 173.9, 171.9,
171.8, 170.8, 165.4, 158.6, 150.5, 148.2, 138.7, 138.2, 131.8, 131.2, 130.8, 129.5, 129.3, 128.1, 124.6, 120.5,
118.7, 116.4, 70.0, 58.7, 57.5, 56.7, 43.2, 37.7, 36.4, 36.1, 35.0, 29.2, 29.2, 29.1, 29.0, 26.4, 25.5, 15.9, 11.6, 10.8;
LC-MS (Method [CSH~2min_For]): tR = 1.22 min, 94% by UV, [M+H+] found: 813.5; HRMS: (C45H60N6O6S) [M+H+]
requires: 813.4297, [M+H]+ found: 813.4376.
N1-(3-(3,5-dimethylisoxazol-4-yl)benzyl)-N12-((S)-1-((2S,4R)-4-hydroxy-2-((4-(4-methylthiazol-5-
yl)benzyl)carbamoyl)pyrrolidin-1-yl)-3,3-dimethyl-1-oxobutan-2-yl)dodecanediamide (P2)
To a solution of (3-(3,5-dimethylisoxazol-4-yl)phenyl)methanamine hydrochloride (30 mg, 0.125 mmol), (R6) 12-
(((S)-1-((2S,4R)-4-hydroxy-2-((4-(4-methylthiazol-5-yl)benzyl)carbamoyl)pyrrolidin-1-yl)-3,3-dimethyl-1-
oxobutan-2-yl)amino)-12-oxododecanoic acid (70 mg, 0.109 mmol), and 1-[bis(dimethylamino)methylene]-1H-
1,2,3-triazolo[4,5-b]pyridinium-3-oxide-hexafluorophosphate (52 mg, 0.136 mmol) in N,N-dimethylformamide
(DMF) (1.5 mL) was added diisopropylethylamine (0.076 mL, 0.436 mmol). The solution was stirred in a
microwave vial at rt overnight. The reaction mixture was directly purified by mass directed AutoPrep on an
XSelect C18 CSH column using acetonitrile water with an ammonium bicarbonate modifier. Appropriate
fractions were combined and concentrated to dryness in vacuo to afford a clear solid, (P2) N1-(3-(3,5-
dimethylisoxazol-4-yl)benzyl)-N12-((S)-1-((2S,4R)-4-hydroxy-2-((4-(4-methylthiazol-5-yl)benzyl)carbamoyl)
pyrrolidin-1-yl)-3,3-dimethyl-1-oxobutan-2-yl)dodecanediamide (19 mg, 0.023 mmol, 21% yield). νmax (neat)/cm-
1: 3289, 2925, 2854, 1626, 1537, 1432, 1244, 795; δH (400 MHz, d-CDCl3) 8.69–8.67 (1H, m), 7.43–7.33 (6H, m),
7.27 (1H, d, J=7.8 Hz), 7.18–7.15 (2H, m), 6.25 (1H, d, J=8.6 Hz), 6.06 (1 H, t, J=5.7 Hz), 4.71 (1H, t, J=7.9 Hz), 4.60–
4.48 (5H, m), 4.35 (1H, dd, J=14.9, 5.4 Hz), 4.09 (1H, d, J=11.5 Hz), 3.63 (1H, dd, J=11.4, 3.7 Hz), 2.52 (3H, s), 2.43–
2.39 (1H, m), 2.40 (3H, s), 2.26–2.18 (7H, m), 1.67–1.56 (4H, m), 1.34–1.23 (13H, m), 0.95 (9H, s); δC (101 MHz,
d-CDCl3) 173.9, 173.1, 171.9, 170.7, 165.3, 158.6, 150.3, 148.5, 139.3, 138.1, 131.0, 130.9, 129.5, 129.1, 128.3,
128.1, 126.8, 116.4, 70.0, 58.5, 57.5, 56.7, 43.3, 43.3, 36.7, 36.4, 35.9, 34.9, 29.2, 29.1, 29.1, 26.4, 25.7, 25.5,
16.0, 11.6, 10.8; LC-MS (Method [CSH~2min_For]): tR = 1.16 min, 94% by UV, [M+H+] found: 827.7; HRMS:
(C46H62N6O6S) [M+H]+ requires: 827.4453, [M+H+] found: 827.4528.

31
N1-((S)-1-((2S,4R)-4-hydroxy-2-((4-(4-methylthiazol-5-yl)benzyl)carbamoyl)pyrrolidin-1-yl)-3,3-dimethyl-1-
oxobutan-2-yl)-N12-((3'-hydroxy-[1,1'-biphenyl]-3-yl)methyl)dodecanediamide (P3)
To a solution of 3'-(aminomethyl)-[1,1'-biphenyl]-3-ol (25 mg, 0.125 mmol), (R6) 12-(((S)-1-((2S,4R)-4-hydroxy-
2-((4-(4-methylthiazol-5-yl)benzyl)carbamoyl)pyrrolidin-1-yl)-3,3-dimethyl-1-oxobutan-2-yl)amino)-12-
oxododecanoic acid (70 mg, 0.109 mmol), and 1-[bis(dimethylamino)methylene]-1H-1,2,3-triazolo[4,5-
b]pyridinium-3-oxide-hexafluorophosphate (52 mg, 0.136 mmol) in N,N-dimethylformamide (DMF) (1.5 mL) was
added diisopropylethylamine (0.076 mL, 0.436 mmol). The solution was stirred in a microwave vial at rt
overnight. The reaction mixture was directly purified by mass directed AutoPrep on an XSelect C18 CSH column
using acetonitrile water with an ammonium bicarbonate modifier. The appropriate fractions were combined
and concentrated to dryness in vacuo to afford a clear solid, (P3) N1-((S)-1-((2S,4R)-4-hydroxy-2-((4-(4-
methylthiazol-5-yl)benzyl)carbamoyl)pyrrolidin-1-yl)-3,3-dimethyl-1-oxobutan-2-yl)-N12-((3'-hydroxy-[1,1'-
biphenyl]-3-yl)methyl)dodecanediamide (15 mg, 0.018 mmol, 17% yield). νmax (neat)/cm-1: 3289, 2925, 2854,
1626, 1537, 1433, 1244, 795; δH (400 MHz, d-CDCl3) 8.70–8.67 (1H, m), 7.47–7.43 (2H, m), 7.38–7.31 (5H, m),
7.27–7.18 (2H, m), 7.09–7.04 (2H, m), 6.87–6.81 (1H, m), 6.35 (1H, d, J=9.0 Hz), 6.25 (1H, t, J=5.9 Hz), 4.72 (1H,
t, J=8.1 Hz), 4.61–4.43 (5H, m), 4.34–4.27 (1H, m), 4.11–4.06 (1H, m), 3.64 (1H, dd, J=11.2, 3.4 Hz), 2.49 (3H, s),
2.43–2.39 (1H, m), 2.24–2.11 (6H, m), 1.66–1.51 (4H, m), 1.34–1.09 (13H, m), 0.97 (9H, s); δC (101 MHz, d-CDCl3)
174.2, 173.5, 171.9, 171.0, 157.1, 150.4, 148.4, 142.3, 141.6, 139.0, 138.1, 131.7, 130.8, 129.9, 129.4, 129.0,
128.0, 126.8, 126.3, 126.2, 118.7, 114.7, 114.4, 114.2, 110.0, 70.1, 58.9, 57.6, 57.0, 43.5, 43.2, 36.7, 36.4, 36.3,
35.2, 28.9, 28.9, 28.8, 28.8, 26.4, 25.7, 25.4, 16.0; LC-MS (Method [CSH~2min_For]): tR = 1.16 min, 98% by UV,
[M+H+] found: 824.5; HRMS: (C47H61N5O6S) [M+H+] requires: 824.4345, [M+H]+ found: 824.4420.
6.6.3 TR-FRET assay data for PROTACs
PROTACs P1-P3 and P1-E were tested in a BRD4-BD1 TR-FRET assay as described in SI Section 2.5.1. SI Table 14: TR-FRET assay data for PROTACs (n=2, *n=1)
Compound pIC50 P1 5.5 P2 5.9 P3 4.7*
6.6.4 HiBiT assay protocol
Degradation of BRD4 protein in human embryonic kidney (HEK293) cells treated with PROTACs was quantified
using the Nano-Glo® HiBiT Lytic Detection System (Promega) in 384 well assay plate format.

32
A clonal HEK293-derived cell line was first established with a clustered regularly interspaced short palindromic
repeats (CRISPR)/Cas9 modified BRD4 gene to express BRD4 protein including an 11 amino acid HiBiT tag at the
amino-terminus. The cell line was heterozygotic for the HiBiT modification. Cells were cryo-preserved in aliquots
at a density of approximately 20 million cells per mL in 90% foetal bovine serum (FBS), 10% DMSO and stored at
-150 oC. 100 mM DMSO stock solutions of PROTACs were prepared and diluted across a 20 concentration, 2-fold
increment range, and 25 nL dispensed into a white, opaque-bottomed 384 well assay plate (Thermofisher) using
an acoustic Labcyte Echo 555 Liquid Handler®. A cryo-preserved vial of cells was rapidly thawed and suspended
in 30 mL of assay medium (FluoroBrite™ Dulbecco’s Modified Eagle Media (DMEM) supplemented with 10%
heat inactivated FBS, penicillin 50 µg /mL, 2 mM GlutaMAXTM and streptomycin 50 µg/mL (Thermofisher)). The
cell suspension was centrifuged at 400 x g for 5 min and the pellet resuspended in assay medium. 25 µL of cell
suspension containing 10,000 cells was dispensed into each well of the assay plate containing the PROTAC
compounds, which was then incubated for 18 h at 37 oC / 5% CO2. Control wells were included on each assay
plate: assay medium without cells (no BRD4 remaining 100% effect control), and cells treated with DMSO vehicle
only (0% effect control). 25 µL of Nano-Glo® HiBiT lysis buffer supplemented with LgBiT protein and Nano-Glo®
substrate (Promega) was added to each well and the plate shaken at 500 rpm for 10 min at room temperature.
The intensity of luminescence was measured using a PHERAstar microplate reader (BMG Labtech) and the
percentage BRD4 protein remaining in each well calculated by normalising the raw luminescence value to the
above stated control wells. Using GraphPad Prism version 5.0, curves were fitted to the data using the
‘log(inhibitor) vs response (three parameters)’ model.
6.6.4.1 Proteasome Inhibition
Cells (cell suspension as above) were pre-incubated with epoxomicin (1 µM) at 37 oC for 1 h before dispensing
into the assay plate. Subsequent assay incubation time was reduced from 18 h to 4.5 h to minimise potential
cytotoxicity, and the intensity of luminescence was measured as above. The proteasome inhibition assays were
conducted in parallel with a DMSO (no epoxomicin) control plate, following the same general procedure.
6.6.4.2 Cytotoxicity/cell viability
Cellular ATP levels were measured using the CellTiter-Glo® Luminescent Cell Viability Assay (Promega). ATP
assays were conducted in parallel with BRD4 HiBiT assays on a separate assay plate on the same day, following
the same general procedure detailed above.

33
7. PhotoAffinity Screening Technology
7.1 Selection of elaborated compounds
Acetyl analogues of hit PhABits were generated in silico as shown in SI Scheme 4. A similarity search was
performed on the GSK compound collection using ChemAxon Chemical Hashed fingerprints, and a dissimilarity
threshold of 0.3, implemented in Pipeline Piot. The top ~100 most similar compounds (MW≤400) for each hit
were selected for screening.
SI Scheme 4: Schematic of the in silico generation of the acetyl analogues of hit PhABits.
A number of the elaborated compounds derived from hit PhABits showed >50% displacement of PhABit 2
crosslinking to BRD4-BD1 in the single-shot screen (SI Section 7.2). A selection of these compounds were chosen
for a second iteration of elaboration. A similarity search was performed on the GSK compound collection using
ChemAxon Chemical Hashed fingerprints, and a dissimilarity threshold of 0.3, as implemented in Pipeline Piot.
The top ~100 most similar compounds (MW≤400) for each hit were selected for screening.
7.2 General Experimental for single-shot screening Example procedure: 150 nL of competitor compound (10 mM) was transferred into a Greiner 384 PP F-bottom
plate (#781201) using a Labcyte Echo 555 Liquid Handler®. 15 µL of a solution containing BRD4-BD1 (1 µM) and
2 (200 µM) in PBS was added to the wells containing competitor compound and incubated at 4 °C for 15 min.
The plate was irradiated at 302 nm for 10 min on ice. The plate was sealed, centrifuged (1000 rpm, 1 min) and
sampled directly for intact protein LC-MS analysis using the methods described in SI Section 2.6. The percentage
inhibition of the crosslinking yield of 2 to BRD4-BD1 was calculated for each compound, based on the average
of DMSO control samples. Samples that did not inject correctly on the LC-MS or had uninterpretable data were
removed from the analysis.
7.3 Photoaffinity assay against BRD4-BD1
40 elaborated compounds from the single shot screening were selected for full concentration response
photoaffinity screening.
Irradiation and mass spectrometry analysis by RapidFireTM was carried out following the general experimental
procedures described in SI Section 2.1 and SI Section 2.7 respectively.
Example procedure: 150 nL of competitor compound (variable concentration in DMSO) was transferred into a
Greiner 384 low volume plate (#784076) using a Labcyte Echo 555 Liquid Handler®. 15 µL of a solution containing
BRD4-BD1 protein (3 µM) and 2 (200 µM) in PBS buffer was added to the wells containing competitor compound
and incubated at 4 °C for 15 min. The plate was irradiated at 302 nm for 10 min on ice, and diluted up to 45 µL
with water. The plate was sealed, centrifuged (1000 rpm, 1 min) and sampled directly for analysis by RapidFire®

34
using the methods described in SI Section 2.7. This experiment was performed for compounds 20 to 59 against
BRD4-BD1 recombinant protein, in triplicate.
7.3.1 Data tables of crosslinking yields from the photoaffinity displacement assay
The crosslinking yields of PhABit 2 with BRD4-BD1 in the displacement assay were extracted using the method
described in SI Section 2.7. Crosslinking yields for each well were normalised to the DMSO control for that row
(SI Table 15). These values were plotted in Graphpad Prism 5.0.4 software to generate concentration response
curves and IC50 values. Lines were fit with non-linear regression using the ‘log(inhibitor) vs response (three
parameters)’ model implemented in Prism to calculate pIC50 values (SI Table 16). The curves were constrained
to have a maximum of 1. Blank wells arose from sample injection failure during analysis. The compounds were
also tested in a BRD4-BD1 TR-FRET assay and this data is included in SI Table 16. Compounds that gave a pIC50
value out of the limits of one of the assays were not included in the correlation graph (Figure 4F). An additional
compound, 37, was also removed due to uninterpretable MS data. A modified Cheng-Prusoff equation was used
to correct the pIC50 values generated in the photoaffinity displacement assay to the same scale as the TR-FRET
assay, using the KD of 2.
Cheng-Prusoff: Ki = IC50 / (1 + ([S] / KD))
SI Table 15: Normalised crosslinking yields of the 40 elaborated compounds in triplicate
N1 N2 N3 N1 N2 N3 Concentration of
competitive binder (µM)
20 21
100 0.65 0.76 0.69 0.61 0.53 0.61 50 0.55 0.58 0.69 0.80 0.65 0.66 25 0.47 0.52 0.60 0.89 0.79 0.90
12.5 0.48 0.56 0.52 0.81 0.94 1.04 6.25 0.63 0.68 0.70 0.96 1.06 1.03 3.13 0.80 0.84 0.00 1.00 1.06 1.04 1.56 0.89 0.89 0.94 1.01 1.05 1.01
0 1.00 1.00 1.00 1.00 1.00 1.00 22 23
100 0.32 0.38 0.28 0.27 0.31 0.34 50 0.25 0.22 0.22 0.48 0.48 0.48 25 0.27 0.34 0.30 0.60 0.61 0.61
12.5 0.38 0.37 0.35 0.73 0.78 0.78 6.25 0.52 0.47 0.49 0.82 0.82 0.86 3.13 0.63 0.61 0.63 0.87 0.87 0.90 1.56 0.77 0.71 0.81 0.92 0.93 0.94
0 1.00 1.00 1.00 1.00 1.00 1.00 24 25
100 0.13 0.14 0.14 0.23 0.18 0.18 50 0.22 0.24 0.21 0.30 0.27 0.24 25 0.30 0.32 0.30 0.39 0.39 0.33
12.5 0.43 0.46 0.43 0.55 0.47 0.49 6.25 0.60 0.61 0.57 0.73 0.70 0.65 3.13 0.73 0.75 0.72 0.84 0.82 0.82 1.56 0.83 0.81 0.76 1.01 0.89 0.88
0 1.00 1.00 1.00 1.00 1.00 1.00

35
26 27 100 0.12 0.15 0.12 0.28 0.29 0.27 50 0.20 0.21 0.17 0.37 0.37 0.35 25 0.30 0.34 0.29 0.46 0.39 0.45
12.5 0.42 0.49 0.45 0.56 0.53 0.61 6.25 0.48 0.68 0.62 0.70 0.68 0.75 3.13 0.73 0.83 0.81 0.83 0.84 0.99 1.56 0.85 0.90 0.83 0.88 0.91 0.88
0 1.00 1.00 1.00 1.00 1.00 1.00 28 29
100 0.19 0.18 0.17 0.27 0.27 0.28 50 0.24 0.27 0.24 0.43 0.45 0.42 25 0.33 0.38 0.32 0.53 0.58 0.59
12.5 0.49 0.49 0.47 0.64 0.72 0.76 6.25 0.62 0.65 0.64 0.77 0.83 0.87 3.13 0.71 0.80 0.74 0.87 0.93 0.89 1.56 0.86 0.85 0.84 0.92 0.96 0.95
0 1.00 1.00 1.00 1.00 1.00 1.00 30 31
100 0.19 0.20 0.16 0.36 0.36 0.33 50 0.28 0.29 0.24 0.48 0.53 0.48 25 0.38 0.40 0.32 0.58 0.68 0.60
12.5 0.51 0.54 0.49 0.75 0.83 0.73 6.25 0.66 0.70 0.68 0.87 0.98 0.80 3.13 0.76 0.84 0.82 0.91 1.01 0.88 1.56 0.84 0.90 0.91 0.99 1.02 0.94
0 1.00 1.00 1.00 1.00 1.00 1.00 32 33
100 0.27 0.31 0.34 0.54 0.44 0.41 50 0.48 0.48 0.48 0.69 0.57 0.56 25 0.60 0.61 0.61 0.76 0.71 0.76
12.5 0.73 0.78 0.78 0.87 0.84 0.85 6.25 0.82 0.82 0.86 0.92 0.95 0.95 3.13 0.87 0.87 0.90 1.02 0.97 1.00 1.56 0.92 0.93 0.94 0.97 0.90 1.03
0 1.00 1.00 1.00 1.00 1.00 1.00
34 35 100 0.62 0.62 0.66 0.28 0.22 0.34 50 0.67 0.62 0.65 0.37 0.33 0.38 25 0.71 0.73 0.71 0.51 0.51 0.56
12.5 0.85 0.77 0.75 0.71 0.67 0.67 6.25 0.84 0.86 0.87 0.79 0.80 0.77 3.13 0.88 0.90 0.92 0.93 0.87 0.92 1.56 0.91 0.95 0.96 0.92 0.95 0.96
0 1.00 1.00 1.00 1.00 1.00 1.00 36 37
100 0.32 0.36 0.35 0.26 0.35 0.24 50 0.45 0.50 0.54 0.12 0.09 0.12 25 0.63 0.66 0.65 0.17 0.12 0.15
12.5 0.73 0.77 0.75 0.23 0.23 0.25 6.25 0.82 0.85 0.88 0.32 0.32 0.35 3.13 0.90 0.97 0.95 0.52 0.49 0.50 1.56 0.87 0.93 0.96 0.71 0.62 0.65
0 1.00 1.00 1.00 1.00 1.00 1.00 38 39
100 0.80 0.50 0.57 1.40 1.38 1.10 50 0.56 0.69 0.74 1.18 1.22 1.00

36
25 0.68 0.81 0.87 1.09 1.17 0.99 12.5 0.78 0.88 0.90 1.05 1.10 0.98 6.25 0.81 0.88 0.92 1.03 1.10 1.01 3.13 0.96 0.95 0.93 0.90 1.10 1.00 1.56 0.98 0.99 0.94 1.04 1.04 1.00
0 1.00 1.00 1.00 1.00 1.00 1.00 40 41
100 0.34 0.33 0.41 0.46 0.44 0.42 50 0.53 0.47 0.56 0.60 0.61 0.59 25 0.61 0.59 0.69 0.70 0.77 0.73
12.5 0.79 0.76 0.79 0.82 0.83 0.85 6.25 0.87 0.79 0.89 0.85 0.95 0.96 3.13 0.90 0.90 0.90 0.95 1.00 0.97 1.56 0.95 0.94 0.97 1.00 1.02 0.98
0 1.00 1.00 1.00 1.00 1.00 1.00 42 43
100 0.61 0.57 0.52 0.60 0.63 0.59 50 0.75 0.73 0.62 0.75 0.83 0.71 25 0.83 0.83 0.65 0.85 0.90 0.86
12.5 0.92 0.99 0.86 0.91 0.94 0.91 6.25 0.89 0.95 0.89 0.97 0.96 0.94 3.13 1.05 0.95 0.96 0.98 0.99 1.02 1.56 1.01 0.91 0.96 1.08 0.98 1.00
0 1.00 1.00 1.00 1.00 1.00 1.00 44 45
100 0.72 0.80 0.71 0.68 0.54 0.51 50 0.85 0.92 0.90 0.71 0.69 0.64 25 0.84 0.95 0.92 0.80 0.79 0.75
12.5 0.92 0.96 1.01 0.84 0.91 0.82 6.25 0.95 1.01 0.98 0.93 0.96 0.88 3.13 1.01 1.02 1.01 0.94 1.01 0.94 1.56 1.01 0.96 1.00 0.97 0.89 1.01
0 1.00 1.00 1.00 1.00 1.00 1.00 46 47
100 0.66 0.61 0.50 0.77 0.85 0.85 50 0.79 0.82 0.70 0.86 0.93 1.01 25 0.88 0.89 0.85 0.91 0.96 1.02
12.5 0.94 0.98 1.03 0.89 0.91 1.03 6.25 0.91 1.00 0.98 0.95 0.95 1.04 3.13 0.94 1.09 1.07 0.83 0.97 1.06 1.56 1.01 1.04 1.00 0.94 1.05
0 1.00 1.00 1.00 1.00 1.00 1.00 48 49
100 0.76 0.77 0.64 0.53 0.54 0.56 50 0.95 0.91 0.77 0.60 0.65 0.72 25 1.12 1.10 0.98 0.77 0.79 0.82
12.5 1.09 1.15 1.00 0.84 0.88 0.85 6.25 0.99 1.14 1.05 0.91 0.90 0.94 3.13 1.03 1.17 1.04 0.98 0.95 0.94 1.56 1.05 1.08 0.97 0.97 0.97 1.00
0 1.00 1.00 1.00 1.00 1.00 1.00 50 51
100 1.23 1.24 1.39 1.00 1.09 1.03 50 1.10 1.29 1.15 1.06 1.08 1.04 25 1.05 1.10 1.07 1.01 1.13 0.88
12.5 1.05 1.19 1.11 1.01 1.09 0.96 6.25 1.01 1.10 1.08 0.94 1.07 0.95

37
3.13 1.04 1.10 1.09 1.02 1.04 0.87 1.56 1.02 1.13 1.03 1.00 1.06 1.02
0 1.00 1.00 1.00 1.00 1.00 1.00 52 53
100 0.85 1.10 0.92 0.75 0.73 0.72 50 0.89 1.04 1.01 0.89 0.81 0.83 25 0.90 1.01 1.00 0.91 0.89 0.86
12.5 0.89 1.02 1.00 0.99 0.90 0.92 6.25 0.91 1.07 1.03 0.99 0.94 0.98 3.13 1.01 1.03 1.06 1.02 0.97 1.03 1.56 1.01 1.03 1.08 0.85 0.97 0.99
0 1.00 1.00 1.00 1.00 1.00 1.00 54 55
100 0.69 0.69 0.74 0.72 0.71 0.55 50 0.84 0.79 0.84 0.86 0.91 0.79 25 0.87 0.87 0.94 0.91 0.94 0.87
12.5 0.95 0.96 0.96 0.91 0.76 0.95 6.25 0.94 0.91 1.02 0.97 1.06 0.97 3.13 0.97 0.97 1.03 1.00 0.98 1.03 1.56 1.01 0.99 1.07 0.97 0.94 1.01
0 1.00 1.00 1.00 1.00 1.00 1.00 56 57
100 0.83 0.85 0.96 0.77 0.79 0.78 50 0.94 0.91 1.00 0.96 0.88 0.91 25 0.90 0.95 1.03 0.94 0.98 0.96
12.5 0.95 0.97 1.05 0.99 1.01 0.94 6.25 0.94 0.95 1.00 0.95 0.91 0.97 3.13 1.00 0.96 0.98 1.01 1.04 1.05 1.56 0.96 0.98 0.98 1.00 0.99 0.99
0 1.00 1.00 1.00 1.00 1.00 1.00 58 59
100 0.72 0.72 0.68 0.92 0.94 0.93 50 0.88 0.84 0.87 0.97 0.95 1.05 25 0.94 0.96 0.95 0.97 0.97 1.06
12.5 0.96 0.99 0.96 1.00 0.97 1.05 6.25 0.98 0.98 0.96 1.00 0.99 1.02 3.13 0.95 0.97 0.99 1.01 1.01 1.02 1.56 0.98 1.02 0.97 1.03 1.05 1.07
0 1.00 1.00 1.00 1.00 1.00 1.00
SI Table 16: pIC50 values generated from BRD4-BD1 TR-FRET assay (n≥2) and pKi values from the photoaffinity assay of 40 selected elaborated compounds
Compound TR-FRET (pIC50)
Photoaffinity assay (pIC50)
Cheng-Prusoff corrected photoaffinity assay (pKi)
20 6.1 5.6 5.9 21 6.1 <4.0 <4.2 22 5.7 5.5 5.8 23 5.7 5.4 5.7 24 5.5 5.1 5.4 25 5.5 4.9 5.2 26 5.4 5.0 5.3 27 5.4 4.9 5.2 28 5.3 5.1 5.4 29 5.2 4.6 4.9 30 5.0 5.0 5.3

38
31 5.0 4.4 4.7 32 4.9 4.4 4.7 33 4.9 4.2 4.5 34 4.8 4.9 5.2 35 4.8 4.7 5.0 36 4.8 4.4 4.7 37 4.7 5.7 6.0 38 4.7 4.6 4.9 39 4.7 <4.0 <4.2 40 4.6 4.4 4.7 41 4.6 4.2 4.5 42 4.6 4.2 4.5 43 4.6 <4.0 <4.2 44 4.6 <4.0 <4.2 45 4.5 4.3 4.7 46 4.5 <4.0 <4.2 47 4.4 <4.0 <4.2 48 4.4 <4.0 <4.2 49 <4.3 4.3 4.6 50 <4.3 <4.0 <4.2 51 <4.3 <4.0 <4.2 52 <4.3 <4.0 <4.2 53 <4.3 <4.0 <4.2 54 <4.3 <4.0 <4.2 55 <4.3 <4.0 <4.2 56 <4.3 <4.0 <4.2 57 <4.3 <4.0 <4.2 58 <4.3 <4.0 <4.2 59 <4.3 <4.0 <4.2
7.4 Displacement assay against KRas
7.4.1 Synthesis of competitor compounds 64 and 65
Compounds 64 and 65 were synthesised following the literature procedures.17
(S)-N-(2-((1H-indol-3-yl)methyl)-1H-benzo[d]imidazol-5-yl)pyrrolidine-2-carboxamide (64)
To a solution of 2-((1H-indol-3-yl)methyl)-1H-benzo[d]imidazol-5-amine (44 mg, 0.168 mmol), (tert-
butoxycarbonyl)-L-proline (39.7 mg, 0.185 mmol), and 1-[bis(dimethylamino)methylene]-1H-1,2,3-triazolo[4,5-
b]pyridinium-3-oxide-hexafluorophosphate (80 mg, 0.210 mmol) in N,N-dimethylformamide (1.5 mL) was added
diisopropylethylamine (0.117 mL, 0.671 mmol). The solution was stirred in a microwave vial at rt overnight. The
reaction mixture was directly purified by mass directed AutoPrep on an XSelect C18 CSH column using
acetonitrile water with an ammonium bicarbonate modifier. The appropriate fractions were combined and
concentrated to dryness in vacuo. The residue was redissolved in DCM (3 mL) and TFA (0.258 mL, 3.35 mmol)
was added. The reaction mixture was stirred overnight and concentrated to dryness in vacuo. The residue was

39
purified by mass directed AutoPrep on an XSelect C18 CSH column using acetonitrile water with an ammonium
bicarbonate modifier. The appropriate fractions were combined and concentrated to dryness in vacuo to afford
an off-white solid, (64) (S)-N-(2-((1H-indol-3-yl)methyl)-1H-benzo[d]imidazol-5-yl)pyrrolidine-2-carboxamide
(32 mg, 0.089 mmol, 53% yield). δH (400 MHz, methanol-d4) 7.90–7.86 (1H, m), 7.46–4.40 (2H, m), 7.34 (1H, d,
J=8.4 Hz), 7.25–7.17 (2H, m), 7.10–7.05 (1H, m), 6.98–6.91 (1H, m), 4.35 (2H, s), 3.79–3.73 (1H, m), 3.08–2.91
(2H, m), 2.25–2.14 (1H, m), 1.94–1.83 (1H, m), 1.82–1.74 (2H, m); LC-MS (Method [CSH~2min_HPH]): tR = 0.77
min, 100% by UV, [M+H+] found: 360.2.
(2S,3S)-N-(2-((1H-indol-3-yl)methyl)-1H-benzo[d]imidazol-5-yl)-2-amino-3-methylpentanamide (65)
To a solution of 2-((1H-indol-3-yl)methyl)-1H-benzo[d]imidazol-5-amine (44 mg, 0.168 mmol), (tert-
butoxycarbonyl)-L-isoleucine (42.7 mg, 0.185 mmol), and 1-[bis(dimethylamino)methylene]-1H-1,2,3-
triazolo[4,5-b]pyridinium-3-oxide-hexafluorophosphate (80 mg, 0.210 mmol) in N,N-dimethylformamide (1.5
mL) was added diisopropylethylamine (0.117 mL, 0.671 mmol). The solution was stirred in a microwave vial at
rt overnight. The reaction mixture was directly purified by mass directed AutoPrep on an XSelect C18 CSH column
using acetonitrile water with an ammonium bicarbonate modifier. The appropriate fractions were combined
and concentrated to dryness in vacuo. The residue was redissolved in DCM (3 mL) and TFA (0.258 mL, 3.35 mmol)
was added. The reaction mixture was stirred overnight and concentrated to dryness in vacuo. The residue was
purified by mass directed AutoPrep on an XSelect C18 CSH column using acetonitrile water with an ammonium
bicarbonate modifier. The appropriate fractions were combined and concentrated to dryness in vacuo to afford
a white solid, (65) (2S,3S)-N-(2-((1H-indol-3-yl)methyl)-1H-benzo[d]imidazol-5-yl)-2-amino-3-
methylpentanamide (5.5 mg, 0.015 mmol, 9% yield). δH (400 MHz, methanol-d4) 7.90–7.85 (1H, m), 7.46–7.42
(2H, m), 7.37 (1H, d, J=7.9 Hz), 7.28–7.20 (2H, m), 7.13–7.07 (1H, m), 7.00–6.94 (1H, m), 4.40–4.35 (2H, m), 3.34–
3.28 (1H, m), 1.86–1.77 (1H, s), 1.69–1.58 (1H, m), 1.29–1.20 (1H, m), 1.06–1.00 (3H, m), 0.96 (3H, t, J=7.4 Hz);
LC-MS (Method [CSH~2min_HPH]): tR = 0.86 min, 98% by UV, [M+H+] found: 376.3.
7.4.2 General procedure
Compounds 64 and 65 were selected for full concentration response photoaffinity screening. Irradiation and
mass spectrometer analysis by Agilent ToF MS was carried out following the general experimental procedures
described previously in SI Section 2.1 and SI Section 2.6 respectively.
Example procedure: 150 nL of competitor compound (variable concentration in DMSO) was transferred into a
Greiner 384 low volume plate (#784076) using a Labcyte Echo 555 Liquid Handler®. 15 µL of a solution containing
KRasG12D protein (1 µM) and 62 (1 mM) in PBS buffer was added to the wells containing competitor compound
and incubated at 4 °C for 15 min. The plate was irradiated at 302 nm for 10 min on ice. The plate was sealed,
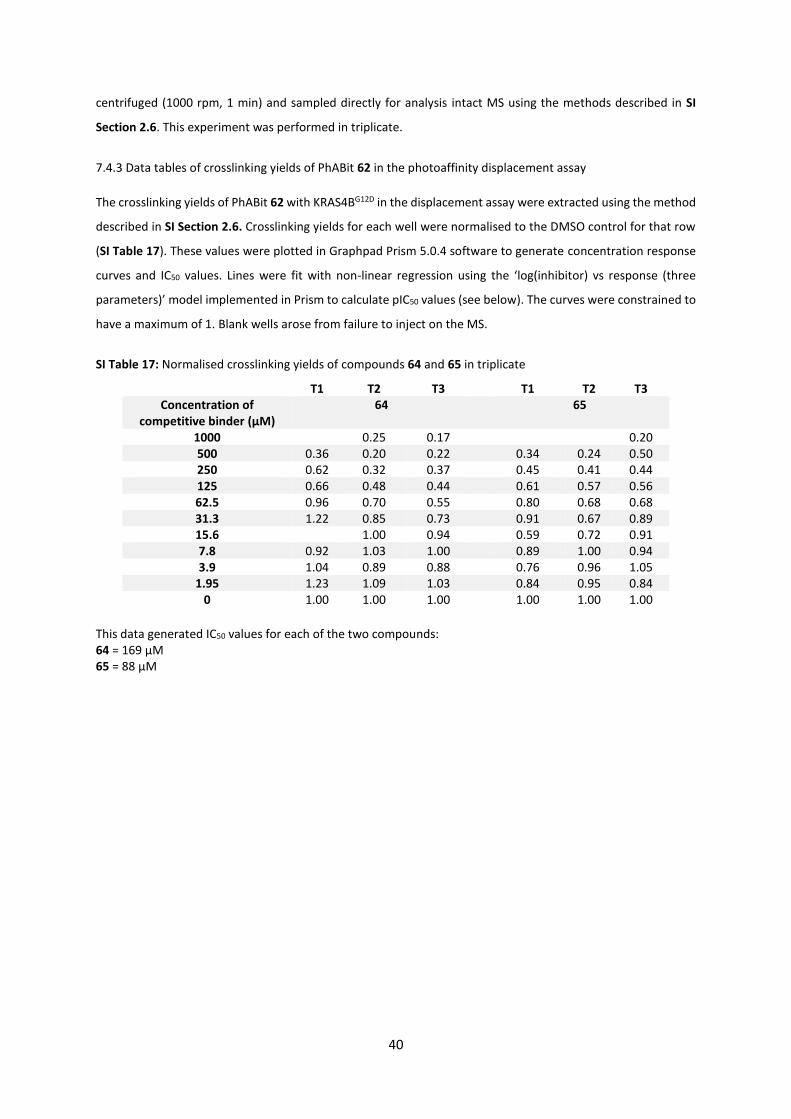
40
centrifuged (1000 rpm, 1 min) and sampled directly for analysis intact MS using the methods described in SI
Section 2.6. This experiment was performed in triplicate.
7.4.3 Data tables of crosslinking yields of PhABit 62 in the photoaffinity displacement assay
The crosslinking yields of PhABit 62 with KRAS4BG12D in the displacement assay were extracted using the method
described in SI Section 2.6. Crosslinking yields for each well were normalised to the DMSO control for that row
(SI Table 17). These values were plotted in Graphpad Prism 5.0.4 software to generate concentration response
curves and IC50 values. Lines were fit with non-linear regression using the ‘log(inhibitor) vs response (three
parameters)’ model implemented in Prism to calculate pIC50 values (see below). The curves were constrained to
have a maximum of 1. Blank wells arose from failure to inject on the MS.
SI Table 17: Normalised crosslinking yields of compounds 64 and 65 in triplicate
T1 T2 T3 T1 T2 T3 Concentration of
competitive binder (µM) 64 65
1000 0.25 0.17 0.20 500 0.36 0.20 0.22 0.34 0.24 0.50 250 0.62 0.32 0.37 0.45 0.41 0.44 125 0.66 0.48 0.44 0.61 0.57 0.56 62.5 0.96 0.70 0.55 0.80 0.68 0.68 31.3 1.22 0.85 0.73 0.91 0.67 0.89 15.6 1.00 0.94 0.59 0.72 0.91 7.8 0.92 1.03 1.00 0.89 1.00 0.94 3.9 1.04 0.89 0.88 0.76 0.96 1.05
1.95 1.23 1.09 1.03 0.84 0.95 0.84 0 1.00 1.00 1.00 1.00 1.00 1.00
This data generated IC50 values for each of the two compounds: 64 = 169 µM 65 = 88 µM

41
8. References
1 Chung, C. W. et al. Discovery and characterization of small moelcule inhibitors of the BET family bromodomains. J. Med. Chem 54, 3827-3838 (2011).
2 Law, R. P. et al. Discovery of Tetrahydroquinoxalines as Bromodomain and Extra-Terminal Domain (BET) Inhibitors with Selectivity for the Second Bromodomain. J. Med. Chem. 61, 4317-4334 (2018).
3 Camurri, G. & Zaramella, A. High-Throughput Liquid Chromatography_Mass Spectrometry Method for the Determination of the Chromatographic Hydrophobicity Index. Anal. Chem. 73, 3716-3722 (2001).
4 Robinson, M. W. et al. Use of Calculated Physicochemical Properties to Enhance Quantitative Response When Using Charged Aerosol Detection. Anal. Chem. 89, 1772-1777 (2017).
5 Chakravorty, S. et al. Nuisance compounds, PAINS filters, and dark chemical matter in the GSK HTS collection. SLAS Discov. 23, 532-535 (2018).
6 Jarvis, R. A. & Patrick, E. A. Clustering Using a Similarity Measure Based on Shared Nearest Neighbors. IEEE Trans. Comput. C22, 1025-1034 (1973).
7 ChemAxon. 8 Molecular Operating Environment (MOE), Chemical Computing Group Inc, (2016) 9 Chen, H. et al. ProSAR: A new methodology for combinatorial library design. J. Chem. Inf. Model. 49,
603-614 (2009). 10 Kabsch, W. XDS. Acta. Cryst. D66, 125-132 (2010). 11 Evans, P. R. Data reduction. Proceedings of CCP4 Study Weekend, 144-122 (1993). 12 Evans, P. R. & Murshudov, G. N. How good are my data and what is the resolution. Acta. Cryst. 69,
1204-1214 (2013). 13 Vonrhein, C. et al. Data processing and analysis with the autoPROC toolbox. Acta. Cryst. D67, 293-302
(2011). 14 Emsley, P. & Cowtan, K. Coot: model-building tools for molecular graphics. Acta. Cryst. D60, 2126-2132
(2004). 15 Murshudov, G. N., Vagin, A. A. & Dodson, E. J. Acta. Cryst. D53, 240-255 (1997). 16 Winn, M. D. et al. Overview of the CCP4 suite and current developments. Acta. Cryst. D67, 235-242
(2011). 17 Sun, Q. et al. Discovery of small molecules that bind to K-Ras and inhibit Sos-mediated activation.
Angew. Chem. Int. Ed. Engl. 51, 6140-6143 (2012).

download fileview on ChemRxivSI_ChemRxiv_PhABits.pdf (1.56 MiB)


![Lawrence Berkeley National Laboratory Title: Author: Bhat ...3H]Azidodantrolene photoaffinity... · Lawrence Berkeley National Laboratory Title: [3H]Azidodantrolene photoaffinity](https://static.fdocuments.us/doc/165x107/5e1fd0c77fb4f741772956eb/lawrence-berkeley-national-laboratory-title-author-bhat-3hazidodantrolene.jpg)