Photo Intercalibration Course (Photo ICC), exercise in...
35
1 FURTHER DEVELOPMENT AND IMPLEMENTATION OF AN EU-LEVEL FOREST MONITORING SYSTEM - FUTMON- ACTION: C1 TREE 30 NWD: REPORT ON RESULTS OF PHOTO ICC 2010 IN COOPERATION WITH THE INTERNATIONAL COOPERATIVE PROGRAMME ON ASSESSMENT AND MONITORING OF AIR POLLUTION EFFECTS ON FORESTS (ICP FORESTS) Photo Intercalibration Course (Photo ICC), exercise in 2010 Northwest German Forest Research Station 37079 Göttingen, Grätzelstr. 2 Germany Elaborated by: Johannes Eichhorn 1 , Arthur Bauer 1 , Ludmilla Bohacova 2 , Inge Dammann 1 , Paloma Garcia 3 , Joerg Weymar 1 and Soeren Wulff 4 1 Northwest German Forest Research Station, Göttingen, Germany 2 VULHM - Forestry and Game Management Research Institute Czech Republic 3 General Directorate for Nature and Forest Policy Spain 4 SLU, Dept of Forest Resource Management, Sweden
Transcript of Photo Intercalibration Course (Photo ICC), exercise in...

1
FURTHER DEVELOPMENT AND IMPLEMENTATION OF AN
EU-LEVEL FOREST MONITORING SYSTEM
- FUTMON-
ACTION: C1 TREE 30 NWD: REPORT ON
RESULTS OF PHOTO ICC 2010
IN COOPERATION WITH THE
INTERNATIONAL COOPERATIVE
PROGRAMME ON ASSESSMENT AND
MONITORING OF AIR POLLUTION
EFFECTS ON FORESTS (ICP FORESTS)
Photo Intercalibration Course
(Photo ICC), exercise in 2010
Northwest German Forest Research Station
37079 Göttingen, Grätzelstr. 2
Germany
Elaborated by: Johannes Eichhorn1, Arthur Bauer1, Ludmilla Bohacova2,
Inge Dammann1, Paloma Garcia3, Joerg Weymar1 and Soeren Wulff4
1Northwest German Forest Research Station, Göttingen, Germany 2VULHM - Forestry and Game Management Research Institute Czech Republic
3General Directorate for Nature and Forest Policy Spain 4SLU, Dept of Forest Resource Management, Sweden

2
Photo Intercalibration Course
(Photo ICC), exercise in 2010
1. Introduction ............................................................................................................... 3
1.1 Quality checks ......................................................................................................3 1.2 Responsibilities and gratitude to EC and Life plus ...............................................3
2. Objectives .................................................................................................................. 4
3. Scope: European regions and tree species .................................................................. 4
4. Methods .................................................................................................................... 6
4.1 Criteria .................................................................................................................6 4.2 Sample trees and photographic quality ................................................................7 4.3 Assessable crown ................................................................................................8 4.4 Photographic meta data, photo data base and codes ...........................................9 4.5 Participating countries and teams ...................................................................... 10 4.6 Assessment quality indicators and outliers ......................................................... 12
5. Results ..................................................................................................................... 13
5.1 Team assessment quality: frequencies of outliers of photo assessments ........... 13 5.2 Team assessment quality: variation of photo assessments. Assessments in different countries of the same region ...................................................................... 16 5.21 Region: Northern Europe ................................................................................. 16 5.22 Region: Central Europe .................................................................................... 20 5.23 Region: Mediterranean Europe ........................................................................ 26
6. Conclusions .............................................................................................................. 30
Advantages of the photo ICC concept. ..................................................................... 31 Disadvantages of the photo ICC concept. ................................................................ 31
7. Recommendations ................................................................................................... 32
ANNEX ......................................................................................................................... 33
Annex 1: Frequency distribution of tree species (number of trees) and EEA forest types according to Level 1 net of ICP Forests. ......................................................... 33 Pictures in the database ........................................................................................... 34

3
1. Introduction Records of the condition of forest trees provide one with an important indicator in the process
of sustainable forest development in Europe. The Ministerial Conference on the Protection of
Forests in Europe (MCPFE; www.foresteurope.org) is agreed on this point, which is also in
accordance with the history of forest ecological monitoring in Europe (www.icp-forests.org).
The distribution of forest types of the European Environment Agency (EEA) shows that there
is a considerable variation in the environmental conditions of forest development as well as in
the optical appearance of forests in different forest types of Europe. This, for example, is
reflected in the distribution of tree species. But even the same species manifests itself
regionally in various forms. It is thus of no mean importance to ensure that quality control
techniques, provide a constancy of assessment over medium term periods and a constancy of
tree assessment in the major forest types.
1.1 Quality checks
The major concept to understand and document the quality of tree assessment data are
calibration courses on international and national level. Calibration courses offer the option to
analyze variation of defoliation classes in a sample under the condition of several assessors.
Field ICCs document tree condition assessments under field condition. Photo ICCs support
the quality system, by assessment of photo sets of mayor tree species in Northern, Central and
Mediterranean Europe.
This report deals mainly with the methodology and the first results of the 2010 photo
intercalibration course. For selected tree species and eco regions a minimum of 30 tree photos
have to be assessed. It is necessary to include all relevant classes or codes in the calibration
course. E.g. regarding defoliation, in the range from 0 % to 100 % at least each 10 % step
should be represented in the sample.
Below follows a description of a method which should enable one to obtain with some degree
of certainty reproducible results of crown assessment via photos all over Europe (separated in
North, Central and Mediterranean Europe), particularly with regard to the key indicator of
defoliation.
1.2 Responsibilities and gratitude to EC and Life plus
The FutMon contract (LIFE07 ENV/D/000218 – C1/ p. 57) defines quality control and
assurance measures to be carried out by the associated beneficiaries responsible for collecting
monitoring data.
Revision of Photo Intercalibration concept (Photo ICC) and exercise in 2010 is a task of the
project: FutMon C1-tree-30 (NWD): Quality expertise and evaluation within tree health
assessments, chaired by Eichhorn, J. (Germany). Coordinators for North Europe and the
Baltic states: Wulff, S. (Sweden); for Central Europe: Bauer, A. (Germany), and for
Mediterranean Europe: Garcia, P. (Spain).
Partners of the photo exercise in 2010: The Expert Panel on Crown Condition and Damaging
agents, National Focal Centers (NFC´s) and the FutMon D1-community.

4
2. Objectives
The main aims of the Photo ICC method are:
1. Proof of temporal and spatial consistency of crown condition assessment
to check that assessment consistency is maintained over a long period
o to ensure that assessment standards of an expert or of a team remain
constant over long periods, even when there is a fluctuation among team
members
to check assessment consistency of a tree species in a given major EEA forest type
covering different national and international regions
o to find out systematic or non systematic assessment differences through a
comparative analysis of different tree species and state of defoliation
to check the assessment proficiency of individual experts or of a field teams
o to check out an individual's quality in relation to the team
2. Comparative appraisal of photographs with field pictures of the same trees and digital
reference photographs, possibly in connection with field ICC courses.
3. Completion of the manual's criteria definitions through the addition of pictures that cover
the complete range of main damaging symptoms, particularly those contained in the "national
lists". Check assessment consistency in the face of characteristic biotic or abiotic criteria.
4. Regional photo guides for two to three tree species for each eco region one are an essential
help towards harmonizing tree assessment.
In 2010 the new Photo ICC method was developed and implemented for the first time. The
following elaborations mainly refer to the first of the mentioned objectives. In particular:
Test the method of photo assessments to use for QA QC of crown condition
Implement a basis for future test of temporal consistency of crown assessments
Give recommendations for use of Photo ICC method in future
3. Scope: European regions and tree species
Photo ICCs are desirable for important EEA forest types
(www.eea.europa.eu/publications/technical_report_2006; Fig. 1) as well as for main European
tree species. The Level 1 net of ICP Forests serves as the basis for deciding which tree species
and forest types are to be classified as major important. The average frequency distribution of
the past years, as shown by this net, is shown in Table 1.

5
1 Boreal2 Hemiboreal3 Alpine4 Acido. oak and oak/birch5 Mesophytic decidous forest6 Beech forest7 Mounitain beech forest8 Thermo. decidous forest9 Broadleaved evergreen for.10 Mediterr. conif. forest11 Mire and swamp forest12 Flood plain forest13 Non river alder/birch14 Plantations, exotic forests
Fig. 1: EEA forest types and main tree species (after inventory results of ICP Forests Level
1 plots (www.eea.europa.eu/publications/technical_report_2006)
Picea
abies
Pinus
sylvestris
Fagus
sylvatica
Quercus
ilex and Q.
rotundifolia
Pinus
pinaster
Quercus
robur,
Q.
petraea
Northern
Europe
BOREAL
HEMIBOREAL
NEMORAL
Central
Europe
ALPINE
CONIFEROUS
MESOPHY.
DECIDUOUS
BEECH
Mediterranean
Europe
MONTANE
BEECH
THERMOPH.
DECIDUOUS
EVERGREEN
BROAD-
LEAVES
MEDITERR.
CONIFEROUS
Tab. 1: Distribution of tree species and EEA forest types according to Level 1 net of ICP
Forests. Colours indicate the occurrence of tree species in EEA forest types.

6
Overview of tree species for which photo ICCs can be carried out in particular forest types
according to the EEA (vid. Tab. 1). The essentially different growth conditions in northern,
central and mediterranean Europe will be taken into consideration on the photo QA project.
Following from this, photographs for Photo ICCs are available:
Region Photo set of 30/100 photos per tree species
Northern Europe Scots pine (Pinus sylvestris)
Norway spruce (Picea abies)
Central Europe Beech (Fagus sylvatica)
Norway spruce (Picea abies)
Scots pine (Pinus sylvestris)
European Oak (Quercus petraea and Q. robur)
Mediterranean Europe Scots pine (Pinus sylvestris)
Maritime pine (Pinus pinaster)
Mediterranean oak (Quercus ilex)
Abies borissi-regis
Pinus halepensis
Tab.2: European Regions and Tree Species in the Photo ICC 2010. Italicized tree species are
not used in the first Photo ICC 2010.
4. Methods
Though some aspects of crown condition survey can not be assessed on photos, main
indicator criteria such as defoliation are clearly shown on high quality photograph. Hence,
experts and field teams can refer to the pictures and shown patterns over a certain period
when main indicator criteria are clearly shown on ideal photographs. The knowledge of clear
patterns helps to transfer photographic assessment results in the course of field work to the
actual objects under appraisal.
4.1 Criteria
Ideally, all mandatory parameters of the Level 1 and 2 crown condition and damage surveys
should be covered by the ICCs. However, as a start it was decided to test defoliation
assessment.
During the EP Crown and Damage meeting in Tampere (2010) it was convened that quality
control procedures should be carried out for the essential criteria defoliation and fructification.

7
Additional parameters may be assessed after explicit requests by participating countries or in
consequence of changes to the manual on a voluntary basis. Plot ID, date and ICC participant
code should be recorded by the participants once per plot. All these parameters and codes
must be entered in the field form. The field forms should be supplied by the host countries.
4.2 Sample trees and photographic quality
Photos have to be selected according to defined quality requirements.
A batch of photographs (e.g. defoliation, beech, Central Europe) should consist of at least 30
pictures. The minimum number per tree species and eco region serves as sample for the photo
test in 2010. In the medium term, the number of photos per tree species and eco region should
be increased to at least 100 high-quality photos per object. A large number of photographs
aids statistical analysis and prevents rapid recognition of assessed pictures. The periodically
used sample of photos in each group remains 30.
Photographic concepts hitherto used were discussed by the participants of previous photo
concepts and the upshot was, that an essential weakness of photographic procedures
frequently lies in the poor quality of the photographs. The present proposition for Photo ICCs
thus places the emphasis on optimum picture quality.
The following rules should be taken into account:
Technical characteristics:
High camera resolution (min. 4.5 megapixels; reasons: standard density for
printing 300 dpi = resolution for A5 min. 1800 x 2500 pixels = 4.5 megapixels =
min. 2.0 MB (format JPG)
Satisfactory lighting, the use of a tripod.
Photographs should offer a very good visibility of tree crown. No crowns showing
major effects of competition, no staggered crowns that partially obliterate one
another, the whole viewer to be filled out with the object, if possible picture the
entire crown from tree-top to point of greatest expanse. It is recommended, that
photos should be taken on the angle of 45o accordingly to the horizontal distance
of the tree height.
Pictures of tree crowns should neither be taken against the sun nor in windy
conditions.
A set of photographs should show all criteria variations. Example defoliation: the
range of the criterion 'defoliation' goes in 5% steps from 0% to 100%. The photos
must show trees with a variation of defoliation scores. 0% trees serve as a
reference.
Apply a scale, numbered zero to ten, on the left and on the right side of the photograph to help
assess 10 consecutive crown sections (vid. title picture), as a mean of documenting the
assessed crown. The scale was prepared by NW-FVA.
The limitation to high quality photographs would lead to pictures predominately depicting
free standing crowns. Photos are limited to two dimensions. In reality, under field conditions,
usually only the view from different angles will lead to correct assessment of a sample tree.

8
Thus Photo ICC does not mirror all the properties of forest condition inventories made under
field conditions. This is the main reason for implementing an alternating system of Photo and
Field ICCs.
4.3 Assessable crown
Due to historical reasons, some countries use different field definitions of assessable crown,
even if these countries are located in the same general ecvological zone.
Country Scots pine Norway spruce Silver birch
Estonia 1/3 of the living
crown
1/3 of the living
crown
1/3 of the living
crown
Finland 2/3 of the living
crown
1/2 of the living
crown
2/3 of the living
crown
Norway 2/3 of the living
crown
1/2 of the living
crown
whole living
crown
Latvia unknown whole living
crown
whole living
crown
Sweden 2/3 of the living
crown
1/2 of the living
crown
2/3 of the living
crown
Lithuania unknown whole living
crown
whole living
crown
Tab. 3: Use of assessable crown definitions in Northern Europe countries.
(Becher, 2008)
In 2010 there is a test to compare defoliation scores based on two definitions of the assessable
crown: a national definition of assessable crown and a EU wide definition.
The EU wide definition of assessable crown is related to figure IV-1 of Manual Part IV:
Visual Assessment of Crown Condition and damaging agents. It illustrates the definition:
Assessment of the tree crown ranges from the tip of the tree to the widest horizontal span of
the crown.
This means, in 2010 every assessor has to give two values:
defoliation related to the regional assessable crown;
defoliation scores related to a European definition of assessable crown (widest
span).
Photo assessors have to indicate their national assessable crown via scales on both sides of the
crown photo. All photos will show red scales on both sides left and right (0-10). The numbers
refer to horizontal lines, the scale value of 100 % ends at the bottom begin of the photo. This
concept provides best analysis of the temporal consistency of defoliation assessments.
9
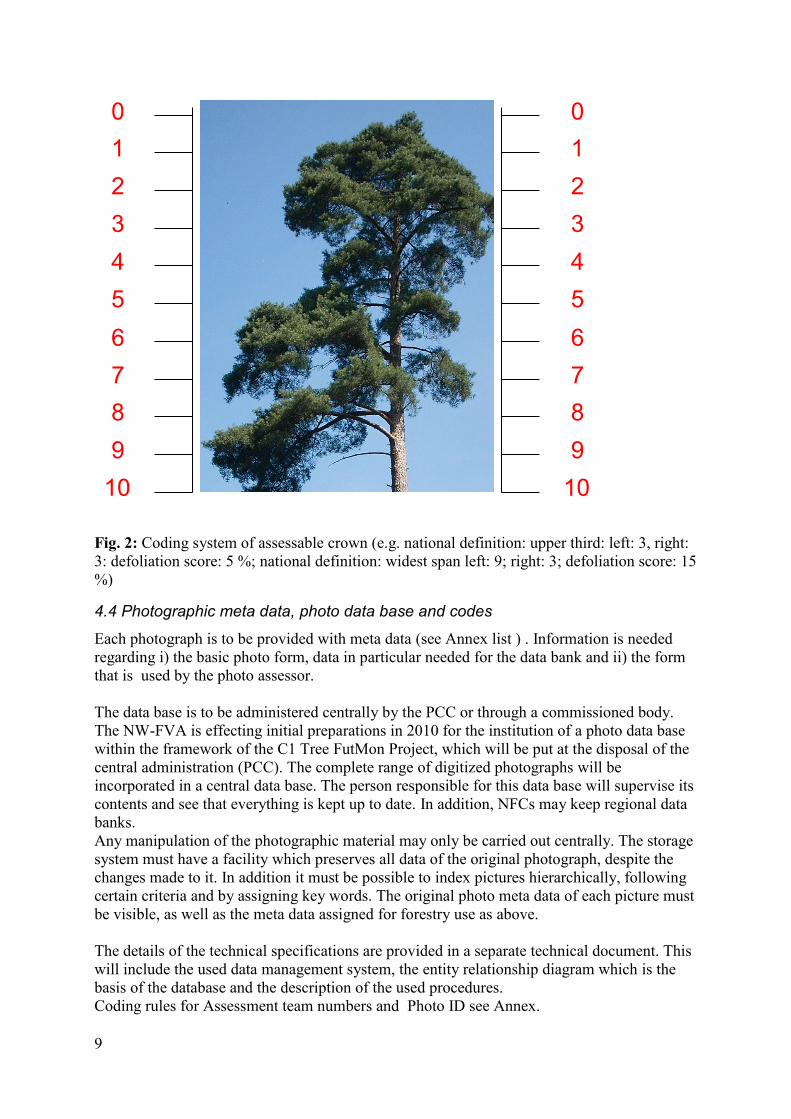
Fig. 2: Coding system of assessable crown (e.g. national definition: upper third: left: 3, right:
3: defoliation score: 5 %; national definition: widest span left: 9; right: 3; defoliation score: 15
%)
4.4 Photographic meta data, photo data base and codes
Each photograph is to be provided with meta data (see Annex list ) . Information is needed
regarding i) the basic photo form, data in particular needed for the data bank and ii) the form
that is used by the photo assessor.
The data base is to be administered centrally by the PCC or through a commissioned body.
The NW-FVA is effecting initial preparations in 2010 for the institution of a photo data base
within the framework of the C1 Tree FutMon Project, which will be put at the disposal of the
central administration (PCC). The complete range of digitized photographs will be
incorporated in a central data base. The person responsible for this data base will supervise its
contents and see that everything is kept up to date. In addition, NFCs may keep regional data
banks.
Any manipulation of the photographic material may only be carried out centrally. The storage
system must have a facility which preserves all data of the original photograph, despite the
changes made to it. In addition it must be possible to index pictures hierarchically, following
certain criteria and by assigning key words. The original photo meta data of each picture must
be visible, as well as the meta data assigned for forestry use as above.
The details of the technical specifications are provided in a separate technical document. This
will include the used data management system, the entity relationship diagram which is the
basis of the database and the description of the used procedures.
Coding rules for Assessment team numbers and Photo ID see Annex.
0
1
2
3
4
5
6
7
8
9
10
0
1
2
3
4
5
6
7
8
9
10

10
4.5 Participating countries and teams
Fig. 3: Participating countries and number of teams per country
The participation at the Photo ICC was, on the whole, good. Of the 15 partners in the FutMon
D1 project, 12 responded. Furthermore, four partners formally not belonging to the D1 project
took part in the Photo ICC: Sweden, Norway, Lithuania and Estonia.
The Photo ICC concept aims to involve the directing team (National Reference Team) as well
as the executive teams, which often change from year to year, in the various countries. Only
co-operation within this hierarchy enables the making of spatial and temporal comparisons of
the rating quality on a national and international level.
Bearing this in mind, the countries are invited to participate in and make use of future Photo
ICC proceedings not only with their national reference team but with possibly all executive
teams. In particular this is recommended in countries representing large forest area and a hugh
number of teams.

11
Region Number of teams
Number of assessed photos
Northern Europe
32 1918
Central Europe
65 7800
Mediter-ranean Europe
34 3089
sum 131 12717
Tree species Number of team assessments
Fagus sylvatica 97
Picea abies 65
Pinus pinaster 33
Pinus sylvestris 131
Quercus ilex 33
Quercus robur 65
sum total 424
Tab 4: Number of teams and assessed photos (above); number of trees species set assessments
by teams (below)

12
4.6 Assessment quality indicators and outliers
dark Green
0
Light green
1-5
Yellow
6-10
Orange
11-15
Red
16-20
Fig. 4: Definition of assessment quality indicators and outliers. Assessment of a photograph
of a dataset concerning Quercus robur of a central European team. The x-axis represents the
median assessment of a photograph by all teams. In contrast, the y-axis shows the variability
of the teams' assessment of the respective photographs. The linear regression and a confidence
interval of 95% denote the individual teams' assessment. The photoset result of team 402 0
6006 is shown in red as an example. Assessments are classed as outliers if they are outside the
practical limit of error.
For a graphic consideration of the assessment quality in the following figures of a team the
following scale is used:
scale 1 (very good; dark green): 0 outliers.
scale 2: (good, light green) 1 - 5 outliers.
scale 3: (average: yellow) 6-10 outliers.
scsale 4 (bad; orange) 11-15 outliers.
scale 5 (very bad): more than 15 outliers.

13
5. Results
The photographic assessment quality for the countries in the three European regions are
shown below.
5.1 Team assessment quality: frequencies of outliers of photo assessments
.
Fig. 5: Assessment quality of the individual teams in northern Europe. Estonia, Lithuania,
Norway, Finland and Sweden belong to this region as far as the two tree species Picea abies
and Pinus sylvestris are concerned. The numbers on the left margin are the identification

14
codes for each team. In all, most teams lie within scale 1 and 2 for both tree species. For Picea
abies between 30 and 35 teams can be classed as "very good" or "good" , while for Pinus
sylvestris all 35 teams are "very good" or "good".
Fig. 6: Assessment quality of individual teams in central Europe. Slovenia, the Czech
Republic, the Slovak Republic, Romania, Hungary, Denmark, Germany and Belgium belong
to this region. Denmark assessed both the photosets for northern Europe and for central
Europe. Altogether, most teams can be classed for four tree species as scale 1 and 2 (very

15
good and good): Fagus sylvatica: 64/69; Picea abies: 66/69, Pinus sylvestris: 65/69 and
Quercus robur: 63/69.
Fig. 7: Assessment quality of individual teams in Mediterranean Europe. Cyprus, Spain,
Greece and Italy belong to this region. Altogether, most teams can be classed for three tree

16
species as scale 1 and 2 (very good and good): Pinus pinaster (32/38); Pinus sylvestris
(36/38), and Quercus ilex (35/38).
Altogether, the classifications very good to good (dark green to light green colour codes)
clearly predominate in all three regions. Scale "good" can contain up to 5 outliers in 30
photographs.
One should make sure that photographs present an absolutely clear view of tree crowns.
These must not be partially covered and the lighting has to be very good. Photographs,
however, only present a two dimensional and not a three-dimensional view. Detailed
observation, as can be done in the field with binoculars, is not possible.
As with all ratings, the knowledge and experience of the operators is important. By judging
the results, one must bear in mind the different experience levels of individual teams
concerning the various tree species.
5.2 Team assessment quality: variation of photo assessments. Assessments in
different countries of the same region
5.21 Region: Northern Europe
20
25
30
35
40
45
50
55
defo
liatio
n_nat_
mean
Picea abies Pinus sylvestris
Fig. 8: Variation of means per photo set of teams defoliation assessment in participating
countries (Region: Northern Europe, use of national assessable crown) Photosets of the tree species Picea abies and Pinus sylvestris were assessed for the northern
European region. With a mean of 37.9, Picea abies shows a variation of mean values of 1.003,
Pinus sylvestris (average: 34.1) of 1.017. The different values are due to photosets showing
varying degrees of defoliation. The variation of the mean values and therefore also the
assessment quality of both tree species is comparable.

17
20
25
30
35
40
45
50
55
defo
liatio
n_nat_
mean
Picea abies Pinus sylvestris
59
56
55
15
13
Fig. 9: Variation of means per photo set of teams defoliation assessment per participating
countries (13: Sweden n = 15; 15: Finland n = 9; 55: Norway n = 2; 56: Lithuania n = 3; 59:
Estonia n = 1) Region: Northern Europe, use of national definition of assessable crown)
As is shown in fig. 9, variance in the different countries of one region has a bearing on
assessment quality. Thus, Swedish teams assess on average the same photos of Picea abies
nearly 7%-points more severely than Finnish teams do. Similar results are observed when
both countries are compared regarding Pinus sylvestris.
.

18
Fig.10: Sum of team defoliation assessment outliers per photo set. Defoliation assessments of
Picea abies and Pinus sylvestris; numbers and signatures on the right side represent
participating countries (Region: Northern Europe, use of national assessable crown). Left
column: classification of assessment quality according to the scale shown in fig. 4. Countries:
Sweden (13), Finland (15), Norway (55), Lithuania (56), Estonia (59).
In fig. 9 the frequency of outliers in the same collective is compared. The frequency of
outliers can vary even when average assessment level is comparable. The left boxplot for
Sweden shows that individual teams assess 9, respectively 11 of 30 photographs clearly
differently.
The reasons for this differing assessment tendency cannot be established with the help of the
Photo-ICC. This is rather a job for the Field-ICCs and Expert Panel meetings.
-2
0
2
4
6
8
10
12
sum
_nat
27,5 30 32,5 35 37,5 40 42,5 45 47,5 50 52,5
defoliation_nat_mean
59
56
55
15
13
Fig. 11: Picea abies (Region: Northern Europe, use of national assessable crown). Variation
of team defoliation means (axis of abscissae) and outliers from 95 % confidence interval per
photo set per team and participating countries (ordinate); (13: Sweden n = 15; 15: Finland n =
9; 55: Norway n = 2; 56: Lithuania n = 3; 59: Slovenia n = 1).
Figure 11 shows the frequency of outliers in relation to the mean of 37.9. The 15 Swedish
teams lie partly above the total mean. However, the teams' mean values show a large margin
ranging from 32% to 50% (difference: 18 percentage points). In comparison, the Finnish
values languish in the lower range of the group. Results range from 31% up to 43%
(difference: 12 percentage points). The further a team moves from the mean value, the higher
the number of outliers generally is. Thus, for example, the Swedish team that made the
strictest assessments had 11 outliers, which means that every third assessment the team made
lies outside the 95% distribution interval.

19
-,5
0
,5
1
1,5
2
2,5
3
3,5
4
4,5sum
_nat
20 22,5 25 27,5 30 32,5 35 37,5 40 42,5 45 47,5
defoliation_nat_mean
59
56
55
15
13
Fig. 12: Pinus sylvestris (Region: Northern Europe, use of national assessable crown).
Variation of team means and outliers from 95 % confidence interval per photo set per teams
and participating countries (13: Sweden n = 15; 15: Finland n = 9 ; 55: Norway n = 2 ; 56:
Lithuania n = 3 ; 59: Slovenia n = 1). Axis of abscissae from 20 to 47,5
Crown assessment of Pinus sylvestris produces no more than four outliers. This suggests that
assessment is more competent than with spruce. The difference between minimal and
maximum ranking of the countries are of a comparable size where the tree species spruce is
concerned.
22,5
25
27,5
30
32,5
35
37,5
40
42,5
45
47,5
defo
liatio
n_eu_m
ean
20 22,5 25 27,5 30 32,5 35 37,5 40 42,5 45 47,5
defoliation_nat_mean
defoliation_eu_mean = 5,626 + ,854 * defoliation_nat_mean; R^2 = ,91
Fig. 13: Pinus sylvestris (Region: Northern Europe). Comparison between the use of the
European definition (ordinate) and the national definition (axis of abscissae) of assessable
crown. Variation of team means per photo set
20
27,5
30
32,5
35
37,5
40
42,5
45
47,5
50
defo
liatio
n_eu_m
ean
27,5 30 32,5 35 37,5 40 42,5 45 47,5 50 52,5
defoliation_nat_mean
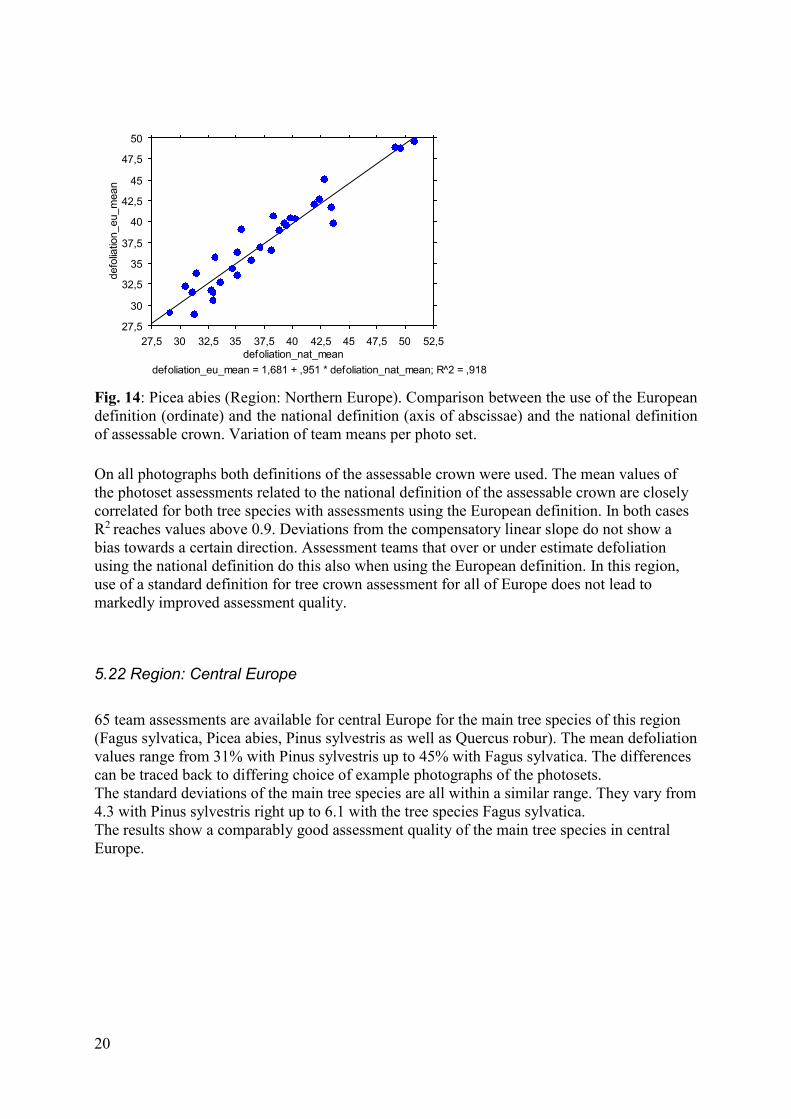
defoliation_eu_mean = 1,681 + ,951 * defoliation_nat_mean; R^2 = ,918
Fig. 14: Picea abies (Region: Northern Europe). Comparison between the use of the European
definition (ordinate) and the national definition (axis of abscissae) and the national definition
of assessable crown. Variation of team means per photo set. On all photographs both definitions of the assessable crown were used. The mean values of
the photoset assessments related to the national definition of the assessable crown are closely
correlated for both tree species with assessments using the European definition. In both cases
R2 reaches values above 0.9. Deviations from the compensatory linear slope do not show a
bias towards a certain direction. Assessment teams that over or under estimate defoliation
using the national definition do this also when using the European definition. In this region,
use of a standard definition for tree crown assessment for all of Europe does not lead to
markedly improved assessment quality.
5.22 Region: Central Europe
65 team assessments are available for central Europe for the main tree species of this region
(Fagus sylvatica, Picea abies, Pinus sylvestris as well as Quercus robur). The mean defoliation
values range from 31% with Pinus sylvestris up to 45% with Fagus sylvatica. The differences
can be traced back to differing choice of example photographs of the photosets.
The standard deviations of the main tree species are all within a similar range. They vary from
4.3 with Pinus sylvestris right up to 6.1 with the tree species Fagus sylvatica.
The results show a comparably good assessment quality of the main tree species in central
Europe.
21
15
20
25
30
35
40
45
50
55
60
65defo
liatio
n_nat_
mean
Fagus s
ylv
atic
a
Pic
ea a
bie
s
Pin
us s
ylv
estr
is
Querc
us r
obur
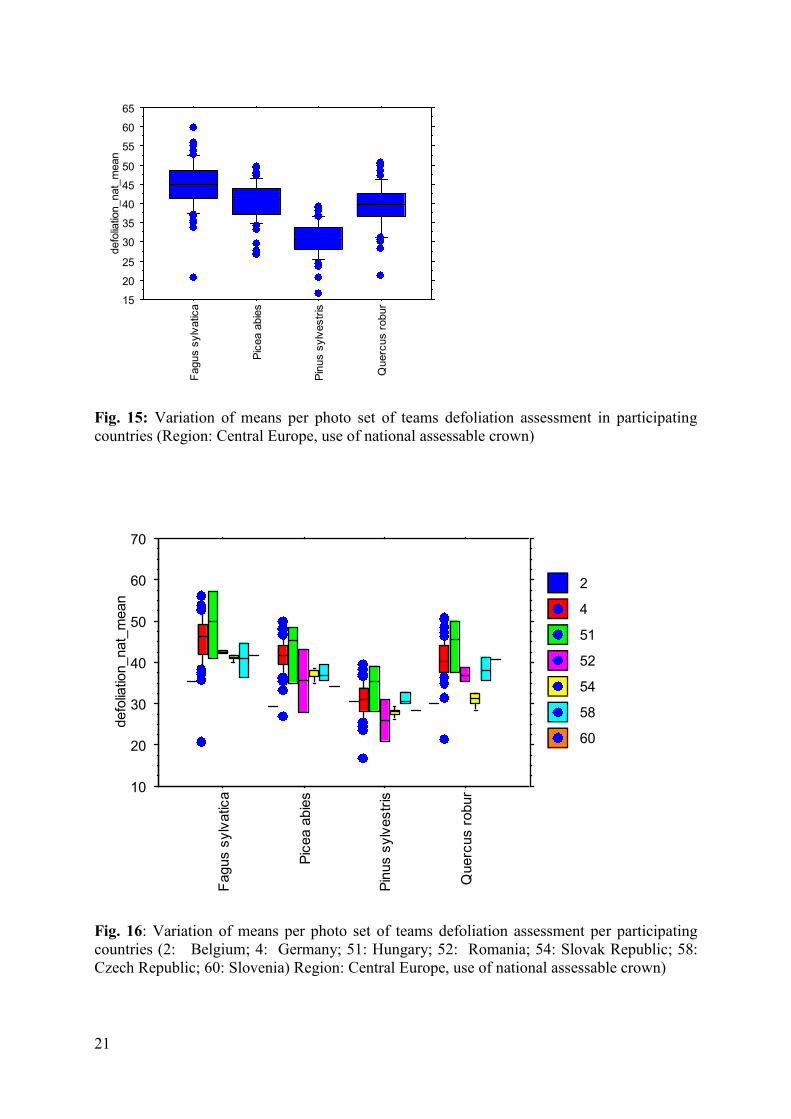
Fig. 15: Variation of means per photo set of teams defoliation assessment in participating
countries (Region: Central Europe, use of national assessable crown)
10
20
30
40
50
60
70
defo
liatio
n_nat_
mean
Fagus s
ylv
atic
a
Pic
ea a
bie
s
Pin
us s
ylv
estr
is
Querc
us r
obur
60
58
54
52
51
4
2
Fig. 16: Variation of means per photo set of teams defoliation assessment per participating
countries (2: Belgium; 4: Germany; 51: Hungary; 52: Romania; 54: Slovak Republic; 58:
Czech Republic; 60: Slovenia) Region: Central Europe, use of national assessable crown)
22
In central Europe there are also difference between countries both in the level of the
assessment and the variation within a species.
For example using the same set o photographs the assessment levelling Hungary was
somewhat higher than in Germany or Rumania.
Fagus sylvatica
-2
0
2
4
6
8
10
12
14
16
18
20
sum
_nat
15 20 25 30 35 40 45 50 55 60 65
defoliation_nat_mean
60
58
54
52
51
4
2
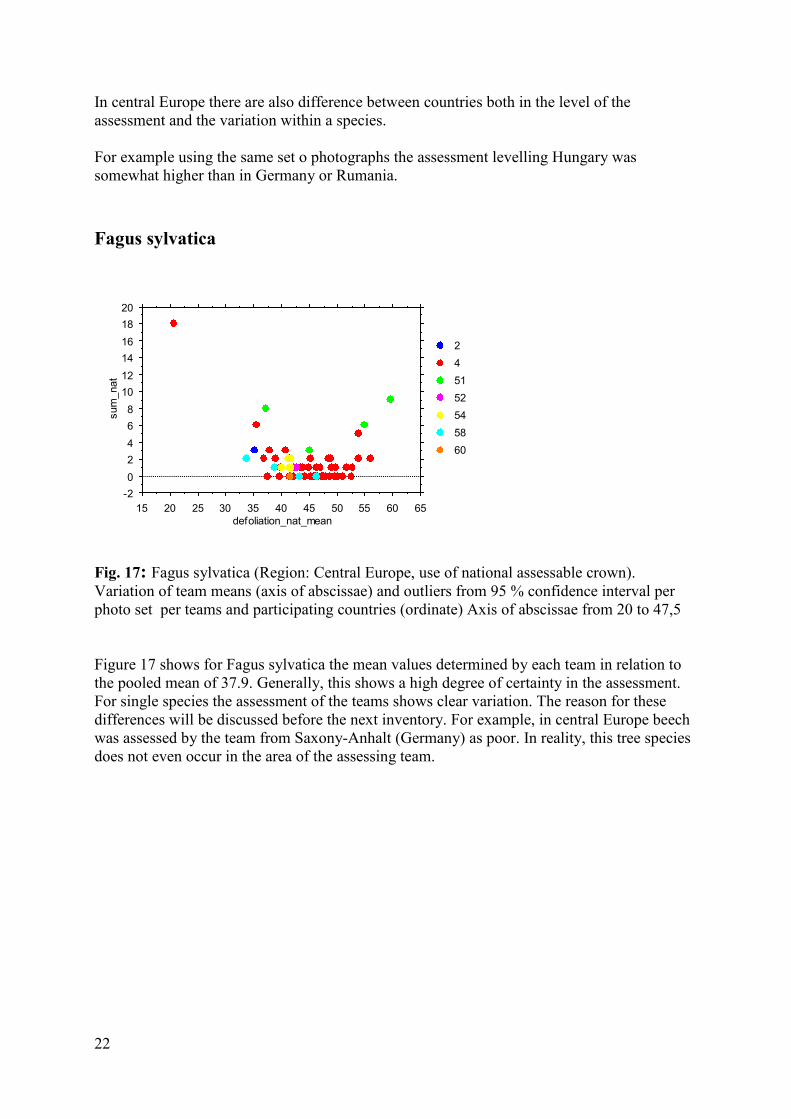
Fig. 17: Fagus sylvatica (Region: Central Europe, use of national assessable crown).
Variation of team means (axis of abscissae) and outliers from 95 % confidence interval per
photo set per teams and participating countries (ordinate) Axis of abscissae from 20 to 47,5
Figure 17 shows for Fagus sylvatica the mean values determined by each team in relation to
the pooled mean of 37.9. Generally, this shows a high degree of certainty in the assessment.
For single species the assessment of the teams shows clear variation. The reason for these
differences will be discussed before the next inventory. For example, in central Europe beech
was assessed by the team from Saxony-Anhalt (Germany) as poor. In reality, this tree species
does not even occur in the area of the assessing team.

23
Picea abies
-2
0
2
4
6
8
10
12
14
16
18
sum
_nat
25 27,5 30 32,5 35 37,5 40 42,5 45 47,5 50 52,5
defoliation_nat_mean
60
58
54
52
51
4
2
Fig. 18: Picea abies (Region: Central Europe, use of national assessable crown). Variation of
team means (axis of abscissae) and outliers from 95 % confidence interval per photo set per
teams and participating countries (ordinate)
Spruce shows a larger variation of defolkiation mean per photoset compared to beech.
However, frequency of outliers remains low, only single teams show a larger variation of
assessments.
In general, assessments of pine crowns show a similar good quality compared to spruce.
Pinus sylvestris
-2
0
2
4
6
8
10
12
14
sum
_nat
15 17,5 20 22,5 25 27,5 30 32,5 35 37,5 40
defoliation_nat_mean
60
58
54
52
51
4
2
Fig. 19: Pinus sylvestris (Region: Central Europe, use of national assessable crown).
Variation of team means (axis of abscissae) and outliers from 95 % confidence interval per
photo set per teams and participating countries (ordinate)

24
Quercus robur:
-2
0
2
4
6
8
10
12
14
sum
_nat
20 25 30 35 40 45 50 55
defoliation_nat_mean
60
58
54
52
51
4
2
Fig. 20: Quercus robur (Region: Central Europe, use of national assessable crown). Variation
of team means (axis of abscissae) and outliers from 95 % confidence interval per photo set
per teams and participating countries (ordinate)
In a comparison of the most important species in central Europe, the assessment of oaks
shows a higher uncertainty than the assessment of beech. This could be due to the complex
branching structure, and branch dynamics in oak, but also the large range of appearance of
crowns in the different regions.
30
35
40
45
50
55
60
65
defo
liatio
n_eu_m
ean
30 35 40 45 50 55 60 65
defoliation_nat_mean
defoliation_eu_mean = 1,486 + ,973 * defoliation_nat_mean; R^2 = ,985
Fig. 21: Fagus sylvatica (Region: Central Europe; not Germany because its use of the
European definition). Comparison between the use of the European definition (ordinate) and
the national definition (axis of abscissae) and the national definition of assessable crown.
Variation of team means per photo set.
In all photographs, by definition only the assessable crown was used. The mean value of the
assessment of the sets of photographs in relation to the national definition of the assessable
25
crown are for beech, spruce and oak strongly correlated to the assessment using a European
agreed definition.
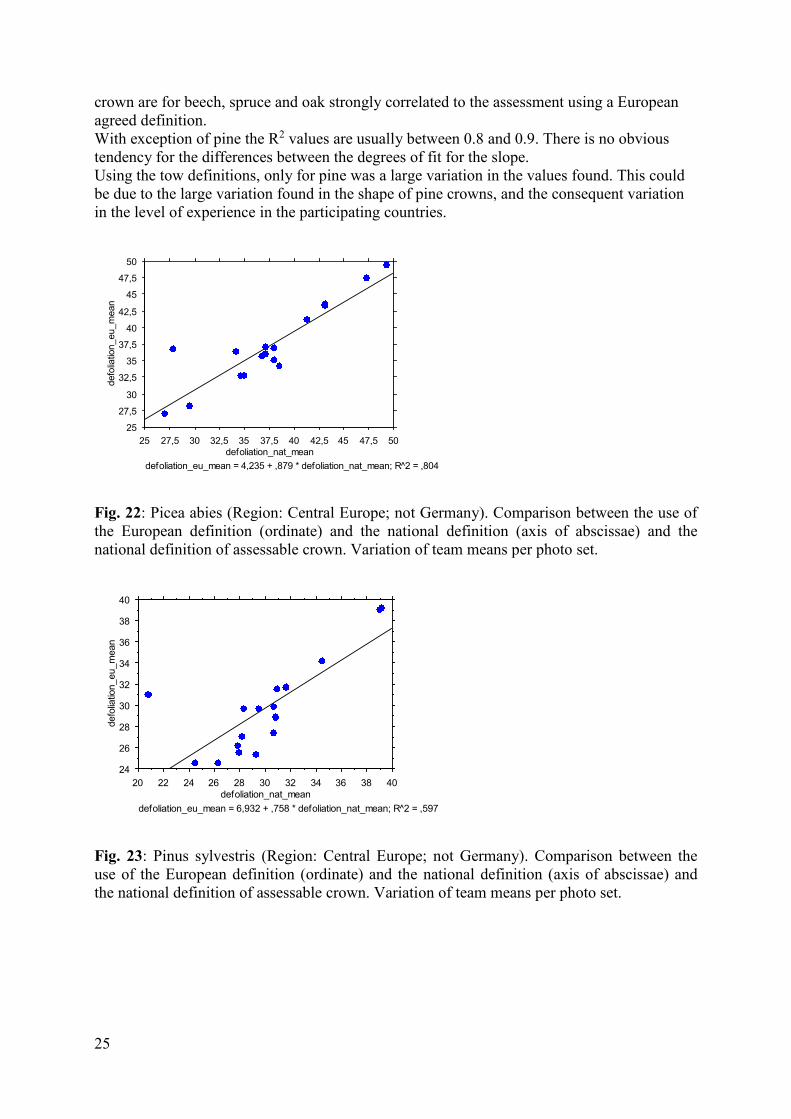
With exception of pine the R2 values are usually between 0.8 and 0.9. There is no obvious
tendency for the differences between the degrees of fit for the slope.
Using the tow definitions, only for pine was a large variation in the values found. This could
be due to the large variation found in the shape of pine crowns, and the consequent variation
in the level of experience in the participating countries.
25
27,5
30
32,5
35
37,5
40
42,5
45
47,5
50
defo
liatio
n_eu_m
ean
25 27,5 30 32,5 35 37,5 40 42,5 45 47,5 50
defoliation_nat_mean
defoliation_eu_mean = 4,235 + ,879 * defoliation_nat_mean; R^2 = ,804
Fig. 22: Picea abies (Region: Central Europe; not Germany). Comparison between the use of
the European definition (ordinate) and the national definition (axis of abscissae) and the
national definition of assessable crown. Variation of team means per photo set.
24
26
28
30
32
34
36
38
40
defo
liatio
n_eu_m
ean
20 22 24 26 28 30 32 34 36 38 40
defoliation_nat_mean
defoliation_eu_mean = 6,932 + ,758 * defoliation_nat_mean; R^2 = ,597
Fig. 23: Pinus sylvestris (Region: Central Europe; not Germany). Comparison between the
use of the European definition (ordinate) and the national definition (axis of abscissae) and
the national definition of assessable crown. Variation of team means per photo set.

26
25
27,5
30
32,5
35
37,5
40
42,5
45
47,5
50
52,5
defo
liatio
n_eu_m
ean
27,5 30 32,5 35 37,5 40 42,5 45 47,5 50 52,5
defoliation_nat_mean
defoliation_eu_mean = -1,724 + 1,053 * defoliation_nat_mean; R^2 = ,965
Fig. 24: Quercus robur (Region: Central Europe; not Germany). Comparison between the use
of the European definition (ordinate) and the national definition (axis of abscissae) and the
national definition of assessable crown. Variation of team means per photo set.
5.23 Region: Mediterranean Europe
In Mediterranean Europe, 33 team assessments are available for the photosets of the trees in
this region (Quercus ilex, Pinus pinaster and Pinus sylvestris). The average defoliation value
for the 3 species are comparatively similar between 25.4 and 30.9%.
The standard error for the species is similar to other tree species and regions. This ranges
from 3.8 for Quercus ilex to 5.9 for Pinus sylvestris.
The results show a high degree of quality in the assessment of trees in Mediterranean Europe.
Despite the narrow framework given by the 25% and 75% percentiles in Pinus sylvestris
single teams show a large variation both above and below the mean.
Even when the data set is separated by tree species and country (Fig 26) similar mean values
for a photoset are found for a tree species, but there is considerable variation between the
single teams.

27
10
15
20
25
30
35
40
45
defo
liatio
n_nat_
mean
Pinus pinaster Pinus sylvestris Quercus ilex
66
11
9
5
Fig. 25: Variation of means per photo set of teams defoliation assessment per participating
countries (5: Italy; 9: Greece; 11: Spain; 66: Cyprus) Region: Mediterranean Europe, use of
national assessable crown)
Figures 26 to 28 show the occurrence of outliers in relation to the pooled mean of the
Mediterranean species. In comparison to the graphs used to present the values from North and
central Europe the x-axis has a wider scale. For example, the x-axis in Fig 19 is from 22 to 55,
in comparison in Fig 26 only from 18-36. The loosely distributed cloud of points should
however not give the impression that the assessment in southern Europe does not provide a
good assessment of the mean value of the respective photosets. The outliers are generally low,
even if single teams show clear differences to the mean assessment value.
Quercus ilex
-1
0
1
2
3
4
5
6
7
8
9
sum
_nat
18 20 22 24 26 28 30 32 34 36
defoliation_nat_mean
66
11
9
5
Fig. 26: Quercus ilex (Region: Mediterranean Europe, use of national assessable crown).
Variation of team means (axis of abscissae) and outliers from 95 % confidence interval per
photo set per teams and participating countries (ordinate)

28
Pinus pinaster
-2
0
2
4
6
8
10
12
sum
_nat
17,5 20 22,5 25 27,5 30 32,5 35 37,5 40 42,5
defoliation_nat_mean
66
11
9
5
Fig. 27 : Pinus pinaster (Region: Mediterranean Europe, use of national assessable crown).
Variation of team means (axis of abscissae) and outliers from 95 % confidence interval per
photo set per teams and participating countries (ordinate) Pinus sylvestris
-2
0
2
4
6
8
10
12
sum
_nat
10 15 20 25 30 35 40 45
defoliation_nat_mean
66
11
9
5
Fig. 28: Pinus pinaster (Region: Mediterranean Europe, use of national assessable crown).
Variation of team means (axis of abscissae) and outliers from 95 % confidence interval per
photo set per teams and participating countries (ordinate), use of national assessable crown).
In Mediterranean Europe on all photographs both definitions of the assessable crown were
used. The mean values of the photosets assessment based on the national definition of the
assessable crown compared the European definition are for southern Europe less closely
correlated compared to central or northern Europe. The R2 values are 0.41 for Pinus sylvestris
and 0.65 for Pinus pinaster. Quercus ilex has a good value of 0.65. Again the variation in

29
values is greater for Pinus sylvestris than for the other species. There is also a great variability
in the crown forms of pine in Mediterranean Europe.
16
18
20
22
24
26
28
30
32
34
36
defo
liatio
n_eu_m
ean
18 20 22 24 26 28 30 32 34 36
defoliation_nat_mean
defoliation_eu_mean = 4,671 + ,816 * defoliation_nat_mean; R^2 = ,645
Fig. 29: Quercus ilex (Region: Mediterranean Europe). Comparison between the use of the
European definition (ordinate) and the national definition (axis of abscissae) and the national
definition of assessable crown. Variation of team means per photo set.
17,5
20
22,5
25
27,5
30
32,5
35
37,5
40
42,5
defo
liatio
n_eu_m
ean
17,5 20 22,5 25 27,5 30 32,5 35 37,5 40 42,5
defoliation_nat_mean
defoliation_eu_mean = 7,126 + ,672 * defoliation_nat_mean; R^2 = ,655
Fig. 30: Pinus pinaster (Region: Mediterranean Europe). Comparison between the use of the
European definition (ordinate) and the national definition (axis of abscissae) and the national
definition of assessable crown. Variation of team means per photo set.

30
22
24
26
28
30
32
34
36
38
40
defo
liatio
n_eu_m
ean
10 15 20 25 30 35 40 45
defoliation_nat_mean
defoliation_eu_mean = 16,27 + ,421 * defoliation_nat_mean; R^2 = ,411
Fig. 31: Pinus sylvestris (Region: Mediterranean Europe). Comparison between the use of the
European definition (ordinate) and the national definition (axis of abscissae) and the national
definition of assessable crown. Variation of team means per photo set.
6. Conclusions
The co-ordination office of the new photo ICC method at the Northwest Germany Forest
Research Institute (NW FVA) Göttingen has been supported by experts. Arthur Bauer, Inge
Dammann, Jörg Weymar, (Germany), Ludmilla Bohacova (Czech Republic), Paloma Garcia
P.(Spain) and Sören Wulff (Sweden) by acting as experts have greatly contributed to the
acceptance of the method, and have been available to give advice. Continued use of this
method greatly depends on the support of experts for the whole EU.
The newly developed method, first applied in 2010, was initially used on the most
economically important and common tree species. For each of the species a forest scientist
assessed a photoset which documented the differing vitality of the tree crowns. Care was
taken to ensure that all types of crown were represented, for very well leaved or needled
crowns to very poorly.
The photoset from each region and species was composed of 30 photographs. The 30
photographs were taken from a larger data set, and can vary for assessment to assessment.
This is used to prevent any memory-effects of the photographs of the assessment teams.
To remove errors created by poor quality images of the crowns, only the best visible trees and
the best quality photographs were used. As such, the use of these photosets does not reflect
reality, where often in closed forests such easily visible trees are rare. To make the images of
the photosets comparable, the images were printed and sent to the assessment teams. After the
assessment the photographs were returned to the co-ordination office.
The good acceptance of the photo ICC concept, the active participation, the high quality
results, as well as the database of results and images developed at the NW FVA can be used
as evidence that the quality assurance programme should continue.
To show the strengths and weakness of the quality control of the two methods, field ICC, and
photo ICC, a comparison is summarised below.

31
Advantages of the photo ICC concept.
A large number of photographs in the database ensure that for north, central and
southern Europe a sufficient number of samples for all of the most important tree
species in all degrees of defoliation are available.
The definition of the assessable crown varies greatly between different European
countries. Using the low cost photo ICC method it is possible for the first time to
compare the country specific definitions with a European definition.
Especially for pine using the European definition of the assessable crown greatly
improved the comparability of the assessment of crown condition across Europe.
The photosets used in 2010 can be used in the coming years. A comparison to these
photographs provides a control to maintain a constant baseline for investigations
carried out over many years.
Easy access to the photographs ensures that many teams can take part in the
assessment. Quality control can be carried out by a country team leader on
assessments carried out by regional or temporary teams within that country.
The use of photographs makes the quality control independent form plot and tree
selection. It allows assessment of quality for both the classical Level 1 method using a
16 x16 grid, and for national inventories or intensive measurements. The method is
even flexible enough to accommodate changes in methodology during the observation
period.
The databank developed contains the photographs, but also metadata of site, tree and
assessment date. The assessment values are thus safely stored for a long duration.
The photographic method is de-centralised, requires little time, and is high value for
money.
Disadvantages of the photo ICC concept.
The photographs are only two dimensional images of trees and forests
The photographs are unable to provide an assessment of the crown combined with
other relevant symptoms such as abiotic and biotic parameters. A holist assessment of
tree vitality is lost.
Up to now only the parameter defoliation is considered. The first advances are being
made in a method that includes biotic indicators such as fungi and insects. In the
future these will be included in the manual.
The photographs do not allow the observer to include the status of the tree. Up till now
no information about region, climatic conditions or position in the forest are given.
The images abstract the crown condition taken under field conditions to an ideal
image, which does not occur in real inventories. Any assessment carried out in the
forest requires a translation of the photographs to reality.
The photographs for the whole of Europe represent possibly only a small section of the
real extent. For example, the Alps and the Netherlands are grouped into central
Europe. In both the areas the same tree species can be found, but with certainty they
differ in appearance.
Until now mainly mature trees were used. Under real conditions tree are of all ages.
The photosets should be further developed to represent all ages classes.
The photograph concept is de-centralised, and does not provide a European platform
for the exchange of experts. The essential exchange of ideas does not take place.

32
7. Recommendations
From the evaluation of the advantages and disadvantages of the new photo ICC concept, the
following recommendations have been reached.
The photo ICC and field ICC methods should in the future be temporally linked.
The field ICC method should be repeated annually in all 3 European regions.
The photo ICC method should be repeated in 2 yearly intervals
The photo ICC should become an independent assessment using the common
definition of the assessable crown.
In future the photosets should be supported by further indicators of crown vitality
The photosets should be further developed to increase the number of different age
classes

33
ANNEX
Annex 1: Frequency distribution of tree species (number of trees) and EEA forest
types according to Level 1 net of ICP Forests.
Picea
abies Pinus sylvestris
Fagus sylvatica
Quercus ilex and Q. rotundifolia
Pinus pinaster
Quercus suber
Quercus robur, Q. petraea
Abies alba
Picea sitchensis
All species
BOREAL 3987 5772 11209
HEMIBOREAL 4219 6371 108 109 11547
NEMORAL
ALPINE CONIFEROUS
2314 958 290 1135 5805
ACIDOPH. 143 787 1012
OAK
MESOPHY. DECIDUOUS
258 3174 5285
BEECH 3536 306 4498
MONTANE BEECH
143 2871 3490
THERMOPH. 201 6306
DECIDUOUS
EVERGREEN BROAD-LEAVED
3462 389 4289
MEDITERR. CONIFEROUS
1300 99 1736 7680
MIRE 483 652
SWAMP
FLOODPL. 303 613
FORESTS
ALDER. BIRCH. ASPEN
176 3781
PLANTATIONS 1295 676 378 140 104 246 6601
NOT YET CLASSIFIED
4712 8737 1641 122 1550 398 21117
ALL FOREST TYPES
17027 24585 8897 3725 2300 460 6714 1828 327 93887

34
Pictures in the database
Region name species numbers preassessed
Min Max mean
Northern
Europe
Picea
abies
30 5 95 43,3
Northern
Europe
Pinus
sylvestris
30 5 95 36,8
Central
Europe
Fagus
sylvatica
53 0 95 43,9
Central
Europe
Picea
abies
41 10 90 40,4
Central
Europe
Pinus
sylvestris
60 0 95 25,8
Central
Europe
Quercus
robur
30 15 90 47,6
Mediterranean
Europe
Pinus
pinaster
50 5 75 20,5
Mediterranean
Europe
Pinus
sylvestris
72 5 95 23,75
Mediterranean
Europe
Quercus
ilex
43 5 85 27,4
Submission form of the participants’ assessments in 2010
Nation Team number
Name teamleader
Date of assessment
Coordinator Name (given) Email (given)
Organization
Address (organization):
Tree Species
Photo ID (Code).
Assessed crown (EU) Defoliation Assessed crown (national)
Defoliation comment
Left scale Right scale
Left scale Right scale
#001
#002
#003
…
#029
#030
Comments (Problems, photo, quality,…

35
Photographic meta data
i) mandatory data of the basic photo form
photo identity (code printed on each photo and identity in the data base).
date
ownership
location (country, region)
agreement by photo delivering institution that printed photos may be used for the purpose
of Photo ICCs
tree species
EU wide definition of assessable crown regarding the respective photo. Definition should
be given as scale values left and right, e.g. see fig. 3
preassessed defoliation (EU), assessment done by reference team (eco region coordinator)
to get an overview of the defoliation range of the stored photos
ii) mandatory data of the assessors photo form
given: ID Code printed on the photo
nation
team leader
given: name coordinator
team number
given: tree species
used national definition of assessable crown scale values left and right, e.g. national: (4/6)
2010 only: given: used EU def of assessable crown, scale values left and right, e.g. (6/6)
defoliation (national)
2010 only: defoliation (EU)
Comments (problems...)