PhospholipidBiosynthesisProgramUnderlyingMembrane ... · binant CCT protein. Recombinant rodent CCT...
16
Phospholipid Biosynthesis Program Underlying Membrane Expansion during B-lymphocyte Differentiation * Received for publication, August 25, 2006, and in revised form, January 9, 2007 Published, JBC Papers in Press, January 9, 2007, DOI 10.1074/jbc.M608175200 Paolo Fagone ‡ , Rungtawan Sriburi §1 , Cheryl Ward-Chapman § , Matthew Frank ‡ , Jina Wang ‡ , Christopher Gunter ‡ , Joseph W. Brewer § , and Suzanne Jackowski ‡2 From the ‡ Department of Infectious Diseases, St. Jude Children’s Research Hospital, Memphis, Tennessee 38105-2794 and the § Department of Microbiology and Immunology, Loyola University Medical Center, Maywood, Illinois 60153 Stimulated B-lymphocytes differentiate into plasma cells committed to antibody production. Expansion of the endoplas- mic reticulum and Golgi compartments is a prerequisite for high rate synthesis, assembly, and secretion of immunoglobulins. The bacterial cell wall component lipopolysaccharide (LPS) stimulates murine B-cells to proliferate and differentiate into antibody-secreting cells that morphologically resemble plasma cells. LPS activation of CH12 B-cells augmented phospholipid production and initiated a genetic program, including elevated expression of the genes for the synthesis, elongation, and desaturation of fatty acids that supply the phospholipid acyl moieties. Likewise, many of the genes in phospholipid biosyn- thesis were up-regulated, most notably those encoding Lipin1 and choline phosphotransferase. In contrast, CTP:phosphocho- line cytidylyltransferase (CCT) protein, a key control point in phosphatidylcholine biosynthesis, increased because of stabi- lization of protein turnover rather than transcriptional activa- tion. Furthermore, an elevation in cellular diacylglycerol and fatty acid correlated with enhanced allosteric activation of CCT by the membrane lipids. This work defines a genetic and biochemical program for membrane phospholipid biogenesis that correlates with an increase in the phospholipid components of the endoplasmic reticulum and Golgi compartments in LPS- stimulated B-cells. The differentiation of a B-lymphocyte into a plasma cell is characterized by a number of events, including expansion of the intracellular membrane network, particularly the rough endo- plasmic reticulum (ER), 3 where immunoglobulins are synthe- sized and assembled into functional antibodies. During ampli- fication of the ER, a few resident proteins are expressed preferentially, although the majority increase proportionally to the increased membrane surface area, maintaining the overall membrane protein composition (1). Expression of select targets of the unfolded protein response pathway, a complex interor- ganelle signaling system that emanates from the ER (2), is trig- gered during plasma cell differentiation (3). These targets include ER chaperones like BiP and GRP94 and the transcrip- tion factor XBP-1 (1, 4 – 6). XBP-1 is essential for the develop- ment of plasma cells (5), pancreatic acinar cells, and salivary gland cells (7), all of which are specialized for secretion and contain an elaborate ER network. The unfolded protein response mediates a novel splicing of XBP-1 mRNA to yield XBP-1(S), a basic leucine zipper protein with a transactivation domain. Indeed, heterologous enforced expression of XBP-1(S) in fibroblasts is sufficient to stimulate synthesis of phosphati- dylcholine (PtdCho), the primary phospholipid of the ER mem- brane, leading to increased intracellular membrane surface area and volume of ER and increased cell size (8, 9). The targets of transcriptional activation that drive membrane phospholipid syn- thesis during plasma cell maturation remain elusive, however, as expression of the genes of the PtdCho biosynthetic pathway are not significantly stimulated during XBP-1(S) induction (8, 9). The major route for PtdCho production is the CDP-choline pathway (11), and the supply of CDP-choline is governed by the activity of CCT. Three CCT isoforms are expressed differen- tially in tissues, but CCT is the dominant isoform that is expressed ubiquitously (12, 13). Several mechanisms that regu- late PtdCho synthesis have been uncovered, and most of these center on CCT. The rate of membrane PtdCho synthesis increases via stabilization of the transcript encoding CCT when macrophages proliferate in response to colony-stimulat- ing factor-1 (14). Similarly, enhanced expression of CCT accompanies the stimulation of PtdCho synthesis during neu- ronal differentiation (13, 15). Stimulation of PtdCho synthesis is associated with cell cycle progression in other cell types (16, 17), and in IIC9 cells it is accompanied by relocation of the CCT protein from the nucleus to the cytoplasm (18). Reduc- tion of PtdCho synthesis in stimulated pancreatic acini (19), in lung epithelial cells responding to tumor necrosis factor- (20, 21), or in cells undergoing farnesol-induced apoptosis (22) is * This work was supported by National Institutes of Health Grants GM 45737 (to S. J.) and GM 61970 (to J. B.), Cancer Center (CORE) Support Grant CA 21765, and the American Lebanese Syrian Associated Charities. The costs of publication of this article were defrayed in part by the payment of page charges. This article must therefore be hereby marked “advertisement” in accordance with 18 U.S.C. Section 1734 solely to indicate this fact. 1 Present address: Dept. of Microbiology, Chiang Mai University, Chiang Mai, 50200, Thailand. 2 To whom correspondence should be addressed. Tel.: 901-495-3494; Fax: 901-495-3099; E-mail: [email protected]. 3 The abbreviations used are: ER, endoplasmic reticulum; PtdCho, phosphati- dylcholine; PtdEtn, phosphatidylethanolamine; PtdOH, phosphatidic acid; FA, fatty acid; MUFA, monounsaturated fatty acid; PUFA, polyunsaturated fatty acid; DAG, diacylglycerol; CK, choline kinase; CCT, choline cytidylyl- transferase; CPT, choline phosphotransferase; P-choline, phosphocholine; CDP-choline, cytidine diphosphocholine; LPS, lipopolysaccharide; LUV, large unilamellar vesicle; DAPI, 4,6-diamidino-2-phenylidone; CHX, cyclo- heximide; BiP, Ig-binding protein; GRP94, glucose-regulated protein 94; XBP-1(S), spliced form of X-box-binding protein1; MS, mass spectrometry; DTT, dithiothreitol; PBS, phosphate-buffered saline; qRT-PCR, quantitative reverse transcription-PCR; IL, interleukin; M, microsomes; C, cytosol; M:C, microsomes to cytosol ratio. THE JOURNAL OF BIOLOGICAL CHEMISTRY VOL. 282, NO. 10, pp. 7591–7605, March 9, 2007 © 2007 by The American Society for Biochemistry and Molecular Biology, Inc. Printed in the U.S.A. MARCH 9, 2007 • VOLUME 282 • NUMBER 10 JOURNAL OF BIOLOGICAL CHEMISTRY 7591 by guest on December 27, 2019 http://www.jbc.org/ Downloaded from
Transcript of PhospholipidBiosynthesisProgramUnderlyingMembrane ... · binant CCT protein. Recombinant rodent CCT...
Phospholipid Biosynthesis Program Underlying MembraneExpansion during B-lymphocyte Differentiation*
Received for publication, August 25, 2006, and in revised form, January 9, 2007 Published, JBC Papers in Press, January 9, 2007, DOI 10.1074/jbc.M608175200
Paolo Fagone‡, Rungtawan Sriburi§1, Cheryl Ward-Chapman§, Matthew Frank‡, Jina Wang‡, Christopher Gunter‡,Joseph W. Brewer§, and Suzanne Jackowski‡2
From the ‡Department of Infectious Diseases, St. Jude Children’s Research Hospital, Memphis, Tennessee 38105-2794and the §Department of Microbiology and Immunology, Loyola University Medical Center, Maywood, Illinois 60153
Stimulated B-lymphocytes differentiate into plasma cellscommitted to antibody production. Expansion of the endoplas-mic reticulumandGolgi compartments is a prerequisite for highrate synthesis, assembly, and secretion of immunoglobulins.The bacterial cell wall component lipopolysaccharide (LPS)stimulates murine B-cells to proliferate and differentiate intoantibody-secreting cells that morphologically resemble plasmacells. LPS activation of CH12 B-cells augmented phospholipidproduction and initiated a genetic program, including elevatedexpression of the genes for the synthesis, elongation, anddesaturation of fatty acids that supply the phospholipid acylmoieties. Likewise, many of the genes in phospholipid biosyn-thesis were up-regulated, most notably those encoding Lipin1and choline phosphotransferase. In contrast, CTP:phosphocho-line cytidylyltransferase � (CCT�) protein, a key control pointin phosphatidylcholine biosynthesis, increased because of stabi-lization of protein turnover rather than transcriptional activa-tion. Furthermore, an elevation in cellular diacylglycerol andfatty acid correlated with enhanced allosteric activation ofCCT� by the membrane lipids. This work defines a genetic andbiochemical program for membrane phospholipid biogenesisthat correlateswith an increase in thephospholipid componentsof the endoplasmic reticulum and Golgi compartments in LPS-stimulated B-cells.
The differentiation of a B-lymphocyte into a plasma cell ischaracterized by a number of events, including expansion of theintracellular membrane network, particularly the rough endo-plasmic reticulum (ER),3 where immunoglobulins are synthe-
sized and assembled into functional antibodies. During ampli-fication of the ER, a few resident proteins are expressedpreferentially, although the majority increase proportionally tothe increased membrane surface area, maintaining the overallmembrane protein composition (1). Expression of select targetsof the unfolded protein response pathway, a complex interor-ganelle signaling system that emanates from the ER (2), is trig-gered during plasma cell differentiation (3). These targetsinclude ER chaperones like BiP and GRP94 and the transcrip-tion factor XBP-1 (1, 4–6). XBP-1 is essential for the develop-ment of plasma cells (5), pancreatic acinar cells, and salivarygland cells (7), all of which are specialized for secretion andcontain an elaborate ER network. The unfolded proteinresponse mediates a novel splicing of XBP-1 mRNA to yieldXBP-1(S), a basic leucine zipper protein with a transactivationdomain. Indeed, heterologous enforced expression of XBP-1(S)in fibroblasts is sufficient to stimulate synthesis of phosphati-dylcholine (PtdCho), the primary phospholipid of the ERmem-brane, leading to increased intracellular membrane surface areaand volume of ER and increased cell size (8, 9). The targets oftranscriptional activation that drivemembrane phospholipid syn-thesis during plasma cell maturation remain elusive, however, asexpression of the genes of the PtdCho biosynthetic pathway arenot significantly stimulated during XBP-1(S) induction (8, 9).The major route for PtdCho production is the CDP-choline
pathway (11), and the supply of CDP-choline is governed by theactivity of CCT. Three CCT isoforms are expressed differen-tially in tissues, but CCT� is the dominant isoform that isexpressed ubiquitously (12, 13). Several mechanisms that regu-late PtdCho synthesis have been uncovered, and most of thesecenter on CCT. The rate of membrane PtdCho synthesisincreases via stabilization of the transcript encoding CCT�when macrophages proliferate in response to colony-stimulat-ing factor-1 (14). Similarly, enhanced expression of CCTaccompanies the stimulation of PtdCho synthesis during neu-ronal differentiation (13, 15). Stimulation of PtdCho synthesisis associated with cell cycle progression in other cell types (16,17), and in IIC9 cells it is accompanied by relocation of theCCT� protein from the nucleus to the cytoplasm (18). Reduc-tion of PtdCho synthesis in stimulated pancreatic acini (19), inlung epithelial cells responding to tumor necrosis factor-� (20,21), or in cells undergoing farnesol-induced apoptosis (22) is
* This work was supported by National Institutes of Health Grants GM 45737(to S. J.) and GM 61970 (to J. B.), Cancer Center (CORE) Support Grant CA21765, and the American Lebanese Syrian Associated Charities. The costsof publication of this article were defrayed in part by the payment of pagecharges. This article must therefore be hereby marked “advertisement” inaccordance with 18 U.S.C. Section 1734 solely to indicate this fact.
1 Present address: Dept. of Microbiology, Chiang Mai University, Chiang Mai,50200, Thailand.
2 To whom correspondence should be addressed. Tel.: 901-495-3494; Fax:901-495-3099; E-mail: [email protected].
3 The abbreviations used are: ER, endoplasmic reticulum; PtdCho, phosphati-dylcholine; PtdEtn, phosphatidylethanolamine; PtdOH, phosphatidic acid;FA, fatty acid; MUFA, monounsaturated fatty acid; PUFA, polyunsaturatedfatty acid; DAG, diacylglycerol; CK, choline kinase; CCT, choline cytidylyl-transferase; CPT, choline phosphotransferase; P-choline, phosphocholine;CDP-choline, cytidine diphosphocholine; LPS, lipopolysaccharide; LUV,large unilamellar vesicle; DAPI, 4�,6-diamidino-2-phenylidone; CHX, cyclo-heximide; BiP, Ig-binding protein; GRP94, glucose-regulated protein 94;XBP-1(S), spliced form of X-box-binding protein1; MS, mass spectrometry;
DTT, dithiothreitol; PBS, phosphate-buffered saline; qRT-PCR, quantitativereverse transcription-PCR; IL, interleukin; M, microsomes; C, cytosol; M:C,microsomes to cytosol ratio.
THE JOURNAL OF BIOLOGICAL CHEMISTRY VOL. 282, NO. 10, pp. 7591–7605, March 9, 2007© 2007 by The American Society for Biochemistry and Molecular Biology, Inc. Printed in the U.S.A.
MARCH 9, 2007 • VOLUME 282 • NUMBER 10 JOURNAL OF BIOLOGICAL CHEMISTRY 7591
by guest on Decem
ber 27, 2019http://w
ww
.jbc.org/D
ownloaded from

associated with CCT� reduced activity because of protein deg-radation. Oxysterols stimulate CCT� phosphorylation, therebydecreasing PtdCho synthesis (23). In addition to mechanismsthat regulate CCT protein expression or modification, the bio-chemical activity of the enzyme is controlled by the membranelipid composition as CCT responds to both activators andinhibitors embedded in the PtdChomatrix (24, 25). The degreeof interaction between membrane lipids and the CCT proteindetermines the rate of PtdCho synthesis (26) and provides amechanism for adaptation to changes in the membrane envi-ronment. Finally, in the last step of PtdCho synthesis, the CPTuses both CDP-choline and DAG as substrates. Thus, in addi-tion to the supply of CDP-choline, the supply of DAG can be alimiting factor in membrane PtdCho biosynthesis (27–30).The CH12 cell line, a member of the CH series of murine
B-lymphoma cell lines (31), was employed as amodel system tolook into the changes in lipid metabolism responsible for theacceleration of membrane phospholipid synthesis to supportthe differentiation of activated B-cells into antibody-secretingplasma cells. Similar to splenic B-cells, CH12 cells bear surfaceIgM and class II molecules of the major histocompatibilitycomplex, and less than 3% secrete IgM under normal cultureconditions (32, 33). Differentiation and Ig secretion are inducedeither by lipopolysaccharide (LPS) exposure or by T-cells (33–36), and the morphological differentiation is similar to LPS-stimulated splenic B-cells (1). Analysis of the ultrastructuralchanges of CH12 cells during differentiation showed a 3–6-fold increase in the surface area of ER and Golgi and a similarincrease in ER resident proteins as shown by EM and immuno-blotting, respectively (1). Our work defines a complex patternof genetic and biochemical alterations in lipid metabolism thatlead to expansion of the intracellular membrane network inLPS-induced differentiation of CH12 B-cells.
EXPERIMENTAL PROCEDURES
CH12 B-cell Culture—The CH12 B-cell lymphoma cell line(31) was maintained by weekly passage as an ascites tumor inB10.A mice (The Jackson Laboratory, Bar Harbor, ME). Cellswere harvested by peritoneal lavage and cultured in RPMI 1640supplemented as described previously (4). CH12 B-cells wereseeded at 2 � 105 cells/ml, and differentiation was induced byexposure to 25�g/ml LPS (Escherichia coli 055:B5, Sigma) (31).Splenic B-cells were isolated from C57BL6/J mice by a deple-tion strategy using a B-cell isolation kit (Miltenyi Biotech)according to the manufacturer’s protocol. All proceduresinvolving mice were performed according to protocolsapproved by the Institutional Animal Care and Use Commit-tees of both St. Jude Children’s Research Hospital and LoyolaUniversity Medical Center.Lipid Extraction—CH12 cell pellets (2 � 107 cells) were
resuspended in 1 ml of water or PBS. The total volume wasmeasured, and a 100-�l aliquot was removed for proteindetermination. Lipids were extracted from a 900-�l aliquotby themethod of Bligh andDyer (37) using 2.4ml of acetic acidin methanol (2%, v/v) and 1 ml of chloroform in the first step,followed by 1.5 ml of chloroform and 1.2 ml of water in thesecond step to yield two phases, organic and aqueous. Theorganic phase was collected and dried.
Phospholipid Mass and Fatty Acid Distribution—Lipidsextracted from CH12 cells were resuspended in 100 �l of chlo-roform/methanol (2:1, v/v). A 1-�l aliquot was loaded onto athin layer silica gel rod and developed first in ether, dried, andthen developed in chloroform/methanol/acetic acid/water (50:25:8:2, v/v). Lipids were detected by flame ionization using anIatroscan Instrument (Iatron Laboratories), and peaks wereintegrated with PEAKSIMPLE software (SRI Instruments).Peaks were identified by comigration with authentic standards.PtdCho and PtdEtn masses were calculated using standardcurves for each.Lipids extracted from CH12 cells were resuspended in anhy-
drous methanol and converted into fatty acid methyl esters byaddition of few drops of acetyl chloride followed by overnightincubation at room temperature. The solvent was dried undernitrogen, and the methyl esters were recovered by extractionusing hexane/water (1:2, v/v). The organic phase was driedunder nitrogen, and the methyl esters were dissolved into car-bon disulfide and analyzed using a HP 5890 gas chromatographequipped with a flame ionization detector and a capillary GCcolumn: DB-225, 30 m � 0.53 mm, 0.5 �m (J & W Scientific).Methyl esters were identified by their retention times as deter-mined using gas-liquid chromatographymethyl ester standardsin the FIM-FAME-7 mixture (Matreya).Phospholipid Electrospray-MS/MS Analysis—Mass spec-
trometry (MS) of PtdCho was performed by the Hartwell Cen-ter for Bioinformatics and Biotechnology at St. Jude Children’sResearch Hospital. Approximately 50 �g of total lipid was dis-solved in 0.25 ml of chloroform/methanol 50:50 (v/v) � 1%formic acid. MS analysis was performed using a FinniganTMTSQ� Quantum (Thermo Electron, San Jose, CA) triple qua-drupole mass spectrometer equipped with the nanospray ionsource. Samples were introduced via static nanoelectrosprayusing EconTipsTM (NewObjective, Woburn, MA). The instru-ment was operated in the positive ion mode using parent ionscanning for PtdCho. Ion source parameters were as follows:spray voltage 1000 V, capillary temperature 270 °C, capillaryoffset 35 V, and tube lens offset was set by infusion of the poly-tyrosine tuning and calibration solution (Thermo Electron, SanJose, CA) in electrospray mode. MS acquisition parameters forPtdCho were as follows: scan range 600–900 m/z, scan time0.3 s, productmass 184.1m/z, collision energy 40 V, peak widthQ1 and Q3 0.7 FWHM, and Q2 CID gas 0.5 millitorr. Instru-ment control and data acquisition were performed with theFinniganTM XcaliburTM (version 1.4 SR1) software (ThermoElectron, San Jose, CA).IgM Secretion Rates and Enzyme-linked Immunosorbent
Assays—CH12 cells, cultured for 24 and 48 h with or withoutLPS, were harvested and washed. Cells were subcultured at 2 �105 viable cells/ml and incubated at 37 °C for 2 h; the amount ofIgM secreted in the medium was measured by enzyme-linkedimmunosorbent assay using goat anti-mouse IgM,� chain-spe-cific, goat anti-mouse �-alkaline phosphatase, � chain-specific(SouthernBiotech, Birmingham,AL), and 4-methylumbelliferylphosphate (Sigma) as substrate.Enzyme Assays—CK and CCT activities in CH12 cell lysates
were measured as described previously (8). The activation ofCCT by CH12 cell lipids was measured using purified recom-
B-cell Membrane Biogenesis
7592 JOURNAL OF BIOLOGICAL CHEMISTRY VOLUME 282 • NUMBER 10 • MARCH 9, 2007
by guest on Decem
ber 27, 2019http://w
ww
.jbc.org/D
ownloaded from
binant CCT� protein. Recombinant rodent CCT� wasexpressed as histidine-tagged protein in SF9 insect cells andpurified bymetal-affinity and size-exclusion chromatographiesusing a HiTrapTM chelating HP column and a HiLoadTM 16/60SuperdexTM 200 column (Amersham Biosciences). Briefly,enzymatic activity was measured by incubation at 37 °C for 30min of 0.5 �g/ml recombinant CCT� in assay buffer (100 mMHEPES, pH 7.4, 100mMKCl, 20mMMgCl2, 1mMEGTA) in thepresence of 1 mM CTP, 1 mM phosphocholine labeled with 3.2�Ci/mmol [14C]phosphocholine (55 mCi/mmol; AmershamBiosciences), and LUVs at concentrations ranging from 10 to200 �g/ml. The enzymatic reaction was stopped with 400 mMEDTA (5�l for 50�l assay volume). Substrate andproductwereseparated using Silica Gel H layers developed with methanol,0.1 M NaCl, ammonium hydroxide (50:50:5, v/v) and identifiedby co-migration with authentic standards. The radioactivityassociated with reagent and product was measured using aBIOSCAN AR-2000 imaging system. CCT� affinity for lipidwas expressed as half-maximal stimulatory activity andwas cal-culated by nonlinear regression analysis using Prism 4 software,version 4.00 (GraphPad software, Inc.). LUVs were preparedfrom lipids extracted fromCH12 cells that were resuspended inbuffer (15 mM sodium phosphate, pH 7.4, 150 mM NaCl) to afinal phospholipid concentration of 1 mg/ml by vortexing andsonication. LUVs were extruded through a 100 nm pore diam-eter polycarbonate membrane, and the phospholipid concen-tration was determined colorimetrically using ammonium fer-rothiocyanite (38). LUVs were stored at 4 °C and used within 2days of preparation. CPT activity in CH12 microsomes, pre-pared from frozen cell pellets, was determined as described pre-viously (8, 39).DAG Quantification—DAG was quantified in lipids
extracted from cells according to the protocol of Preiss et al.(40). The extracted samples or 1,2-dioleoyl-sn-glycerol stand-ard (Avanti, Alabaster, AL) were solubilized in octyl-�-D-glu-coside/cardiolipin, and DAG mass was determined by enzy-matic assay in a reaction buffer containing 100 mM imidazoleHCl, 100 mM NaCl, 25 mM MgCl2, 2 mM EGTA, pH 6.6, 20 mMDTT, DAG kinase (Calbiochem), and 10mMATP plus 1 �Ci of[�-32P]ATP (30 Ci/mmol). The reaction was incubated at roomtemperature for 30 min. The reaction was stopped by the addi-tion of chloroform/methanol (1:2, v/v) and 1% HClO4, and the[32P]phosphatidic acid product was extracted using chloro-form, 1% HClO4 (1:1, v/v). After centrifugation at 5,000 � g toseparate the phases, the upper layer was discarded, and thelower layer, which contained [32P]phosphatidic acid product,waswashed twicewith 1%HClO4 and dried under vacuum.Thedried sampleswere dissolved in 5%methanol in chloroformandfractionated on TLC plates developed in chloroform/metha-nol/acetic acid (65:27:8, v/v). Spots corresponding to the phos-phatidic acid were scraped and counted for the radioactivityusing scintillation spectroscopy.Metabolic Labeling—CH12 B-cells were seeded at 2 � 105
cells/ml in medium with or without 25 �g/ml LPS. At timesafter LPS addition, cells were harvested and resuspended inCH12 medium containing 6 �M choline and supplementedwith 10 �Ci/ml methyl[3H]choline (specific activity, 85Ci/mmol) or 2�Ci/ml [2-14C]acetate (specific activity, 55mCi/
mmol), obtained from American Radiolabeled Chemicals, Inc.After labeling for 2, 2.5, or 3 h, cells were harvested, counted,and subjected to extraction according to the method of Blighand Dyer (37). The amount of radiolabel incorporated intothe organic and aqueous phases was quantified by scintilla-tion counting. A 50-�l aliquot of each aqueous phase wasspotted onto Silica Gel H layers (Analtech) that were devel-oped in methanol, 0.1 M NaCl, ammonium hydroxide (50:50:5, v/v). Choline, phosphocholine, and CDP-choline wereidentified by co-migration with standards and the bandsexcised; the fractional distribution of choline intermediateswas determined by scintillation counting of the excisedbands. The rate of [14C]acetate incorporation (2 h) into FAand DAG was estimated by TLC of the organic phase usingCHCl3/methanol/acetic acid (98:2:1, v/v). FA and DAG weredetected and identified by co-migration with [14C]dioleoyl-glycerol and [14C]oleic acid (American Radiolabeled Chem-icals) using a Typhoon 9200 PhosphorImager (AmershamBiosciences) after exposure of the TLC plate to a phosphorusscreen, and the band intensities were quantified usingImageQuant software, version 5.2 (Amersham Biosciences).CPT Assay in Permeabilized Cells—CH12 B-cells were
seeded at 2� 105 cells/ml inmediumwith or without 25 �g/mlLPS. At times after LPS addition, cells were harvested andresuspended at 108 cells/ml in 50 �l of labeling medium asfollows: choline-free culture medium supplemented with 2 mM
EGTA, 2 mM DTT, 80 �M digitonin, 0.02% Tween 20, and 100�M [14C]CDP-choline 0.9 �Ci/ml (American RadiolabeledChemicals). Cells were incubated for 4 min at 37 °C; reactionswere stopped by adding 240 �l of 2% acetic acid in methanol.Lipids were extracted as described earlier, and the amount ofcholine incorporated into PtdCho was estimated by scintilla-tion spectroscopy.RNA Transcript Measurements—Total RNA was isolated
from CH12 B-cells cultured with or without LPS for 3, 24, or48 h using TRIzol (Invitrogen); contaminating genomicDNA was removed by digestion with DNase I, and aliquotswere stored as an ethanol precipitate at �20 °C. cDNA wasprepared from RNA by reverse transcription using Super-Script II RNase H� reverse transcriptase (Invitrogen) andrandom primers. Primers and probes for real time qRT-PCRwere designed using Primer Express� software (version 2.0;Applied Biosystems) and are listed in Table 1. Real time qRT-PCR was carried out using the 7300 Real Time PCR Systemand 7300 System SDS software (version 1.2.3; Applied Bio-systems). The Taqman Rodent GAPDH control reagent(Applied Biosystems) was the source of the primers andprobes for quantifying the control Gapdh mRNA. The col-lected data were analyzed using the CT method (41); theamount of target RNA was normalized to the endogenousGapdh reference and related to the amount of target RNA inuntreated cells. The specific number of experiments (n) andp values for statistical significance as evaluated by Student’st test (unpaired) are reported in each legend; the followingconvention was used for representing significance: * indi-cates 0.01 � p � 0.05; ** indicates 0.001 � p � 0.01, and ***indicates p � 0.001.
B-cell Membrane Biogenesis
MARCH 9, 2007 • VOLUME 282 • NUMBER 10 JOURNAL OF BIOLOGICAL CHEMISTRY 7593
by guest on Decem
ber 27, 2019http://w
ww
.jbc.org/D
ownloaded from

Affymetrix Array Analysis—Following the manufacturer’sprotocol, total RNA was used to prepare cRNA for hybridiza-tion, washing, and scanning of a GeneChip� Mouse Genome430 2.0 array (Affymetrix, Inc., Santa Clara, CA) using a Gene-Chip� Fluidics Station 400 and a GeneArrayTM scanner. Datawere collected using Microarray Suite software (formerlyknown as GeneChip� Suite software). Comparison and statis-tical analysis of all the Affymetrix data were achieved usingSpotfire� DecisionSiteTM 8.11 (Spotfire, Inc.) software. Thespecific number of experiments (n) and p values for statisticalsignificance as evaluated by Student’s t test (unpaired) arereported in the footnotes to Table 2.Immunoprecipitation—CH12 cells were cultured with LPS
for 0, 24, and 48 h. At each time point, cycloheximide (CHX)was added to themedium to a final concentration of 100�g/ml,and the cells were harvested after 1–3 h of incubation. Pelletscontaining the same cell number (2� 107) were then lysedwith1.4 ml of ice-cold lysis buffer (50 mM Tris-HCl, pH 8.0, 5 mMEDTA, 0.1 mM Na3VO4, 50 mM NaF, Complete Inhibitor Mix-ture (Roche Applied Science), 5 mMDTT, 1 mM phenylmethyl-sulfonyl fluoride, and 0.1% Triton X-100). CCT� was immuno-precipitated with rabbit anti-CCT� antibody using proteinA-SepharoseTM 4 Fast Flow (Amersham Biosciences) and fol-lowing the manufacturer’s protocol. Immunoprecipitated pro-teins and lysate from 293T cells overexpressing recombinant
CCT� were then separated by 8% SDS-PAGE and transferredonto Immuno-Blot� PVDF membrane (Bio-Rad). The mem-brane was blocked with a suspension of 5% dry milk in 20 mMTris-HCl, pH 7.4, 137 mM NaCl, and 0.1% (v/v) Tween 20(TBS-T) and washed with TBS-T. The membrane was thenincubated for 1.5 h with anti-CCT� antibody (5 �g/ml inTBS-T � 1% dry milk), washed with TBS-T, incubated for 1 hwith protein A-horseradish peroxidase (Sigma, 1 �g/ml inTBS-T � 1% dry milk), and washed with TBS-T. Protein A wasdetected by chemiluminescence using the ECL Plus Westernblotting detection system (Amersham Biosciences) and KodakBiomax MR film. CCT� band intensities were analyzed byImageQuant software, version 5.2 (Amersham Biosciences),and the protein half-life was estimated by one-phase exponen-tial decay analysis using Prism 4 software, version 4.00 (Graph-Pad software, Inc.). Cell lysates were prepared as described pre-viously (42). Chemiluminescent immunoblotting of Ig � and �chains, GRP94, BiP, TRAP�, XBP-1, and �-actin was per-formed as described (42).Immunohistochemistry—CH12 cells were exposed to LPS for
0 and 48h, harvested, and fixed to glass slides using a cytospin at500 � g for 5 min. Cells were fixed with methanol/acetic acid(3:1, v/v) two times for 10 min and then washed with waterthree times for 10 min and air-dried. The slides were incubatedwith 1 mg/ml NaBH4 in PBS two times for 5 min and then
TABLE 1Sequences of the real time qRT-PCR primers and probes (5�–3�)mRNA sequences were downloaded fromMouse Genome Informatics. Primers and probes were designed using Primer Express� software (version 2.0; Applied Biosystems).
Gene Forward primer Reverse primer ProbeChka GGCCAAGATCTCATCCATTGAA TGGTCAAAGTAGGCCTCGAATC TGGGTACATGGAATATGCCCAChkb AAGGGCCAGCTGACGAGTT CGGAGGCTCCAGGAGAAAC CCCATCATCCTGAGGATCCAAPcyt1a TGGATGCACAGAGTTCAGCTAAA TGCTCCATTAGGGCCAGGT CCTCTTTCCTCCTCTTCCTCGAATTGAChpt1 GGCCCCCAACACCATCA GGGCAGTAGAAGATGAGCACTAGTG CTCGCCATCAACCTGGTCACCept1 GTGTTGGCAAAAATGGGTCAA CACTGATCCAATATGCAGAAAAGG CATAGCAGGAACAAGTGTCCTTT CFasn CCTGGATAGCATTCCGAACCT AGCACATCTCGAAGGCTACACA CTGAGGGACCCTACCGCATAGCElovl6 TTTTCGTGTGGCTTGTTTACGT TTGATCCCATTCCCACAGAAG TGGAATTGGAAAAGAATAAAATCTGAScd2 TTCTTTGCTTTGTCCCTGATGA TGGTGTACTCTGGAAGGTGAACA CCGCCGCTCAGCTATAGGTCPpap2a GAAGAGGATCCACACACGACTCT TTCAGGGCTCGTGATTGGTT CAGTTCACGGAACTAPpap2b GCGATGTCCTGGCAGGATT GAGGTCGGACACGAAGAACAC CAAGGAGCTCTGGTGGCCTGPecr GAGAGCACGGAGGGTCGAT AGTGTGCGCGGCTGTTG ATTGTCCTTCTTAATAATGGGTTTFads2 CTTCAAAACCAACCACCTGTTCT ACCAGGCAAGGCTTTCCAT TCTCCTCCTGTCCCACATCATLpin1 GCCGGAAGACTCCTGATAAAATG GTTGGCGACTGGTCACTAAAAGT CATTCACAGCGAGTC
TABLE 2Expression of genes in PtdCho synthesis altered in CH12 B-cells treated with LPS for 24 or 48 hRNA was extracted from CH12 cells at 24 or 48 h after culture � LPS. Gene expression was evaluated by Affymetrix analysis, and the ratio between treated and untreatedcells was calculated.
Probe name Gene symbol Gene name
Ratio(�LPS vs.untreated)
24 h 48 h1422619_ata,b Ppap2a Phosphatidic acid phosphatase 2a 3.2c1417403_ata Elovl6 ELOVL family member 6, elongation of long chain fatty acids 2.5c1428386_ata Acsl3 Acyl-CoA synthetase long chain family member 3 2.2c1415822_ata Scd2 Stearoyl-coenzyme A desaturase 2 2.1c1434287_ata Agpat5 1-Acylglycerol-3-phosphate O-acyltransferase 5 (lysophosphatidic acid acyltransferase, �) 2.1d1428821_at Agpat2 1-Acylglycerol-3-phosphate O-acyltransferase 2 (lysophosphatidic acid acyltransferase, �) �2.5d1439167_ata Pecr Peroxisomal trans-2-enoyl-CoA reductase 3.5d 5.6d1428336_ata Agpat4 1-Acylglycerol-3-phosphate O-acyltransferase 1 (lysophosphatidic acid acyltransferase, �) 2.2c 1.9c1429514_ata Ppap2b Phosphatidic acid phosphatase type 2B �6.2d �5.4c1424048_a_at Cyb5r1 Cytochrome b5 reductase 1 2.3d1418288_ata Lpin1 Lipin 1 2.1d1455901_ata Chpt1 Choline phosphotransferase 1 2.7c
a This is one of multiple probe sets.b This is not in agreement with real time qRT-PCR.c Values are 0.05 � p � 0.01, n � 4.d Values are 0.01 � p � 0.001, n � 4.
B-cell Membrane Biogenesis
7594 JOURNAL OF BIOLOGICAL CHEMISTRY VOLUME 282 • NUMBER 10 • MARCH 9, 2007
by guest on Decem
ber 27, 2019http://w
ww
.jbc.org/D
ownloaded from

washed three times for 5 min with PBS to reduce autofluores-cence. CCT� was localized by incubation with rabbit anti-CCT� followed by goat anti-rabbit Ig linked to AlexaFluor 564(Molecular Probes). IgM was localized by incubation with goatanti-mouse IgM AlexaFluor 488 (Molecular Probes). Slides weremounted with ProLong� Gold antifade reagent with or withoutDAPI (MolecularProbes).Confocalmicroscopywasperformedbythe Scientific Imaging Shared Resource at St. Jude Children’sResearch Hospital using a Zeiss LSM 510 META multiphotonmicroscope equipped with a Plan-Neofluor �40/1.3 oil objectiveand controlled by laser scanning microscope LSM 510 software(version 3.2 SP@) (Carl Zeiss GmbH, Germany).Electron Microscopy—After 48 h of culture in medium alone
or in the presence of LPS or IL-5, CH12 cellswere harvested andfixed in 2.5% glutaraldehyde in 0.1 M sodium cacodylate buffer.After fixation, the cells were spun down, placed in 2% agar, andrinsed in three 10-min changes of 0.1 M sodium cacodylatebuffer with 5% sucrose. Cells were post-fixed in 1% osmiumtetroxide in the same buffer for 1 h and then rinsed twice for 10min in buffer. After running through a graded series of alcoholand clearing in propylene oxide, samples were infiltrated withequal parts Epon araldite/propylene oxide, followed by twochanges of 100% Epon araldite. The samples were embedded infresh plastic and polymerized at 80 °C overnight. Sample sections,70 nm thickness, were analyzed using a Jeol 1200EX 125KV elec-tron microscope equipped with an AMTV542 2K camera(Advanced Microscopy Techniques Corp.) at the IntegratedMicroscopy Center at the University ofMemphis, Tennessee.
RESULTS
Lipid Biogenesis—CH12 B-cells were cultured with or with-out LPS for 24 and 48 h.Membrane lipid composition was thenmeasured following solvent extraction and chromatographyanalysis. PtdCho (55% of the total lipid) was the major mem-brane lipid in CH12 B-cells, and the cellular content of PtdChoincreased significantly following LPS treatment (Fig. 1A).PtdEtn, the second major component (15% of the total lipid),followed suit. Cholesterol was 2.5% of total lipids and alsoincreased. Cholesterol esters did not change, and triglycerides,diacylglycerols, free fatty acids, and other lipid species were notreliably quantified using this methodology. Data in the inset ofFig. 1A illustrate that there was not an increase in the phospho-lipid or cholesterol components when CH12 B-cells were cul-tured without LPS. The cells accumulated proteins as well aslipids after 24 and 48 h of LPS stimulation (Fig. 1C), and theproteins represented both resident ER proteins and newly syn-thesized Ig proteins destined for secretion. The kinetics of pro-tein accumulation did not strictly parallel the kinetics of lipidaccumulation (Fig. 1, A and C). Newly synthesized IgM wassecreted at a rate of 13 �g/h/107 cells at 24 h after LPS, and therate doubled at 48 h after LPS (Fig. 1D), correlating with thelower protein content per cell at 48 h (Fig. 1C). PtdCho andPtdEtn were significantly more than the cellular protein con-tent at 48 h following LPS (Fig. 1B), which correlated withexpansion of the intracellular membrane network (see Fig. 9)(43). A change in the cellular lipid content was not observed inCH12 cells cultured for the same length of time in the absenceof LPS (Fig. 1, A and B, insets). These data establish that the
formation of phospholipid is significantly activated to providethe bulk membrane lipid components required for the expansionof theERandGolgi compartment inLPS-stimulatedCH12B-cells.Gene Expression Analysis—Affymetrix arrays were used to
first survey the expression of lipogenic genes. CH12 B-cells cul-tured for 48 h with LPS were compared with control cells cul-tured without LPS. A global view of the gene expressionchanges using gene ontogeny analysis (44) showed, as expected,that the most significant biological process affected by LPSstimulation was the defensive immune response to biotic stim-uli (p � 4.6 � 10�26), and the most significant cellular compo-nents affected were the endoplasmic reticulum (p� 1� 10�12)and the nuclear envelope-endoplasmic reticulum network (p�2 � 10�10). We focused on the genes involved in bulk lipidproduction and used the array data to identify the isoforms ofthese enzymes expressed in theCH12 cells. This subset of genesthat was significantly affected by LPS exposure for 24 and 48 his shown in Table 2. These data revealed a pattern indicatingup-regulation of specific isozymes in FA synthesis, FA modifi-cation, and the CDP-choline pathway of PtdCho biosynthesis.The transcripts that reliably changed by about 2-fold or moreamong replicate experiments are listed. Notably, expression ofgenes encoding enzymes in the CDP-ethanolamine pathway orthe serine decarboxylase pathway of PtdEtn biosynthesis didnot change significantly, nor did the PtdEtn methyltransferasetranscripts.We next investigated the individual genes encodingeach of the key pathway enzymes using real time qRT-PCR toquantify the changes in transcript levels over time, and we cor-related these changes with biochemical rate measurementswhere possible. We also investigated expression of genes thatwere of potential importance in lipid synthesis but did not sig-nal as changed on the microarray to confirm the data.Regulation of PtdCho Synthesis—PtdCho is synthesized
through two pathways, the CDP-choline pathway and thePtdEtn methylation pathway. The main route to PtdCho inB-cells is theCDP-choline pathway (45), which synthesizes Ptd-Cho via CK, CCT, and CPT. Cultured CH12 cells were depend-ent on this pathway because they did not survive in in vitroculture if the medium was choline-deficient (data not shown).PtdCho synthesis via the CDP-choline pathway, as well as thedistribution of PtdCho precursors, was determined by labelingthe cells for 2-, 2.5-, and 3.0-h intervalswith 6�M [3H]choline atvarious time points after the addition of LPS. After 3 h of incu-bation, CDP-cholinewas the smallest component (Fig. 2A), andits content was not different between treated and untreatedcells (Fig. 2B, gray bars). However, the relative rate of CDP-choline synthesis was greater in LPS-treated cells (cells treatedwith LPS divided by cells without LPS) and increased 2.5-foldby 48 h after LPS treatment (Fig. 2B, white bars). The rate ofradiolabeled choline incorporation into PtdCho increased byalmost 2- and 6-fold at 24 and 48 h, respectively, comparedwiththe rate at time 0 (Fig. 2B). These data indicated that theincreased activity of the CDP-choline pathway correlated withthe net increase in PtdCho following the LPS stimulation (Fig.1). The relatively large amount of radiolabeled P-choline com-paredwith the small amount of CDP-choline demonstrated notonly active CK but that the constriction point, or rate-limitingstep, in the pathway was CCT (Fig. 2A). The small size of the
B-cell Membrane Biogenesis
MARCH 9, 2007 • VOLUME 282 • NUMBER 10 JOURNAL OF BIOLOGICAL CHEMISTRY 7595
by guest on Decem
ber 27, 2019http://w
ww
.jbc.org/D
ownloaded from

radiolabeled CDP-choline pool indicated that the product ofthe CCT enzyme was rapidly converted into PtdCho. It is theslow step that determines the rate of flux through any pathway,and these data indicated that the CCT activity had to change toproduce more PtdCho. To confirm that CDP-choline synthesiswas the rate-limiting step in vivo, permeabilized CH12 cellswere incubated for 4 min with an excess supply (100 �M) of[14C]CDP-choline to measure CPT/CEPT activity. The rate ofcholine incorporation into PtdCho in stimulated, permeabi-lized cells (Fig. 2D) was 100 times higher than in intact cells (Fig.2C) and illustrated that the supply ofCDP-choline in intact cellsgoverned the rate of PtdCho synthesis, despite an increasedabundance of CPT. Addition of exogenous DAG to the assaydid not change the rate of PtdCho synthesis, indicating that theamount of endogenous DAG was sufficient during these shortterm measurements. Cells labeled with [3H]ethanolamine at
times during a 48-h LPS exposure showed that the rate ofPtdEtn conversion into PtdCho, in pmol/h/107cells, was as fol-lows: 2 (6% of the PtdEtn) at 0 h, 8 (9%) at 6 h, 58 (7%) at 24 h,and 101 (10%) at 48 h. Thus, there was increased conversionthat was mediated by PtdEtn methyltransferase, but it contrib-uted only 2–3% of the total cellular PtdCho, and this route ofsynthesis alone could not account for the dramatic increase inPtdCho.Expression of Enzymes for PtdCho Synthesis—The catalytic
activities of the CDP-choline pathway were determined inlysates from LPS-treated cells as a measure of protein expres-sion. CPT, CK, and CCT enzyme-specific activities were meas-ured in vitro (Fig. 2E). Cellular CPT activity increased 3-fold at24 h and 6-fold at 48 h after LPS exposure (Fig. 2E). CPT is anintegralmembrane protein (46), and the increased CPT activityat 48 h correlated with expansion of the ER and Golgi (43). CK
FIGURE 1. Lipid accumulation and IgM secretion in CH12 B-cells following LPS treatment. CH12 cells were cultured with or without 25 �g/ml LPS, and the cellswere harvested after 0, 24, and 48 h. A and B, total lipids, as well as PtdCho, PtdEtn, cholesterol, and cholesterol ester (Chol-Ester), from cells harvested after 0 (white bars),24 (gray bars), and 48 h (dark gray bars) were quantified and normalized to either cell number (A) or cellular protein (B) in LPS-treated and untreated (insets) cells.C, cellular protein in treated (closed circles) and untreated (open circles) cells at different times in culture. D, IgM secretion rate after 24 and 48 h of culture in untreated(light gray) and LPS-treated (dark gray) cells. The results are the mean values from three determinations�S.D. and are representative of two independent experiments.
B-cell Membrane Biogenesis
7596 JOURNAL OF BIOLOGICAL CHEMISTRY VOLUME 282 • NUMBER 10 • MARCH 9, 2007
by guest on Decem
ber 27, 2019http://w
ww
.jbc.org/D
ownloaded from
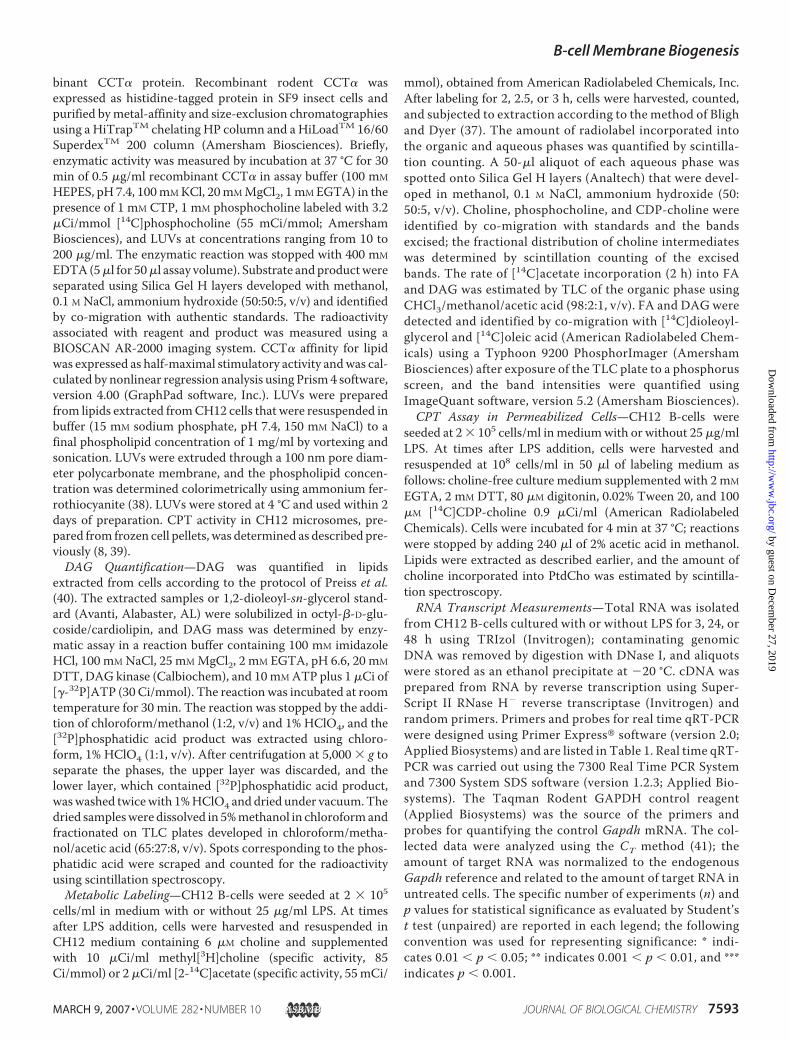
activity, normalized to cell number, increased 70% after LPSexposure, and CCT activity exhibited a 40% increase followingstimulation with LPS (Fig. 2E). Thus, the activities of all com-ponents of the CDP-choline pathway were greater during LPS-
induced differentiation, with CPTexhibiting the highest rise. Theincreased CK and CPT capacitiesworked in conjunction with therate-limiting CCT to augment Ptd-Cho synthesis.The contribution of gene expres-
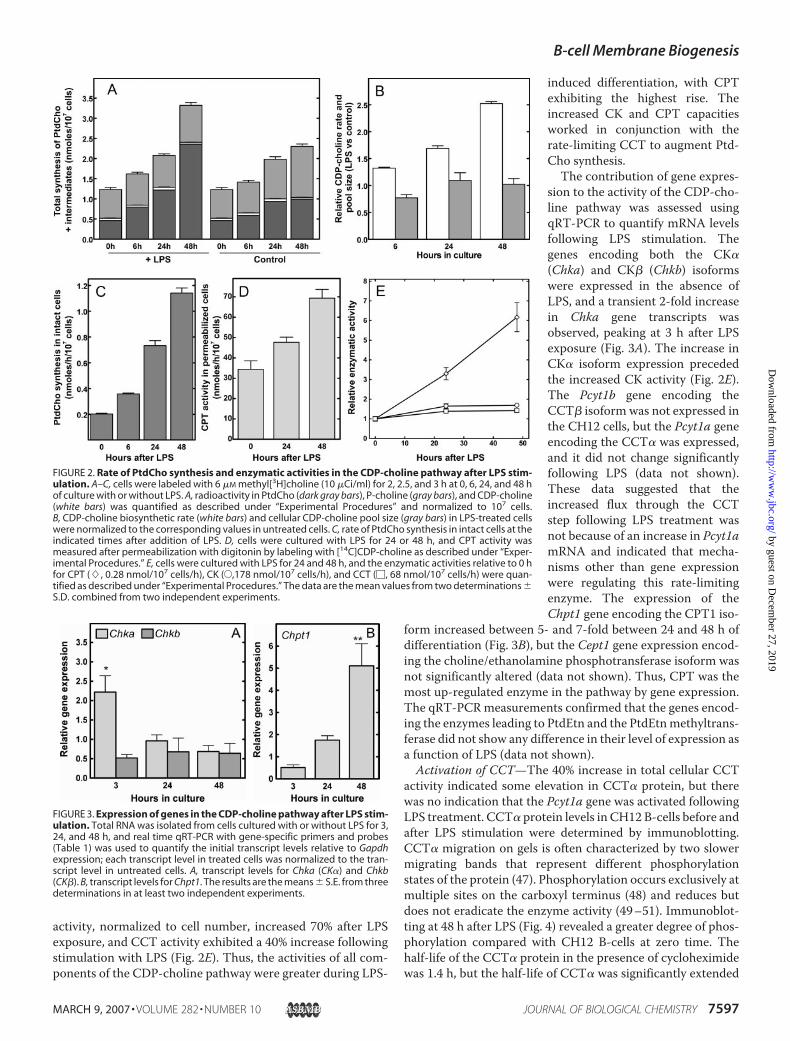
sion to the activity of the CDP-cho-line pathway was assessed usingqRT-PCR to quantify mRNA levelsfollowing LPS stimulation. Thegenes encoding both the CK�(Chka) and CK� (Chkb) isoformswere expressed in the absence ofLPS, and a transient 2-fold increasein Chka gene transcripts wasobserved, peaking at 3 h after LPSexposure (Fig. 3A). The increase inCK� isoform expression precededthe increased CK activity (Fig. 2E).The Pcyt1b gene encoding theCCT� isoform was not expressed inthe CH12 cells, but the Pcyt1a geneencoding the CCT� was expressed,and it did not change significantlyfollowing LPS (data not shown).These data suggested that theincreased flux through the CCTstep following LPS treatment wasnot because of an increase in Pcyt1amRNA and indicated that mecha-nisms other than gene expressionwere regulating this rate-limitingenzyme. The expression of theChpt1 gene encoding the CPT1 iso-
form increased between 5- and 7-fold between 24 and 48 h ofdifferentiation (Fig. 3B), but the Cept1 gene expression encod-ing the choline/ethanolamine phosphotransferase isoform wasnot significantly altered (data not shown). Thus, CPT was themost up-regulated enzyme in the pathway by gene expression.The qRT-PCRmeasurements confirmed that the genes encod-ing the enzymes leading to PtdEtn and the PtdEtnmethyltrans-ferase did not show any difference in their level of expression asa function of LPS (data not shown).Activation of CCT—The 40% increase in total cellular CCT
activity indicated some elevation in CCT� protein, but therewas no indication that the Pcyt1a gene was activated followingLPS treatment. CCT� protein levels in CH12 B-cells before andafter LPS stimulation were determined by immunoblotting.CCT� migration on gels is often characterized by two slowermigrating bands that represent different phosphorylationstates of the protein (47). Phosphorylation occurs exclusively atmultiple sites on the carboxyl terminus (48) and reduces butdoes not eradicate the enzyme activity (49–51). Immunoblot-ting at 48 h after LPS (Fig. 4) revealed a greater degree of phos-phorylation compared with CH12 B-cells at zero time. Thehalf-life of the CCT� protein in the presence of cycloheximidewas 1.4 h, but the half-life of CCT� was significantly extended
FIGURE 2. Rate of PtdCho synthesis and enzymatic activities in the CDP-choline pathway after LPS stim-ulation. A–C, cells were labeled with 6 �M methyl[3H]choline (10 �Ci/ml) for 2, 2.5, and 3 h at 0, 6, 24, and 48 hof culture with or without LPS. A, radioactivity in PtdCho (dark gray bars), P-choline (gray bars), and CDP-choline(white bars) was quantified as described under “Experimental Procedures” and normalized to 107 cells.B, CDP-choline biosynthetic rate (white bars) and cellular CDP-choline pool size (gray bars) in LPS-treated cellswere normalized to the corresponding values in untreated cells. C, rate of PtdCho synthesis in intact cells at theindicated times after addition of LPS. D, cells were cultured with LPS for 24 or 48 h, and CPT activity wasmeasured after permeabilization with digitonin by labeling with [14C]CDP-choline as described under “Exper-imental Procedures.” E, cells were cultured with LPS for 24 and 48 h, and the enzymatic activities relative to 0 hfor CPT (�, 0.28 nmol/107 cells/h), CK (E,178 nmol/107 cells/h), and CCT (�, 68 nmol/107 cells/h) were quan-tified as described under “Experimental Procedures.” The data are the mean values from two determinations �S.D. combined from two independent experiments.
FIGURE 3. Expression of genes in the CDP-choline pathway after LPS stim-ulation. Total RNA was isolated from cells cultured with or without LPS for 3,24, and 48 h, and real time qRT-PCR with gene-specific primers and probes(Table 1) was used to quantify the initial transcript levels relative to Gapdhexpression; each transcript level in treated cells was normalized to the tran-script level in untreated cells. A, transcript levels for Chka (CK�) and Chkb(CK�). B, transcript levels for Chpt1. The results are the means � S.E. from threedeterminations in at least two independent experiments.
B-cell Membrane Biogenesis
MARCH 9, 2007 • VOLUME 282 • NUMBER 10 JOURNAL OF BIOLOGICAL CHEMISTRY 7597
by guest on Decem
ber 27, 2019http://w
ww
.jbc.org/D
ownloaded from

within 24 h after LPS (Fig. 4). Furthermore, real time qRT-PCRanalysis indicated no change in Pcyt1a expression followingcycloheximide exposure (data not shown). These data indicatedthat the increase in total cellular CCT� activity was because ofstabilization of protein turnover, rather than an increase in
Pcyt1a transcription because of cycloheximide inhibition of atranscriptional repressor.CCT� protein is found either in the cytoplasm, in association
with organelle membranes, or in the nuclear matrix. In manycell types, nuclear CCT� dominates (52, 53) and is transportedto this site via a nuclear localization signal at its amino terminus(54). Lung epithelia are an exception where CCT� is locatedexclusively outside the nucleus where a high rate of PtdChoformation is occurring to support the secretion of lung surfac-tant (55). Differentiating B-cells also have high rates of PtdChosynthesis (56) (Fig. 2A), and we found CCT� to be located out-side the nucleus in CH12 B-cells in proximity to the expandingextranuclearmembrane compartment.An antibody specific forthe CCT� catalytic region was used for in situ immunofluores-cent localization, and the protein was predominantly foundoutside the nucleus both before (Fig. 5A1) and after LPS treat-ment (Fig. 5B1). The protein co-localized with the IgM synthe-sized in the ERboth before and during differentiation (Fig. 5,A3andB3), and these data showed that CCT� proteinwas in prox-imal association with the ER membranes in CH12 cells ratherthan being translocated to the nucleus. Likewise, analysis ofprimary naı̈ve murine splenic B-cells revealed that CCT� wasalso located outside of the nucleus and associated with the IgMcounterstain (Fig. 5C3).CCT� can associate with membranes, and the membrane
lipid composition is a major determinant of its enzyme activity(24).Wewereunable toevaluate theCCTactivity followingLPS in
digitonin-permeabilized cells, and sowe fractionated B-cell lysates intomembrane and cytoplasmic compo-nents tomeasure the total CCTactiv-ity associatedwitheach (Table3).Theproportion of membrane activity(M:C)washigher inLPS-treated sam-ples at 24 h, and at 48 h the LPS-treated values matched those ofuntreated fractionated lysates. Thesedeterminations reflected theeffectsofendogenous lipid, because no addi-tional lipid vesicles were added to theassays, and the lipids associated withthe different fractions were notstrippedawaybydetergent solubiliza-tion. The addition of the PtdCho/oleic acid maximum activatorrevealed the total activity associatedwith each fraction, and membrane-associated CCTwas slightly higher inlysates prepared from LPS-treatedversus untreated cells. The data withlipid activator point out the 40%increase in CCT activity that wasobserved in total cell lysates followingLPS (Fig. 2E) but suggest that the dis-tribution of protein between mem-brane and cytoplasm was not asbiased as the endogenous lipid activa-tion of each fraction.
FIGURE 4. Stabilization of CCT� protein during LPS-induced differentia-tion. CH12 B-cells were exposed to LPS for 24 and 48 h, and at each time pointCHX was added to the medium, and the cells were harvested after 0, 1, 2, and3 h. Cells were lysed and CCT� recovered by immunoprecipitation of equalnumbers of cells using a previously characterized antibody raised againstfull-length recombinant rodent CCT� (55). Immunoprecipitated CCT� pro-tein was fractionated by SDS-PAGE and immunoblotted as described under“Experimental Procedures.” The three bands representing CCT� (arrows)were quantified and normalized to the initial protein level without CHX ateach 0-h time point (bar graph). The illustrated immunoblot and the corre-sponding bar graph represent one of three independent experiments. Theprotein half-lives were calculated from these data as described under “Exper-imental Procedures.” The average of the three independent experiments �S.D. is shown below the immunoblot for cells without LPS treatment or 24 or48 h after LPS. CCT� degradation was not observed in any of the 24- and 48-hsamples, and �16 h is used to indicate that the half-life is longer than theaverage cell doubling time.
FIGURE 5. Intracellular location of CCT� in CH12 and primary splenic B-cells. CCT� (green) and IgM (red)were localized by immunostaining untreated CH12 B-cells (row A) and cells exposed to LPS for 48 h (row B).Untreated primary splenic B-cells are shown in row C. The nuclei of splenic B-cells were stained with DAPI (C3and C4, blue), and the contours of the CH12 cells were defined by bright field images (A4 and B4). CCT�, IgM, andDAPI/bright field images were merged and are shown in A3 and B3. The experiment was repeated twice withtwo different fixation methods with the same results.
B-cell Membrane Biogenesis
7598 JOURNAL OF BIOLOGICAL CHEMISTRY VOLUME 282 • NUMBER 10 • MARCH 9, 2007
by guest on Decem
ber 27, 2019http://w
ww
.jbc.org/D
ownloaded from

Purified CCT has low activity when exposed to vesiclesmadeup of PtdCho alone, but it is activated several orders of magni-tude by the addition of specific lipids, such asDAGor fatty acid,
to the vesicles. Thus, alterations inmembrane lipid composition incells may contribute to the stimula-tion of activity and flux through theCCT step during B-cell differentia-tion. We tested whether the lipidcomposition of B-cell membranesinfluenced CCT� activity usingpurified, lipid-depleted recombi-nant CCT�. Lipids extracted fromB-cells at 0, 24, and 48 h after LPStreatment activated CCT� to differ-ent extents. The half-maximal stim-ulatory activity for the lipid prepara-tions, measured as the lipidconcentration required to reach halfof the maximum enzyme velocity,decreased from 15 �M in untreatedcells to 7 �M 48 h after LPS stimula-tion (Fig. 6A). The amount of lipidvesicles added to each assay wasbased on the phospholipid content,and thus the data indicated the pres-ence of higher proportions of lipidactivators that would promoteCCT� membrane association. Thebulk composition of the lipid vesi-cles is illustrated in Fig. 1, but theamphiphiles known to be mostpotent were below the detectionlimits of those determinations.Thus, we used the more sensitiveDAG kinase assay to measure DAG,one of the known activators pre-sumably in the cellular lipid mix-ture. The cellular DAG contentincreased from 2.0 � 0.2 nmol/107cells at time 0 to 8.8 � 0.2 nmol/107cells at 48 h (p� 0.0001; n� 8) afterLPS treatment (Fig. 6A). These datamirrored the increased affinity ofCCT� for themembrane lipids (Fig.6A). Free FA is another amphiphile
that is known to activate CCT, and so radiolabeling was used tomeasure both DAG and FA synthesis at times following LPS.The incorporation of [14C]acetate into FAs, DAG, and the total
FIGURE 6. CCT� regulation by endogenous lipids. Cells were cultured with LPS for 0, 24, and 48 h, and lipidswere extracted, and the amount of phospholipids was quantified as described under “Experimental Proce-dures.” A, half-maximal stimulatory activity (F) of purified recombinant CCT� in response to LUVs preparedfrom CH12 cellular lipids at indicated times after LPS treatment. DAG content in the lipid fraction is shown by E.The data represent the mean of five determinations � S.D. and are representative of two independent exper-iments. B, cells were cultured with LPS for 0, 6, 24, and 48 h and pulsed with 2 �Ci/ml [2-14C]acetate for 2 h ateach time point. Lipids were extracted, fractionated by TLC, and quantified as described under “ExperimentalProcedures.” The rates of DAG (F), FA (E), and total lipid (f) synthesis were normalized to 107 cells. C and D,total RNA was isolated from cells cultured with or without LPS for 3, 24, and 48 h and real time qRT-PCR withgene-specific primers, and probes were used to quantify the transcript levels relative to Gapdh of PtdOHphosphatases capable of generating DAG and to quantify the change in each gene transcript relative to thelevel in samples without LPS. C, Ppap2b transcripts encode the PtdOH phosphatase 2b isoform; D, Lpin1 tran-scripts encode the Lipin1 PtdOH phosphatase. The results are the mean values � S.E. from three determina-tions and are representative of at least two independent experiments.
TABLE 3CCT activity distribution in CH12 B-cells cultured � LPS for 24 or 48 hCH12 cells were harvested at 24 or 48 h after culture � LPS. Microsomes were recovered by centrifugation as described under “Experimental Procedures.” CCT activity inthe cytosol (C) and microsomes (M) was measured with or without lipid activator (DOPC/OA). Total activity (C � M) and the microsomes to cytosol ratio (M:C) werecalculated.
Hours in culture Lipid activatorCCT activity (nmol/h/107 cells)
LPS-treated UntreatedTotal M:C Total M:C
24 � 10.3 � 0.2 22.3 � 0.6 7.0 � 1.1 14.9 � 2.548 9.0 � 0.5 7.2 � 0.4 6.9 � 0.4 8.9 � 1.924 � 20.5 � 0.2 1.55 � 0.03 16.9 � 1.8 1.13 � 0.2248 21.8 � 1.5 0.79 � 0.12 14.2 � 0.7 0.72 � 0.08
B-cell Membrane Biogenesis
MARCH 9, 2007 • VOLUME 282 • NUMBER 10 JOURNAL OF BIOLOGICAL CHEMISTRY 7599
by guest on Decem
ber 27, 2019http://w
ww
.jbc.org/D
ownloaded from
lipid fraction was evaluated in 2-h pulse-labeling experiments(Fig. 6B). The rate of synthesis of lipid acyl groups increasedsubstantially as early as 6 h after LPS stimulation and remainedelevated thereafter. The rate of DAG synthesis increased at 6 hand remained elevated throughout the 48 h of LPS treatment.Free FAs were also able to accumulate at an increased rate at 24and 48 h after LPS. On the other hand, PtdEtn is also an activa-tor compared with PtdCho, and although it is less potent thanDAG and FA, it is more abundant. The data in Fig. 1 indicatedthat the fraction of PtdEtn relative to PtdCho did not increaseafter LPS, however. There may have been other amphiphiles inthe lipid mixture that as yet are unidentified as activators andthat are below the limits of detection.Nevertheless, thesewouldbe included in the lipids derived from the stimulated CH12cells, and altogether, the lipid mixture promotes an increase inCCT enzymatic activity after LPS stimulation.Production of the Lipogenic Components following LPS
Stimulation—DAG in the de novo pathway of phospholipidbiosynthesis is produced by PtdOH phosphatase activity, andthere are several isoforms expressed in CH12 B-cells. The pre-dominant isoform was Ppap2b, which was expressed at 30-foldhigher levels than Ppap2a, and �100-fold higher than Lpin1.Although the expression of Ppap2a remained constant (datanot shown) during the 48-h culture of both treated anduntreated cells, Ppap2b and Lpin1 transcripts underwent a
striking differential regulation.Compared with untreated cells,Ppap2b transcripts decreased sig-nificantly, as denoted by a ratio�1.0 (Fig. 6C). The expression ofthe Lpin1 gene, recently identifiedas encoding a PtdOH phosphatase(57), increased by 7-fold followingLPS exposure (Fig. 6D). The expres-sion of the Lipin1 phosphatase andthe CPT in the CDP-choline path-way displayed the largest overallincreases in gene expression andwere stimulated in a coordinateman-ner. These data suggested that Lipin1was an important phosphatase activ-ity that responded toLPS to stimulateDAG production.The increase in bulk phospho-
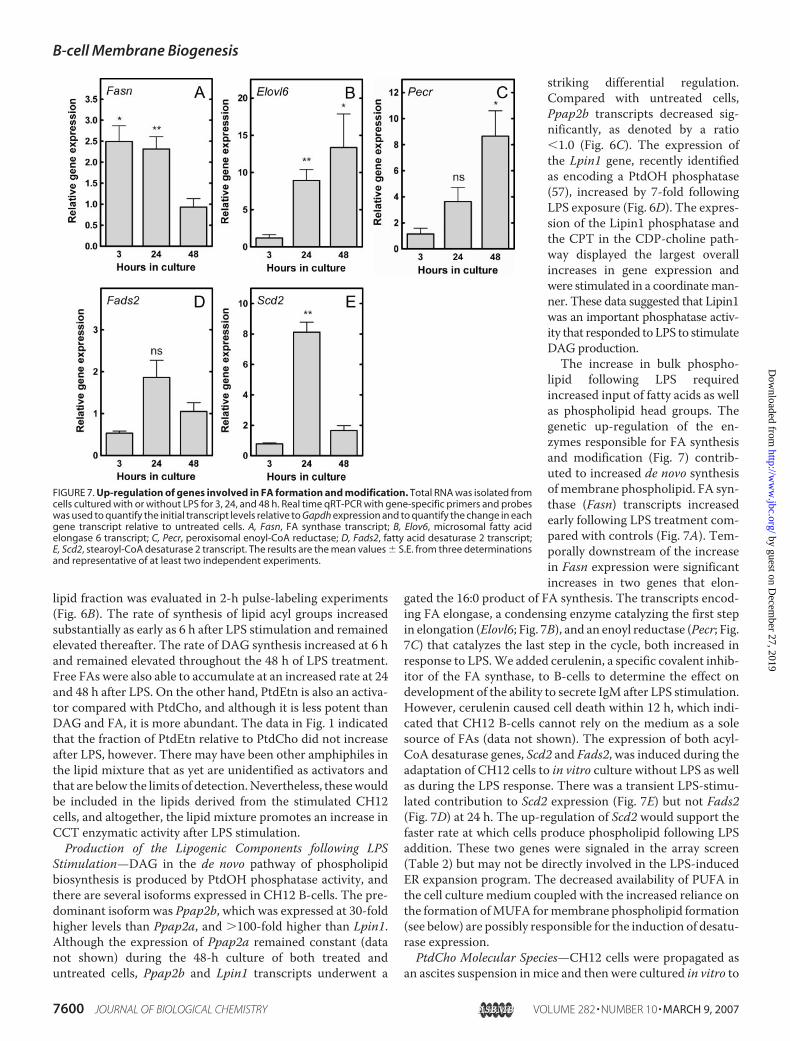
lipid following LPS requiredincreased input of fatty acids as wellas phospholipid head groups. Thegenetic up-regulation of the en-zymes responsible for FA synthesisand modification (Fig. 7) contrib-uted to increased de novo synthesisofmembrane phospholipid. FA syn-thase (Fasn) transcripts increasedearly following LPS treatment com-pared with controls (Fig. 7A). Tem-porally downstream of the increasein Fasn expression were significantincreases in two genes that elon-
gated the 16:0 product of FA synthesis. The transcripts encod-ing FA elongase, a condensing enzyme catalyzing the first stepin elongation (Elovl6; Fig. 7B), and an enoyl reductase (Pecr; Fig.7C) that catalyzes the last step in the cycle, both increased inresponse to LPS.We added cerulenin, a specific covalent inhib-itor of the FA synthase, to B-cells to determine the effect ondevelopment of the ability to secrete IgM after LPS stimulation.However, cerulenin caused cell death within 12 h, which indi-cated that CH12 B-cells cannot rely on the medium as a solesource of FAs (data not shown). The expression of both acyl-CoA desaturase genes, Scd2 and Fads2, was induced during theadaptation of CH12 cells to in vitro culture without LPS as wellas during the LPS response. There was a transient LPS-stimu-lated contribution to Scd2 expression (Fig. 7E) but not Fads2(Fig. 7D) at 24 h. The up-regulation of Scd2 would support thefaster rate at which cells produce phospholipid following LPSaddition. These two genes were signaled in the array screen(Table 2) but may not be directly involved in the LPS-inducedER expansion program. The decreased availability of PUFA inthe cell culture medium coupled with the increased reliance onthe formation ofMUFA formembrane phospholipid formation(see below) are possibly responsible for the induction of desatu-rase expression.PtdCho Molecular Species—CH12 cells were propagated as
an ascites suspension inmice and then were cultured in vitro to
FIGURE 7. Up-regulation of genes involved in FA formation and modification. Total RNA was isolated fromcells cultured with or without LPS for 3, 24, and 48 h. Real time qRT-PCR with gene-specific primers and probeswas used to quantify the initial transcript levels relative to Gapdh expression and to quantify the change in eachgene transcript relative to untreated cells. A, Fasn, FA synthase transcript; B, Elov6, microsomal fatty acidelongase 6 transcript; C, Pecr, peroxisomal enoyl-CoA reductase; D, Fads2, fatty acid desaturase 2 transcript;E, Scd2, stearoyl-CoA desaturase 2 transcript. The results are the mean values � S.E. from three determinationsand representative of at least two independent experiments.
B-cell Membrane Biogenesis
7600 JOURNAL OF BIOLOGICAL CHEMISTRY VOLUME 282 • NUMBER 10 • MARCH 9, 2007
by guest on Decem
ber 27, 2019http://w
ww
.jbc.org/D
ownloaded from

evaluate their responses to LPS. PUFAs accounted for 44% ofthe total FA in mouse serum, whereas the serum used in cellculture contained only 7% PUFA (data not shown). Thus, bothcontrol and LPS-stimulated B-cells exhibited a decrease inPUFA and an increase in MUFA during cell culture, and LPSstimulation resulted in an acceleration of this change. In LPS-stimulated cells, PUFA decreased from 40.6 � 0.5% at time 0 to14.1 � 1.0% at 48 h, and MUFA increased from 18.6 � 0.2 to39.3 � 2.8% in the same time frame. In unstimulated cells,MUFA was 32.1 � 1.3% of the total, reflecting the same trendbut to a lesser extent because of the lower levels of PtdChosynthesis in unstimulated cells. The ratio of saturated/unsatur-ated fatty acid at time 0 (1.4) and at 48 h (1.1) was modestlyaltered in both the control and LPS-stimulated cells. These FAcompositional changes were clearly reflected in the PtdChomolecular species profile (Fig. 8). PtdCho molecular speciescontaining 18:2, 20:4, and 22:6 fatty acids were abundant inCH12 cells when they were harvested from mice (Fig. 8A). At24 h, these molecular species had diminished in control cells(Fig. 8B), and this effect was exacerbated by LPS stimulation(Fig. 8C). These data support the idea that increased PtdChoproduction for ER membrane formation was supported bythe acceleration of the de novo FA synthesis and modifica-tion systems.Comparison of LPS- and IL-5-induced B-cell Differenti-
ation—B-lymphocytes can be stimulated by a number ofligands to secrete Ig proteins. For example, CH12 B-cells differ-entiate into Ig-secreting cells in response to LPS, interleukin(IL)-5, and IL-6 (58). Thus we compared the lipogenicresponses of CH12 B-cells stimulated by LPS and by IL-5 todetermine whether a selection of those parameters we identi-fied as important for the response to LPSwere generally impor-tant for plasmablast differentiation. LPS and IL-5 treatmentresulted in similar morphological changes as illustrated in Fig.9. Unstimulated cells (Fig. 9A) were smaller, and the regionoutside the nucleus, which contained the extranuclearorganelles including ER and Golgi, was considerably smallerthan the nucleus. Stimulation with either LPS (Fig. 9B) or IL-5(Fig. 9C) for 48 h resulted in a dramatic increase in cell size,largely because of expansion of the region outside the nucleus.The cytoplasm of the stimulated cells contained a large numberof ER membranous structures as well as more mitochondria.Immunoblot analysis of CH12 B-cells was done with restingcells and following culture without treatment, treatment withLPS, or treatment with IL-5 for 48 h (Fig. 10A). These datashowed increased expression of the ER-soluble chaperone pro-teins GRP94 and BiP, a component of the ER-associated trans-loconTRAP�, secretory IgMheavy chain�s, the Ig� light chain�, and the unfolded protein response-associated splice varianttranscription factor XBP-1(S), following stimulation witheither ligand. The rates of IgM secretion from both LPS- andIL-5-stimulated cells increased as well after 24 and 48 h of stim-ulation (Fig. 10C). We measured the phospholipid content incells after 48 h of stimulation with either ligand, and we nor-malized the data to cells cultured without ligand. Both ligandsresulted in significantly increased PtdCho and PtdEtn, whichcorrelated with the increased intracellular membrane struc-tures and increased cell surface areas (Fig. 9, B and C). The
expression of two key genes, Chpt1 and Lpin1, also increasedafter 48 h of IL-5 stimulation (Fig. 10D). Transcripts for thesegenes encoding the CPT enzyme and the Lipin1 phosphatasedid not increase relative to untreated controls at 24 h, however,and these kinetics were similar to those following LPS stimula-tion (Fig. 3 and 6). These data support the concept that many of
FIGURE 8. PtdCho molecular species in differentiating CH12 B-cells. Lipidswere extracted from cells cultured with or without (w/o) LPS for 0 or 24 h, andPtdCho molecular species profiles were determined by mass spectrometry asdescribed under “Experimental Procedures.” A, CH12 cells isolated from asci-tes fluid. B, PtdCho molecular species of CH12 cells cultured in vitro withoutLPS for 24 h. C, PtdCho molecular species of CH12 cells stimulated with LPS for24 h.
B-cell Membrane Biogenesis
MARCH 9, 2007 • VOLUME 282 • NUMBER 10 JOURNAL OF BIOLOGICAL CHEMISTRY 7601
by guest on Decem
ber 27, 2019http://w
ww
.jbc.org/D
ownloaded from

the changes outlined in this study underlie B-cell differentia-tion into plasmablasts that secrete IgM.
DISCUSSION
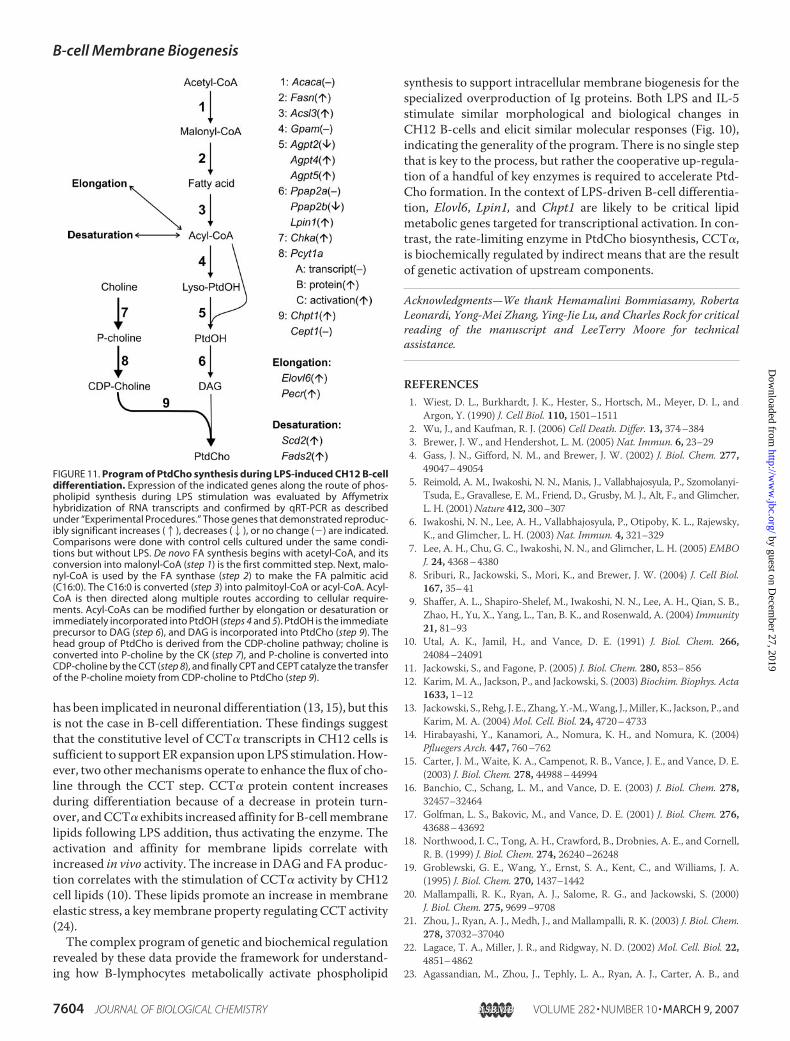
Our analysis of lipidmetabolism inCH12B-cells defines a setof genetic components that lead to the increase in phospholipidsynthesis during LPS-induced differentiation (Fig. 11). Theswitch to high rate antibody synthesis and secretion in the ter-minal differentiation of B-lymphocytes into antibody-produc-ing plasma cells is accompanied by expansion of the ER andGolgi compartments (Fig. 10) (1). The increase in PtdCho thatis destined for the Golgi and ER compartments correlates withtransient elevation of CK transcripts leading to a modest 70%increase in protein expression (Fig. 2E) and a progressive andsignificant increase in CPT transcripts and protein (Fig. 2E).However, a combination of biochemical mechanisms stimulatethe CCT (Fig. 2E, Table 3, and Figs. 4 and 6) that determines theoverall rate of PtdCho synthesis. CCT protein levels modestlyincrease by 40% due in part to decreased protein degradationand significant increase in protein half-life following LPS stim-ulation (Fig. 4). Our data do not address the possibility ofincreased CCT translation as a contributing factor, as it occursin XBP-1(S)-transduced fibroblasts (59). The associationbetween cellular phospholipid plus activating lipid amphiphilesand CCT protein is also enhanced (Fig. 6A), thereby increasingactivity (Table 3). The combination of these processes contrib-utes to an increased rate of CDP-choline synthesis in intact cells(Fig. 2B). An increase in the association of CCT�with lipids hasbeen reported to confer resistance to proteolytic digestion (60);however, themeasurement of total protein activity in themem-brane and cytoplasmic fractions under optimal conditions(Table 3) would suggest that the resistance to proteolysis is notbecause of an increased ratio of CCT that is membrane-associ-ated. Rather, LPS induces the stabilization of a number of B-cellproteins by a general mechanism (61), and CCT is likelyincluded in this subset.The bulk lipid increases after LPS stimulation, but the bulk
composition does not change substantially (Fig. 1). Rather,more subtle changes in cellular lipid composition contribute tothe clear stimulation of CCT activity (Figs. 2B and 6A). Amongthese changes, we measured increased accumulation of DAGand free FA (Fig. 6, A and B), two lipids that activate CCTpotently when embedded in a PtdCho matrix (25, 26) (Table 3and Fig. 6, A and B). Replacement of PUFA and longer chainacyl groups with MUFA and shorter chain acyl groups on Ptd-Cho (Fig. 8) may also contribute to the lipid-mediated stimula-tion of CCT, along with possible trace amounts of other phos-pholipids such as phosphatidic acid, phosphatidylglycerol, orlipids that as yet are unidentified.Nevertheless, the direct test ofthe hypothesis in Fig. 6A shows that the cellular lipid mixturecontributes to activation of the CCT after LPS stimulation.So what factors contribute to elevating the DAG and FA lev-
els? Our data indicate that among the PtdOH phosphatasesexpressed in CH12 cells, expression of the Lipin1 isoform is
FIGURE 9. Morphology of CH12 cells treated with LPS or IL-5. CH12cells, cultured for 48 h in medium alone (A) or in the presence of LPS (B) orIL-5 (C), were prepared and analyzed by electron microscopy as described
under “Experimental Procedures.” The cytosolic fraction appears moreextended and richer in organelles in differentiating CH12 cells than in cells cul-tured in medium alone. N, nucleus; M, mitochondria; ER, endoplasmic reticulum.
B-cell Membrane Biogenesis
7602 JOURNAL OF BIOLOGICAL CHEMISTRY VOLUME 282 • NUMBER 10 • MARCH 9, 2007
by guest on Decem
ber 27, 2019http://w
ww
.jbc.org/D
ownloaded from

responsive to LPS in a positive manner (Fig. 6,C andD). To thebest of our knowledge,DAG is produced in thede novo pathwayof phospholipid synthesis by the action of the PtdOH phospha-tases (Fig. 11). DAG can also be derived from phospholipasedegradation of pre-existing phospholipid, but we focused onthe possible targets in de novo synthesis because the Affymetrixanalysis did not indicate any changes in phospholipase C or Dexpression, and because phospholipase action would decreaserather than increase the amount of phospholipid in cells. TheDAGhas two roles during lipogenesis in theB-cell system. First,it is a required precursor for bulk phospholipid production as aco-substrate for theCPT togetherwithCDP-choline. Second, itis an activator of theCCT step. The FA also has two roles duringlipogenesis. First, it is a de novo precursor for PtdOH and DAG(Fig. 11). Second, it is also an activator of the CCT. As interme-diates in the phospholipid biosynthetic pathway, DAG and FAcould be considered as feedforward regulators, and mecha-nisms that enhance their accumulation would have a positiveeffect on PtdCho production.DAG, as a key intermediate in phospholipid synthesis, has
been reported to increase in conjunction with increased Ptd-Cho synthesis (27, 62, 63), and our data are in agreement (Fig. 6,A and B). It is interesting that the DAG elevation is accompa-nied by down-regulation of Ppap2b expression, the principal
PtdOH phosphatase found in CH12cells, and an equally pronouncedup-regulation of Lpin1 (Fig. 6,C andD). Both of these genes encodePtdOH phosphatases (57), and ourexpression profiling suggests thatLipin1 is key to promoting phos-pholipid formation. Chpt1 is thefinal step in PtdCho synthesis and issignificantly up-regulated. Thus,CPT is not just amarker of ERmem-brane expansion but may also be acritical factor in the phospholipidresponse to LPS. However,increased CPT expression alone isnot sufficient to drive PtdCho syn-thesis in other systems (29). Thesimilarity in the gene expressionpatterns of Lipin1 andCPT suggeststhat they may be regulated coordi-nately. XBP-1(S) is a key transcrip-tion factor required for plasma celldevelopment (8, 9), but becausethe genes involved in lipid metab-olism are temporally downstreamfrom the proximal differentiationstimulus, it seems most likely thatthe connection between XBP-1(S)and the biosynthetic genes is indi-rect, and the transcriptional ele-ments controlling the expressionof these key genes warrant furtherinvestigation.There is increased transcription
of genes in the de novo biosynthetic pathway that yields the FAsdestined for bulk phospholipid and for CCT activation, startingwith FA synthase, followed by the genes responsible for acyl-CoA formation, acyl chain elongation, and desaturation. Thestimulation of expression of these genes by LPS is consistentwith the phospholipid compositional data (Fig. 8) and suggeststhat the differentiating cells rely mostly on endogenously pro-duced FA to produce PtdCho, the major membrane phospho-lipid, as well as a portion of the PtdEtn. The Elovl6 transcriptlevel is elevated considerably from a low initial level, markingthis enzyme as a key step in promoting the elongation of the16-carbon fatty acid produced by FA synthase to the 18-car-bon fatty acids preferred by the stearoyl-CoA desaturases.Acyl-CoA desaturase (Scd2 and Fads2) gene expression isregulated primarily as an adaptation to in vitro culture. Theenhanced expression of the Acsl3 gene encoding an isoformof the acyl-CoA synthetase suggests that this isoform isinvolved in producing acyl-CoAs for PtdOH formationrather than degradation.CCT is the most downstream constriction point in PtdCho
synthesis, and the regulation of this key step is an importantexception to the genetic program outlined above. CCT tran-script levels are not elevated in LPS-stimulated CH12 B-cells,although the CK andCPT genes are. Increased CCT expression
FIGURE 10. Similarities between LPS- and IL-5-stimulated CH12 B-cells. CH12 cells were cultured in mediaalone or in the presence of LPS or IL-5 for 24 or 48 h. At different time points, cells were harvested and analyzedas described under “Experimental Procedures.” A, immunoblot analysis of CH12 B-cells. Equivalent amounts ofprotein were loaded per lane. Blots were probed for the following: GRP94 and BiP, soluble ER chaperones;TRAP�, component of ER translocons; �m and �s, membrane and secretory IgM heavy chain, respectively; �, Ig� light chain; XBP-1(S) and �-actin. B, PtdCho and PtdEtn lipid/protein ratio at 24 (light gray bars) and 48 h (darkgray bars) normalized to the same ratio at 0 h. C, IgM secretion rate measured at the indicated times for cellscultured in medium alone (light gray bars) or in the presence of IL-5 (gray bars) or LPS (dark gray bars). D, Chpt1and Lpin1 gene expression in IL-5-treated cells normalized to untreated cells at 24 (light gray bars) and 48 h(dark bars).
B-cell Membrane Biogenesis
MARCH 9, 2007 • VOLUME 282 • NUMBER 10 JOURNAL OF BIOLOGICAL CHEMISTRY 7603
by guest on Decem
ber 27, 2019http://w
ww
.jbc.org/D
ownloaded from
has been implicated in neuronal differentiation (13, 15), but thisis not the case in B-cell differentiation. These findings suggestthat the constitutive level of CCT� transcripts in CH12 cells issufficient to support ER expansion uponLPS stimulation.How-ever, two othermechanisms operate to enhance the flux of cho-line through the CCT step. CCT� protein content increasesduring differentiation because of a decrease in protein turn-over, andCCT� exhibits increased affinity for B-cellmembranelipids following LPS addition, thus activating the enzyme. Theactivation and affinity for membrane lipids correlate withincreased in vivo activity. The increase in DAG and FA produc-tion correlates with the stimulation of CCT� activity by CH12cell lipids (10). These lipids promote an increase in membraneelastic stress, a keymembrane property regulating CCT activity(24).The complex program of genetic and biochemical regulation
revealed by these data provide the framework for understand-ing how B-lymphocytes metabolically activate phospholipid
synthesis to support intracellular membrane biogenesis for thespecialized overproduction of Ig proteins. Both LPS and IL-5stimulate similar morphological and biological changes inCH12 B-cells and elicit similar molecular responses (Fig. 10),indicating the generality of the program. There is no single stepthat is key to the process, but rather the cooperative up-regula-tion of a handful of key enzymes is required to accelerate Ptd-Cho formation. In the context of LPS-driven B-cell differentia-tion, Elovl6, Lpin1, and Chpt1 are likely to be critical lipidmetabolic genes targeted for transcriptional activation. In con-trast, the rate-limiting enzyme in PtdCho biosynthesis, CCT�,is biochemically regulated by indirect means that are the resultof genetic activation of upstream components.
Acknowledgments—We thank Hemamalini Bommiasamy, RobertaLeonardi, Yong-Mei Zhang, Ying-Jie Lu, and Charles Rock for criticalreading of the manuscript and LeeTerry Moore for technicalassistance.
REFERENCES1. Wiest, D. L., Burkhardt, J. K., Hester, S., Hortsch, M., Meyer, D. I., and
Argon, Y. (1990) J. Cell Biol. 110, 1501–15112. Wu, J., and Kaufman, R. J. (2006) Cell Death. Differ. 13, 374–3843. Brewer, J. W., and Hendershot, L. M. (2005) Nat. Immun. 6, 23–294. Gass, J. N., Gifford, N. M., and Brewer, J. W. (2002) J. Biol. Chem. 277,
49047–490545. Reimold, A. M., Iwakoshi, N. N., Manis, J., Vallabhajosyula, P., Szomolanyi-
Tsuda, E., Gravallese, E. M., Friend, D., Grusby, M. J., Alt, F., and Glimcher,L. H. (2001)Nature 412, 300–307
6. Iwakoshi, N. N., Lee, A. H., Vallabhajosyula, P., Otipoby, K. L., Rajewsky,K., and Glimcher, L. H. (2003) Nat. Immun. 4, 321–329
7. Lee, A. H., Chu, G. C., Iwakoshi, N. N., and Glimcher, L. H. (2005) EMBOJ. 24, 4368–4380
8. Sriburi, R., Jackowski, S., Mori, K., and Brewer, J. W. (2004) J. Cell Biol.167, 35–41
9. Shaffer, A. L., Shapiro-Shelef, M., Iwakoshi, N. N., Lee, A. H., Qian, S. B.,Zhao, H., Yu, X., Yang, L., Tan, B. K., and Rosenwald, A. (2004) Immunity21, 81–93
10. Utal, A. K., Jamil, H., and Vance, D. E. (1991) J. Biol. Chem. 266,24084–24091
11. Jackowski, S., and Fagone, P. (2005) J. Biol. Chem. 280, 853–85612. Karim, M. A., Jackson, P., and Jackowski, S. (2003) Biochim. Biophys. Acta
1633, 1–1213. Jackowski, S., Rehg, J. E., Zhang, Y.-M.,Wang, J.,Miller, K., Jackson, P., and
Karim, M. A. (2004)Mol. Cell. Biol. 24, 4720–473314. Hirabayashi, Y., Kanamori, A., Nomura, K. H., and Nomura, K. (2004)
Pfluegers Arch. 447, 760–76215. Carter, J. M., Waite, K. A., Campenot, R. B., Vance, J. E., and Vance, D. E.
(2003) J. Biol. Chem. 278, 44988–4499416. Banchio, C., Schang, L. M., and Vance, D. E. (2003) J. Biol. Chem. 278,
32457–3246417. Golfman, L. S., Bakovic, M., and Vance, D. E. (2001) J. Biol. Chem. 276,
43688–4369218. Northwood, I. C., Tong, A. H., Crawford, B., Drobnies, A. E., and Cornell,
R. B. (1999) J. Biol. Chem. 274, 26240–2624819. Groblewski, G. E., Wang, Y., Ernst, S. A., Kent, C., and Williams, J. A.
(1995) J. Biol. Chem. 270, 1437–144220. Mallampalli, R. K., Ryan, A. J., Salome, R. G., and Jackowski, S. (2000)
J. Biol. Chem. 275, 9699–970821. Zhou, J., Ryan, A. J., Medh, J., and Mallampalli, R. K. (2003) J. Biol. Chem.
278, 37032–3704022. Lagace, T. A., Miller, J. R., and Ridgway, N. D. (2002) Mol. Cell. Biol. 22,
4851–486223. Agassandian, M., Zhou, J., Tephly, L. A., Ryan, A. J., Carter, A. B., and
FIGURE 11. Program of PtdCho synthesis during LPS-induced CH12 B-celldifferentiation. Expression of the indicated genes along the route of phos-pholipid synthesis during LPS stimulation was evaluated by Affymetrixhybridization of RNA transcripts and confirmed by qRT-PCR as describedunder “Experimental Procedures.” Those genes that demonstrated reproduc-ibly significant increases (1), decreases (2), or no change (�) are indicated.Comparisons were done with control cells cultured under the same condi-tions but without LPS. De novo FA synthesis begins with acetyl-CoA, and itsconversion into malonyl-CoA (step 1) is the first committed step. Next, malo-nyl-CoA is used by the FA synthase (step 2) to make the FA palmitic acid(C16:0). The C16:0 is converted (step 3) into palmitoyl-CoA or acyl-CoA. Acyl-CoA is then directed along multiple routes according to cellular require-ments. Acyl-CoAs can be modified further by elongation or desaturation orimmediately incorporated into PtdOH (steps 4 and 5). PtdOH is the immediateprecursor to DAG (step 6), and DAG is incorporated into PtdCho (step 9). Thehead group of PtdCho is derived from the CDP-choline pathway; choline isconverted into P-choline by the CK (step 7), and P-choline is converted intoCDP-choline by the CCT (step 8), and finally CPT and CEPT catalyze the transferof the P-choline moiety from CDP-choline to PtdCho (step 9).
B-cell Membrane Biogenesis
7604 JOURNAL OF BIOLOGICAL CHEMISTRY VOLUME 282 • NUMBER 10 • MARCH 9, 2007
by guest on Decem
ber 27, 2019http://w
ww
.jbc.org/D
ownloaded from

Mallampalli, R. K. (2005) J. Biol. Chem. 280, 21577–2158724. Attard, G. S., Templer, R. H., Smith, W. S., Hunt, A. N., and Jackowski, S.
(2000) Proc. Natl. Acad. Sci. U. S. A. 97, 9032–903625. Cornell, R. B., and Northwood, I. C. (2000) Trends Biochem. Sci. 25,
441–44726. Kent, C. (1997) Biochim. Biophys. Acta 1348, 79–9027. Jamil, H., Utal, A. K., and Vance, D. E. (1992) J. Biol. Chem. 267,
1752–176028. Jackowski, S., Wang, J., and Baburina, I. (2000) Biochim. Biophys. Acta
1483, 301–31529. Wright, M. M., Henneberry, A. L., Lagace, T. A., Ridgway, N. D., and
McMaster, C. R. (2001) J. Biol. Chem. 276, 25254–2526130. Bagnato, C., and Igal, R. A. (2003) J. Biol. Chem. 278, 52203–5221131. Haughton, G., Arnold, L. W., Bishop, G. A., and Mercolino, T. J. (1986)
Immunol. Rev. 93, 35–5132. Arnold, L. W., LoCascio, N. J., Lutz, P. M., Pennell, C. A., Klapper, D., and
Haughton, G. (1983) J. Immunol. 131, 2064–206833. Ovnic, M., and Corley, R. B. (1987) J. Immunol. 138, 3075–308234. LoCascio, N. J., Haughton, G., Arnold, L.W., andCorley, R. B. (1984) Proc.
Natl. Acad. Sci. U. S. A. 81, 2466–246935. LoCascio, N. J., Arnold, L. W., Corley, R. B., and Haughton, G. (1984) J.
Mol. Cell. Immunol. 1, 177–19036. Stockdale, A. M., Dul, J. L., Wiest, D. L., Digel, M., and Argon, Y. (1987)
J. Immunol. 139, 3527–353537. Bligh, E. G., and Dyer, W. J. (1959) Can. J. Biochem. Physiol. 37, 911–91738. Charles, J., and Stewart, M. (1980) Anal. Biochem. 104, 10–1439. Henneberry, A. L., and McMaster, C. R. (1999) Biochem. J. 339, 291–29840. Preiss, J. E., Loomis, C. R., Bell, R. M., and Niedel, J. E. (1987) Methods
Enzymol. 141, 294–30041. Livak, K. J., and Schmittgen, T. D. (2001) Methods (San Diego) 25,
402–40842. Gunn, K. E., and Brewer, J. W. (2006) J. Immunol. 177, 3791–379843. Wadham, C., Albanese, N., Roberts, J., Wang, L., Bagley, C. J., Gamble,
J. R., Rye, K. A., Barter, P. J., Vadas, M. A., and Xia, P. (2004) Circulation109, 2116–2122
44. Liu, G., Loraine, A. E., Shigeta, R., Cline, M., Cheng, J., Valmeekam, V.,
Sun, S., Kulp, D., and Siani-Rose, M. A. (2003) Nucleic Acids Res. 31,82–86
45. Kent, C. (1995) Annu. Rev. Biochem. 64, 315–34346. Henneberry, A. L., Wright, M. M., and McMaster, C. R. (2002)Mol. Biol.
Cell 13, 3148–316147. Jackowski, S. (1994) J. Biol. Chem. 269, 3858–386748. MacDonald, J. I. S., and Kent, C. (1994) J. Biol. Chem. 269, 10529–1053749. Cornell, R. B., Kalmar, G. B., Kay, R. J., Johnson,M.A., Shanghera, J. S., and
Pelech, S. L. (1995) Biochem. J. 310, 699–70850. Wang, Y., and Kent, C. (1995) J. Biol. Chem. 270, 18948–1895251. Yang, W., and Jackowski, S. (1995) J. Biol. Chem. 270, 16503–1650652. Lykidis, A., Baburina, I., and Jackowski, S. (1999) J. Biol. Chem. 274,
26992–2700153. DeLong, C. J., Qin, L., and Cui, Z. (2000) J. Biol. Chem. 275, 32325–3233054. Wang, Y., MacDonald, J. I. S., and Kent, C. (1995) J. Biol. Chem. 270,
354–36055. Ridsdale, R., Tseu, I., Wang, J., and Post, M. (2001) J. Biol. Chem. 276,
49148–4915556. Rush, J. S., Sweitzer, T., Kent, C., Decker, G. L., andWaechter, C. J. (1991)
Arch. Biochem. Biophys. 284, 63–7057. Han, G. S., Wu, W. I., and Carman, G. M. (2006) J. Biol. Chem. 281,
9210–921858. Randall, T. D., Lund, F. E., Brewer, J.W., Aldridge, C.,Wall, R., and Corley,
R. B. (1993)Mol. Cell. Biol. 13, 3929–393659. Sriburi, R., Bommiasamy, H., Buldak, G. L., Robbins, G. R., Frank, M.,
Jackowski, S., and Brewer, J. W. (2007) J. Biol. Chem. 282, in press60. Craig, L., Johnson, J. E., and Cornell, R. B. (1994) J. Biol. Chem. 269,
3311–331761. Cenci, S., Mezghrani, A., Cascio, P., Bianchi, G., Cerruti, F., Fra, A.,
Lelouard, H., Masciarelli, S., Mattioli, L., Oliva, L., Orsi, A., Pasqualetto,E., Pierre, P., Ruffato, E., Tagliavacca, L., and Sitia, R. (2006) EMBO J. 25,1104–1113
62. Lim, P., Cornell, R. B., and Vance, D. E. (1986) Biochem. Cell Biol. 64,692–698
63. Ridgway, N. D., and Lagace, T. A. (2003) Biochem. J. 372, 811–819
B-cell Membrane Biogenesis
MARCH 9, 2007 • VOLUME 282 • NUMBER 10 JOURNAL OF BIOLOGICAL CHEMISTRY 7605
by guest on Decem
ber 27, 2019http://w
ww
.jbc.org/D
ownloaded from

Christopher Gunter, Joseph W. Brewer and Suzanne JackowskiPaolo Fagone, Rungtawan Sriburi, Cheryl Ward-Chapman, Matthew Frank, Jina Wang,
B-lymphocyte DifferentiationPhospholipid Biosynthesis Program Underlying Membrane Expansion during
doi: 10.1074/jbc.M608175200 originally published online January 9, 20072007, 282:7591-7605.J. Biol. Chem.
10.1074/jbc.M608175200Access the most updated version of this article at doi:
Alerts:
When a correction for this article is posted•
When this article is cited•
to choose from all of JBC's e-mail alertsClick here
http://www.jbc.org/content/282/10/7591.full.html#ref-list-1
This article cites 55 references, 37 of which can be accessed free at
by guest on Decem
ber 27, 2019http://w
ww
.jbc.org/D
ownloaded from