Functional Biology of Plant Phosphate Uptake at Root and Mycorrhiza Interfaces

çys'i
Phosphate availability in the soil-root system:
integration of oxide surface chemistry, transport and uptake

Promotoren: dr. G.R. Findenegg hoogleraar in de bodemkunde en plantenvoeding dr. W.H. van Riemsdijk hoogleraar in de bodemscheikunde en de chemische grond- en gewasanalyse

J.S. Geelhoed
Phosphate availability in the soil-root system: integration of oxide surface chemistry, transport and uptake
Proefschrift ter verkrijging van de graad van doctor op gezag van de rector magnificus van de Landbouwuniversiteit Wageningen, dr. C.M. Karssen, in het openbaar te verdedigen op vrijdag 12 juni 1998 des namiddags te 13.30 uur in de Aula

Abstract
Geelhoed, J.S., 1998, Phosphate availability in the soil-root system: integration of oxide surface chemistry, transport and uptake,
Doctoral thesis, Wageningen Agricultural University, The Netherlands.
ISBN 90-5485-862-1; 177 pages.
A study is presented on the adsorption of phosphate on goethite, the interaction of
phosphate with other adsorbing ions at the goethite surface, and the resulting
availability of phosphate to plants. The plant-availability of sorbed phosphate was
determined from phosphorus uptake of plants growing on an artificial substrate
containing goethite with phosphate. Uptake can be predicted from zero sink behaviour
of a growing root system, diffusion and mass flow in soil, and measured non linear
adsorption of phosphate on goethite. With high phosphate loading of goethite, the
equilibrium phosphate concentration in solution increased, which resulted in larger
phosphate availability. Competitive interaction between phosphate and sulphate on
goethite caused only a small decrease in phosphate adsorption at low pH, where
sulphate adsorption is strongest, but a considerable increase in the phosphate
concentration in solution. Experiments showed that phosphorus uptake by plants
growing on suspensions of goethite in the presence of sulphate was seven times larger
at pH 3.7 than at pH 5.5. Citrate competes more strongly with phosphate than sulphate,
and shows strongest interaction at pH 4.5-5. On account of the non linear adsorption
behaviour of phosphate, the relative increase in phosphate in solution upon competition
is much larger at low than at high phosphate loading of goethite. Therefore, competition
results in an apparent lower affinity of phosphate sorption on goethite. Adsorption of
the individual anions and competitive adsorption was described with the CD-MUSIC
ion adsorption model, which is based on a detailed description of the adsorbing surface
and the use of surface complexes identified in spectroscopic studies. The combination
of the ion adsorption model with the uptake model is a powerful tool to predict the
phosphate availability to plants. This was illustrated with a simulation study in which
the effect of citrate exudation from roots on the uptake of phosphate was predicted.
Additional index words: artificial soil, bioavailability, competitive sorption, CD-MUSIC
ion adsorption modelling, citrate, goethite, iron oxide, nutrient uptake model, organic
matter, pH, phosphorus, rhizosphere processes, root hair, speciation, sulphate, zero sink
uptake.
BIBLIOTHEEK LANDBOUWUNIVERSITEIT
WAGENINGEN

Contents
1 General introduction 1
2 Modelling zero sink nutrient uptake by roots with root hairs
from soil: comparison of two models 21
3 Availability to plants of phosphate adsorbed on goethite:
experiment and simulation 41
4 Phosphate and sulphate adsorption on goethite:
single anion and competitive adsorption 63
5 Effects of sulphate and pH on the plant-availability of
phosphate adsorbed on goethite 85
6 Competitive interaction between phosphate and citrate
on goethite 103
7 Simulation of the effect of citrate exudation from roots
on the plant-availability of phosphate adsorbed on goethite 117
8 Epilogue 139
References 147
Summary 163
Samenvatting 169
Levensloop 175
Nawoord 176

J'Y S
Stellingen
1. Het gebruik van modelsystemen en mechanistische modellen is van grote waarde voor het verkrijgen van inzicht in de processen die plaatsvinden in de bodem.
Dit proefschrift.
2. Voor een goede voorspelling van de opname van fosfaat door plantenwortels zijn meetdata van fosfaatadsorptie bij erg lage fosfaatconcentraties in oplossing noodzakelijk.
Dit proefschrift.
3. Competitie voor adsorptie tussen fosfaat en anionen met een veel lagere affiniteit voor het goethite-oppervlak, zoals sulfaat, kan een grote toename van de fosfaatbeschikbaarheid veroorzaken.
Parfitt R.L. 1982 Competitive adsorption of phosphate and sulphate on goethite (a-FeOOH): a note. New Zealand J. Agric. Sei. 25, 147-148. Dit proefschrift.
4. Door adsorptie van kleine organische zuren in de bodem kan de mobilisatie van fosfaat als gevolg van de uitscheiding van deze verbindingen door plantenwortels veel langer doorgaan dan op grond van hun afbraaksnelheid in oplossing kan worden aangenomen.
Jones D.L., A.M. Prabowo and Kochian L.V. 1996 Kinetics of malate transport and decomposition on acid soils and isolated bacterial populations: The effect of microorganisms on root exudation of malate under Al stress. Plant Soil 182, 239-247. Dit proefschrift.
5. Het gebruik van lineaire buffering in modellen voor de opname van fosfaat door plantenwortels heeft niet te maken met het adsorptie/desorptiegedrag van fosfaat, maar meer met het gebrek aan meetdata om de adsorptie/desorptie-isotherm te beschrijven.
Barber S.A. 1984 Soil nutrient bioavailability. John Wiley and Sons, New York. Dit proefschrift.
6. Een goede beschrijving van ion adsorptie-edges met een model is van weinig waarde als voor de meeste datapunten geldt dat vrijwel de totale hoeveelheid van het toegevoegde ion geadsorbeerd is.

7. Een risico bij het formuleren van stellingen is een gebrek aan nuance.
8. Om een verantwoorde keuze tussen producten te kunnen maken met betrekking tot hun milieu(on)vriendelijkheid, moeten de resultaten van de levenscyclusanalyse bekend zijn bij de consument.
9. In de provincie Zeeland moet meer aandacht worden besteed aan de ontwikkeling van bedrijvigheid in plaats van toerisme, zodat een meer evenwichte omgeving wat betreft economie, maatschappij en natuur kan ontstaan.
10. Lichamelijke inspanning zorgt voor geestelijke ontspanning.
11. Oren zijn niet alleen bedoeld om mee te horen, maar vooral om mee te luisteren.
Stellingen behorend bij het proefschrift 'Phosphate availability in the soil-root system: integration of oxide surface chemistry, transport and uptake'. J.S. Geelhoed, Wageningen, 12 juni 1998.

General introduction
General introduction
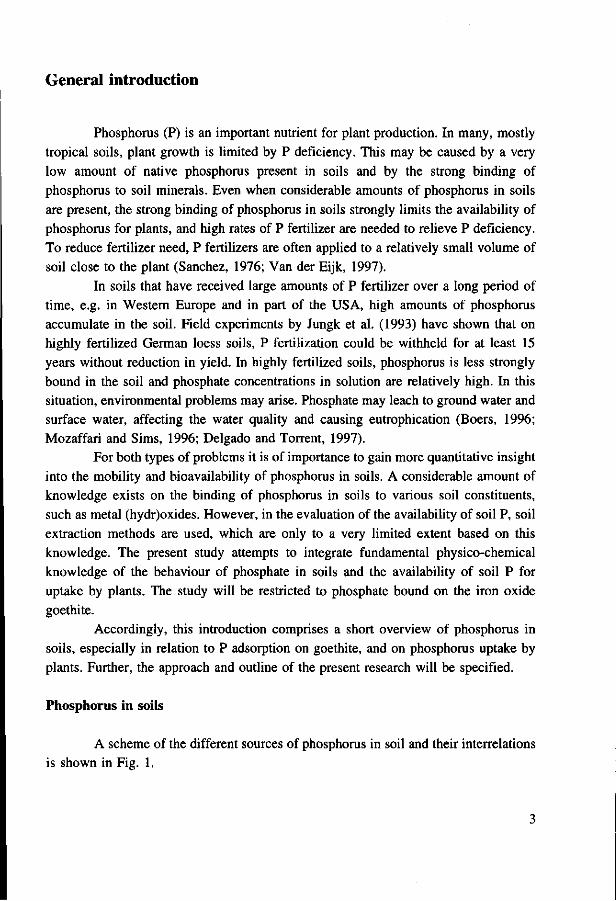
Phosphorus (P) is an important nutrient for plant production. In many, mostly tropical soils, plant growth is limited by P deficiency. This may be caused by a very low amount of native phosphorus present in soils and by the strong binding of phosphorus to soil minerals. Even when considerable amounts of phosphorus in soils are present, the strong binding of phosphorus in soils strongly limits the availability of phosphorus for plants, and high rates of P fertilizer are needed to relieve P deficiency. To reduce fertilizer need, P fertilizers are often applied to a relatively small volume of soil close to the plant (Sanchez, 1976; Van der Eijk, 1997).
In soils that have received large amounts of P fertilizer over a long period of time, e.g. in Western Europe and in part of the USA, high amounts of phosphorus accumulate in the soil. Field experiments by Jungk et al. (1993) have shown that on highly fertilized German loess soils, P fertilization could be withheld for at least 15 years without reduction in yield. In highly fertilized soils, phosphorus is less strongly bound in the soil and phosphate concentrations in solution are relatively high. In this situation, environmental problems may arise. Phosphate may leach to ground water and surface water, affecting the water quality and causing eutrophication (Boers, 1996; Mozaffari and Sims, 1996; Delgado and Torrent, 1997).
For both types of problems it is of importance to gain more quantitative insight into the mobility and bioavailability of phosphorus in soils. A considerable amount of knowledge exists on the binding of phosphorus in soils to various soil constituents, such as metal (hydr)oxides. However, in the evaluation of the availability of soil P, soil extraction methods are used, which are only to a very limited extent based on this knowledge. The present study attempts to integrate fundamental physico-chemical knowledge of the behaviour of phosphate in soils and the availability of soil P for uptake by plants. The study will be restricted to phosphate bound on the iron oxide goethite.
Accordingly, this introduction comprises a short overview of phosphorus in soils, especially in relation to P adsorption on goethite, and on phosphorus uptake by plants. Further, the approach and outline of the present research will be specified.
Phosphorus in soils
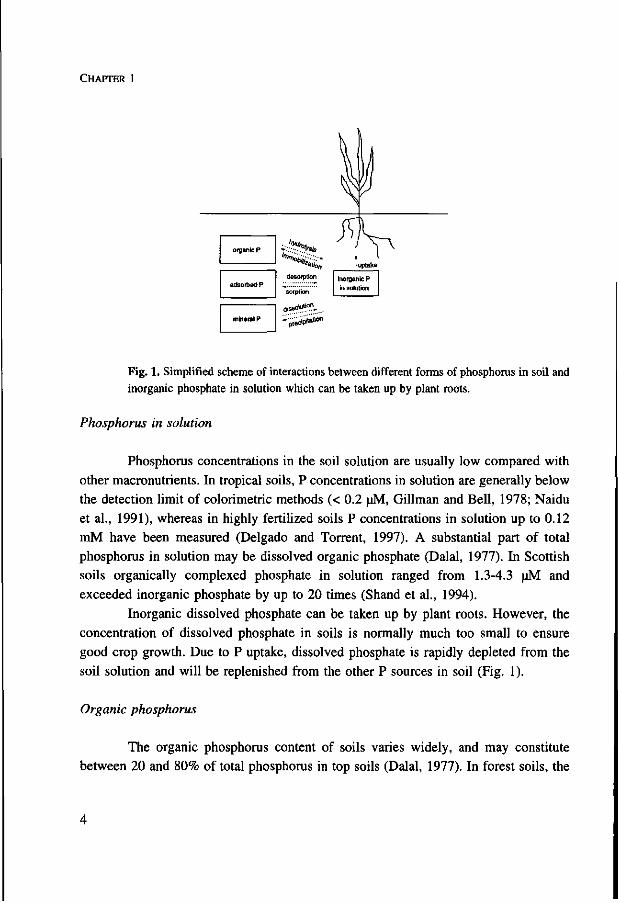
A scheme of the different sources of phosphorus in soil and their interrelations is shown in Fig. 1.
CHAPTER 1
organic P
adsorbed P
mineral P
SAS*
desorption
sorplion
yn : uptake
inorganic P in solution
Fig. 1. Simplified scheme of interactions between different forms of phosphorus in soil and inorganic phosphate in solution which can be taken up by plant roots.
Phosphorus in solution
Phosphorus concentrations in the soil solution are usually low compared with
other macronutrients. In tropical soils, P concentrations in solution are generally below
the detection limit of colorimetric methods (< 0.2 uM, Gillman and Bell, 1978; Naidu
et al., 1991), whereas in highly fertilized soils P concentrations in solution up to 0.12
mM have been measured (Delgado and Torrent, 1997). A substantial part of total
phosphorus in solution may be dissolved organic phosphate (Dalai, 1977). In Scottish
soils organically complexed phosphate in solution ranged from 1.3-4.3 uM and
exceeded inorganic phosphate by up to 20 times (Shand et al., 1994).
Inorganic dissolved phosphate can be taken up by plant roots. However, the
concentration of dissolved phosphate in soils is normally much too small to ensure
good crop growth. Due to P uptake, dissolved phosphate is rapidly depleted from the
soil solution and will be replenished from the other P sources in soil (Fig. 1).
Organic phosphorus
The organic phosphorus content of soils varies widely, and may constitute
between 20 and 80% of total phosphorus in top soils (Dalai, 1977). In forest soils, the

GENERAL INTRODUCTION
portion of organic phosphorus may be as large as 95% of total phosphorus (Zech et al., 1987). Because of their relatively strong resistance to decomposition, the group of inositol phosphates, phosphate estered forms of inositol stereoisomeres, are the main soil organic P compounds, contributing to up to 50% of total organic P. Of these compounds, inositol hexaphosphate (phytic acid) and its derivatives are the most abundant. Other organic P fractions in soils are nucleid acids, phospholipids, phosphoprotein and sugar phosphates (Dalai, 1977; Anderson, 1980).
The availability of phytic acid to plants in soils is generally low due to the precipitation of e.g. Ca and Mg phytate and the strong sorption of phytate on clay minerals and metal (hydr)oxides (Anderson, 1974). Inorganic phosphate and phytic acid compete for adsorption, suggesting the sorption sites of both P forms are the same (Anderson et al., 1974; Evans, 1985). Soil organic phosphorus contributes to the P nutrition of plants after being mineralized into inorganic phosphate by microorganisms or after hydrolysis mediated by root-born phosphatase (Anderson, 1980; Tarafdar and Jungk, 1987; Häussling and Marschner, 1989).
Mineral phosphorus
Many minerals of phosphorus combined with calcium, aluminium and iron occur in soils; above pH 7 calcium phosphates are dominant, whereas in acids soils iron and aluminium phosphates are prevailing (Tisdale et al., 1985). Upon the addition of P fertilizer to soils, precipitation of phosphorus may locally occur around the fertilizer grains, due to very high phosphorus concentrations (Sample et al., 1980). In principle, the chemical nature of the minerals that potentially are present and control phosphate levels in solution can be derived from the composition of the soil solution. However, because attaining equilibrium may be very slow, the solution may be over- or undersaturated for certain minerals.
Dissolution of P-minerals is a prerequisite for the uptake of phosphorus from this P source by plant roots. In the rhizosphere, dissolution is enhanced by the removal of dissolution products through uptake by roots and by the excretion of organic anions, which complex Al and Fe, and protons (Bolan et al., 1994, 1997).
CHAPTER 1
Adsorbed phosphorus
Phosphate ions are bound on edges of clay minerals and, more importantly, on the surface of iron and aluminium (hydr)oxides. The surface charge of metal (hydr)oxides can be positive or negative and depends on the pH and the composition of the electrolyte solution. The interaction of phosphate with iron oxides has recently been discussed by Torrent (1997). The sorption of phosphate in soils is influenced by the total phosphate concentration, the amount of adsorbing surface area, the pH and the composition of the soil solution (ionic strength, ionic composition). Other anions that are specifically adsorbed compete with phosphate for binding on metal hydr(oxides). Phosphate sorption has been shown to decrease in the presence of organic anions, e.g. upon the addition of organic amendments (Iyamuremye and Dick, 1996), and in the presence of inorganic anions, e.g. arsenate, molybdate, selenite (Hingston et al., 1971; Murali and Aylmore, 1983; Roy et al., 1986).
After phosphate addition, phosphate sorption on metal (hydr)oxides is initially fast, but some additional phosphate may be sorbed during the following weeks or even months. Initial fast sorption kinetics is attributed to the reaction with surface sites which are in direct contact with the solution phase, whereas the slow sorption reaction may be explained by slow diffusion into pores and crystal defects. Accordingly, highly crystalline goethites show little or no slow sorption. With increasing porosity and impurities of ferrihydrite, an amorphous iron oxide, slow sorption processes increase (Madrid and Posner, 1979; Willett et al., 1988; Parfitt, 1989; Torrent et al., 1990, 1992; Strauss et al., 1997). The same reasoning may explain the (very) slow desorption of phosphate from oxides, resulting in apparent hysteresis of phosphate sorption and desorption (Madrid and Posner, 1979; Colombo et al., 1994). In some studies, isotopic exchangeability of phosphate could be related to the porosity of the (hydr)oxide which confirms this idea (Cabrera et al., 1981; Madrid and De Arambarri, 1985). However, in other studies no relation between isotopically exchangeable phosphate and crystal properties was found (Torrent et al., 1992; Colombo et al., 1994). Another explanation for slow P sorption and desorption may be the slow formation and dissolution of P-containing mineral phases (Van Riemsdijk et al., 1984; Lookman et al., 1994, 1995).
Lookman et al. (1995) determined P desorption from sandy soils with a high P load and suggested that all oxalate extractable P, an estimate of total inorganic P in soils (Van der Zee and Van Riemsdijk, 1988), is desorbable. The rate of desorption, and the relative size of the fast desorbing pool decreased with lower P loading of metal
G E N E R A L I N T R O D U C T I O N
(hydr)oxides. Desorption of phosphate due to P uptake by plant roots also decreased with lower phosphate loading, which can be explained from the increasing affinity of phosphate for the surface when the phosphate loading is lowered (Parfitt, 1979; He et al., 1994). Similarly, the desorbability of phosphate from various metal (hydr)oxides decreases with high affinity of phosphate for the oxide (Colombo et al., 1994; Guzman et al., 1994). Parfitt (1979) showed that no phosphate could be taken up by ryegrass when the P saturation of goethite was below 40%, indicating the very strong binding of phosphate on goethite at low phosphate loading. The low recovery of P fertilizer due to strong binding of phosphate at low loading of metal (hydr)oxides has been referred to as P fixation (Sanchez, 1976).
Phosphorus uptake by plants was shown to be related to P sorption and to the amount of extractable Fe and Al in both acid and calcareous soils, indicating phosphate desorbed from metal (hydr)oxides is an important source of P for plant growth (Solis and Torrent, 1989a,b; Soltan et al., 1993).
Because the various forms of phosphorus in soils show different relations to e.g. the phosphate concentration in solution and pH, the behaviour of soil phosphorus is very complex. Therefore, this research will focus on a single form of soil phosphorus, viz. phosphate adsorbed on metal (hydr)oxides, in particular goethite. Goethite is the most abundant iron (hydr)oxide in soils and its structure is well known.
Tropical acid weathered soils contain large amounts of metal (hydr)oxides which largely determine the soil P behaviour. Generally the P availability in these soils is low and often limits crop growth. In soils containing relatively high amounts of other soil P forms, the behaviour of P sorbed on metal (hydr)oxides will be concealed. Furthermore, P sorption behaviour may be affected by e.g. the presence of organic matter and relatively high Ca concentrations.
Phosphate adsorption on goethite
The properties of goethite (oc-FeOOH) depend strongly on the circumstances during the production of the oxide (Torrent et al., 1990; Strauss et al., 1997). The goethite that is used in this study consists of monodomainic crystals and is well crystalline and non porous (Hiemstra et al., 1989b). The production of this goethite is well reproducible.

CHAPTER 1
200 |à
- 1 5 0 E O -ë-100
(0 o 50
I w 0
-50
goethite in KNO3 • 0.005 M • 0.01 M A 0.1 M
• A • w
' • I l
^
7
PH 10
Fig. 2. Effect of pH and ionic strength on the surface charge of goethite.
The charge of the goethite surface depends on the pH and the ionic strength of the solution (Fig. 2). The charge of the surface is neutralized by an equal amount of opposite charge from electrolyte ions present in the diffuse double layer. The electrolyte ions approach the surface to a distance equal to the size of the hydrated water or O(H) ligands. In indifferent electrolyte solution, the Stern layer between the surface and the head end of the diffuse double layer is charge free. The pH at which the surface is uncharged in the absence of other specifically charged ions than H+ and OH" is called the pristine point of zero charge (PPZC). The PPZC is found from the common intersection point of charging curves at different ionic strength. The PPZC of the used goethite is 9.2 and the specific surface area is about 95 m2 g"1.
At the goethite surface various types of surface groups are present, differing in the number of bonds with underlying Fe atoms in the goethite crystal and differing in the degree of protonation. Depending on the number of bonds with underlying Fe atoms (n) these surface groups are denoted singly (n=l), doubly (w=2) and triply (n=3) coordinated surface groups. At the dominant 110 face, one row of singly, one row of doubly and three rows of triply coordinated surface groups are present per unit cell, whereas at the minor 021 face, rows of singly and doubly coordinated surface groups alternate. The proton affinities of these various types of surface groups are different (Hiemstra et al., 1989b; Hiemstra and Van Riemsdijk, 1996; Hiemstra et al., 1996).
GENERAL INTRODUCTION
Spectroscopic studies on dried and in situ samples of goethite with adsorbed
phosphate and arsenate, which shows similar adsorption behaviour on goethite, have
indicated that phosphate and arsenate are adsorbed by the exchange of ligands between
the oxyanion and singly coordinated surface groups (Parfitt, 1975; Tejedor-Tejedor and
Anderson, 1990; Waychunas et al., 1993; Sun and Doner, 1996; Fendorf et a l , 1997).
With the formation of these so-called inner spere complexes part of the charge of the
anion is transferred to the surface, resulting in a decrease in surface charge and a shift
of the pH where the surface is uncharged to lower pH values (Bowden et al., 1980;
Dzombak and Morel, 1990).
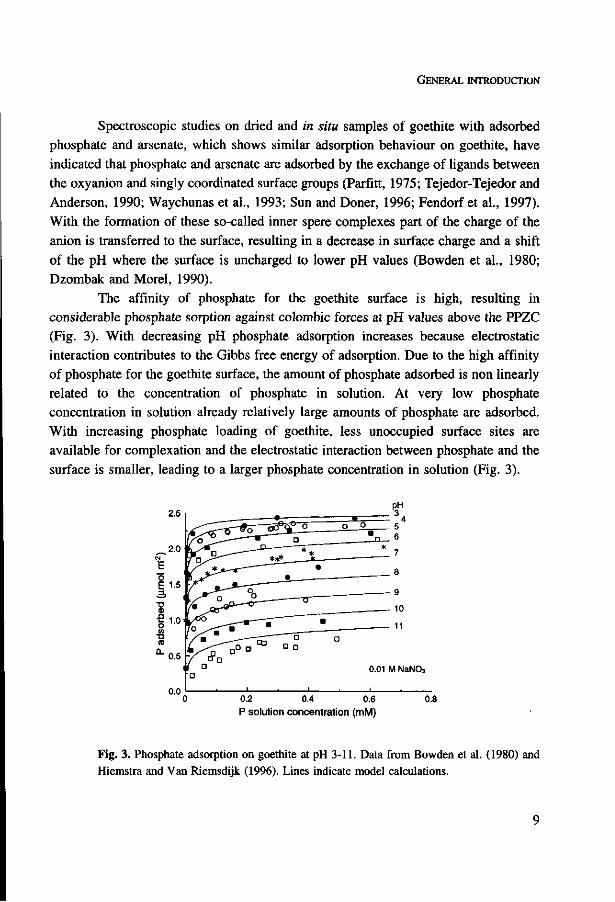
The affinity of phosphate for the goethite surface is high, resulting in
considerable phosphate sorption against Colombie forces at pH values above the PPZC
(Fig. 3). With decreasing pH phosphate adsorption increases because electrostatic
interaction contributes to the Gibbs free energy of adsorption. Due to the high affinity
of phosphate for the goethite surface, the amount of phosphate adsorbed is non linearly
related to the concentration of phosphate in solution. At very low phosphate
concentration in solution already relatively large amounts of phosphate are adsorbed.
With increasing phosphate loading of goethite, less unoccupied surface sites are
available for complexation and the electrostatic interaction between phosphate and the
surface is smaller, leading to a larger phosphate concentration in solution (Fig. 3).
0.2 0.4 0.6 P solution concentration (mM)
0.8
Fig. 3. Phosphate adsorption on goethite at pH 3-11. Data from Bowden et al. (1980) and Hiemstra and Van Riemsdijk (1996). Lines indicate model calculations.
CHAPTER 1
2.5
2.0
o E 1.5 .ä •o CD
0.5
0.0
* o . D D
0.1 mM phosphate • 0.01 M KN03
• + 0.1 mM Mg(NQj)2 0.5 g goethite I
10
PH
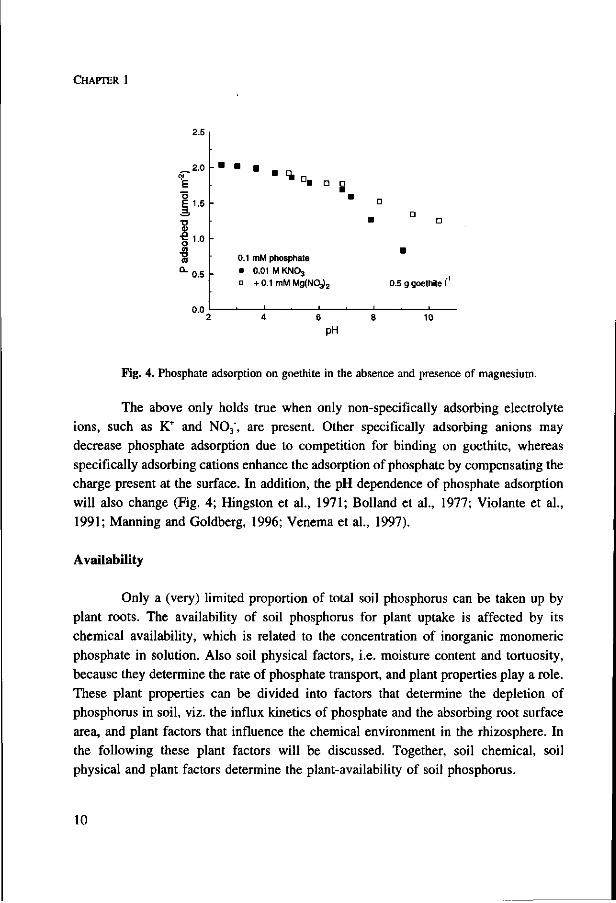
Fig. 4. Phosphate adsorption on goethite in the absence and presence of magnesium.
The above only holds true when only non-specifically adsorbing electrolyte
ions, such as K+ and N0 3 \ are present. Other specifically adsorbing anions may
decrease phosphate adsorption due to competition for binding on goethite, whereas
specifically adsorbing cations enhance the adsorption of phosphate by compensating the
charge present at the surface. In addition, the pH dependence of phosphate adsorption
will also change (Fig. 4; Hingston et al., 1971; Bolland et al., 1977; Violante et al.,
1991; Manning and Goldberg, 1996; Venema et al., 1997).
Availability
Only a (very) limited proportion of total soil phosphorus can be taken up by
plant roots. The availability of soil phosphorus for plant uptake is affected by its
chemical availability, which is related to the concentration of inorganic monomeric
phosphate in solution. Also soil physical factors, i.e. moisture content and tortuosity,
because they determine the rate of phosphate transport, and plant properties play a role.
These plant properties can be divided into factors that determine the depletion of
phosphorus in soil, viz. the influx kinetics of phosphate and the absorbing root surface
area, and plant factors that influence the chemical environment in the rhizosphere. In
the following these plant factors will be discussed. Together, soil chemical, soil
physical and plant factors determine the plant-availability of soil phosphorus.
10

G E N E R A L I N T R O D U C T I O N
Phosphorus acquisition
Phosphorus is predominantly taken up by the root as H2P04 (Hendrix, 1967). Clarkson et al. (1968) showed that the whole root system, young and older roots, take up phosphate.
Phosphate is transported into the root against an electrical potential difference, which originates from the difference in concentrations of charged ions on either side of the plasma membrane. In general, the electrical potential differences in higher plants are negative, < -59 mV, which indicates influx of anions is an active process (Higinbotham et al., 1967). The potential differences are maintained by proton pumps, mainly membrane-bound ATPases which extrude H+ from the cytoplasm (Fig. 5). This 'proton motive force' drives the transport of ions, amino acids and sugars (Spanswick, 1981; Bush, 1993). In accordance, phosphate is transported by cotransport of H2P04" and protons (Ullrich-Eberius et al., 1981; Dunlop, 1989), however, countertransport of H2P04" and OH has also been proposed (Lin, 1979).
plasma apoplasm membrane cytoplasm
••• ADP + P,
co-transport
proton pump
countertransport
pH 7.3-7.6
Fig. 5. Proposed uptake mechanisms of phosphate.
The nett influx of anions is the result of influx, an active process, and efflux, the leaking of ions over the plasma membrane (Schj0rring and Jensen, 1984; McPharlin and Bieleski, 1989). Nett influx rates are probably regulated by both influx and efflux, depending on the P status of the plants (Elliot et al., 1984; Cogliatti and Santa Maria, 1990).
In soils, the phosphate concentration in solution is usually very low, which requires a high affinity of the P uptake mechanism. In short-term experiments the rate of influx of solutes in relation to the external solute concentration is often described
11
CHAPTER 1
with a Michaelis-Menten type equation
i u ( 1 )
m 1 Li
in which / is the influx rate [mol m"2 day"1], /max the maximum influx rate and C, the concentration of phosphate in solution. Km, the concentration where influx equals 0.5 x /max, is relatively low for phosphate: in the range of 0.5-8.1 uM for maize roots. This low Km value is an expression of the high affinity of the P uptake system. C, min, the threshold concentration where influx equals efflux, has been reported to be in the range of 0.01-0.47 uM. However, the values of these Michaelis-Menten influx parameters depend on pretreatment, cultivar, plant age, internal nutrient concentration etc. (Jungk and Barber, 1975; Nielsen and Barber, 1978; Schenk and Barber, 1980; Jungk et al., 1990).
Nett P influx data obtained by Russell and Martin (1953) at phosphate concentrations in solution in the range of 0.008-1000 uM and Loneragan and Asher (1967) in the range of 0.04-24 uM show that, in the very low concentration range, P influx increases proportionally with a larger phosphate concentration in solution. This implies that a threshold concentration for P uptake can be neglected. Under these conditions, P uptake is limited by the transport of phosphate to the root surface and not by the uptake characteristics of the root: the root behaves as a zero sink. In accordance, one of the plant parameters controlling P uptake from soil is the root surface area.
Root hairs provide a considerable increase in the absorbing root surface, and, more importantly, because they extend perpendicularly from the root, they increase the volume of soil that is explored for nutrients (Nye, 1966a). Selections or cultivars of plant species differing in root hair length, have been used to demonstrate that P uptake is positively related to the length of root hairs (Caradus, 1981; Baon et al. 1994; Gahoonia et al., 1997). The number and length of root hairs formed was shown to increase with decreasing phosphate concentrations in the root (Föhse and Jungk, 1983). Especially in circumstances of low P availability, and hence low mobility of phosphorus in soils, the contribution of root hairs to P uptake is more important (Nye, 1966a; Föhse et al., 1991; Gahoonia et al., 1997).
12

GENERAL INTRODUCTION
When P uptake by the roots is very low, P deficiency may occur, which results in restricted growth, purple colouring of the stem base and leaves, senesence of older leaves and a poor or no generative development of the plants. Tissue concentrations of phosphate below 70 umol g"1 dry matter are generally regarded as indicative for growth limitation. However, the extent of growth limitation depends on the P demand of the plant and, hence, on the plant age and developmental stage (Reuter and Robinson, 1986).
Plants are able to actively change the chemical environment close to the root and these small scale rhizosphere processes influence the mobility of phosphorus and its acquisition by plants.
Change of rhizosphere pH
On account of the uptake mechanism of nutritive ions, the pH at the root surface may change. The processes responsible for the regulation of rhizosphere pH are reviewed by Haynes (1990). When an access of cations is absorbed, e.g. when ammonium-N is the N-source, the pH at the root surface will decrease, whereas with nitrate-N as N-source, the pH will usually increase (Riley and Barber, 1971; Nye, 1981; Gahoonia et al., 1992; Thomson et al., 1993). In plants fixing nitrogen symbiotically the uptake of cations exceeds uptake of anions, resulting in a pH decrease (Aquilar and Van Diest, 1981). Roots can change the rhizosphere pH by as much as 1 to 2 pH units (Nye, 1981).
These alterations of pH may have consequences for the mobility of phosphorus in soils and hence for P uptake (Riley and Barber, 1971; Aquilar and Van Diest, 1981; Nye, 1981; Gahoonia et al., 1992; Thomson et al., 1993). However, the effect of pH changes on P availability and mobility in soils is complex because for different soil constituents the relations between pH and P in solution may be different. Furthermore, the ionic composition of the soil solution may affect these relations. In a luvisol a decreasing pH caused increased P uptake by plants due to the dissolution of P minerals, whereas in an oxisol an increasing pH resulted in higher P uptake since phosphate was less strongly sorbed on metal (hydr)oxides (Gahoonia et al., 1992).
pH changes in the rhizosphere may also be the result of the exudation of organic acids. In addition, the presence of organic acids or their conjugated anions may have an additional effect on P mobility.
13
CHAPTER 1
Exudation of organic anions/acids
A number of plant species (a.o. white lupin, rape, red clover, black mustard, tomato) release organic anions/acids from their roots as a response to P deficiency (Gardner et al., 1982, 1983; Lipton et al., 1987; Dinkelaker et al., 1989; Hoffland et al., 1989; Gerke and Meyer, 1995; Imas et al., 1997; Li et al., 1997b). The addition or release of organic anions to soils has been shown to result in an increased mobilization of soil phosphorus (Dinkelaker et al., 1989; Hue, 1991; Gerke, 1992; Gerke and Meyer, 1995; Staunton and Leprince, 1996; Bolan et al., 1997; Li et al., 1997b).
Two processes contribute to the enhanced P mobilization. One is the sorption of organic anions on metal (hydr)oxides in soils which decreases the sorption of phosphate. The other is the increased solubilization of Ca-P compounds due to the complexation of Ca with organic anions (Nagarajah et al., 1970; Hue, 1991; Violante et al., 1991; Bolan et al., 1994, 1997). The magnitude of the effect of organic anions on the solubility of soil phosphorus increases with the number of carboxyl groups of the anion (Hue, 1991; Bolan et al., 1994; Staunton and Leprince, 1996).
Production of phosphatases
Phosphatase activity in soils, either from microbial or plant origin, is required to make organic P available for plant uptake. In hydroponic culture and in pot experiments using quartz sand and soil, it was shown that plants are able to take up phosphorus from different types of organic P, such as phytic acid, nucleid acids, glycerophosphate and lecithin (Tarafdar and Claassen, 1988; Beck et al., 1989; Adams and Pate, 1992). Depletion of organic P in the rhizosphere related to phosphatase activity has been demonstrated (Tarafdar and Jungk, 1987; Li et al., 1997b).
In the rhizosphere of P deficient plants, relatively high phosphatase activity originating from the plant roots was observed (Tarafdar and Jungk, 1987; Tarafdar and Claassen, 1988; Li et al., 1997b). Phytase, which catalyzes the hydrolysis of phytate, has been detected in the cell wall of maize roots, especially in the root tip (Beck et al., 1989). Li et al. (1997a) have shown that phytase activity was induced by phosphorus deficiency in tomato roots. The activity of the purified enzym was strongly inhibited by inorganic orthophosphate, the end product of the hydrolysis of phytate, which suggests the enzym shows a very tight feedback mechanism.
14

GENERAL INTRODUCTION
Mycorrhiza
Plants may be involved in a mutually beneficial association with mycorrhizal fungi. The fungus obtaines assimilates from the plant, whereas the plant benefits from nutrient uptake by the fungus. At very low soil P levels mycorrhizal infection is low due to P limitation of fungal growth and a restricted supply of carbon from the plant to the fungus. With increasing P supply, the infection rate increases to an optimum. Beyond this optimum level, which depends on mycorrhizal species and host species, root infection decreases again (Brundrett, 1991; Marschner, 1995).
Many similarities between the effect of root hairs and mycorrhiza on P uptake exist. Because the mycorrhizal hyphae, like root hairs, extend widely into the soil they increase the nutrient absorbing area and the amount of soil that is being depleted (Sanders and Tinker, 1971). As with root hairs, P depletion zones have been observed around the fungal hyphae, demonstrating mycorrhiza take up phosphorus (Li et al., 1991). Futhermore, hyphae of mycorrhizal fungi may change the chemical environment in the hyphosphere. Hyphae of mycorrhizal fungi show phosphatase activity and this increases the uptake of organic P (Häussling and Marschner, 1989; Tarafdar and Marschner, 1994). The abundant production of oxalate by ectomycorrhizal fungi is suggested to prevent the overaccumulation of Ca in woody plants by precipitation of Ca-oxalate in the hyphosphere and to enhance the dissolution of phosphate from P minerals (Lapeyrie, 1988, 1990).
The rhizosphere processes that may be important with respect to the availability of adsorbed phosphate are changes in the rhizosphere pH and exudation of organic anions/acids from roots. The effect of mycorrhiza on the availability of phosphate adsorbed on goethite will not be considered explicitly in this study.
The present study
The aim of this study is to quantitatively assess the availability of phosphate sorbed on goethite to plants and the influence that both plant factors and soil chemical factors may have on the plant-availability of phosphate.
Experiments will be carried out to determine plant P uptake as a measure of plant-available phosphate and to study the adsorption of phosphate on goethite over a wide concentration range. These experiments will be integrated with model calculations.
15

CHAPTER 1
Experimental approach
Uptake by plants of phosphate adsorbed on goethite is studied experimentally using well defined substrates. The plants are grown at P deficient conditions to ensure that all phosphate that is potentially available for uptake is taken up. The effect of varying soil chemical conditions, e.g. phosphate loading on goethite, pH and ionic composition of the background solution on the plant-availability of phosphate is studied. In these experiments also plant properties are determined.
The adsorption of phosphate and other ions on goethite is studied in batch adsorption experiments. Because data on phosphate adsorption at very low phosphate concentrations in solution are needed, part of these experiments are carried out with 32P.
Modelling approach
Nutrient uptake models
An important tool in determining and understanding the availability of phosphate for uptake by plants is the use of mechanistic uptake models. These models, for which input data on plant roots and soil are required, are based on the transport of nutrients by diffusion and mass flow, the buffering of nutrients from the solid phase to the solution and the influx kinetics of the root (Nye and Tinker, 1977; Barber, 1984; Jungk and Claassen, 1997).
The transport of phosphate in soil to the root surface is predominantly determined by diffusion, since the phosphate concentration in solution is relatively low and thus mass transport is negligible (Nye, 1977). The effective diffusion coefficient of a solute is given by (Nye, 1966b)
eff y
in which D0 is the diffusion coefficient of the solute in water [m2 day"1], 6 the volumetric moisture content [m3 solution m"3 soil] and ƒ the tortuosity factor [-]. Buffering is defined as
16

GENERAL INTRODUCTION
dÇ
dC, e+.
dC
"dC Q+b' (3)
in which Ct is the total concentration of phosphate in soil [mol m"3 soil] and Cs the concentration of sorbed phosphate in soil [mol m"3 soil].
In model calculations of uptake, buffering of nutrients in soil has usually been approximated by a linear relation. This linear relation, often called the buffer power, is assumed to approach the average buffering over the concentration range along which phosphate diffuses to the root (Silberbush and Barber, 1983). Barber and coworkers usually calculated the buffer power with &'=Cs,initial/Clinitial, with Cs estimated from soil extraction.
In Chapter 3 we use a nutrient uptake model to predict plant P uptake from phosphate adsorbed on goethite. In Fig. 6 predicted uptake is shown using different methods to account for the replenishment of dissolved phosphate by phosphate from the
400
v, 300 c Q.
O E
«3 Q. 3
200
100
m U.D
Ö E. 0.4
initial condition
0 5 10 15 20 P concentration (jiM)
g^-**^
t^---— - ~T A
••^S*^^'" 10 15
time (days) 20 25 30
Fig. 6. Phosphorus uptake observed (•) and predicted (lines) for treatment H in Chapter 3. Model predictions differ in the way buffering is computed (see inset) (A) non linear relation closely describing the measured adsorption data
(B) b'=
(C) V--
(D) b'=
AC/AC, from ClniM to 0.25xCinilial
(e.g. Barber, 1979)
(Scheme and Barber, 1979)
(Lu and Miller, 1994).
17
CHAPTER 1
solid phase. Only when the buffering of phosphate is based on the non linear sorption behaviour of phosphate (Fig. 2 in Chapter 3) and, hence, depends on the phosphate concentration in solution, uptake is predicted accurately. When adsorption is non linear and the adsorption isotherm concave, much more of the phosphate taken up by the root originates from its immediate vicinity than when phosphate adsorption is linear (De Willigen and Van Noordwijk, 1987).
The nutrient uptake model will also be used to examine the effect of rhizosphere processes on phosphate availability. In literature only few reports on the incorporation of rhizosphere processes in phosphorus uptake models exist, viz. changes of rhizosphere pH (Nye, 1984) and the dissolution of phosphate rock by exudation of organic acids (Hoffland et al., 1992). Mechanistic uptake modelling provides the possibility to quantitatively assess the effect of rhizosphere processes on phosphorus availability and to evaluate the relative importance of chemical, physical and biological factors (Bar-Yosef, 1991; Darrah, 1993; Jungk and Claassen, 1997).
Ion adsorption models
The reaction of surface groups of oxides with ions from solution can be described with a chemical equilibrium. The overall affinity of this surface complexation reaction depends on the intrinsic chemical affinity of the ion for the surface group and the electrostatic interaction the ion encounters when it moves from the solution to the surface. The electrostatic contribution to the overall affinity is normally computed with a model. In this research the CD-MUSIC ion adsorption model of Hiemstra and Van Riemsdijk (1996) is used.
The difference in reactivity of the various surface groups present on the goethite surface is taken into account in the CD-MUSIC model. Furthermore, surface complexes that have been identified by spectroscopic methods are used in the model calculations. Protonation of surface groups is modelled with 1 pK reactions. The charge of the surface protons is attributed to the surface (Fig. 7). Non-specifically bound ions, so-called ion pairs, are placed at the head end of the diffuse double layer. Specifically bound ions share ligands with the surface and approach the surface more closely than ion pairs. To be able to place the charge of inner sphere complexes closer to but not completely at the surface, the Stern layer is divided into two layers. Part of the charge of the inner sphere complexes is attributed to the surface and part to the mid-plane.
18

GENERAL INTRODUCTION
surface ligands \
plane 0 1 capacitance C, C2
potential \(J0 y , y2
charge o 0 o , o2 o 0 D L
Fig. 7. Schematic representation of the position of non-specifically adsorbed ions involved in ion pair formation and specifically adsorbed ions forming inner sphere complexes at the goethite/solution interface. The ion pairs approach the surface to a distance of the hydration/oxygen ions, and are placed at the head end of the diffuse double layer. The inner sphere complexes are present more closely to the surface because they exchange ligands with the surface. The charge of the inner sphere complexes is divided over the surface and the 1-plane.
For a good model prediction of ion adsorption it is important that an extended
set of data, comprising the charging behaviour of goethite and the concentration, pH
and ionic strength dependence of adsorption, can be described using a single set of
parameter values.
Outline
In Chapters 3 to 6 of this thesis the results of experimental studies that are
combined with model calculations are presented. Chapters 2 and 7 deal with the
development and results of P uptake simulation models.
Plant P uptake experiments will be performed under P limiting conditions for
which it can be assumed that the root surface behaves as a zero sink. Under such
conditions root hairs make a considerable contribution to P uptake. Because no zero-
sink models accounting for buffered nutrients and root hairs exist, such a model has
been developed and is described in Chapter 2.
19

CHAPTER 1
The plant-availability of phosphate adsorbed on goethite at different phosphate loading and reactive surface area content of goethite is assessed in an uptake experiment, which is described in Chapter 3. In this experiment plants are grown on a solid substrate containing phosphate adsorbed on goethite as P source. In addition, experimental results on the adsorption behaviour of phosphate on the used substrate are presented. From the adsorption data and measured root properties phosphorus uptake is predicted with the zero sink uptake model.
Chapter 4 presents a study on the pH dependent adsorption of phosphate on goethite at a very wide range of phosphate concentrations in solution. For this, batch adsorption experiments were carried out with labelled phosphate. Further, the CD-MUSIC ion adsorption model was used to describe phosphate adsorption. The influence of competitive adsorption of phosphate with other anions present in soils has been examined in Chapters 4 (sulphate) and 6 (citrate).
The effect of competition between phosphate and sulphate on the plant-availability of phosphate is studied experimentally with a method in which the pH can be controlled (Chapter 5). Citrate is chosen as a model component for dissolved organic matter. However, citrate may also be exuded by plant roots as a reaction to P deficiency. By combining the nutrient uptake model and the ion adsorption model the effect that citrate exudation from roots will have on the plant-availability of phosphate is predicted. These model calculations are presented in Chapter 7.
Chapter 8 provides a concise discussion of the results and indicates prospects for future research and applications of the used approach.
20
Modelling zero sink nutrient uptake by roots with root hairs
from soil: comparison of two models

Jeanine S. Geelhoed, Sipko L.J. Mous and Günter R. Findenegg
Soil Science 162, 544-553 (1997)
Modelling zero sink nutrient uptake by roots with root hairs from
soil: comparison of two models.
The influence of root hairs on nutrient uptake from soil is incorporated in uptake models using two different methods. In both models, the roots and root hairs are assumed to behave as a zero sink, hence all nutrient that is transported to the absorbing surface is taken up. The transport of nutrient is assumed to be by diffusion only. In the first model, the continuity equation for zero sink uptake by roots is extended with a separate sink term for zero sink influx into root hairs, and root hair influx is computed using an approximate analytical solution. In the other model, the diffusion equation in three dimensions is solved, with boundary conditions that impose zero sink uptake behaviour on the root with root hairs. Model calculations of phosphorus uptake at phosphorus-deficient growth conditions were performed with both models. Differences in computed uptake were attributable to the use of the approximate analytical solution for root hair influx. The difference in cumulative uptake after 10 days at different buffering, root hair density and root hair length computed with the two models was generally less than 15%. Calculations with the three-dimensional model showed that very short root hairs (0.08 mm) may hinder the diffusion of nutrient to the root, resulting in reduced uptake compared with uptake by a root without root hairs.
Introduction
The uptake of nutrients from soil is determined by the transport rate of
nutrients to the root and by the nutrient influx rate at the root surface. The influx of
nutrient into the root has often been related to the nutrient concentration at the root
surface, either by a linear relation using the root absorbing power (Nye, 1966a) or by
a Michaelis-Menten type relation (Claassen and Barber, 1976). However, the use of
these relations may be disputed because influx is internally regulated and does not
depend only on the nutrient concentration at the root surface (De Willigen and Van
Noordwijk, 1987, 1994a). As a result, the root absorbing power and Michaelis-Menten
parameters may depend on factors such as root age, external nutrient concentration, and
plant nutrient status, and, moreover, the influx parameters may vary in time (De
Willigen and Van Noordwijk, 1987; Jungk et al., 1990).
When the availability of nutrients in the soil is low, uptake is limited by the
transport rate of nutrient to the root (Nye, 1977). In that case, a zero sink uptake model
can be used in which it is assumed that all nutrient that is transported to the root is
taken up. Models for the calculation of zero sink uptake were developed and used
successfully by De Willigen and Van Noordwijk (1987) and Hoffland et al. (1990).
23

CHAPTER 2
The importance of root hairs for nutrient uptake from soil is demonstrated by both experimental evidence and the results of model calculations of nutrient uptake. Phosphorus uptake experiments with selections of white clover and rye differing in root hair length showed that uptake was higher at larger root hair length (Caradus, 1981; Baon et al., 1994). Furthermore, it was observed that the depletion zone of phosphorus in the soil, determined using autoradiographs or by extraction of thin slices of soil, was larger than the length of the root hairs, indicating uptake by root hairs (Bhat et al., 1976; Hendriks et al., 1981; Gahoonia et al., 1992). Model calculations of uptake of phosphorus for plant species differing in root and root hair characteristics were accurate only when the effect of root hairs on uptake was taken into account (Itoh and Barber, 1983a; Föhse et al., 1991). Model calculations also showed that the contribution of nutrient uptake by root hairs is more important when the effective diffusion coefficient of a nutrient in soil is low (Nye, 1966a; Föhse et al., 1991). In that case, transport of the nutrient is dominated by diffusion (Nye, 1977).
The effect of root hairs on nutrient uptake cannot simply be ascribed to the increase in root surface area. In experiments with spinach, root hairs increased the total root surface area three times, whereas the observed uptake was seven times higher than expected from model calculations for roots without root hairs (Föhse et al., 1991). Because root hairs extend perpendicularly from the root and have a small radius compared to roots, a larger soil volume per unit absorbing surface area is exploited compared with roots without root hairs (Nye, 1966a; Silberbush and Barber, 1983). On the other hand, at the base end of the root hairs overlap exists between the depletion zones of the root hairs and the root, and when root hair density is high, overlap may also occur between the depletion zones of different root hairs.
The influence of root hairs on the uptake of nutrients has been incorporated in the nutrient uptake models in two different ways. In one method, the nutrient concentration in the root hair cylinder was assumed to decrease homogeneously compared with the initial concentration (Nye, 1966a; Drew and Nye, 1969; Hoffland et al., 1990). In the other method, a sink term that accounted for root hair influx was added to the continuity equation for uptake by roots. This method was used for the computation of linear uptake and Michaelis-Menten uptake (Bhat et al., 1976; Itoh and Barber, 1983b). The nutrient concentration at the root hair surface, needed to compute influx into root hairs, was estimated from the average nutrient concentration surrounding the root hairs (Baldwin et al., 1973; Itoh and Barber, 1983b).
24

ZERO SINK UPTAKE OF ROOTS WITH ROOT HAIRS
In the present study, two models for the computation of zero sink uptake by
roots with root hairs are described. The first model is an extension of the zero sink
model of Hoffland et al. (1990), in which the effect of root hairs has been incorporated
as an additional sink term in the continuity equation (Bhat et al., 1976). This model
will be referred to as the TERM model. The zero sink influx into root hairs is estimated
from the average concentration surrounding the root hairs using an approximate
analytical solution derived originally for zero sink influx into roots (De Willigen and
Van Noordwijk, 1987, 1994b). The results obtained with the TERM model are
compared to those of a second independent model, which is assumed to yield more
accurate results. In this model, the root with root hairs is treated as a unified geometry,
for which the diffusion equation in three dimensions is solved numerically (3D model).
The imposed boundary conditions of this equation are chosen to resemble zero sink
uptake conditions for the root and root hairs. Soil and plant input data originating from
an experiment with maize plants grown at phosphorus-deficient conditions in sand have
been used in the calculations. The influence of buffering, root hair density, and root
hair length on calculated uptake is studied.
Description of zero sink uptake models
In both models, we assume that a dissolved nutrient is transported by diffusion
and is taken up by the root and root hairs, which behave as a zero sink. To exclude
inter-root competition, we assume that root density is low. The symbols used are
explained in Table 1.
The effective diffusion coefficient of a nutrient in soil is given by Nye (1966b):
with
dC, ÛC b = L = 6+ L (2)
dC, dC,
in which dC/dC, is the slope of the sorption isotherm. In this study we consider only
linear sorption, i.e. b is constant. Moreover, De{{ is assumed isotropic and constant, and
the soil is assumed homogeneous.
25

CHAPTER 2
Table 1. List of symbols
Symbol
a b
c, cs c, A, Dctl
f h
K ht
I
4 L "rh
r ro r, t
'o z
Zl
* 4>i
e X
Definition
root hair surface area per unit volume
buffering
concentration of dissolved nutrient
concentration of sorbed nutrient
total concentration of nutrient
diffusion coefficient of nutrient in water
effective diffusion coefficient
tortuosity factor
distance from the centre of a root hair
root hair radius
half-distance between centres of root hairs
influx
influx into root hairs
root hair length
root hair density
radial distance
root radius
outer boundary in r-direction
time
start of the simulation
distance in z-direction
outer boundary in z-direction angle in ((»-direction outer boundary in ((»-direction
volumetric moisture content
time scale parameter: z=t/b
Dimension
m2 m"3 soil
m3 solution m'3 soil
mol m"3 solution
mol m"3 soil
mol m"3 soil
m2 h"1
m2 h-1
-m
m
m
mol m'2 h"'
mol m'2 h"1
m
m"1
m
m
m
h
h
m
m rad rad
m3 solution m'3 soil
h m3 soil m"3 solution
26
ZERO SINK UPTAKE OF ROOTS WITH ROOT HAIRS
TERM model
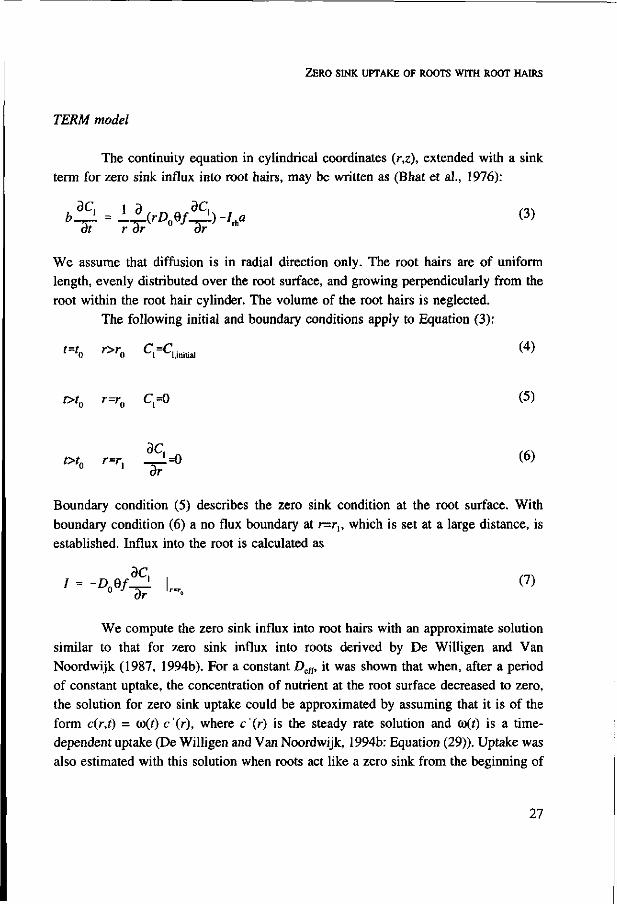
The continuity equation in cylindrical coordinates (r,z), extended with a sink term for zero sink influx into root hairs, may be written as (Bhat et al., 1976):
oC, 1 7) aC, ,o>. b-i - &"•*-£-''>• <3)
We assume that diffusion is in radial direction only. The root hairs are of uniform length, evenly distributed over the root surface, and growing perpendicularly from the root within the root hair cylinder. The volume of the root hairs is neglected.
The following initial and boundary conditions apply to Equation (3):
(4)
(5)
t%
t>t0
t>t0
r>r0
r=r0
r=ri
C=C ° 1 v'l,iniüal
c,=o
dc. L=o
dr (6)
Boundary condition (5) describes the zero sink condition at the root surface. With boundary condition (6) a no flux boundary at r=rv which is set at a large distance, is established. Influx into the root is calculated as
dC, (V)
r
We compute the zero sink influx into root hairs with an approximate solution similar to that for zero sink influx into roots derived by De Willigen and Van Noordwijk (1987, 1994b). For a constant De({, it was shown that when, after a period of constant uptake, the concentration of nutrient at the root surface decreased to zero, the solution for zero sink uptake could be approximated by assuming that it is of the form c(r,t) = (o(t) c'(r), where c'(r) is the steady rate solution and co(f) is a time-dependent uptake (De Willigen and Van Noordwijk, 1994b: Equation (29)). Uptake was also estimated with this solution when roots act like a zero sink from the beginning of
27
CHAPTER 2
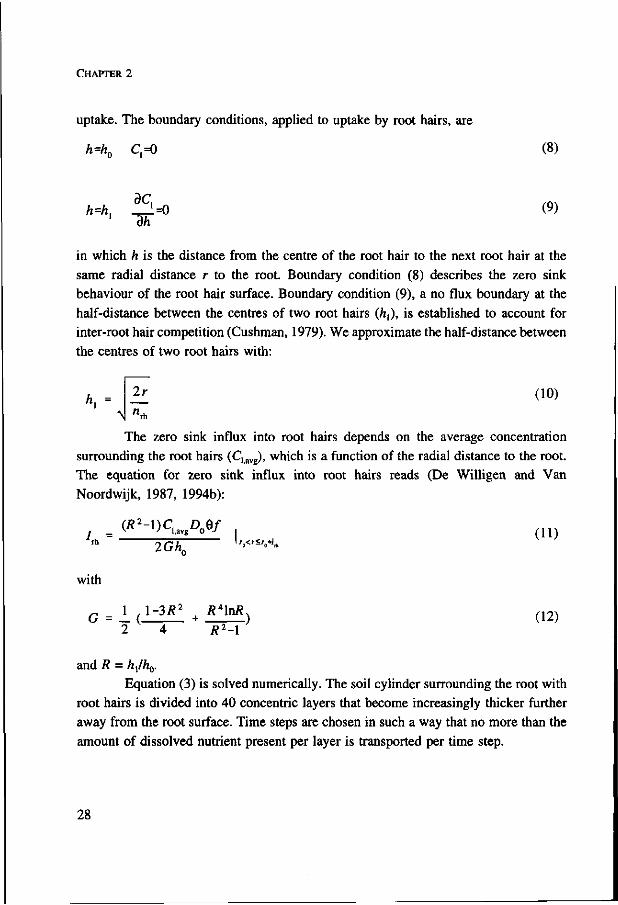
uptake. The boundary conditions, applied to uptake by root hairs, are
h=h0 C,=0 (8)
h=h, ^1=0 (9) dh
"i
in which h is the distance from the centre of the root hair to the next root hair at the same radial distance r to the root. Boundary condition (8) describes the zero sink behaviour of the root hair surface. Boundary condition (9), a no flux boundary at the half-distance between the centres of two root hairs (A,), is established to account for inter-root hair competition (Cushman, 1979). We approximate the half-distance between the centres of two root hairs with:
\ -N
1r (10)
The zero sink influx into root hairs depends on the average concentration surrounding the root hairs (C, avg), which is a function of the radial distance to the root. The equation for zero sink influx into root hairs reads (De Willigen and Van Noordwijk, 1987, 1994b):
_ (*M)cUvgp0e/ rh 2Gh0 'r°< 'Sr°+ '»
w i th
G = I (l~3R2 + ^ ) (12) 2 4 / ?M
and R = A[/A0. Equation (3) is solved numerically. The soil cylinder surrounding the root with
root hairs is divided into 40 concentric layers that become increasingly thicker further away from the root surface. Time steps are chosen in such a way that no more than the amount of dissolved nutrient present per layer is transported per time step.
28

ZERO SINK UPTAKE OF ROOTS WITH ROOT HAIRS
3D model
We use cylindrical coordinates (r,§,z) to represent a root segment with length
z, with one root hair that extends in the r direction. The continuity equation in this
system (r,(j),z) reads:
8C, d2C. i 3C, i 32C, d2C.
dt e" dr2 r dr r2 B f dz2
The initial conditions are:
(13)
t=t0 rQ<r<r0+lrh <|)=0 0<z<Z! C,(r,{|),z)=CUnitial
t=t0 roKrcro+l^ 0«t><<>, 0<z<z, Qir&z)^
t=t0 r>r0+llh 0<(t)<^, 0<z<z, C,(r,(|),z)=Cliinitial
The boundary conditions are:
t>tn r=rn O ^ â h 0<z<z, C,(r,<|),z)=0
f>f0 r0<r<r0+/rh (|)=0
O/b r>r0+/rh (|)=0
Of0 r0<r<r0+/rh Q=0
z=0
t>t0 r0<r<r{ <M>i
C,(r,(|),z)=0
0<z<z, ac,/3<|)=0
0<z<z, ac/30=o
0<z<z, 3C/9(|)=0
f>r0 ^ o ^ r , O â ^ , z=0,z=z, 3C,/3z=0
()£$£$, 0<z<z, 3C/Br=0
(14)
(15)
(16)
(17)
(18)
(19)
(20)
(21)
(22)
(23)
Boundary conditions (17) and (18) impose the zero sink behaviour of the root and root
hair surface. Because of symmetry in (()=<(), and z=Z\ caused by inter-root hair
29

CHAPTER 2
competition, boundary conditions (19) to (22) are described. Boundary condition (23) establishes a no flux boundary at r=r,, which is set at a large distance to the root to avoid inter-root competition.
We solve Equation (13) for an element shown in Fig. 1. At the root surface, the distance from the root hair to the boundary in the (j) and z-direction is the same; thus r0x$1=zl. The values of tyt and z{ depend on the root hair density. The boundaries used in this system define one-fourth of the soil volume that is influenced by one root hair and by the root surface associated with that root hair. The volume of the root hair is neglected. To compute uptake by a root segment with root hairs, uptake computed for the element is multiplied by four and by the root hair density.
---.
"••-J r=r0
z=z0 <t>=<t>0
r o o t
Cj=0
• • y \ \
root hair\
C,=0
r=r0
^— z=z, <t>=<l>i
t>C/bz=0
oq/!x|>=o \
bC,/br=0
Fig. 1. Schematic representation of the element used in the 3D model. The system is symmetric in <!>=<(>, and z=zt- The boundary conditions imposed on this element are indicated in the figure.
The spatial variables (r,<j),z) in Equation (13) are discretised using finite differences. This semi-discretisation of the diffusion equation results in a system of ordinary differential equations (ODEs), which are solved numerically using an ODE solver. It seemed that the problem is very stiff and, as a result, when using the simple explicit Euler method as ODE solver, very small time steps are needed to make the method stable. To overcome these problems, we have chosen Gear's method, i.e.
30
ZERO SINK UPTAKE OF ROOTS WITH ROOT HAIRS
backward differences up to order 5, an ODE solver especially suited for stiff systems (Gear, 1971; IMSL, 1991). Uptake in time is computed from the difference in the total amount of nutrient in the element in time. The accuracy of the method was tested by solving the equation with different spatial step sizes. With each decreasing step size, computed uptake decreased and seemed to converge to the 'true' solution.
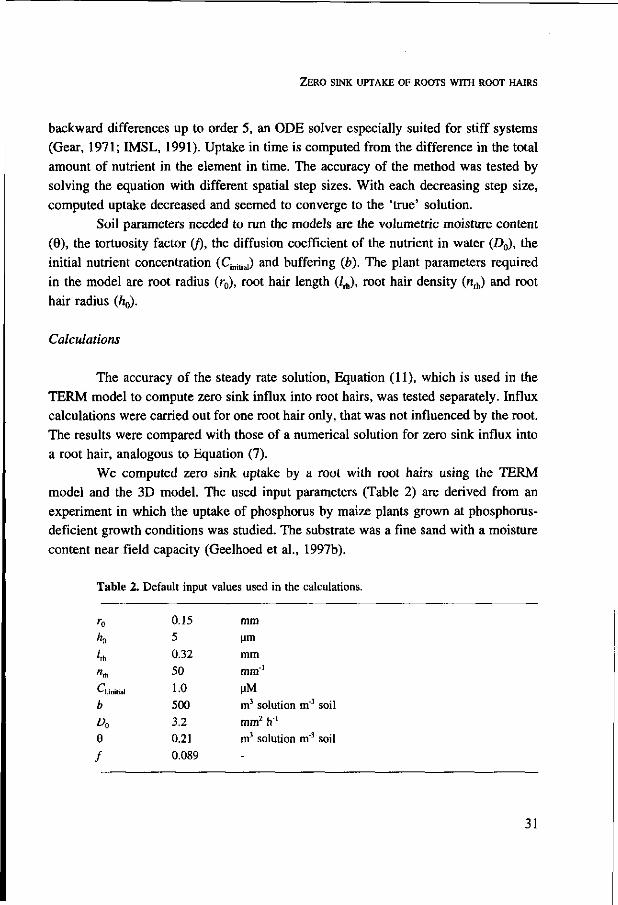
Soil parameters needed to run the models are the volumetric moisture content (0), the tortuosity factor (ƒ), the diffusion coefficient of the nutrient in water (£>0), the initial nutrient concentration (Cinilial) and buffering (b). The plant parameters required in the model are root radius (r0), root hair length (/rh), root hair density (rcrh) and root hair radius (h0).
Calculations
The accuracy of the steady rate solution, Equation (11), which is used in the TERM model to compute zero sink influx into root hairs, was tested separately. Influx calculations were carried out for one root hair only, that was not influenced by the root. The results were compared with those of a numerical solution for zero sink influx into a root hair, analogous to Equation (7).
We computed zero sink uptake by a root with root hairs using the TERM model and the 3D model. The used input parameters (Table 2) are derived from an experiment in which the uptake of phosphorus by maize plants grown at phosphorus-deficient growth conditions was studied. The substrate was a fine sand with a moisture content near field capacity (Geelhoed et al., 1997b).
Table 2. Default input values used in the calculations.
r0
K L « rh
r
b
A> e ƒ
0.15 5
0.32
50
1.0
500
3.2 0.21
0.089
mm jim
mm
mm"1
MM
m3 solution m"3 soil
mm2 h"1
m3 solution m"3 soil -
31
CHAPTER 2
Results and discussion
Calculations for one root hair
Buffering and time are both influencing the time scale of diffusion and are,
therefore, combined in x, defined as tlb. The radius of the volume assigned to one root
hair (h{) also influences the developing concentration gradient. For a root with root
hairs, ft, depends on the root hair density, root hair length and the root radius. Itoh and
Barber (1983a) and Föhse et al. (1991) reported root hair densities of different plant
species varying from 44 to 186 mm"1 and (root radius + root hair length) in the range
of 0.15 to 0.73 mm, resulting in a ft, in the range of 0.05 to 0.15 mm.
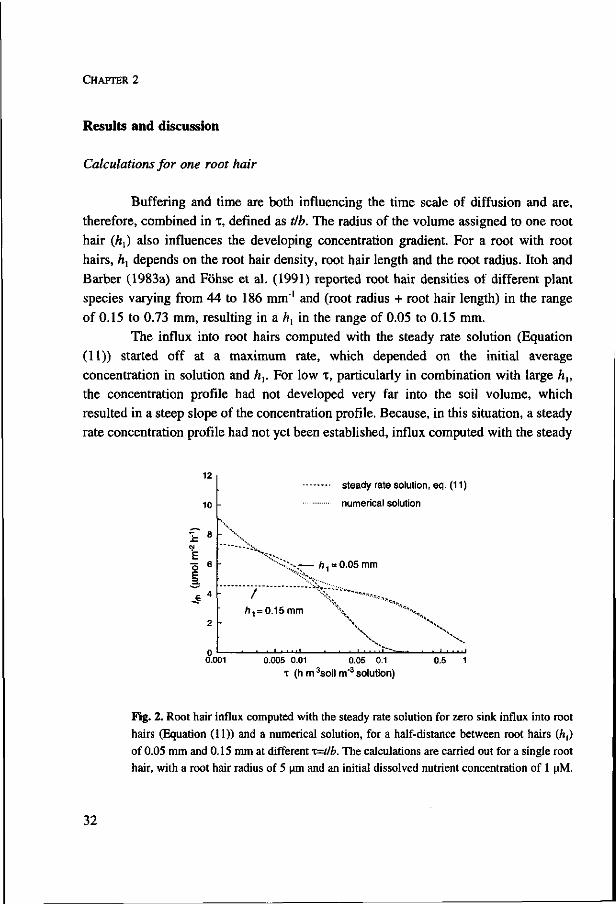
The influx into root hairs computed with the steady rate solution (Equation
(11)) started off at a maximum rate, which depended on the initial average
concentration in solution and ft,. For low x, particularly in combination with large ft,,
the concentration profile had not developed very far into the soil volume, which
resulted in a steep slope of the concentration profile. Because, in this situation, a steady
rate concentration profile had not yet been established, influx computed with the steady
1Z
10
ï 8 CM
E n 6
i .J 4
2
steady rate solution, eq. (11)
. , , ..
"':".:-..-— h, = 0.05 mm
' • • . * ; •
/7, = 0.15mm \ """'"«*
-
• • • • r~- • • ' 0.001 0.005 0.01 0.05 0.1
T (h m 3soil m"3 solution) 0.5
Fig. 2. Root hair influx computed with the steady rate solution for zero sink influx into root
hairs (Equation (11)) and a numerical solution, for a half-distance between root hairs (A,)
of 0.05 mm and 0.15 mm at different i=tlb. The calculations are carried out for a single root
hair, with a root hair radius of 5 urn and an initial dissolved nutrient concentration of 1 uM.
32

ZERO SINK UPTAKE OF ROOTS WITH ROOT HAIRS
rate solution was lower than when computed numerically (Fig. 2). For intermediate T,
the concentration profile extended further into the soil cylinder and the influx computed
with the steady rate solution was more in agreement with numerically computed influx.
At high T, similar influxes were computed with both methods. However, the soil
volume assigned to the root hair, with outer boundary A„ was almost depleted by then.
Calculations for a root with root hairs
In the 3D model, the influx into root hairs is solved directly and the influence
of root hairs on nutrient transport and uptake by the root is accounted for. In the TERM
model, root hair influx is estimated using the steady rate solution (Equation (11)) and
the influence of root hairs on root influx is incorporated only in the decrease of the
average nutrient concentration surrounding the root. Therefore, we assume that the
results obtained with the 3D model are more accurate than with the TERM model.
We computed zero sink uptake by a root with root hairs, in time, using the
default input parameters (Fig. 3). For time shorter than 0.2 days, the TERM model
computed lower uptake than the 3D model, which can be explained by the
underestimation of the influx into root hairs by the steady rate solution at small f (Fig.
2). When longer time, and consequently higher T, was considered, the TERM model
3.5
3.0
£^2.5 E o ö 2.0 E c
co fl.O
0.5
0.0
TERM model
3D model
4 6
time (days) 10
Fig. 3. Uptake by a root with root hairs in time, computed with the TERM model and the
3D model. The calculations are carried out with the default input parameters in Table 2.
33
CHAPTER 2
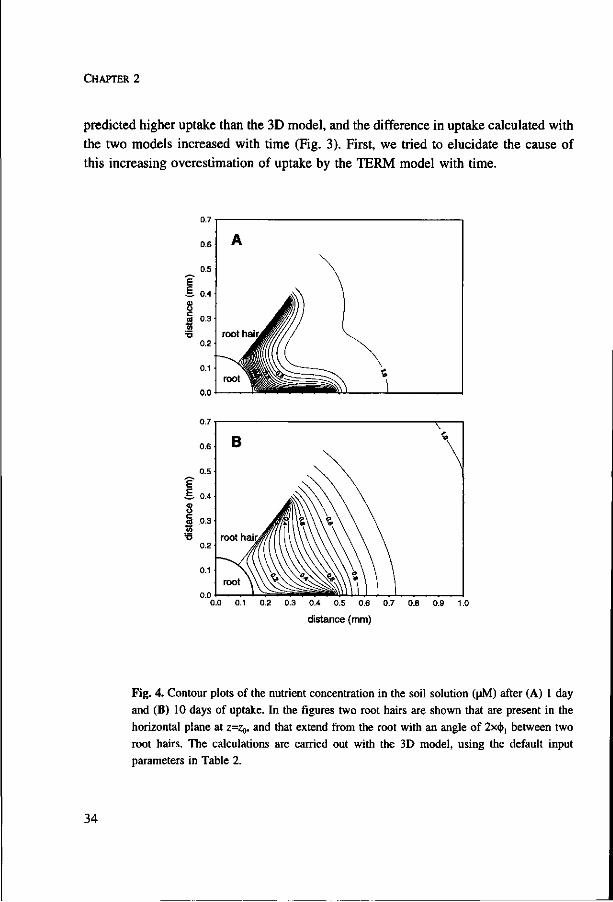
predicted higher uptake than the 3D model, and the difference in uptake calculated with
the two models increased with time (Fig. 3). First, we tried to elucidate the cause of
this increasing overestimation of uptake by the TERM model with time.
0.0 0.1 0.2 0.3 0.4 0.5 0.6 0.7 0.8 0.9 1.0
distance (mm)
Fig. 4. Contour plots of the nutrient concentration in the soil solution (uM) after (A) 1 day and (B) 10 days of uptake. In the figures two root hairs are shown that are present in the horizontal plane at z=Zg, and that extend from the root with an angle of 2x<|>1 between two root hairs. The calculations are carried out with the 3D model, using the default input parameters in Table 2.
34

ZERO SINK UPTAKE OF ROOTS WITH ROOT HAIRS
The influence of the presence of root hairs on nutrient diffusion to the root and
root hairs, as computed with the 3D model, is illustrated with contour plots of the soil
solution concentration in the z-plane where root hairs are present (Fig. 4). At the root
hair surface the density of the contour lines was higher, and, hence, the concentration
gradients and influx rates were larger than at the root surface. The soil in the root hair
cylinder was not homogeneously depleted, but the differences in the soil solution
concentration at the same radial distance from the root became smaller with longer
uptake time. With longer uptake time, the depletion zone extended further outside the
root hair cylinder.
Using the data in the contour plots (Fig. 4), we computed the influx into the
root hair at different distance to the root surface with the steady rate solution (Equation
(11)) and from the concentration gradients at the root hair surface (Fig. 5). For both
methods, root hair influx increased with greater distance to the root surface and was
greatest at the root hair tip. At day 10, root hair influx was lower than at day 1, which
is in agreement with the lower density of the lines in the contour plots at day 10 (Fig.
4).
o
| 2
0 b
1 day
. . .-• ' ' ' 10 days
;'.' steady rate solution, eq. (11) from concentration gradient
i i i , i i
0.1 0.2 0.3 0.4 distance to root (mm)
Fig. 5. Root hair influx, after 1 day and 10 days of uptake by a root with root hairs, dependent on the distance to the root. Root hair influx is computed with the steady rate solution (Equation (11)), using the average concentration at Z=ZQ and distance r as the average nutrient concentration surrounding the root hair (C, avg) at r. Root hair influx is also computed from the concentration gradients at the root hair in the plane where Z=ZQ.
35
CHAPTER 2
B
hair
nutrient transport to the root hair
'"••/ cylinder
root Hair!
root hair cylinder
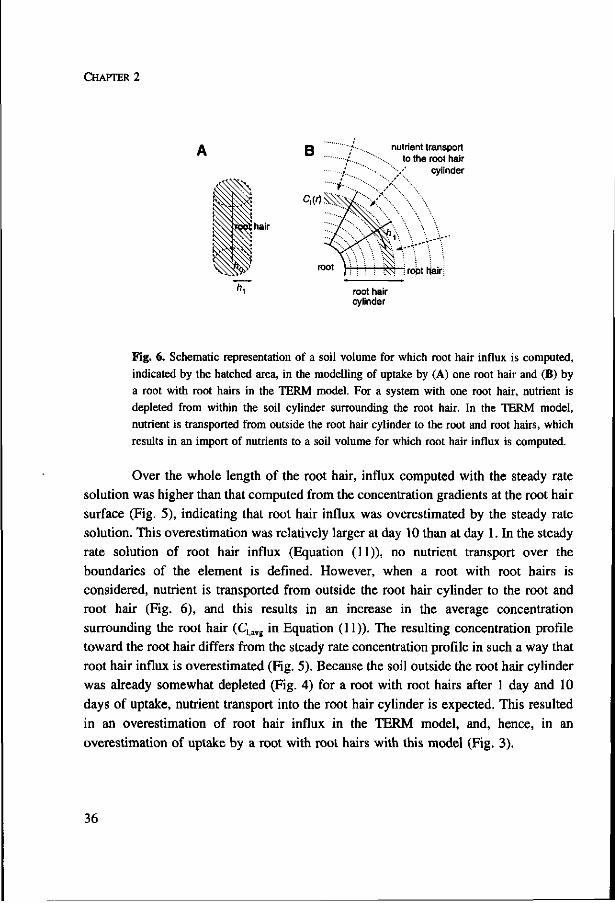
Fig. 6. Schematic representation of a soil volume for which root hair influx is computed, indicated by the hatched area, in the modelling of uptake by (A) one root hair and (B) by a root with root hairs in the TERM model. For a system with one root hair, nutrient is depleted from within the soil cylinder surrounding the root hair. In the TERM model, nutrient is transported from outside the root hair cylinder to the root and root hairs, which results in an import of nutrients to a soil volume for which root hair influx is computed.
Over the whole length of the root hair, influx computed with the steady rate
solution was higher than that computed from the concentration gradients at the root hair
surface (Fig. 5), indicating that root hair influx was overestimated by the steady rate
solution. This overestimation was relatively larger at day 10 than at day 1. In the steady
rate solution of root hair influx (Equation (11)), no nutrient transport over the
boundaries of the element is defined. However, when a root with root hairs is
considered, nutrient is transported from outside the root hair cylinder to the root and
root hair (Fig. 6), and this results in an increase in the average concentration
surrounding the root hair (Clavg in Equation (11)). The resulting concentration profile
toward the root hair differs from the steady rate concentration profile in such a way that
root hair influx is overestimated (Fig. 5). Because the soil outside the root hair cylinder
was already somewhat depleted (Fig. 4) for a root with root hairs after 1 day and 10
days of uptake, nutrient transport into the root hair cylinder is expected. This resulted
in an overestimation of root hair influx in the TERM model, and, hence, in an
overestimation of uptake by a root with root hairs with this model (Fig. 3).
36
'E 5 o Ö 4
ï3
f2
1
O
A
• M"
•
..--'' *
• -O - TERM model • • • • • 3D model
ZERO SINK UPTAKE OF ROOTS WITH ROOT HAIRS
B
fesr U
| «
f3
S2
- -O
.<••**
500 1000 1500 2000 buffering (m3 solution mr3 soil)
20 40 60 80 root hair density (mm"1)
7
6
'F i u 0 4
c m 3
&2
3 , '
c
• ••'
,o
^ ' ' .• , ' '
. - . * • • • • '
. * • • • "
0 0.1 0.2 0.3 0.4 0.5 0.6 0.7 root hair length (mm)
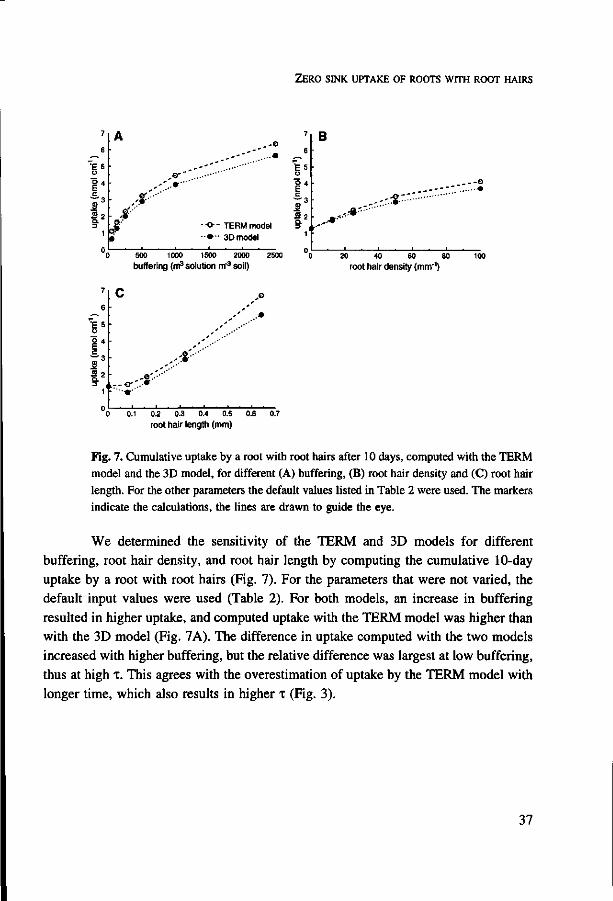
Fig. 7. Cumulative uptake by a root with root hairs after 10 days, computed with the TERM model and the 3D model, for different (A) buffering, (B) root hair density and (C) root hair length. For the other parameters the default values listed in Table 2 were used. The markers indicate the calculations, the lines are drawn to guide the eye.
We determined the sensitivity of the TERM and 3D models for different
buffering, root hair density, and root hair length by computing the cumulative 10-day
uptake by a root with root hairs (Fig. 7). For the parameters that were not varied, the
default input values were used (Table 2). For both models, an increase in buffering
resulted in higher uptake, and computed uptake with the TERM model was higher than
with the 3D model (Fig. 7A). The difference in uptake computed with the two models
increased with higher buffering, but the relative difference was largest at low buffering,
thus at high T. This agrees with the overestimation of uptake by the TERM model with
longer time, which also results in higher i (Fig. 3).
37

CHAPTER 2
When the density of root hairs, with a length of 0.32 mm, was enlarged, computed uptake for both models increased. Uptake computed with the TERM model was higher than with the 3D model (Fig. 7B). For high root hair density, thus small hx, the approximation of root hair influx by the steady rate solution at short time, i.e. low t, is better than for large A, (Fig. 2). On the other hand, the larger root hair surface area per unit volume (a) and the observed overestimation of root hair influx with longer time in the TERM model (Fig. 5) appear to cause the higher uptake computed with the TERM model with increasing root hair density.
With larger root hair length, uptake increased, and this increase was larger for the TERM model than for the 3D model (Fig. 7C) because root hair influx is overestimated with longer time in the TERM model (Fig. 5). For root hairs larger than 0.08 mm, uptake computed with the 3D model was almost linearly related to root hair length. Apparently, the increase in absorbing surface area, which is proportional to the root hair length, and the associated increase in the soil volume depleted by the root hairs, are the most important factors causing increased uptake with larger root hair length. For a root with short root hairs (0.08 mm) uptake computed with the 3D model was 28 % lower than for a root without root hairs (Fig. 7C). This unexpected result did not occur after a short uptake period. After 1 day, uptake was enhanced by 11 % as a result of the presence of 0.08-mm-long root hairs.
To explain these results, we have examined the concentration profiles extending in the soil cylinder computed with the 3D model. The concentration profile, extending in the soil cylinder at the half-distance between two root hairs ( i ^ , ) , after 1 day of uptake, had about the same shape as the concentration profile around a root without root hairs (Fig. 8A). This indicates that the presence of root hairs is not influencing uptake by the root in the middle between root hairs. However, the concentration profile close to the root hair (((^O.O^,) shows that the nutrient concentration in solution had decreased as a result of influx into the root hair, resulting in increased uptake compared to a root without root hairs after 1 day. After 10 days of uptake (Fig. 8B), the concentration between two root hairs was higher than in the absence of root hairs, indicating that the presence of root hairs has a negative effect on the uptake of nutrient by the root. This reduction in uptake is apparently caused by a perturbation of the concentration profile around the root in the presence of root hairs.
38

ZERO SINK UPTAKE OF ROOTS WITH ROOT HAIRS
1.0
0.8
c g «j 0.6 c <1>
o § 0 . 4
Ö 0.2
0.0
A
// :
I; : i; :
. f : f :
f /
< • <
/ •~
—
•
- no root hairs
short root hairs,
• short root hairs,
i i
<f= ¥
=<I>1
=0.04^
1.0
0.8
g 13 0.( c O
8°'
f 0.2 in
0.0
B
/// fl
. y
/
0.1 0.2 0.3 0.4 distance to root (mm)
0.5
Fig. 8. Concentration profiles of nutrient in the soil solution extending radially from a root without root hairs or a root with 0.08 mm long root hairs, after (A) 1 day and (B) 10 days of uptake. The calculations were carried out with the 3D model. For a root with root hairs of 0.08 mm length, the concentration profile in the s-plane where the root hair is present (z=Zo) is calculated at <|)=<t>„ i.e. in the middle between two root hairs, and at ^O .O^ , , i.e. at a distance of 2.7 (at the root hair base) to 4.2 urn (at the root hair tip) to the root hair. The values of the other input parameters were taken from Table 2.
39

CHAPTER 2
The use of a numerical solution of the 3D diffusion equation (3D model) to compute uptake by a growing root system is not convenient because small discretisation steps in space and time are needed, which results in very long computation time. In the TERM model, in which root hair influx is treated as a separate sink term, the number of layers distinguished within the soil volume surrounding the root is limited and, consequently, computation time is short. The difference between cumulative uptake by a root with root hairs, computed with both models, was usually smaller than 15%. The relative differences were larger only for long uptake time, low buffering and large root hair length (Fig. 3, 7). This indicates that when zero sink uptake conditions apply, the TERM model can be used for the calculation of nutrient uptake by a growing root system. We used the TERM model, adapted for a growing root system, to predict the availability of sorbed phosphate for uptake by plant roots (Geelhoed et al., 1997b).
Conclusions
Differences in computed uptake between the TERM and 3D model are caused by the estimation of root hair influx with the steady rate solution in the TERM model. The relative difference in uptake is larger at long-time, low buffering and long-root hair length, for which root hair influx is overestimated in the TERM model. During uptake by the root with root hairs, nutrient is transported into the root hair cylinder. The resulting concentration profile toward the root hair cannot be described by a steady rate profile, which results in an overestimation of root hair influx in the TERM model. Computations with the 3D model showed that small root hairs decrease nutrient uptake compared to a root without root hairs because of a perturbation of the concentration profile around a root.
Acknowledgement
Dr. P. De Willigen, DLO Research Institute for Agrobiology and Soil Fertility, Haren, The Netherlands, is thanked for valuable discussion.
40

Availability to plants of phosphate adsorbed on goethite:
experiment and simulation
Jeanine S. Geelhoed, Günter R. Findenegg and Willem H. Van Riemsdijk
European Journal of Soil Science 48, 473-481 (1997)

Availability to plants of phosphate adsorbed on goethite: experiment
and simulation
A model has been developed to predict the availability of sorbed phosphate to plants. It is based on uptake by a growing root system. Phosphate sorption is assumed to be reversible and the rate of desorption is assumed not to limit uptake. The model was tested against observed availability of sorbed phosphate estimated from uptake by plants growing in phosphorus-deficient conditions. The plants were grown on quartz sand coated with goethite on which phosphate was adsorbed, and which was mixed with nutrient solution. The influence of the phosphate loading of goethite and the goethite content of the sand on available phosphate was examined. Phosphorus uptake was predicted well by the model for treatments with high phosphate loading and different goethite content of the sand. However, for a treatment with low phosphate loading, uptake was underestimated by the model. In this treatment the pH of the 'soil' solution decreased from 5.5 to 4.2 during the experiment. The phosphate concentration in solution increased with a lowering of the pH in this pH range, resulting in increased phosphorus uptake.
Introduction
Sorption of phosphate by soils is strongly influenced by the presence of iron
and aluminium oxides and hydroxides (Hsu, 1977; Schwertmann & Taylor, 1977).
Phosphate sorption on these metal (hydr)oxides is, at least partly, reversible, and after
desorption phosphate can be taken up by plants (Solis & Torrent, 1989b). Soltan et al.
(1993) have shown that phosphate desorbed from metal (hydr)oxides is an important
source of phosphate for plants in both acid and calcareous soils.
Quantification of the availability to plants of phosphate sorbed on metal
(hydr)oxides in soils is difficult, because other fractions that supply phosphate may be
present. These other fractions may be bound to organic compounds and to edge faces
of clay minerals and may be present in precipitates. The sorption of phosphate on metal
(hydr)oxides in soil may also be influenced by other chemical species that interact with
the metal (hydr)oxides in the soil. Furthermore, the desorption of phosphate from soils
is usually slow (Lookman et al., 1995).
To study the availability of phosphate sorbed on metal (hydr)oxides we used
goethite, a well-defined iron oxyhydroxide. Goethite is the most abundant metal
(hydr)oxide in soils (Schwertmann & Taylor, 1977), and phosphate sorption on it has
been studied extensively. Phosphate sorption on goethite is non-linearly related to the
phosphate concentration in solution (Bowden et al., 1980), even at very small solution
concentration (Geelhoed et al., 1997a).
43

CHAPTER 3
The availability of phosphate sorbed on goethite is often assumed to be slight. Torrent et al. (1992), for example, found that only 30-60% of phosphate sorbed on goethite was isotopically exchangeable within 24 hours. He et al. (1991) measured even less isotopic exchangeability, but they observed that the exchangeability increased as the loading of phosphate on the goethite was increased. The uptake of phosphate sorbed on metal (hydr)oxides by plants also increased with higher phosphate loading (Parfitt, 1979; He et al., 1994). This effect was ascribed to the smaller adsorption energy of phosphate with higher loading, which results in larger concentration in solution at equilibrium (Parfitt, 1979).
We evaluated quantitatively the availability of sorbed phosphate to plants from the mobility of phosphate in the substrate, which is related to the sorption behaviour of phosphate on the substrate. We used the non-linear relation between total diffusible phosphate (sorbed + dissolved) and dissolved phosphate to compute the buffering of dissolved phosphate by sorbed phosphate (Nye, 1966b; Baldwin & Nye, 1974). The availability of sorbed phosphate was predicted using a model to calculate uptake by a growing root system that accounts for buffering. We computed the transport of phosphate to the root by diffusion and mass flow (Barber, 1984), and assumed that the roots behave as a zero sink, which means that all phosphate arriving at the root surface is taken up (De Willigen & Van Noordwijk, 1987; Hoffland et al., 1990).
The availability of sorbed phosphate was estimated experimentally from the phosphorus uptake by plants growing in phosphorus-deficient conditions. The growth substrate was quartz sand coated with goethite (Scheidegger et al., 1993), on which phosphate was adsorbed, mixed with nutrient solution. To determine buffering the phosphate adsorption isotherm of quartz sand coated with goethite in nutrient solution was determined over a wide range of phosphate concentration in solution. The adsorption rather than the desorption isotherm was used because it is difficult to measure desorption at the small phosphate concentrations that occur in the rhizosphere. The influence of the loading of goethite with phosphate and the goethite content of the substrate on observed and simulated uptake was determined.
Materials and methods
Preparation of goethite
Two batches of goethite were prepared by titrating 5 1 of 0.5 M Fe(N03)3.9
44
PLANT-AVAILABILITY OF PHOSPHATE ADSORBED ON GOETHITE
H20 with 2.5 M NaOH at a rate of 0.5 1 h"1 to a pH of 12. The suspension was aged for 4 days at 60°C and subsequently dialysed (Hiemstra et al., 1989b). The pristine point of zero charge of both goethites, which was determined from acid-base titrations at different ionic strengths carried out under N2 atmosphere (Venema et al., 1996), was 9.2. The BET specific surface area (Brunauer et al., 1938) was 92.9 m2 g1 for goethite_l and 96.4 m2 g"' for goethite_2.
Coating of quartz sand with goethite
Quartz sand was washed with 1.5 M HCl and demineralized water and heated to 900°C to make it inert with respect to phosphate (Hoffland et al., 1990). A column of quartz sand was equilibrated with 0.01 M NaNOa at pH 5, after which a dilute goethite_l suspension (0.5 g l"1 in 0.01 M NaN03, pH 5) was percolated through the sand column. Subsequently, the sand column was again washed with 0.01 M NaN03
at pH 5. The sand with goethite was dried at 110°C, to attach the goethite to the sand strongly (Scheidegger et al., 1993), and washed with demineralized water. The extent of the goethite coating, determined after HF/HN03/H202 digestion and measuring Fe using ICP, was 2.0 g goethite kg'1 quartz sand. The specific surface area was 0.21 (± a standard error of 0.02 based on 3 observations) m2 g"1 sand.
Preparation of the substrate for plant growth
Phosphate was adsorbed on quartz sand coated with goethite at 0.41 and 0.22 mmol P kg"1. For the high phosphate level two batches of 25 kg, and for the low level one batch of 28 kg quartz sand coated with goethite were each mixed with 35 1 nutrient solution at pH 5.5 and the required amount of phosphate. Twice a day during 18 days the sand and solution were mixed, and the pH was adjusted to 5.5. Within this period equilibrium was attained. The sand was dried at room temperature, and the two batches of sand with the high phosphate level were mixed.
The phosphate concentration in solution was 12.7 uM for the high phosphate level and 0.1 uM for the low level. The solution concentration for the low level was derived from the phosphate adsorption isotherm of goethite in nutrient solution (see Measurement of the adsorption isotherm).
45

CHAPTER 3
Table 1. Treatments in the uptake experiment, differing in the amount of quartz sand coated
with goethite per pot and the level of phosphate adsorbed on goethite.
Treatment
H
ViU L
Quartz sand
with goethite
(kg pot1)
1.6 0.8a
1.6
Goethite
surface area (m2 kg"1 sand)
190 95 190
a mixed with 0.8 kg quartz sand pot"1
growth
Adsorbed P on goethite
(umol m'2)
2.18
2.18 1.16
P equilibrium concentration
(MM)
12.7
12.7 0.1
Maize plants (Zea mays L. var. LG11) were grown on quartz sand coated with
goethite. One plant was grown per pot (volume 1.2 1, height 12 cm) containing 1.6 kg
sand mixed with 0.25 1 nutrient solution. The nutrient solution contained 5 mM KN03,
3.5 mM Ca(N03)2, 1.5 mM NH4N03, 2 mM MgS04 and trace elements, in uM: Fe (as
FeEDTA) 82; B 46; Mn 9.1; Cu 0.76; Zn 0.31 and Mo 0.10, at pH 5.5.
Treatments consisted of quartz sand coated with goethite with 0.41 mmol P kg"1
(H), 0.22 mmol P kg"1 (L), a 1:1 mixture of quartz sand coated with goethite with 0.41
mmol P kg"1 sand and pure quartz sand (V6H) (Table 1), and a blank treatment,
consisting of quartz sand coated with goethite on which no phosphate was adsorbed.
Phosphorus uptake was calculated from the difference in phosphate content between the
plants of the +P treatments and the blank.
The plants were grown in a growth chamber at 25°C with a relative humidity
of about 80% and a light intensity of 70 W m"2 (day length 16 h). The substrate was
covered with plastic film to reduce evaporation. Evaporation from pots without plants
and évapotranspiration from pots with plants was recorded daily, after which the
moisture in the pots was adjusted using demineralized water or a solution containing
40 mM KNOj and 5 mM NH4N03.
Three pots per treatment were harvested 5, 10, 17, 23 and 29 days after
emergence of the plants. Root length and dry matter of shoots and roots were
determined. The phosphorus concentration of shoots and roots was determined after wet
digestion in a mixture of H2S04, Se and salicylic acid with addition of H202 and
46

PLANT-AVAILABILITY OF PHOSPHATE ADSORBED ON GOETHITE
measuring total P using the molybdenum blue method. The 'soil' solution was collected using vacuum, the pH of the solution was measured and, for treatments H and V2H at day 5 and 10, the phosphate concentration was determined using the malachite green method (Novozamsky et al., 1993). Roots of harvest 3 were lost. Therefore dry matter, phosphate content and length of the roots were estimated from the data obtained for harvest 2 and 4. The radius of roots and the length, radius and density of root hairs were estimated from microphotographs of roots taken 5 days after emergence. The tortuosity factor was determined from the measured relation with the volumetric moisture content for quartz sand (Hoffland et al., 1990).
Measurement of the adsorption isotherm
Batch adsorption experiments were carried out using goethite_2 and quartz sand coated with goethite in nutrient solution. For adsorption on goethite, equilibrium was attained after 24 h, whereas for adsorption on quartz sand coated with goethite it required 2 weeks.
Phosphate adsorption on goethite in nutrient solution at pH 5.5 was measured over a wide range of phosphate solution concentrations using 32P. To avoid precipitation, the components of the nutrient solution, except KN03, were added after phosphate addition and mixing. To each suspension KH2P04 solution with carrier free 32P was added, resulting in a ratio of 31P:32P larger than 3.6-105. After shaking for 24 h, the suspensions were centrifuged, and the pH was determined. The 32P was determined by Cerenkov counting, and 31P was calculated using the 31P:32P ratio corrected for disintegration. Following the same procedure, phosphate adsorption was determined at a range of pHs for three total P:goethite ratios. From these data the amount of phosphate adsorbed and the phosphate solution concentration at pH 4.0, 5.0, 5.5 and 6.0 were determined by interpolation.
Phosphate adsorption on quartz sand coated with goethite was determined at a range of phosphate concentrations in nutrient solution at pH 5.1. The sand with solution was shaken for 24 h, after which it was shaken briefly every other day for 14 days. Subsequently, the solution was centrifuged, and its pH determined. The phosphate concentration in solution was measured using the manual malachite green method or the molybdenum blue method. To compare adsorption on quartz sand coated with goethite with adsorption on goethite the calculated surface area of the goethite coating of the quartz sand was used, i.e. 0.19 m2 g"1 sand.
47

CHAPTER 3
Table 2. Symbols used
Symbol
a
b
c, c. ct D0
ƒ ƒ
' * K
L m
n,h
r
r0
r\
K * l
f
v0
*1
"goethite
*£max
Y
e p
Definition
root hair surface area per unit volume
buffering concentration of dissolved P
concentration of sorbed P
total concentration of P
diffusion coefficient of P in water
tortuosity factor
influx
influx by root hairs
parameter in LF isotherm
root hair length
exponent in LF isotherm root hair density
distance in radial direction
root radius
outer boundary of soil volume
root hair radius
half-distance between centres of root hairs
time
water flux at the root surface
water flux at the outer boundary
P adsorption on goethite
P adsorption maximum on goethite
content of reactive surface area volumetric moisture content dry bulk density
Unit
m2 m"3 sand
m3 solution m'3 sand mol m"3 solution
mol m"3 sand
mol m"3 sand
m2 h"1
-mol m"2 h"1
mol m"2 h"1
m3 mol"' m
-m"' m
m
m
m
m
h ~,3 „-2 u-1 m m h m3 m2 h"1
mol m"2
mol m"2
m2 kg"' sand m3 solution m"3 sand
kg m"3 sand
48

PLANT-AVAILABILITY OF PHOSPHATE ADSORBED ON GOETHITE
Model description
The model used to simulate uptake is based on that of Hoffland et al. (1990). Table 2 is provided to identify the symbols. The model consists of a numerical solution of diffusion and mass flow in cylindrical coordinates extended with a sink term for zero sink uptake by root hairs (Bhat et al., 1976).
aC. i P) aC, / 1 N b "5T = 7^ ( r Z )° e / -5r+ v° r°C ' ) " La'
The root and root hairs are supposed to behave as a zero sink, which implies that the solution concentration at the root and root hair surface equals zero. The influx at the root surface is computed from
I = - D 0 9 / ^ + v 0 C , . (2) or
Inter-root competition is accounted for by assigning a cylindrical soil volume to each root and assuming that only water, but no phosphate, is transported across the outer boundary of this soil volume (Cushman, 1979). With increasing root density, the radius of the soil volume assigned to each root decreases. Consequently, the concentration gradients in the soil volumes surrounding the roots are truncated. Newly grown roots sample the soil with the largest phosphate concentration in the total soil volume (Hoffland et al., 1990).
Buffering is calculated as (Nye, 1966b)
* ^ - e ^ (3) dC, dC,
in which dCs /dC, is the slope of the phosphate adsorption isotherm, which is concentration dependent.
The zero sink influx into root hairs is computed from (De Willigen & Van Noordwijk, 1987; 1994b)
(/?2-l)C, ZXGf , rh ~ TGT0
l r ° < r S r ° + ' *
49
CHAPTER 3
with
n__ 1 l - 3 * ^ * « b * ( 5 )
2 4 /?2-l
and R = /I/AQ.
The half-distance between the centres of two root hairs (A,) is approximated with
*. = v ^ - (6)
In Equation (4) the influence of mass flow on uptake by root hairs is neglected. In the numerical solution of Equation (1), the cylindrical soil volume
surrounding each root is divided into a number of concentric layers, which become increasingly thicker with larger distance to the root. The semi-discretised equations are solved using Eulers' method with a variable time step.
Results
Uptake experiment
The phosphorus uptake by the plants was affected by the phosphate loading of goethite and the goethite content of the substrate (Fig. 1 A). The different treatments are explained in Table 1. The plants of treatment H, growing on a substrate with a large amount of phosphate adsorbed per g sand and with a large initial phosphate concentration in solution, took up most phosphate. Phosphorus uptake for the YM treatment was about twice as great as uptake for the L treatment, although the amount of phosphate per pot in both treatments was about the same. The plants of all treatments showed signs of phosphorus deficiency, and the phosphorus concentration in plant tissue became very small (Fig. IB). The time course of the average pH of the 'soil' solution is depicted in Fig. 1C and the change in root length in time in Fig. ID.
Root and root hair properties were the same for all treatments and are listed in Table 3. Water uptake rates decreased from 18 mm3 m"1 root h~' at day 1 to 9.6 mm3
m"1 root h"1 at day 29 for treatment H, 6.7 for treatment V2H and 4.6 for treatment L.
50

PLANT-AVAILABILITY OF PHOSPHATE ADSORBED ON GOETHITE
140
120
"% 100
A
- • - -
..*... • • • • • • •
-
— • *
H
1/2 H
L
/
h" / /
/ /
/
' . ' . ' • • • • " ' "
A-. . . . * • • -
-
—
I \
-L
• *
5 10 15 20 25 Time (days after emergence)
o E
-ä
\
S 40 O.
B
'•vN
W
5 10 15 20 25 Time (days after emergence)
7.0
6.5
6.0
5.5
4.5
4.0
3.5
3.0
250
c' *--H
5 10 15 20 25 Time (days after emergence)
o o cc
5 10 15 20 25 Time (days after emergence)
D "
-
•
ß- ^
/ A' ...ï / A-
/
("==> ' • i » _
, . < - • '
,
......f'
_ j I _ _ _ I — i —
Fig. 1. Results of the experiment with maize plants grown on quartz sand coated with goethite on which phosphate was adsorbed, for treatments H, V2H and L as a function of time. (A) phosphorus uptake per plant, (B) phosphorus concentration in plant dry matter, (C) average pH of the 'soil' solution and (D) root length of plants. The bars indicate the standard errors. Open symbols represent estimated data for harvest 3.
Table 3. Root and root hair properties of maize plants grown on quartz sand coated with
goethite on which phosphate was adsorbed.
root radius root hair length root hair radius root hair density
0.15 mm 0.32 mm 5 urn 50 mm'1
51

CHAPTER 3
Adsorption experiments
The phosphate adsorption isotherm of goethite in nutrient solution is presented
as a log-log plot (Fig. 2). The pH for these measurements ranged from 5.3 to 5.9.
Phosphate adsorption on goethite for phosphate solution concentrations exceeding 10"6
M was determined at a pH of 5.3 to 5.4, for solution concentrations less than 3-10"8
M at a pH of 5.6 to 5.9 and for intermediate solution concentrations at a pH of 5.4 to
5.5. Also, phosphate adsorption on goethite at pH 4, 5, 5.5 and 6 for different
phosphate additions is depicted (Fig. 2). These data show that the phosphate
concentration in solution at each phosphate addition was greater at pH 4 than at pH 5.5.
The adsorption of phosphate on quartz sand coated with goethite per unit reactive
surface area, determined at solution concentrations above 0.5 uM and at a pH of 5.1,
corresponded well with the adsorption of phosphate on pure goethite (Fig. 2). The
adsorption of phosphate was non-linearly related to the phosphate concentration in
solution over the wide range of phosphate concentrations examined.
3.0
2.5
2.0
O 1.5
,9 10
0.5
- goethite, pH 5.3-5.9 D
" goethite, pH dependence pH:4.0 5.0 5.5 6.0
* • • A goethite-coated sand, pH
O " LF isotherm
pH5.5
P H 4 A > : sr a/
o /
5.1
. . i
a • • ' *
cf°
o
a
i
10"! 10"° 10-' 10"° P concentration (M)
10"; 10-
Fig. 2. Phosphate adsorption determined in the presence of nutrient solution, on goethite at
pH 5.3 to 5.9, on goethite at pH 4, 5, 5.5 and 6, and on quartz sand coated with goethite
at pH 5.1. The dashed line represents the Langmuir-Freundlich (LF) isotherm used to
describe phosphate adsorption on goethite in nutrient solution at pH 5.5. The dotted line
shows the LF equation used to approximate phosphate adsorption at pH 4.
52
PLANT-AVAILABILITY OF PHOSPHATE ADSORBED ON GOETHITE
The slope of the phosphate adsorption isotherm at pH 5.5 in the log-log plot ranged from 0.05 at a solution concentration of 10"5 M to 0.33 at a solution concentration of 10"8 M. This means that the data cannot be described with a Freundlich isotherm, since this isotherm has a constant slope in a log-log plot. With a Langmuir-Freundlich (LF) isotherm, given by Equation (7), a satisfactory description of the measured adsorption isotherm was obtained.
e „ - e {KC,r m ^goethite "* \+(KC)m
The parameter values were chosen by trial-and-error fitting to describe the adsorption of phosphate on goethite in nutrient solution at pH 5.5. The deviation of the LF isotherm from the data was caused, at least partly, by deviations in the pH from 5.5 at large and small phosphate solution concentration. The parameter values used were ßmax=2.5 jimol m"2, £=7.5-103 m3 mol"1 and m=0.44 (Fig. 2, dashed line).
Model calculations
In the model the plant parameters derived from the pot experiment were used. The experimentally determined phosphate adsorption isotherm of the substrate in nutrient solution at pH 5.5 (Fig. 2, dashed line) was used to compute buffering from Equation (3) with
CS = ÔgoethiteYP' <8>
in which ôgoethite depends on the concentration in solution (C,) according to Equation (7).
The effective phosphate adsorption isotherms of the quartz sand coated with goethite at pH 5.5 in the different treatments, presented as Cs (expressed in mol m"3
sand) versus C,, are depicted in Fig. 3. The slope of the adsorption isotherm for the ViK treatment was half that for the H and L treatments, because the amount of reactive surface area per kg sand (y) was halved. Consequently, at equal phosphate concentration in solution, buffering for the Vûi treatment was about half that for the H treatment.
53

CHAPTER 3
0.7
^0 .6
§0.5
'E ö0.4 e. "O 0.3
8 0.2 CO
°-o.i
calculated isotherm H, L 1/2 H
initial situation
" H 1/2 H L •
-..--"'
• •
'
,..»-
10 ' 10 10 10 P concentration (M)
10' 10
Fig. 3. Effective phosphate adsorption isotherms at pH 5.5, calculated using Equations (7) and (8), for treatment H and L at a high level of reactive surface area in the substrate and for treatment ViW at a low level of reactive surface area in the substrate. The initial concentrations of adsorbed phosphate and phosphate in solution in the different treatments of the uptake experiment are indicated with symbols.
The agreement between observed and predicted phosphorus uptake by the
plants was close for treatments H and ViH. However, uptake was strongly
underestimated for treatment L (Fig. 4). The predicted average concentration of
phosphate in solution and the measured phosphate concentration in the 'soil' solution
are presented in Fig. 5. The predicted desorption of phosphate upon uptake by the
oldest root is presented in Fig. 6. Calculations were made for the first discretization
step (a distance of 14 nm to the root) and for the final half-distance between roots. At
the final half-distance between roots in treatment L modelled phosphate desorption was
negligible.
54
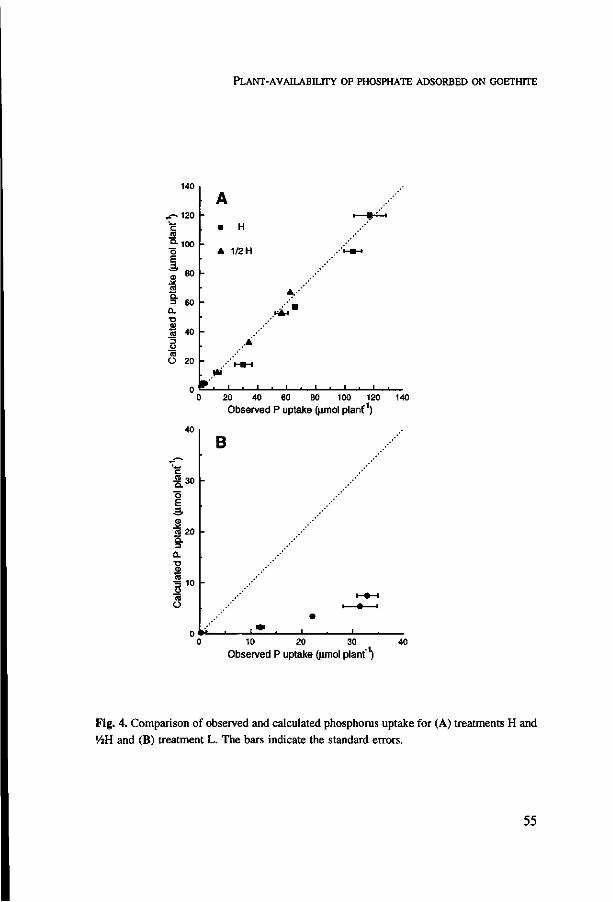
PLANT-AVAILABILITY OF PHOSPHATE ADSORBED ON GOETHITE
14U
~120 c a °-100 o E •ä- „„ o> 8 0
.* a a. 3 60 Q. T> <B a 40 =3 O 0) O 20
n
A •
A
. * i '
H
1/2 H
.Ä
M M
1
A.-'
> '
1 . 1
_ .**
•'•—•—•
I . I .
20 40 60 80 100 120 Observed P uptake (urnol planf1)
140
40
,-,
f 30
o E
a 20 Q. 3 0-
S a S 10
O
n
B
-
-
.
ti 1 • • . •
,
i » I
, 10 20 30 40
Observed P uptake (urnol plant" )
Fig. 4. Comparison of observed and calculated phosphorus uptake for (A) treatments H and Viï\ and (B) treatment L. The bars indicate the standard errors.
55
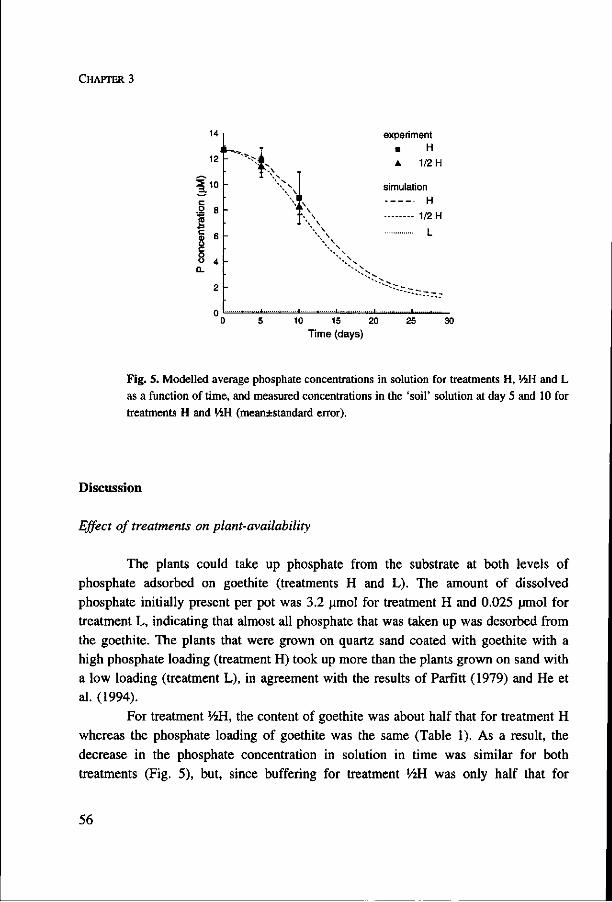
CHAPTER 3
14
12
I 1 0 c .2 8
I 0) D O c o o 4
Q.
2 0
i experiment
• H
A 1/2 H
simulation
H
1/2 H
L
• • l . i n . i i n l - - i r n l , i
10 15 20 25 Time (days)
30
Fig. 5. Modelled average phosphate concentrations in solution for treatments H, '/iH and L
as a function of time, and measured concentrations in the 'soil' solution at day 5 and 10 for
treatments H and ViU (mean±standard error).
Discussion
Effect of treatments on plant-availability
The plants could take up phosphate from the substrate at both levels of
phosphate adsorbed on goethite (treatments H and L). The amount of dissolved
phosphate initially present per pot was 3.2 umol for treatment H and 0.025 umol for
treatment L, indicating that almost all phosphate that was taken up was desorbed from
the goethite. The plants that were grown on quartz sand coated with goethite with a
high phosphate loading (treatment H) took up more than the plants grown on sand with
a low loading (treatment L), in agreement with the results of Parfitt (1979) and He et
al. (1994).
For treatment ViH, the content of goethite was about half that for treatment H
whereas the phosphate loading of goethite was the same (Table 1). As a result, the
decrease in the phosphate concentration in solution in time was similar for both
treatments (Fig. 5), but, since buffering for treatment ViH was only half that for
56

PLANT-AVAILABILITY OF PHOSPHATE ADSORBED ON GOETHITE
treatment H (Fig. 3), the desorption of phosphate in time and consequently the phosphorus uptake by the plants for treatment ViH was only half that for treatment H (Fig. 1A).
The initial concentration of adsorbed phosphate in the sand (Cs) for treatments V2H and L was similar, but for treatment L the phosphate concentration in solution was less and buffering was greater than for treatment V2H (Fig. 3, Table 1). The plants of treatment L took up more phosphate than did plants of treatment V2H (Fig. 1A), indicating that the negative effect of the smaller phosphate concentration in solution on uptake was larger than the positive effect of increased buffering.
Model assumptions
In the model roots were assumed to behave as a zero sink, which implies that no maximum influx rate was defined. This assumption seems justified since the growth of the plants was limited by phosphorus-deficiency (Fig. IB), resulting in small phosphate concentrations in the plant tissue and a strong affinity of the influx mechanism (Jungk et al., 1990). Furthermore, for phosphate concentrations in solution within the growth response range, phosphate uptake is limited by the transport to the root rather than the uptake capacity of the root (Nye, 1977). Model calculations showed that computed phosphate influx was much slower than the potential influx restricted by Michaelis-Menten parameters only.
A second assumption that was made concerning the zero sink behaviour of roots is the omission of a threshold concentration for influx. For maize, a threshold concentation of 10"8 M was reported (Jungk et al., 1990). Model calculations indicated that the phosphate concentration in solution near the root decreased to 10"8 M for treatments H and V2H, and to 3-10"9 M for treatment L, suggesting that the threshold concentration cannot be neglected. However, when the threshold concentration was incorporated in the model computed uptake decreased only with 0.5% for treatments H and V6H and 5% for treatment L. These effects are relatively small because phosphate in solution was strongly buffered.
Furthermore, it was assumed that the sorption of phosphate on quartz sand coated with goethite is reversible and that equilibrium between sorbed and dissolved phosphate is attained within each time step. The adsorption of phosphate on goethite has been shown to be reversible, but both sorption and desorption were slow (Madrid & Posner, 1979). This has been attributed to the adsorption on less accessible sites
57

CHAPTER 3
because of pores and crystal defects (Willet et al., 1988; Torrent et al., 1990, 1992;
Strauss et al., 1997). The sorption of phosphate on quartz sand coated with goethite was
slow; only after two weeks adsorption equilibrium was reached. This may have been
due to the diffusion of phosphate into the pores between the goethite needles and the
quartz surface (cf. Fig. 4 of Scheidegger et al., 1993). Slow sorption on the goethite
surface is assumed to be of minor importance since a crystalline, non-porous goethite
was used (Hiemstra et al., 1989b).
The results from modelled phosphate desorption close to the root show that,
after an initial fast stage, desorption rates were small (Fig. 6). For treatment H 0.95
umol m"2 P was desorbed during the first day, corresponding to 44% of initially sorbed
phosphate. This quantity is comparable to the isotopically exchangeable phosphate from
goethites with different crystal morphologies, having a similar initial equilibrium
concentration as the H treatment (Torrent et al., 1992). The slow desorption after a few
days is due to the increasing adsorption energy with decreasing phosphate loading,
which results in a small phosphate concentration in solution and thus a small
concentration gradient towards the root. The desorption of phosphate at the half-
1.6
1.4
%. 1.2
g 1.0 a. TJ 0.8 CD
€ O 0.6 0)
<u ? 0 . 4
0.2
0.0
I . - -I-' .. I' /
close to the root
. - - H
L 1/2 H
in between roots
H
1/2 H
10 15 20 Time (days)
25 30
Fig. 6. Modelled phosphate desorption from goethite as a function of time. Calculations were made for the oldest root at a distance of 14 nm to the root and at the final half-distance between roots, which was 1.3 mm for treatment H, 1.5 mm for ViH and 1.7 mm for L. For treatment L phosphate desorption at the half-distance between roots was negligible.
58
PLANT-AVAILABILITY OF PHOSPHATE ADSORBED ON GOETHITE
distance between roots was much less than close to the root and proceeded much more gradually, which is caused by the slow diffusion of phosphate to the root. The average depletion of phosphate, computed from observed uptake, was only little greater than the depletion computed at the half-distance between roots. This indicates that the volume of soil that is strongly depleted is only very small, although the rooting was dense in all treatments. These results show that the phosphate desorption rates were generally small, which was related to the phosphorus-deficient growth conditions. This may explain why uptake, at least for treatments H and ViH, can be modelled successfully assuming that adsorption and desorption are in equilibrium and that the roots behave as zero sinks for uptake (Fig. 4A).
For treatment L in which the plants were growing under severe phosphorus-deficiency, uptake was strongly underestimated. Perhaps the plants had strategies to increase their uptake of phosphate when little was available, and our model did not account for it. For example, there might be an increase in the maximum influx rate (Jungk et al., 1990), the formation of more or longer root hairs (Föhse & Jungk, 1983), or the exudation of organic acids to mobilize sorbed phosphate (Marschner et al., 1986). However, these factors cannot explain the underestimation of uptake since maximum influx was not restricted by the model, the observed density and length of root hairs were the same as in the other treatments, and organic acid exudation by maize roots is quantitatively unimportant (Petersen & Böttger, 1991).
An apparent difference between the treatments was the change in the pH of the 'soil' solution concentration during the experiment. For treatments H and ViH this change was transient, but for treatment L a decrease of the average pH in the 'soil' solution from 5.5 to 4.2 was observed (Fig. 1C), and it seems likely that the pH change at the root surface was even larger. A decrease of pH in this pH range resulted in an increase of the phosphate concentration in solution, especially at low phosphate loading (Fig. 2), and this may explain the increased uptake in treatment L. In a first approach to test the magnitude of this effect, the data for phosphate adsorption on goethite in nutrient solution determined at pH 4 are used to compute buffering in the model. Using a LF equation with ßmax=2.3 umol m"2, ^=2.1*103 m3 mol"1 and m=0.7 to describe phosphate adsorption at pH 4 (Fig. 2, dotted line), predicted uptake for the L treatment amounts to 70% of observed uptake. Although this is a very rough calculation, it suggests that the effect of a change in pH on uptake is large enough to explain the difference between observed and modelled uptake, with buffering determined at the initial pH of 5.5, in the L treatment.
59
CHAPTER 3
Phosphate adsorption in nutrient solution at low pH
The observed decrease in the adsorption of phosphate on goethite in nutrient solution with a lowering of the pH from 5.5 to 4 (Fig. 2) contrasts with the pH dependence of phosphate adsorption in an indifferent electrolyte solution. In the latter case, the adsorption of phosphate on goethite increases with a lowering of pH because of an increase in the electrostatic potential in the plane of adsorption (Bowden et al., 1980; Hiemstra & Van Riemsdijk, 1996). When phosphate adsorption on our goethite was determined in an indifferent electrolyte solution, an increase in adsorption with decreasing pH was found indeed (Geelhoed et al., 1997a). This indicates that the reversed pH dependence was caused by the presence of the nutrient solution, of which calcium, magnesium and sulphate are most likely to influence the adsorption of phosphate. Divalent cations have been shown to enhance the adsorption of phosphate at pH values above pH 5 (Bolland et al., 1977; Hawke et al., 1989), whereas the presence of sulphate decreased the adsorption of phosphate at low pH (Parfitt, 1982; Geelhoed et al., 1997a). This suggests that the decrease in phosphate adsorption with a lowering of pH from 5.5 to 4 may be caused by competition between sulphate and phosphate for the goethite surface.
Conclusions
The availability to plants of phosphate adsorbed on the surface of goethite can be assessed using reversible non-linear adsorption behaviour in combination with an uptake model in which root growth is accounted for. The effect of a varying area of reactive surface in the substrate on the availability of sorbed phosphate for plant uptake is also well predicted. The underestimation of uptake for the treatment with low phosphate loading is attributed to the decrease in the pH of the 'soil' solution during the experiment. The change in the adsorption of phosphate on goethite in nutrient solution associated with this pH decrease resulted in a larger phosphate concentration in solution and, consequently, in greater phosphorus uptake.
Acknowledgements
We thank Dr B.J.M. Verduin of the Department of Virology, Wageningen Agricultural University (WAU), for the use of the isotope laboratory, Mr A.J. Korteweg
60

PLANT-AVAILABILITY OF PHOSPHATE ADSORBED ON GOETHITE
of the Department of Physical and Colloid Chemistry (WAU) for measuring the BET surface area, and Dr N.J. Barrow, CSIRO Land and Water, Australia, for helpful comments on our script.
61

Phosphate and sulphate adsorption on goethite:
single anion and competitive adsorption

Jeanine S. Geelhoed, Tjisse Hiemstra and Willem H. Van Riemsdijk
Geochimica et Cosmochimica Acta 61, 2389-2396 (1997)
Phosphate and sulphate adsorption on goethite: single anion and
competitive adsorption
The adsorption of phosphate and sulphate on goethite is studied individually and in combination at solution concentrations of phosphate ranging from 10"8 to 10"4 M and of sulphate ranging from 10'5 to 10"3 M. For single anion adsorption the influence of pH, ionic strength and anion:goethite ratio was determined. The anion adsorption data were described well with a model in which surface complexation and electrostatic interaction is taken into account. In systems with both anions, the influence of phosphate on sulphate adsorption was much stronger than vice versa, which reflects the higher affinity of phosphate for the goethite surface. In spite of the rather small competitive effect of sulphate on phosphate adsorption expressed per unit surface area of goethite, a considerable increase in the solution concentration of phosphate was observed at relatively low pH in the presence of sulphate. The relative increase in the phosphate solution concentration was larger at a higher ratio of total concentrations of sulphate and phosphate in the system and when lowering the pH. The data indicate that the competitive interaction of phosphate and sulphate for adsorption may have an important effect on the bioavailability of these anions. The competitive adsorption data were predicted well using model parameters derived for single anion adsorption.
Introduction
The adsorption of phosphate and sulphate by metal (hydr)oxides in soils and
sediments of aquatic systems influences the bioavailability of these anions (Barrow,
1969; Gebhardt and Coleman, 1974; Mc Callister and Logan, 1978; Solis and
Torrent, 1989b; Soltan et al., 1993; Filippelli and Delaney, 1996). The
bioavailability of anions may also be affected by the interaction between anions for
adsorption on metal (hydr)oxides. In general, the extent of this interaction depends
on the affinity of the anions for the surface, the relative concentration of the anions,
the change in the surface potential upon adsorption and the pH. Anions with a high
affinity for metal (hydr)oxides, like phosphate, decrease the adsorption of inorganic
anions with an equal or lower affinity, such as arsenate, selenite, molybdate, selenate
and sulphate, over a wide range of pH (Hingston et al., 1971; Parfitt, 1982; Ryden
et al., 1987; Manning and Goldberg, 1996). This was also the case when only
relatively small amounts of phosphate were present (Hingston et al., 1971).
Experiments in which the effect of sulphate on the adsorption of inorganic
anions was studied, were usually performed at relatively high total concentrations of
65

CHAPTER 4
sulphate. At total sulphate concentrations of 10 to 3000 times that of the competing
anion, the adsorption of selenate (Benjamin et al., 1982), Chromate (Zachara et al.,
1987), arsenate (Xu et al., 1988) and phosphate (Hawke et al., 1989; Yao and
Millero, 1996) was reduced, but the effects were small with respect to the ratio of
total concentrations of the anions. The results also showed that the competitive
effect of sulphate on anion adsorption was larger at lower pH.
Only a limited amount of data concerning competition of sulphate and
phosphate for adsorption on metal (hydr)oxides is present in literature. The
adsorption of phosphate on goethite and on manganese dioxide at low pH was lower
when sulphate was present at the high concentration observed in seawater, than in
the absence of sulphate (Hawke et al., 1989; Yao and Millero, 1996). When
phosphate and sulphate were added in equal total concentrations to goethite the
adsorption of sulphate was largely decreased, whereas the effect of sulphate on the
amount of adsorbed phosphate was small. Nevertheless, the P solution concentration
at low pH was markedly increased in the presence of sulphate, indicating that
competitive adsorption of sulphate with phosphate may result in an increased
availability of phosphate (Parfitt, 1982).
The interaction of anions for adsorption may be caused by direct
competition for sorption sites and the influence of anion adsorption on the surface
charge of the metal (hydr)oxide. These factors are taken into account in the CD-
MUSIC model, in which an electrostatic model and a surface complexation model
are combined (Hiemstra and Van Riemsdijk, 1996), that will be used to describe
phosphate and sulphate adsorption. The choice of the adsorption complexes is based
on detailed molecular information of adsorption complexes from spectroscopic
techniques. For modelling P adsorption on goethite, the adsorption complexes
proposed by Tejedor-Tejedor and Anderson (1990) based on in situ cylindrical
internal reflection - Fourier transformed infrared spectroscopy data were used
(Hiemstra and Van Riemsdijk, 1996).
The adsorption mechanism of sulphate has since long been a subject of
discussion. Infra red (IR) spectroscopy data of dried samples of goethite with
adsorbed sulphate have shown that sulphate forms bidentate inner sphere complexes
(Parfitt and Smart, 1977, 1978). On the other hand, the influence of the ionic
strength on sulphate adsorption is rather strong and this has been interpreted as an
indication for outer sphere adsorption (Charlet et al., 1993). Other indications for
outer sphere adsorption are the low intrinsic energy of sulphate adsorption on
66

P H O S P H A T E A N D S U L P H A T E S O R P T I O N O N G O E T H I T E
goethite (Hansmann and Anderson, 1985) and the observation that sulphate adsorption has no influence on the weathering rate of aluminum oxide surfaces (Charlet et al., 1993). Moreover, in situ extended x-ray absorption fine structure spectroscopy (EXAFS) measurements of adsorbed selenate, which exhibits the same type of adsorption behaviour as sulphate (Davis and Leckie, 1980; Balistrieri and Chao, 1987), also suggested the formation of outer sphere complexes. These EXAFS measurements were carried out at low selenate loading of goethite and pH 3.5, however, the ionic strength was not reported (Hayes et al., 1987). In contrast, in situ EXAFS measurements of selenate adsorption on hydrous ferric oxide and goethite by Manceau and Charlet (1994) have indicated that selenate is adsorbed as a bidentate inner sphere complex with singly coordinated surface groups and, to a lesser extent, as an edge-sharing bidentate complex. These experiments were also carried out at low selenate loading and low pH (pH 2.7 and 3.5), at a known ionic strength of 0.1 M NaN03.
Most measurements of P adsorption have been carried out at rather high P solution concentrations, in the range of 10"4 to 10~3 M (e.g. Barrow et al., 1980; Bowden et al., 1980). In this study, data are presented of phosphate adsorption on goethite at a wide range of P concentration in solution (10"8 to 10"4 M). Sulphate adsorption is determined at solution concentrations ranging from 10"5 to 10"3 M. The concentration ranges of phosphate and sulphate that are studied are relevant for a wide range in environmental conditions. Goethite is used because it is an important metal (hydr)oxide in soils and sediments.
The influence of pH, ionic strength and anion:goethite ratio on phosphate and sulphate adsorption was studied. From these data, model parameters were obtained for the description of the adsorption of sulphate and phosphate on goethite. In systems with both anions, the influence of pH and the ratio of total sulphate and phosphate concentrations on the competitive adsorption of sulphate and phosphate was studied. Competitive adsorption was predicted with the CD-MUSIC model using the model parameters derived from the single anion adsorption experiments.
Materials and methods
Preparation of goethite
Two goethite batches were prepared by titrating 5 1 of 0.5 M Fe(N03)3-9
67
CHAPTER 4
H20 with 2.5 M NaOH, at a rate of 9 ml min"1, to pH 12. The suspension was aged for 4 days at 60°C and subsequently dialyzed with distilled demineralized (DD) water (Hiemstra et al., 1989b). The BET specific surface area was 96.4 m2 g"1 for goethite I and 105 m2 g ' for goethite II. The pristine point of zero charge (PPZC) was 9.2 for goethite I and 9.5 for goethite II. The PPZC was determined from the common intersection point of surface charge vs. pH relations at three ionic strengths (Venema et al., 1996). Goethite I was used in all experiments, except those to determine the sulphate adsorption isotherms, which were carried out with goethite II.
Adsorption experiments
Anion adsorption was calculated from the difference in total anion and equilibrium solution anion concentrations in batch experiments. The amounts of phosphate solution (KH2P04), sulphate solution (K2S04) and goethite suspension that were added, and the total volume per batch experiment were determined by weighing. All solutions were prepared from DD water and stored in plastic bottles to avoid contamination with silica.
Sulphate adsorption isotherms were determined by adding appropriate small volumes of 0.1 M K2S04 to goethite (II) suspensions (4 to 16 g/1) in 0.1 M NaN03, having pH values of 3.0, 3.3, 3.8, 4.3 or 5.0. After being left overnight the pH of the samples was readjusted. Subsequently, the samples were shaken for 2 hours, followed by a second pH adjustment before centrifugation at 22000 g. Total S was measured using ICP. The adsorption was reversible when samples were brought to a pH of 12.
Phosphate and sulphate adsorption edges were determined at a pH ranging from 2.5 to 10. After addition of one of the anions, or of both anions simultaneously in competitive adsorption experiments, suspensions were shaken in an end-over-end shaker for 20 h. When the influence of the order of anion addition on competitive adsorption was studied, one anion was added 24 h after the other, after which the suspensions were shaken for another 20 h. Subsequently the anion solution concentration and the pH was determined.
Phosphate adsorption in 0.01 M KN03 was determined for 5 total P:goethite ratios. For 3 of these systems P adsorption was also determined in 0.5 M KN03. In the experiments with the lowest three total P concentrations, 2.6 to 160 kBq of carrier free 32P was added, resulting in a ratio of 31P:32p larger than 6.8-105. After
68
P H O S P H A T E A N D S U L P H A T E S O R P T I O N O N G O E T H I T E
shaking, part of the suspension was centrifugea for 10 min at 15000 g after which the supernatant was centrifugea for another 10 min. The 32P concentration in the second supernatant was determined by Cerenkov counting. The samples, with an aimed activity of 200 disintegrations per min or higher, were counted for 10 min. Since disintegration occurs randomly and hence has a Poisson distribution, the standard error of activity measurements is 1/VN, where N is the total number of disintegrations counted. For an aimed N larger than 2000 the standard error is maximum 2.2%. For one in every 5 suspensions, 2 separate samples were centrifuged and 32P in the supernatant was determined. The median of the standard error of these duplicates, which included the error for disintegration, was 2.1%. The P solution concentration was computed using the 31P:32p ratio corrected for disintegration. For the other experiments, samples were centrifuged at 22000 g and the P solution concentration was determined spectrophotometrically using the manual malachite green method (for concentrations up to 9 uM) (Novozamsky et al., 1993) or the molybdenum blue method.
Sulphate adsorption edges in 0.01 M KN03 were determined for a total sulphate concentration of 1.0-10"4 M at a goethite suspension density of 0.5 g l"1
and for 1.0-10"3 M total sulphate at 4.0 g goethite 1'. For the latter system, sulphate adsorption experiments were also carried out in 0.5 M KN03. After shaking, part of the suspension was centrifuged at 22000 g. Total S in the supernatant was determined using ICP.
Competitive adsorption was studied in a background solution of 0.01 M KNOj. Phosphate adsorption in the presence of 1.0-10"4 M total sulphate was determined at 3 total P:goethite ratios. For one ratio, P adsorption was also determined in the presence of 1.0-10"3 M. For the lowest two total P concentrations, 1.1 to 45 kBq carrier free 32P was added resulting in a ratio of 31P:32P higher than 2.9-lO6. Sulphate adsorption was determined for a total sulphate concentration of 1.0-10"4 M at a goethite suspension density of 0.5 g l"1 in the presence of 7.9-10"5
and 1.0-10"4 M P. The influence of the order of addition of the two anion solutions on adsorption was studied for total P concentrations of 2.2-10"5 and 1.0-10"4 M with a total sulphate concentration of 1.0-10"4 M.
Modelling anion adsorption
The CD-MUSIC model of Hiemstra and Van Riemsdijk (1996), in which an
69
CHAPTER 4
electrostatic model and a surface complexation model are combined, was used to describe anion adsorption. A description of the most important characteristics is given.
The site density of the reactive surface groups is derived from the crystal structure of goethite. The O, OH or OH2 surface groups may be coordinated to one, two or three Fe atoms in the goethite crystal. Depending on the number of these Fe atoms (n), the surface groups are denoted singly (n=l), doubly (n=2) or triply (n=3) coordinated surface groups. The doubly coordinated surface groups are considered to be inert in the normal pH range (Hiemstra et al., 1989a) and it has been reasoned that only one third of the triply coordinated surface groups is reactive for protons (Hiemstra and Van Riemsdijk, 1996). For goethite, the overall site density of the singly coordinated surface groups is 3.45 sites nm"2 and of the reactive triply coordinated surface groups 2.7 sites nm"2.
The protonation of the singly and triply coordinated surface groups of goethite is described by one-pK reactions (Table 1, Equation [1]). The log KHs of both reactive groups are unknown, but assumed to be comparable and are therefore set equal to the PPZC of goethite (Hiemstra and Van Riemsdijk, 1996). The ions of the electrolyte solution are assumed to form ion pairs (Table 1, Equations [2] and [3]). These ions are placed at the head end of the diffuse double layer (DDL) and are regarded as point charges. The log K for ion pair formation is set to -1. In the absence of specifically adsorbing ions, the Stern layer between the surface and the head end of the DDL is charge free (Hiemstra and Van Riemsdijk, 1996).
Specifically adsorbed anions approach the surface more closely than ion pairs, since the anion and the surface share ligands. For the description of inner sphere complexes in the model, an additional plane (1-plane) within the Stern layer is introduced. The charge of the inner sphere complexes is considered to be spatially distributed. Therefore, a fraction ƒ of the charge of the central cation and the charge of the surface oriented ligands is attributed to the 0-plane, whereas the remaining charge of the central cation and the charge of the solution oriented ligands is attributed to the 1-plane (Hiemstra and Van Riemsdijk, 1996).
The capacitances of the two layers are related to the overall Stern layer capacitance according to l/Cl+l/C2=l/C. The three plane approach used in the CD-MUSIC model differs strongly from the triple layer model of Davis et al. (1978) because the position of the ion pairs and the value of C2 is different (Hiemstra and Van Riemsdijk, 1991, 1996). Goethite has a Stern layer capacitance of
70

P H O S P H A T E A N D S U L P H A T E S O R P T I O N O N G O E T H I T E
approximately 0.9 F m"2 and fitting of phosphate adsorption data determined at
different ionic strengths has resulted in a C2 value of 5 F m"2. This capacitance
corresponds with a distance between the 1-plane and the head end of the DDL of a
half to one water molecule (Hiemstra and Van Riemsdijk, 1996).
Phosphate adsorption was modelled using bidentate, protonated bidentate
and monodentate surface complex formation of P with singly coordinated surface
groups (Table 1, Equations [4], [5] and [6]) (Hiemstra and Van Riemsdijk, 1996).
For the description of sulphate adsorption, bidentate complex formation to singly
coordinated surface groups was assumed (Table 1, Equation [7]). Also a description
of sulphate adsorption assuming ion pair formation (outer sphere complexes) or a
combination of bidentate complexation and ion pair formation was made, because
these were the adsorption mechanisms based on IR spectroscopy and EXAFS data
suggested in literature (Parfitt and Smart, 1977, 1978; Hayes et al., 1987; Manceau
and Charlet, 1994).
The model description of the adsorption data was optimized by trial and
error, aided by plots of the experimental and modelled data. First the charging
curves were modelled (C, log KH), then the description of phosphate and sulphate
adsorption in single anion systems was optimized (log Ks, ƒ values) while the
parameters for the charging behaviour were fixed.
Table 1. Reaction equations for protonation of the surface and ion pair formation with singly (FeOH14") and triply (Fe30'/i") coordinated surface groups, and for inner sphere complex formation of phosphate and sulphate with singly coordinated surface groups.
[1] FeOHw+H+ »FeOR,** KH
F e 3 0 ^ + H+ * Fe3OH*it K„
[2] FeOH*- + K+ * FeOH*--K+ KK
Fe30*- + K+ * Fe30*--K+ KK
[3] FeOH2** + N 0 3 - FeOH 2^-N0 3- ATN03
Fe jOH^ + N03- * Fe .OH^-NO, AT,
[4] 2 FeOH* + 2 H+ + P043- * F e A P O / 2 0 + 2 H 2 0
[5] 2 FeOH*- + 3 H+ + PO/" » Fe202POOH<) + 2 H 2 0
[6] FeOH"" + H+ + P043" - FeOP03
(2VW + H 20
[7] 2 FeOH*- + 2 H+ + S042" » Fe 20 2S0 2
( ) + 2 H 2 0
N03
^P2H
71
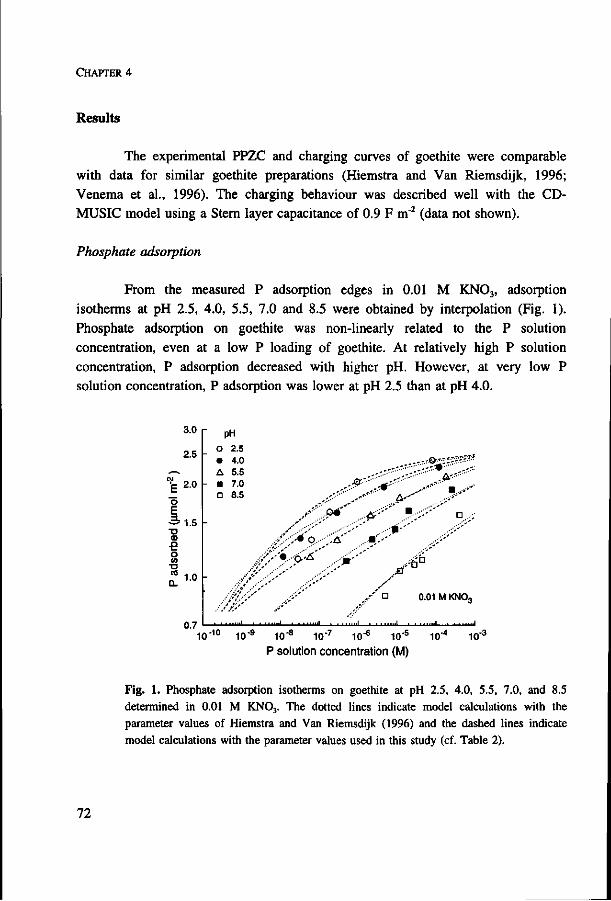
CHAPTER 4
Results
The experimental PPZC and charging curves of goethite were comparable
with data for similar goethite preparations (Hiemstra and Van Riemsdijk, 1996;
Venema et al., 1996). The charging behaviour was described well with the CD-
MUSIC model using a Stern layer capacitance of 0.9 F m"2 (data not shown).
Phosphate adsorption
From the measured P adsorption edges in 0.01 M KN03, adsorption
isotherms at pH 2.5, 4.0, 5.5, 7.0 and 8.5 were obtained by interpolation (Fig. 1).
Phosphate adsorption on goethite was non-linearly related to the P solution
concentration, even at a low P loading of goethite. At relatively high P solution
concentration, P adsorption decreased with higher pH. However, at very low P
solution concentration, P adsorption was lower at pH 2.5 than at pH 4.0.
3.0
2.5
É 2 0
o E 5 1.5 h •a
•e o GO
T3 ™ 1.0 h
0.7
- pH
O 2.5 • 4.0 A 5.5
- • 7.0 n 8.5 -:'•'" , ' """ A - - ' ' ..•.-•'
s'"..9* . .Ä-"' *•-<••' D ,;
• ; v ; > * <?•• . -£ .,-•.--' ..y-y
"'.y' .-••:'--'' ,-0f
, ; Ï - ' ' y' • 0.01 M KNo3
" , J / ' • ' '
10" 10" 10- 10"; 10" 10"c
P solution concentration (M)
Fig. 1. Phosphate adsorption isotherms on goethite at pH 2.5, 4.0, 5.5, 7.0, and 8.5 determined in 0.01 M KN03. The dotted lines indicate model calculations with the parameter values of Hiemstra and Van Riemsdijk (1996) and the dashed lines indicate model calculations with the parameter values used in this study (cf. Table 2).
72
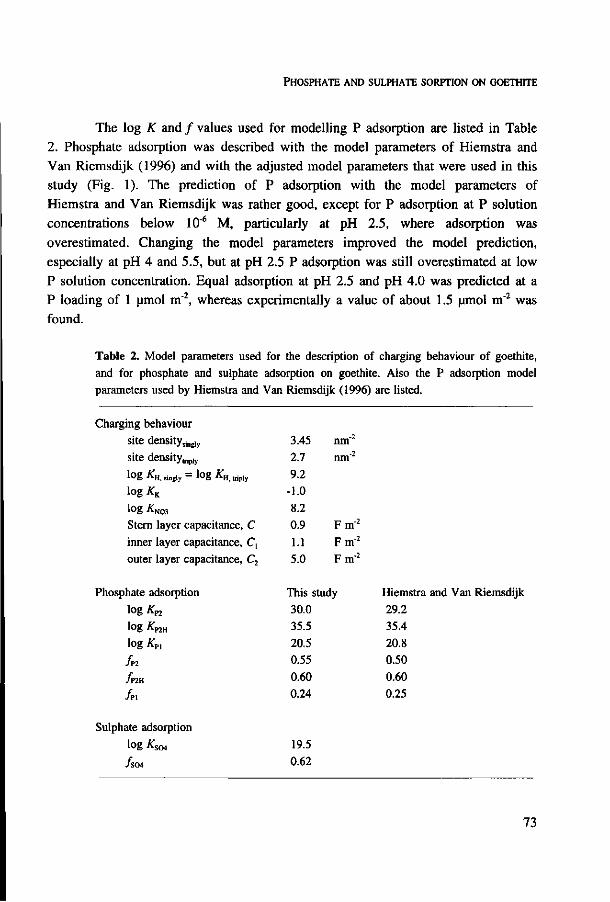
P H O S P H A T E A N D S U L P H A T E S O R P T I O N O N G O E T H I T E
The log K and ƒ values used for modelling P adsorption are listed in Table
2. Phosphate adsorption was described with the model parameters of Hiemstra and
Van Riemsdijk (1996) and with the adjusted model parameters that were used in this
study (Fig. 1). The prediction of P adsorption with the model parameters of
Hiemstra and Van Riemsdijk was rather good, except for P adsorption at P solution
concentrations below 10"6 M, particularly at pH 2.5, where adsorption was
overestimated. Changing the model parameters improved the model prediction,
especially at pH 4 and 5.5, but at pH 2.5 P adsorption was still overestimated at low
P solution concentration. Equal adsorption at pH 2.5 and pH 4.0 was predicted at a
P loading of 1 umol m"2, whereas experimentally a value of about 1.5 umol m"2 was
found.
Table 2. Model parameters used for the description of charging behaviour of goethite, and for phosphate and sulphate adsorption on goethite. Also the P adsorption model parameters used by Hiemstra and Van Riemsdijk (1996) are listed.
Charging behaviour
site density singly
site densitymply
' » g ^H. singly = lOg £ H , triply
lOg^K
log Km}
Stern layer capacitance, C
inner layer capacitance, C,
outer layer capacitance, C2
Phosphate adsorption
log*"«
lOg £p2H
log K?l
JT2
/P2H
/ p i
Sulphate adsorption
log £S04
/S04
3.45
2.7
9.2
-1.0
8.2
0.9
1.1
5.0
This s
30.0 35.5
20.5 0.55
0.60
0.24
19.5 0.62
nm"2
nm2
Fm'2
Fm"2
Fm"2
udy Hiemstra and Van Riemsdijk
29.2 35.4
20.8 0.50
0.60
0.25
73
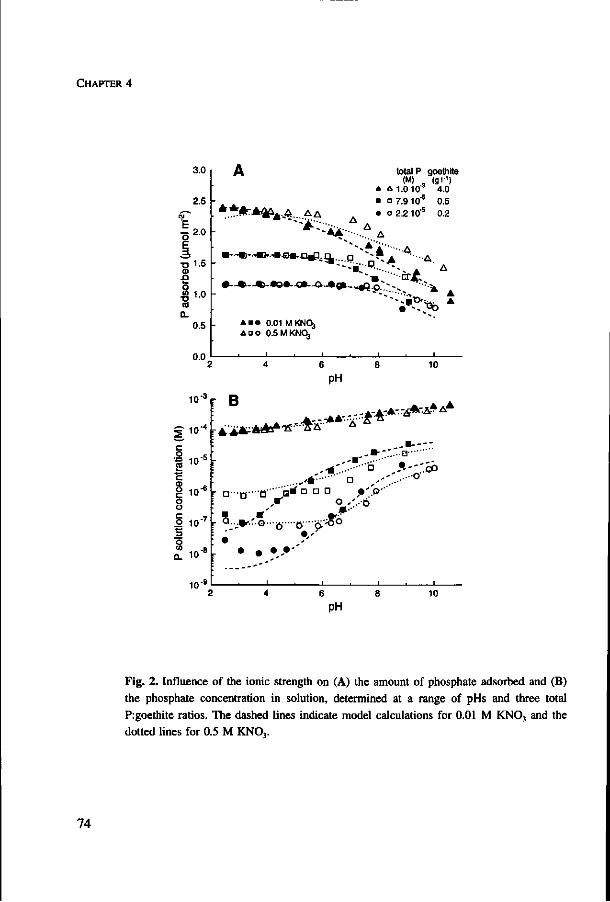
CHAPTER 4
3.0
2.5
ö 2 0
73 1.5 0> JD i— O »1.0 CS
0.5
0.0
A
_ . * * * A ^ A . A A A
•-..•<)» ~«>"».B«. .c l^ j \ .
-A*
*-_•
0~m—m>-»&»-4»~a-Mçï
A B * 0.01 MKNO3 ADO 0.5MKNO3
1 1 .
A
•
• A A '•••.. A
-•^Qo.
1 1
total P goethite (M) , (g l ' )
A1 .0 10"3 4.0 0 7.9 10"5 0.5 0 2.2 10'5 0.2
" - • A
4 ""A A . - ~ A A
• O * V?> A
1
10 pH
10-3
£ 1 0 -
c
Ï 1 0 C
g 10-6
0
C 7
.2 10 7
3 O
CL 1 0 8
• B .AA— - A - 4 ^ - ^ & 4 A A
r n - t r - ö " " n * D D D J»'-°'' X 0 ,'..-ö
: R *' ivf" • ' •
• • , • • ' —-*" "
1 . 1 . 1 . 1
10 pH
Fig. 2. Influence of the ionic strength on (A) the amount of phosphate adsorbed and (B) the phosphate concentration in solution, determined at a range of pHs and three total P:goethite ratios. The dashed lines indicate model calculations for 0.01 M KNO, and the dotted lines for 0.5 M KNO,.
74
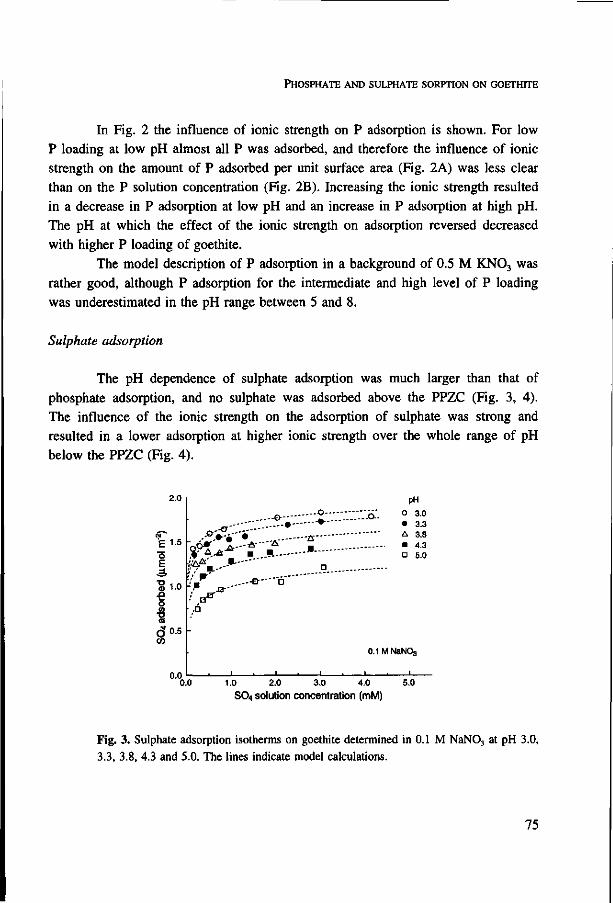
P H O S P H A T E A N D S U L P H A T E S O R P T I O N O N G O E T H I T E
In Fig. 2 the influence of ionic strength on P adsorption is shown. For low P loading at low pH almost all P was adsorbed, and therefore the influence of ionic strength on the amount of P adsorbed per unit surface area (Fig. 2A) was less clear than on the P solution concentration (Fig. 2B). Increasing the ionic strength resulted in a decrease in P adsorption at low pH and an increase in P adsorption at high pH. The pH at which the effect of the ionic strength on adsorption reversed decreased with higher P loading of goethite.
The model description of P adsorption in a background of 0.5 M KN03 was rather good, although P adsorption for the intermediate and high level of P loading was underestimated in the pH range between 5 and 8.
Sulphate adsorption
The pH dependence of sulphate adsorption was much larger than that of phosphate adsorption, and no sulphate was adsorbed above the PPZC (Fig. 3, 4). The influence of the ionic strength on the adsorption of sulphate was strong and resulted in a lower adsorption at higher ionic strength over the whole range of pH below the PPZC (Fig. 4).
2.0
fe i-s h, o E A "g 1.0 .Q w O » 18 <5 0.5 co
pH
....o 0'-v;;:.v.a- ° 3° a :::. • * • 3-3
.-°.»-é"'« A- A 3-8
STA-*"* > . •- * D 5.0 k ^ . . - * - " - ' o
? ...--et—"à""
o.o
0.1 M NaN03
0.0 1.0 2.0 3.0 4.0 S 0 4 solution concentration (mM)
5.0
Fig. 3. Sulphate adsorption isotherms on goethite determined in 0.1 M NaN03 at pH 3.0,
3.3, 3.8, 4.3 and 5.0. The lines indicate model calculations.
75

CHAPTER 4
E ' o E -ä> "O 1
€ o w Ti 6° 05
u
5
0
5
0
\ p
i
total SQi (M)
• 1.0 10'3
• 1.0 10"* o 1.0 10"3
'*
p \ v "9. \ '•..
X «0\ _ • Ï - - -V
goethite KN03
(g l ' ) (M) 4.0 0.01 0.5 0.01 4.0 0.5
ÜCT mm B 1 * 10
pH
Fig. 4. Influence of pH, total sulphate:goethite ratio and ionic strength on sulphate adsorption on goethite. The dashed lines indicate model calculations for 0.01 M KN03
and the dotted line for 0.5 M KNO,.
The pH dependence, salt dependence and the influence of the sulphate
solution concentration on sulphate adsorption was described well with the model,
assuming bidentate complex formation with singly coordinated surface groups with a
log KS0A of 19.5 and a fS04 value of 0.62 (Fig. 3, 4)
Competitive adsorption
The competitive interaction of phosphate and sulphate at equal total
concentrations in the system (1-104 M) is shown in Fig. 5. The influence of
sulphate on phosphate adsorption was small (Fig. 5A), whereas sulphate adsorption
was decreased largely when phosphate was present (Fig. 5B). In the presence of a
lower total concentration of phosphate (7.9-10"5 M) the decrease in sulphate
adsorption was smaller (Fig. 5B, inset).
For P adsorption edges determined in the presence of 1 -10"* M sulphate the
fraction of total phosphate adsorbed on goethite was almost 1, and therefore the
influence of sulphate on P adsorption was evaluated on the basis of the P solution
concentration (Fig. 6A). At relatively low pH the presence of 1-10"4 M sulphate
resulted in an increase of the P solution concentration. The pH below which the P
76
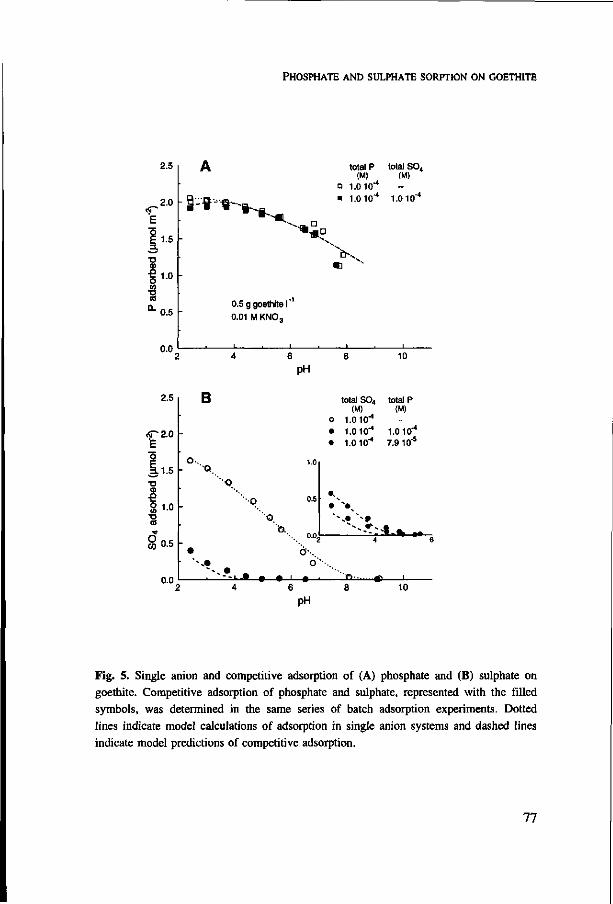
P H O S P H A T E A N D S U L P H A T E S O R P T I O N O N G O E T H I T E
2.5
2.0
E o E 1.5
T3 CD
€ m o co T3 ca
0.5
A
: B = ? " , ~ * * ^
0.5 g goethite I 0.01 M KNO 3
i i
- * ° D m \
total P (M)
o 1.010"4
• 1.010-4
n
i
total S04 (M)
-1.010"4
10
pH
2.5
ÓP2.0 'E o
I l 5 •o O)
•o CO
§ 0.5
( 1 0
B
o-. '0.
_
• '^«
*
•o
'•O
' ' - ! • - • • •—1
1.0
0.5
... °°2 O'-.
O
—•—'
0
• •
total S04 (M)
1.010" 1.0 10"4
1.0 10"4
4
"•" «
total P (M) -
1.0 10"4
7.9 10"5
-t-% .« e
i 1
10
pH
Fig. 5. Single anion and competitive adsorption of (A) phosphate and (B) sulphate on goethite. Competitive adsorption of phosphate and sulphate, represented with the filled symbols, was determined in the same series of batch adsorption experiments. Dotted lines indicate model calculations of adsorption in single anion systems and dashed lines indicate model predictions of competitive adsorption.
77

CHAPTER 4
solution concentration was affected by the presence of sulphate increased with an increasing ratio of total concentrations of sulphate and phosphate in the system. Furthermore, at a higher S04:P ratio, the relative increase in P solution concentration at low pH due to the presence of sulphate was larger (Fig. 6A,B). The P solution concentration at pH 4, in a system with a total P concentration of 2.2 -10"5 M and a goethite suspension density of 0.2 g l"1, was eight times higher in the presence of 1-10"4 M sulphate and thirty times higher in the presence of 1-10"3 M sulphate (Fig. 6B).
For a system with a total concentration of 2.2-10"5 M phosphate and 1.0-10"4 M sulphate, the addition of sulphate 24 h after phosphate resulted in lower phosphate concentrations in solution than vice versa. Simultaneous addition of phosphate and sulphate yielded intermediate P solution concentrations (Fig. 6B). For a total concentration of both phosphate and sulphate of 1-10'4 M no influence of the order of addition on the adsorption of sulphate and phosphate was observed (data not shown since markers coincide).
The competitive adsorption of sulphate and phosphate on goethite was predicted well with the model when the model parameters derived for single anion adsorption were used (dashed lines in Fig. 5 and 6).
Discussion
Phosphate adsorption
For P loadings of goethite ranging from 1.2 to 2.4 umol m"2, the P solution concentrations ranged from 10"8 to 10"4 M (Figs. 1 and 2). Phosphate adsorption data described in literature have generally been determined at P solution concentrations above 10"5 M, however, in natural systems P solution concentrations are usually much lower. Model calculations indicated that over the whole range of P solution concentration examined, the observed P adsorption could be described with the same adsorption processes. Hence, there was no indication for the presence of high affinity phosphate adsorption complexes. For P adsorption determined in 0.01 M KNO, at higher P solution concentrations, the pH and concentration dependence is comparable to that determined by Bowden et al. (1980) and Hiemstra and Van Riemsdijk (1996).
78
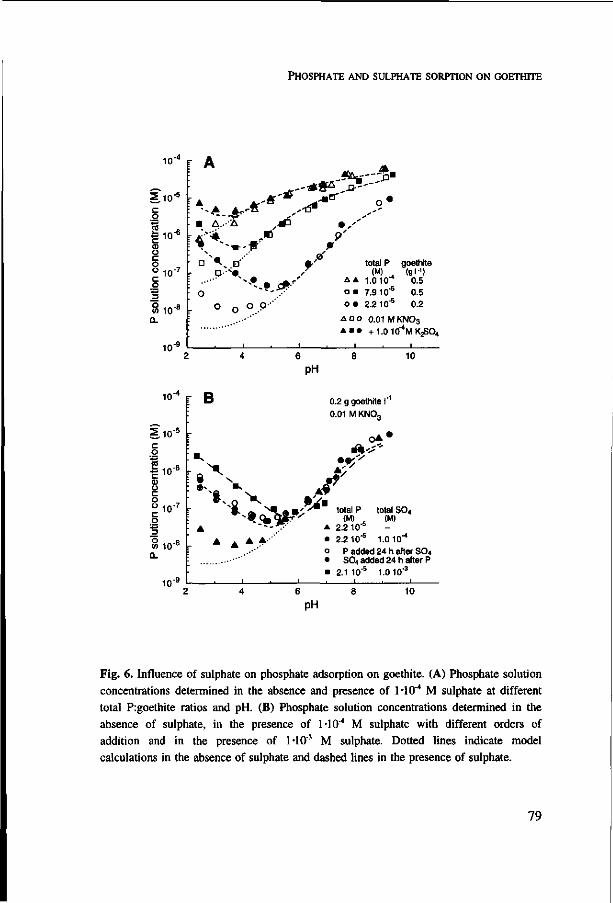
P H O S P H A T E A N D S U L P H A T E S O R P T I O N O N G O E T H I T E
10"* F
I.10"5
c o
1 1 0 - 6
<D o c o o irr? c o
10"
B i o 8
10"!
r A !
••A-A. • A..
\f< : • > r Q-
O
O
/ à
•A j a J"
B f'
' < . • * * ' * "" .•'
o °..P"
i . i
• ,' 9'
P total P
(M) A A 1.0 10"4
o « 7.9 10"5
o » 2.2 10"5
goethite (g l ' )
0.5
0.5 0.2
i o o 0.01 M K N 0 3
* • • +1 .010
1
M KjS04
10
pH
10-4
Litio
n co
ncen
trat
ion
(M)
</> 10 8
Q.
r B
r « x v : XQV
A A A-*'"
1 1
0.2 g goethite I'1
0.01 M KNO3
, s* total P total SO4 (M) (M)
* 2.2 10"5
• 2.2 10'5 1.0 10"" 0 P added 24 h after SO4 • SO4 added 24 h after P
• 2.1 10"5 1.0 10"3
1 . 1
10
pH
Fig. 6. Influence of sulphate on phosphate adsorption on goethite. (A) Phosphate solution concentrations determined in the absence and presence of 1-10"4 M sulphate at different total P:goethite ratios and pH. (B) Phosphate solution concentrations determined in the absence of sulphate, in the presence of HO"4 M sulphate with different orders of addition and in the presence of 1-10"3 M sulphate. Dotted lines indicate model calculations in the absence of sulphate and dashed lines in the presence of sulphate.
79
CHAPTER 4
The log K and ƒ values for the three phosphate surface species that were used by Hiemstra and Van Riemsdijk (1996) for the description of phosphate adsorption (Table 2) were obtained by fitting P adsorption data measured at P solution concentrations of 10'4 to 10"3 M (Table 2). The description of our data was improved for low P solution concentrations (Fig. 1) by enlarging the fn value for the bidentate surface complex to 0.55, which results in a changed contribution of the electrostatic energy to adsorption and consequently affects the log Kn value. These changes resulted in an overestimation of P adsorption at high pH, but by adjusting the /P1 value to 0.24 this was compensated. Using the adjusted model parameters, also the P adsorption phenomena that were modelled by Hiemstra and Van Riemsdijk (1996) could be described well.
At low P loading of goethite in 0.01 M KN03 an increase in the P solution concentration, and thus a small decrease in P adsorption, was observed when lowering the pH from 4 to 2.5 (Figs. 1 and 2). When the adsorption experiments at the two lowest levels of P loading were repeated, comparable results were obtained. Possibly the observed increase in P solution concentration at low P loading and low pH was caused by incomplete separation of the solid and solution phase, although much care was taken to centrifuge the samples properly. Phase separation is more difficult at low P loading, very low pH and low ionic strength, since these factors together result in a relatively high total charge of the solid and a widely extending DDL stabilizing the colloid system. Another explanation might be a contamination of goethite with anions that compete with phosphate for adsorption at low pH. Furthermore, the P concentration in solution may be increased at low pH due to the presence of iron phosphate complexes in solution. However, model calculations using the solubility product of goethite (Lindsay, 1979) indicated that the P solution concentration was not markedly affected.
The increase in P solution concentration when lowering the pH from 4 to 2.5 was predicted by the model, however at lower P loading than observed experimentally (Fig. 1). The predicted increase in P solution concentration was due to the formation of H3P04 in solution at very low pH.
The effect of increasing ionic strength on P adsorption agrees with results of Barrow et al. (1980). The pH at which the ionic strength has no influence on adsorption indicates the isoelectric point (IEP). At pH values below the EEP, P adsorption is decreased with higher ionic strength and at pH values above the IEP, P adsorption is increased with higher ionic strength. Due to this effect, the pH
80
P H O S P H A T E A N D S U L P H A T E S O R P T I O N O N G O E T H I T E
dependence of P adsorption is smaller at higher ionic strength. At low P loading of goethite, P adsorption in 0.5 M KN03 showed no pH dependence below pH 6. This effect was described well by the model (Fig. 2B).
Sulphate adsorption
The observed pH and salt dependence of sulphate adsorption on goethite agrees with previous studies (Hingston et al., 1972; Balistrieri and Murray, 1981; Zhang and Sparks, 1990; Hoins et al., 1993; Ali and Dzombak, 1996a).
Sulphate adsorption on goethite was described poorly when outer sphere adsorption, using ion pair formation treating sulphate as a point charge, was assumed, or when a combination of ion pair formation and bidentate complexation was used. Assuming only bidentate complexation yielded a good description of sulphate adsorption (Fig. 3, 4). In this approach, a considerable part of the charge of the central cation in the S04
2" ion (/"SO4=0.62) was attributed to the surface. This charge distribution was necessary to describe the pH dependence of sulphate adsorption.
The macroscopic OH/S04 ratio of sulphate adsorption, predicted with the model, depended on the pH and the amount of sulphate adsorbed on goethite. For a suspension containing 1-10"3 M sulphate and 4.0 g goethite l"1, the OH/S04 ratio increased from 0.98 to 1.76 for pH 3 to pH 9, respectively, which is comparable to experimentally obtained OH/S04 exchange ratios (Turner and Kramer, 1991). The lower values of the exchange ratio at decreasing pH are due to the increased protonation of the surface (He et al., 1996). A good description of the pH dependence and the OH/anion exchange ratio of anion adsorption is essential for predicting anion transport in poorly buffered media containing metal (hydr)oxides (Meeussen et al., 1996).
With increasing pH, the goethite surface becomes less positively charged. Therefore, the strong decrease in sulphate adsorption with increasing pH indicates that the adsorption of sulphate on goethite is dominated by coulombic energy and that the chemical energy is low. This is also reflected in the low value of the log KS04 used to describe the data. Since almost no sulphate is adsorbed at the PPZC, the IEP is virtually unaffected. At higher ionic strength the positive surface potential decreases at pH values below the IEP=PPZC, resulting in a lower adsorption of anions, such as sulphate, that are sorbed on positive surfaces (Dzombak and Morel,
81
CHAPTER 4
1990). In contrast, P adsorbs on goethite with a high chemical energy and, at pH values above the IEP, phosphate is adsorbed against coulombic forces. The increase in P adsorption at high ionic strength at pH values above the IEP can be explained by the less negative potential in the plane of adsorption (Barrow et al., 1980).
Competitive adsorption of phosphate and sulphate
Phosphate has a higher affinity for adsorption on goethite than sulphate and therefore is a stronger competitor. At total concentrations of 1-10"4 M for both anions, P adsorption is only slightly decreased at pH values below pH 4, whereas sulphate adsorption is much lower over the whole range of pH below the PPZC (Fig. 5). This corresponds with results of competitive adsorption of phosphate and inorganic anions with a lower affinity than phosphate (Hingston et al., 1971; Parfïtt, 1982). For soils, it was shown that the competitive adsorption of phosphate and sulphate makes sulphate more available for plant uptake and more susceptible to leaching (Kamprath et al., 1956; Metson and Blakemore, 1978; Bolan et al., 1988).
The order of addition of phosphate and sulphate to goethite had a small influence on adsorption when sulphate was added at a higher total concentration than P (ratio S04:P=4.5:l)(Fig. 6B). The observed effect of the order of addition was much smaller than reported by Violante et al. (1991) and Ali and Dzombak (1996a). However, Violante et al. (1991) used non-crystalline aluminum oxide, which may have caused slow desorption of the anion that was added first. In the experiments of Ali and Dzombak (1996a) chelidamic acid and sulphate, with a comparable affinity for the goethite surface, were used. Chelidamic acid showed slow sorption kinetics in the presence of sulphate (ratio sulphatexhelidamic acid=20:l), which was explained by the reduction in surface sites due to the adsorption of sulphate. Similarly, our data suggested that the sorption kinetics of the anion that was added last were slightly slower than when both anions were added at the same time.
Competitive adsorption may result from direct competition for sorption sites and from electrostatic effects due to the change in charge of the solid upon adsorption. The site density of the singly coordinated surface groups, which are supposed to be reactive for phosphate and sulphate, is 3.45 sites nm"2 or 5.73 umol m"2. Because the singly coordinated surface groups are present in rows on the 110 and 021 face of the goethite crystal, a maximum of 2.86 umol complexes m"2 can be
82

P H O S P H A T E A N D S U L P H A T E S O R P T I O N O N G O E T H I T E
formed when only bidentate complex formation with phosphate and sulphate is assumed. The observed maximum adsorption of phosphate or sulphate is well below this maximum value indicating the influence of electrostatic interaction (Fig. 1, 3). For a system with both phosphate and sulphate, as shown in Fig. 5, without any interaction a co-adsorption of 3.6 umol m"2 would be expected at pH 2.5, i.e. 2.0 umol m"2 P and 1.6 umol m"2 S04 (Fig. 5A,B). However, this value is above the theoretical adsorption maximum of 2.9 umol m"2, indicating that competition for sorption sites occurs.
Although the competitive effect of sulphate on phosphate adsorption was small with respect to the amount of P adsorbed per unit surface area of goethite (Fig. 5), it may be of great importance for the bioavailability of phosphate since it caused a substantial increase in the P solution concentration (Fig. 6) (Parfitt, 1982). The magnitude of the effect of sulphate on P adsorption and the pH below which P adsorption is affected depends on the relative concentrations of phosphate and sulphate.
Conclusions
Phosphate adsorption on goethite is non-linearly related to the P solution concentration, even at very low solution concentrations of 10"8 M. Assuming one set of adsorption reactions, the adsorption of P was described well over the whole range of P solution concentrations examined.
The adsorption behaviour of sulphate on goethite, that shows strong pH and salt dependence and no adsorption at pH values above the PPZC, was described well using only one inner sphere surface complex.
In competitive adsorption systems with phosphate and sulphate, phosphate is a stronger competitor for adsorption on goethite than sulphate, which is consistent with the higher affinity of phosphate for the surface compared to sulphate. In the presence of phosphate, the adsorption of sulphate is largely reduced over the whole range of pH below the PPZC. On the other hand, the presence of sulphate causes only a small decrease in P adsorption per unit surface area of goethite at relatively low pH, which, nevertheless, results in a substantial increase in the P solution concentration. The interaction of phosphate and sulphate for adsorption was predicted well with the model using the parameters derived for single anion adsorption.
83

CHAPTER 4
Acknowledgements
The authors thank Dr. B.J.M. Verduin of the Department of Virology, Wageningen Agricultural University, for allowing us to use the facilities of the isotope laboratory. Mr. A.J. Korteweg, Department of Colloid and Physical Chemistry (WAU), is acknowledged for performing the BET surface area measurements. René Rietra is thanked for carrying out the Potentiometrie titrations of goethite. The reviewers of Geochimica et Cosmochimica Acta are thanked for their helpful comments on the manuscript.
84
Effects of sulphate and pH on the plant-availability of
phosphate adsorbed on goethite

Jeanine S. Geelhoed, Willem H. Van Riemsdijk and Günter R. Findenegg
Plant and Soil 197, 241-249 (1997)

Effects of sulphate and pH on the plant-availability of phosphate
adsorbed on goethite.
The adsorption of phosphate on metal (hydr)oxides may be influenced by the pH and by the adsorption of other ions. In this study, the influence of sulphate and pH on phosphate adsorption on goethite and the availability to plants of adsorbed phosphate was examined. Maize plants were grown on suspensions of goethite with adsorbed phosphate, containing the same total amount of phosphate and either 0.11 mM or 2.01 mM sulphate at pH 3.7, 4.6 or 5.5. The uptake of phosphorus by the plants increased with the larger sulphate concentration and decreasing pH. Mean P uptake in the treatment with 2.01 mM sulphate and pH 3.7 was 55 umol plant', whereas in the treatment with 0.11 mM sulphate and pH 5.5 it was 2 umol plant"1. Batch adsorption experiments using 32P and speciation modelling of ion adsorption showed that in the presence of sulphate, the phosphate concentration in solution strongly increased with decreasing pH, due to competitive adsorption between sulphate and phosphate on goethite. Modelled phosphate concentrations in solution in the uptake experiment were all below 0.6 uM and correlated well with the observed P uptake. This correlation indicates that the strong influence of the sulphate concentration and pH on the plant-availability of adsorbed phosphate results from the competition between sulphate and phosphate for adsorption on goethite.
Introduction
In acid weathered soils, phosphate is sorbed strongly on iron and aluminum
(hydr)oxides, resulting in very low phosphate concentrations in solution (Sanchez,
1976). Also sulphate is sorbed on metal (hydr)oxides, although the affinity of metal
(hydr)oxides for sulphate is lower than for phosphate (Geelhoed et al., 1997a; Marsh
et al., 1987; Parfitt, 1978). This difference in affinity is reflected in the competitive
sorption of phosphate and sulphate. In the presence of phosphate, the sorption of
sulphate on soils and metal (hydr)oxides is decreased strongly over the whole range
of pH at which sulphate is sorbed (Geelhoed et al., 1997a; Kamprath et al., 1956;
Metson and Blakemore, 1978; Parfitt, 1982).
Conversely, the presence of sulphate is generally considered to have no or
only little effect on the sorption of phosphate. No effect of sulphate on the sorption
of phosphate on hydrous ferric oxide was observed at pH 6.5 (Ryden et al., 1987),
whereas inconclusive results were obtained in a study with strongly sorbing New
Zealand soils (Metson and Blakemore, 1978), and a consistent but small reduction of
phosphate sorption on kaolinite, pseudoboehmite and hematite at pH 4.6 was
87
CHAPTER 5
observed at increasing sulphate concentration (Aylmore and Karim, 1967). The influence of sulphate on phosphate sorption on goethite was studied in more detail. Sulphate decreased phosphate sorption only at relatively low pH. Although the decrease in the amount of phosphate sorbed per unit reactive surface area was small, it resulted in a considerable increase in the phosphate concentration in solution (Geelhoed et al., 1997a; Hawke et al., 1989; Parfitt, 1982).
The response of plants, in terms of uptake, to phosphate sorbed on metal (hydr)oxides depends strongly on the phosphate concentration in solution. Phosphorus uptake rates of plants from phosphate concentrations in solution as low as 0.03 uM have been determined in flowing nutrient solution (Breeze et al., 1984; Elliot et al., 1984; Jungk et al., 1990; Loneragan and Asher, 1967). However, in such systems, the flowing rate of the nutrient solution must be kept very high to prevent phosphate from being depleted. Alternatively, P uptake at low phosphate concentration in solution has been studied by growing plants on solid substrates to which phosphate was adsorbed, such as sand mixed with alumina (Coltman et al., 1982; 1985) and sand coated with goethite (Geelhoed et al., 1997b). In these systems, the phosphate concentration in solution is buffered by the desorption of phosphate from the metal (hydr)oxide is order to maintain equilibrium between sorbed and dissolved phosphate.
Previously, we used the latter method to study the availability of sorbed phosphate, by determining the P uptake of plants growing on quartz sand coated with goethite on which phosphate was adsorbed (Geelhoed et al., 1997b). The experimental results showed good agreement with model calculations of P uptake. However, for one treatment, in which the average pH of the 'soil' solution decreased from 5.5 to 4.2 during the experiment, uptake was underestimated by 80 %. We suggested that the decrease in pH together with the presence of sulphate resulted in a larger concentration of phosphate in solution and greater uptake, an effect that was not accounted for in the model.
A method in which the phosphate concentration in solution is buffered while the pH and the concentration of other nutrients can be controlled is to grow plants on a suspension of metal (hydr)oxides with adsorbed phosphate (Guzman et al., 1994). In the present study, the influence of pH and sulphate on the plant-availability of phosphate adsorbed on goethite is determined in such a suspension culture experiment. Plants were grown at P limiting conditions to ensure all phosphate available for plant uptake was taken up. Phosphate was adsorbed on
E F F E C T S O F S U L P H A T E A N D P H O N P A V A I L A B I L I T Y
goethite at the same level in all treatments, which differed in pH and sulphate
concentration. All other nutrients essential for plant growth were added to the
suspensions. The equilibrium phosphate concentrations in solution in the treatments
were too low to be determined colorimetrically. Therefore, batch adsorption
experiments using 32P were carried out to determine the pH dependence of
phosphate adsorption on goethite at different sulphate concentrations and in nutrient
solution. In addition, the CD-MUSIC speciation model for ion adsorption (Hiemstra
and Van Riemsdijk, 1996) is used to predict the phosphate concentration in solution
in the different experiments.
Materials and methods
Preparation of goethite
Two batches of goethite were prepared by titrating 5 1 of 0.5 M Fe(N03)3-9
H 20 with 2.5 M NaOH at a rate of 0.5 1 h"1 to pH 12. The suspensions were aged
for 4 days at 60°C and subsequently dialysed with distilled demineralized water
(Hiemstra et al., 1989b). The pristine point of zero charge (PPZC) of both goethites,
determined from acid-base titrations under a N2 atmosphere (Venema et al., 1996),
was 9.2. The specific surface area (Brunauer et al., 1938) was 93.8 m2 g"1 for
goethite A and 96.4 m2 g*1 for goethite B.
Nutrient solutions
One nutrient solution contained 2.0 mM MgS04, 5.0 mM KN03, 3.5 mM
Ca(N03)2, 1.5 mM NH4N03 and trace elements, in uM: Fe (as FeEDTA) 82; B 46;
Mn 9.1; Cu 0.76; Zn 0.31 and Mo 0.10. A second nutrient solution contained 0.1
mM MgS04 and 1.9 mM MgCl2 instead of 2.0 mM MgS04. The total sulphate
concentrations in the nutrient solutions were 2.01 mM and 0.11 mM, since Mn, Cu
and Zn were added as sulphate salts.
Treatments in the uptake experiment
Goethite A suspension was divided into two portions. One portion was
equilibrated with nutrient solution containing 0.11 mM sulphate, the other with
89

CHAPTER 5
nutrient solution containing 2.01 mM sulphate, both at pH 4.5. Equal total amounts
of phosphate were added to these suspensions to reach a phosphate loading of
goethite of 1.02 umol P m"2, after which the pH was readjusted. After shaking for 24
h in an end-over-end shaker, the two suspensions were each divided into three
portions, which were diluted with nutrient solution to a suspension density of 1.25
g l"1 and had a total phosphate concentration of 0.12 mM. The pH of these diluted
suspensions was adjusted to 3.7, 4.6 or 5.5 to obtain 6 treatments differing in total
sulphate concentration and pH. The diluted suspensions were equilibrated for
another 24 h. Two control treatments without phosphate were included, one with and
one without goethite in a nutrient solution with 2.01 mM sulphate. To check for S
deficiency, two other control treatments without goethite containing nutrient solution
with 0.11 or 2.01 mM sulphate and a phosphate concentration of 50 uM were
included. All control treatments had a pH of 5.5.
Plant growth
Maize seeds (Zea mays L. var. LG11) weighing between 300 and 320 mg,
were germinated in moist quartz sand. Two-day old seedlings were transferred to the
uptake experiment in which, per treatment, 8 plants were grown on 16 1 suspension.
Plants were grown in a growth cabinet at a temperature of 25°C, a relative humidity
of approximately 80%, a light intensity of 70 W m"2 and a day length of 16 h. The
suspensions were mixed by bubbling air through the suspensions and the pH was
kept constant by computer controlled addition of 0.1 M HN03 or KOH. By daily
addition of demineralized water the volume of the suspensions was kept constant.
The plants were harvested 28 days after transfer to the suspensions. The
shoot of each plant was analyzed separately, whereas the roots were analyzed
collectively per treatment. The P, S, K, Ca and Mg concentrations in shoots and
roots were determined after digesting the tissue in a mixture of HF, HN03 and H202,
and measuring the element concentrations in the digests using ICP. Tissue N
concentrations were determined after digesting the tissue with H2S04, Se, salicylic
acid and H202, and measuring N using the indophenol blue method. Phosphorus
uptake was calculated from the difference in the P content of the plants in the
treatments with and without phosphate.
90

EFFECTS OF SULPHATE AND PH ON P AVAILABILITY
Batch adsorption experiments
Phosphate adsorption experiments were carried out at a loading of about 1.1 umol P m"2 goethite and a pH ranging from 2.5 to 8. To 0.2 g goethite B 1', a total concentration of about 22 uM phosphate, including 3.3 to 150 kBq carrier free 32P, was added. Phosphate adsorption was determined in 0.01 M KN03, in 0.01 M KN03
with 0.1 mM or 1 mM sulphate, and in nutrient solution with 2.01 mM sulphate. In the experiments with sulphate in 0.01 M KN03, phosphate and sulphate were added at the same time. The components of the nutrient solution, except KN03, were added after the addition of phosphate and short mixing, to prevent precipitation. The suspensions were shaken for 20 h in an end-over-end shaker, after which the pH was determined and the suspensions were centrifuged. The 32P concentration in the supernatant was determined by Cerenkov counting. The 31P concentration was calculated using the 31P:32p ratio corrected for disintegration. Phosphate adsorption was calculated from the difference in the initial total phosphate concentration and the phosphate concentration in solution.
Modelling ion adsorption
In the CD-MUSIC model, solution speciation, complexation reactions of the ions with the surface, competition for adsorption sites at the surface and electrostatic interaction are taken into account. The density of reactive surface groups is derived from the structure of the goethite crystal: 5.7 umol m"2 singly coordinated surface groups, and 4.5 umol m"2 triply coordinated surface groups. Singly coordinated surface groups are coordinated to one, and triply coordinated surface groups to three Fe atoms in the goethite crystal. The charge of the surface groups is determined by the number of bonds with the underlying Fe atoms (0.5 unit per bond) and the charge of the surface ligands (-2 for O, -1 for OH and 0 for OH2) (Hiemstra and Van Riemsdijk, 1996).
The reactions that are considered to occur at the surface are listed in Table 1. For the protonation of both types of surface groups, the log KK is assumed to be the same and equal to the PPZC of goethite (Table 1, Equation [1]). Non-specifically adsorbed ions may form ion pairs (Table 1, Equations [2] and [3]). The charge of the ion forming the ion pair is regarded as a point charge present at the head end of the diffuse double layer (DDL). Specifically adsorbing oxyanions share
91

CHAPTER 5
Table 1. Surface reactions with singly (FeOHw') or triply (Fe30'4") coordinated surface groups for protonation of the surface, ion pair formation with cations (C+) or anions (A), and inner sphere complexation of phosphate and sulphate. Also, the intrinsic reaction constants (log K) and the /-values for the partitioning of the charge of the central cation to the surface and the 1-plane as used by Geelhoed et al. (1997a) are given.
Eq.
[1]
[2]
[3]
[4]
[5]
[6]
[7]
Reaction
FeOH1^ + H+
Fe30V4" + H+
FeOH*- + C+
Fe30*- + C+
FeOH^ + A"
Fe3OH*t + A"
2 FeOH*- + 2 H+
2 FeOH^ + 3 H+
+
+ FeOH1'4- + H+ + PO,
2 FeOH*- + 2 H+ +
P043
PO 43-
3-
so42
« FeOH^
* Fe3OH^
* FeOH*-C+
» Fe30*--C+
« FeOH2,/4+-A-
» Fe^H^-A"
* Fe202P02<2-) +
* Fe202POOH(-' * FeOP03
WW) +
» Fe202S02(> +
2H 2 0
+ 2H 2 0 H20
2H 2 0
Model parameter values
log A-„=9.2
log /r„=9.2
l o g ATC=-1
log Kc=-1
log KA=S.2
log ATA=8.2
log ^ = 3 0 . 0
log ^p2H=35.5 log ArP1=20.5
log ^S04=19.5
/P2=0.55
/ P 2 ^ 0 . 6 0
/P ,=0 .24
/so4=0.62
ligands with the surface, forming inner sphere complexes. These complexes are
denoted monodentate complexes when one common ligand is involved, and
bidentate complexes for two common ligands. The charge of the inner sphere
complex is regarded as a spatial charge. A fraction ƒ of the charge of the central
cation of the oxyanion and the charge of the surface oriented ligands is attributed to
the surface. The remaining charge of the central cation and the charge of the
solution oriented ligands is attributed to the 1-plane, which is positioned at some
distance between the surface and the head end of the DDL (Hiemstra and Van
Riemsdijk, 1996).
The surface complexes of phosphate and sulphate that we use in the model
have been proposed from infrared spectroscopy and extended x-ray absorption fine
structure spectroscopy data of phosphate and sulphate adsorbed on goethite
(Manceau and Charlet, 1994; Parfitt and Smart, 1977; Tejedor-Tejedor and
Anderson, 1990). For phosphate adsorption, bidentate, protonated bidentate and
monodentate complex formation with singly coordinated surface groups is
considered (Table 1, Equations [4], [5] and [6]). For the adsorption of sulphate,
bidentate complex formation with singly coordinated surface groups is assumed
92

E F F E C T S O F S U L P H A T E A N D P H O N P A V A I L A B I L I T Y
(Table 1, Equation [7]). The reaction constants and charge distribution factors for
phosphate and sulphate complexation were obtained by fitting phosphate and
sulphate adsorption data determined at different pH, ionic strength and
anion:goethite ratio (Table 1) (Geelhoed et al., 1997a). It is assumed that divalent
cations contribute to the ionic strength only.
Results
Phosphorus uptake and plant growth
The uptake of phosphorus by plants growing on goethite suspensions with
the same total amount of phosphate was largest for plants growing at a sulphate
concentration of 2.01 mM combined with pH 3.7 (Fig. 1). At both sulphate
concentrations, an increase of the pH resulted in less P uptake than at pH 3.7. At all
three pHs, increasing the sulphate concentration resulted in more uptake of
phosphorus, but the effect was stronger at low than at high pH.
70
60
J5 ^ 4 0
~ 3 0
B.20
I I ^ 'KM
Treatment 1 S0 4 (mM) 2.01 pH 3.7
2
2.01 4.6
3
2.01
5.5
4
0.11 3.7
5
0.11
4.6
6
0.11 5.5
Fig. 1. Phosphorus uptake by plants grown on goethite suspensions with the same total concentration of phosphate but different total sulphate concentrations and pH. The error bars indicate the sum of the standard errors of the mean P content in the shoots (n=8) and seeds (n=16). The roots were collected per treatment.
93

CHAPTER 5
The dry matter production of the plants and the mean concentrations of P
and S in plant tissue (shoots+roots) are listed in Table 2. In treatments 9 and 10
with only dissolved phosphate, the plants took up all phosphate present, 100 umol P
plant"1. All plants showed visible signs of P deficiency and the P tissue
concentration ranged from 20 to 26 umol g"1 dry matter. The tissue S concentration
of the plants in treatment 9 was 38 umol g"1 dry matter, whereas in the other
treatments it ranged from 70 to 97 umol S g ' dry matter.
Table 2. Treatments of the suspension culture experiment, dry matter yield per plant and mean P and S tissue concentrations in the different treatments.
Treat
ment
1
2 3
4
5 6
7 8 9 10
Goethite
1.25 gl '1
+
+ +
+
+ +
+ ---
Total phosphate
(mM)
0.12
0.12 0.12
0.12 0.12
0.12 0 0
0.05 0.05
Total
sulphate (mM)
2.01
2.01 2.01
0.11 0.11
0.11 2.01
2.01 0.11 2.01
PH
3.7
4.6 5.5
3.7 4.6
5.5 5.5
5.5 5.5 5.5
Dry matter yield
(g plant1)
shoot"
2.38 ± 0.47
1.42 ±0.12 0.95 ±0.10
0.98 ± 0.23 0.76 ±0.13
0.88 + 0.11 0.87 ± 0.06
0.90 ±0.12 4.75 ± 0.59 4.96 ± 0.28
rootb
0.70
0.44 0.34
0.37 0.27
0.30 0.32
0.31 1.55 1.48
Tissue concentration
(umol g"
P
26.1
25.5 25.6 24.1
24.1
23.7 20.8 22.1
19.8 19.9
1 dry matter)
S
89.6 92.4
96.9 76.3
70.8 71.9 80.2
90.1 38.3 71.5
a mean ± standard error; n=8
Batch adsorption experiments and adsorption modelling
The concentration of dissolved phosphate in equilibrium with phosphate
adsorbed on goethite is shown in Fig. 2. When adsorption was determined in a
background of 0.01 M KN03 without sulphate the phosphate concentration in
solution ranged from 0.01 uM at pH 3.7 to 1 uM at pH 7.5. Addition of 0.1 mM
sulphate resulted in an increase in the phosphate concentration in solution at pH
94

E F F E C T S O F S U L P H A T E A N D P H O N P A V A I L A B I L I T Y
values below 5. When more sulphate was added, the increase in the phosphate
concentration in solution at low pH was larger. In a 'background' of nutrient
solution with 2.01 mM sulphate, the phosphate concentration in solution was
somewhat higher than in the presence of 1 mM sulphate at pH values below 5.5, but
was significantly lower at pH values above 5.5.
Using the CD-MUSIC model with the parameter values listed in Table 1,
the phosphate concentrations in solution were predicted (Fig. 2). In a background of
0.01 M KNOj without sulphate, the phosphate concentration in solution was
underestimated at pH values below pH 4.5. A close agreement between the observed
and predicted phosphate concentration in solution was obtained for phosphate
adsorption in the presence of 0.1 mM and 1 mM sulphate. When nutrient solution
with 2.01 mM sulphate was present, the phosphate concentration in solution was
predicted well for pH values below 5.5, but was overestimated by the model for pH
values above 5.5.
10-'
c o Ü
10''
.2 10-'
10'
T \ > • ^
Û
'"•a
r 0
•
o
:
'
0.2 g goethite I'1 ^
22 MM total P a y^
V Vsj/ C\ ' ' '/
V // •"»x. —' r
X . o ^ ^ ^ ""*- - - ° .<???~* *
* * o Q '
o o O.OIMKNO3 a — +0.1mMI<2SO4 û - - + 1.0 mM KjSO« * — nutrient sol. (2.01 mM SQj)
i . i i . i
5
pH
Fig. 2. Phosphate concentration in solution for phosphate adsorbed on goethite in 0.01 M KNO, without sulphate, in 0.01 M KN03 with total sulphate concentrations of 0.1 mM and 1.0 mM, and in nutrient solution with a total sulphate concentration of 2.01 mM. The lines indicate model calculations.
95
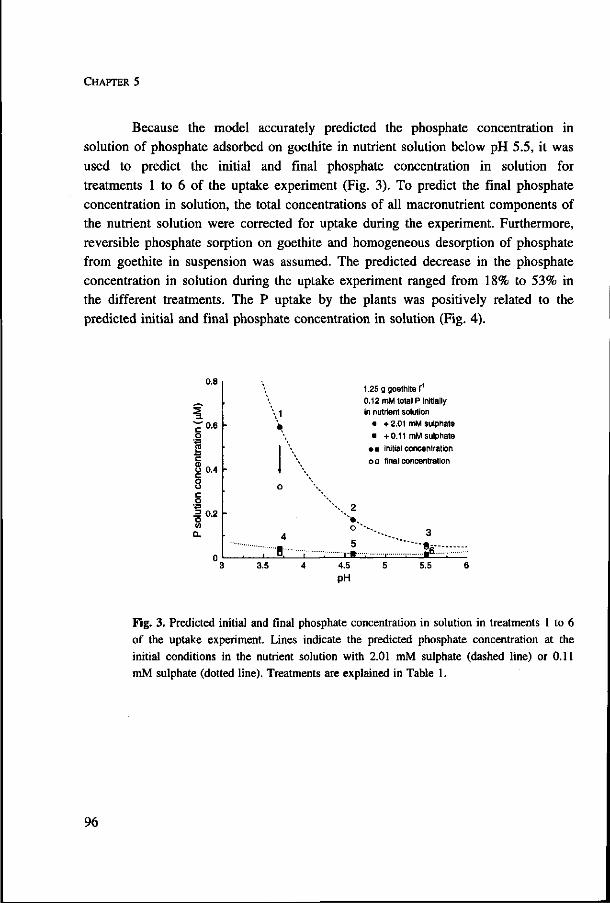
CHAPTER 5
Because the model accurately predicted the phosphate concentration in
solution of phosphate adsorbed on goethite in nutrient solution below pH 5.5, it was
used to predict the initial and final phosphate concentration in solution for
treatments 1 to 6 of the uptake experiment (Fig. 3). To predict the final phosphate
concentration in solution, the total concentrations of all macronutrient components of
the nutrient solution were corrected for uptake during the experiment. Furthermore,
reversible phosphate sorption on goethite and homogeneous desorption of phosphate
from goethite in suspension was assumed. The predicted decrease in the phosphate
concentration in solution during the uptake experiment ranged from 18% to 53% in
the different treatments. The P uptake by the plants was positively related to the
predicted initial and final phosphate concentration in solution (Fig. 4).
0.8
0.6
= 0.2 O co Q.
\
\ 1 è \
. \
\
o
. , ! 4
1.25 g goethite I'1
0.12 mM total P initially in nutrient solution
• + 2.01 mM sulphate • +0.11 mM sulphate
• • initial concentration o a final concentration
''••. 2
'•. 3
5 "'" fc-
3.5 4.5
pH 5.5
Fig. 3. Predicted initial and final phosphate concentration in solution in treatments 1 to 6
of the uptake experiment. Lines indicate the predicted phosphate concentration at the
initial conditions in the nutrient solution with 2.01 mM sulphate (dashed line) or 0.11
mM sulphate (dotted line). Treatments are explained in Table 1.
96

EFFECTS OF SULPHATE AND PH ON P AVAILABILITY
BO
~ 6 0 c CO Q .
| 40
CD It. CO
g-20 CL
0
_
-
-
0
•' «£•'
/o.»-''
P"
--'''
,-'' .-•'
.--'''
• initiai concentration o final concentration
m i . i . i . i . i . i . 0.1 0.2 0.3 0.4 0.5 0.6
P solution concentration (uM) 0.7
Fig. 4. Phosphorus uptake by plants related to the predicted initial and final phosphate concentration in solution. The plants were grown on suspensions of goethite with the same total amount of phosphate but different total sulphate concentration and pH.
Discussion
The uptake of phosphorus by plants growing on suspensions of goethite to
which the same total amount of phosphate was added was strongly influenced by the
total sulphate concentration and the pH of the suspensions (Fig. 1). As the plants
were all deficient in P but not in S, and plant growth was not affected by the
presence of goethite (Table 2), sulphate must have influenced plant growth via the
availability of phosphate. For treatments 5 and 6, with a low sulphate concentration
and pH 4.6 or 5.5, the P content of the plants was comparable to the P content of
the seeds (25.6 ± 2.0 umol; n=16), which resulted in small negative or positive
values for uptake (Fig. 1). With increasing P uptake the dry matter yield of the
plants increased, but the P tissue concentration was not affected, indicating all
phosphorus taken up was invested in dry matter production.
At both levels of total sulphate in the suspensions, the P uptake by the
plants decreased with increasing pH. This is in contrast to what is expected if
phosphate is adsorbed on goethite in indifferent electrolyte solution, where the
adsorption of phosphate decreases with increasing pH (Bowden et al., 1980;
97
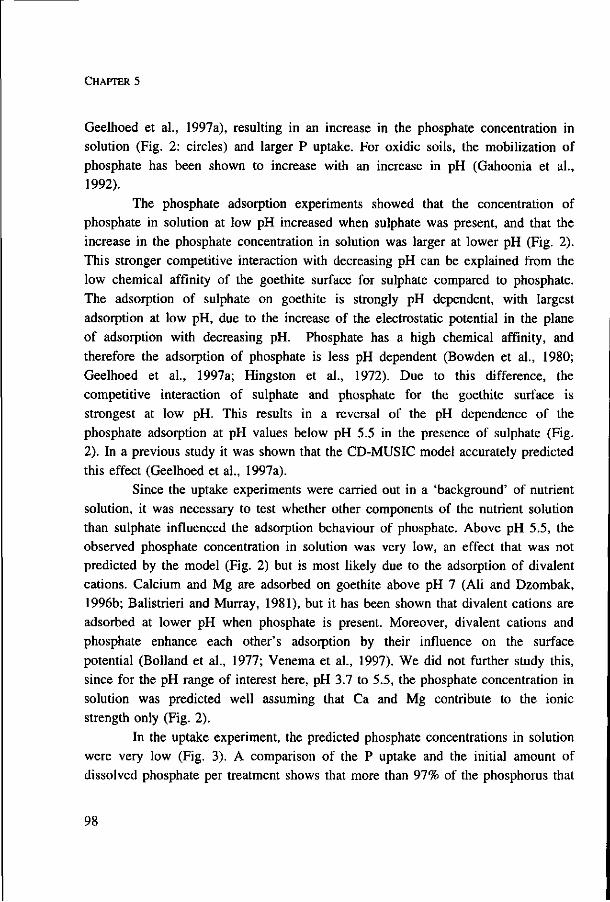
CHAPTER 5
Geelhoed et al., 1997a), resulting in an increase in the phosphate concentration in
solution (Fig. 2: circles) and larger P uptake. For oxidic soils, the mobilization of
phosphate has been shown to increase with an increase in pH (Gahoonia et al.,
1992).
The phosphate adsorption experiments showed that the concentration of
phosphate in solution at low pH increased when sulphate was present, and that the
increase in the phosphate concentration in solution was larger at lower pH (Fig. 2).
This stronger competitive interaction with decreasing pH can be explained from the
low chemical affinity of the goethite surface for sulphate compared to phosphate.
The adsorption of sulphate on goethite is strongly pH dependent, with largest
adsorption at low pH, due to the increase of the electrostatic potential in the plane
of adsorption with decreasing pH. Phosphate has a high chemical affinity, and
therefore the adsorption of phosphate is less pH dependent (Bowden et al., 1980;
Geelhoed et al., 1997a; Hingston et al., 1972). Due to this difference, the
competitive interaction of sulphate and phosphate for the goethite surface is
strongest at low pH. This results in a reversal of the pH dependence of the
phosphate adsorption at pH values below pH 5.5 in the presence of sulphate (Fig.
2). In a previous study it was shown that the CD-MUSIC model accurately predicted
this effect (Geelhoed et al., 1997a).
Since the uptake experiments were carried out in a 'background' of nutrient
solution, it was necessary to test whether other components of the nutrient solution
than sulphate influenced the adsorption behaviour of phosphate. Above pH 5.5, the
observed phosphate concentration in solution was very low, an effect that was not
predicted by the model (Fig. 2) but is most likely due to the adsorption of divalent
cations. Calcium and Mg are adsorbed on goethite above pH 7 (Ali and Dzombak,
1996b; Balistrieri and Murray, 1981), but it has been shown that divalent cations are
adsorbed at lower pH when phosphate is present. Moreover, divalent cations and
phosphate enhance each other's adsorption by their influence on the surface
potential (Bolland et al., 1977; Venema et al., 1997). We did not further study this,
since for the pH range of interest here, pH 3.7 to 5.5, the phosphate concentration in
solution was predicted well assuming that Ca and Mg contribute to the ionic
strength only (Fig. 2).
In the uptake experiment, the predicted phosphate concentrations in solution
were very low (Fig. 3). A comparison of the P uptake and the initial amount of
dissolved phosphate per treatment shows that more than 97% of the phosphorus that
98
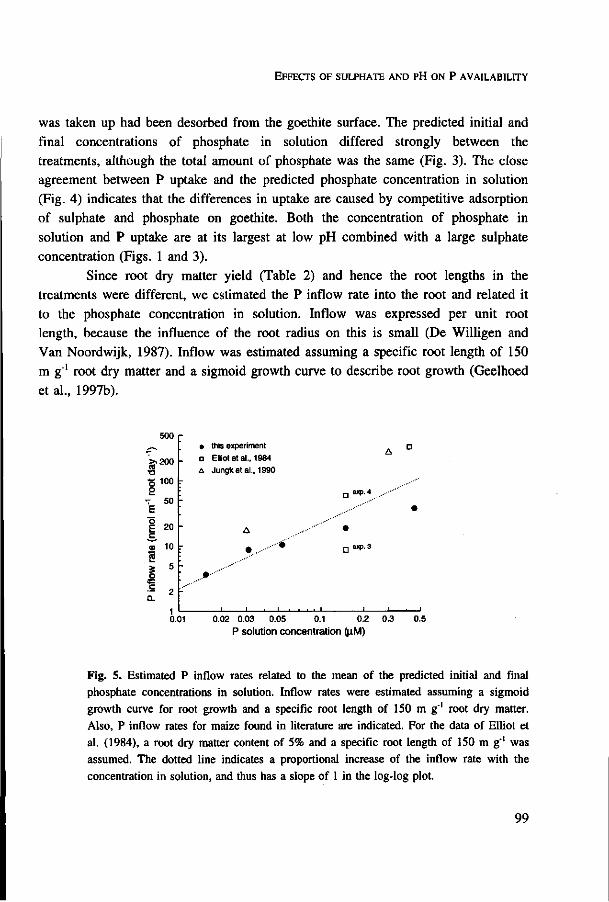
E F F E C T S O F S U L P H A T E A N D P H O N P A V A I L A B I L I T Y
was taken up had been desorbed from the goethite surface. The predicted initial and
final concentrations of phosphate in solution differed strongly between the
treatments, although the total amount of phosphate was the same (Fig. 3). The close
agreement between P uptake and the predicted phosphate concentration in solution
(Fig. 4) indicates that the differences in uptake are caused by competitive adsorption
of sulphate and phosphate on goethite. Both the concentration of phosphate in
solution and P uptake are at its largest at low pH combined with a large sulphate
concentration (Figs. 1 and 3).
Since root dry matter yield (Table 2) and hence the root lengths in the
treatments were different, we estimated the P inflow rate into the root and related it
to the phosphate concentration in solution. Inflow was expressed per unit root
length, because the influence of the root radius on this is small (De Willigen and
Van Noordwijk, 1987). Inflow was estimated assuming a specific root length of 150
m g"1 root dry matter and a sigmoid growth curve to describe root growth (Geelhoed
et al., 1997b).
500
S-200 •o 'S 100 p
50
20
<D 10
S 5
O
I 2 Q.
• this experiment
a Elliot et al., 1984
Û Jungk et al., 1990
I exp. 3
0.01 0.02 0.03 0.O5 0.1 0.2
P solution concentration (u.M) 0.3 0.5
Fig. 5. Estimated P inflow rates related to the mean of the predicted initial and final phosphate concentrations in solution. Inflow rates were estimated assuming a sigmoid growth curve for root growth and a specific root length of 150 m g"1 root dry matter. Also, P inflow rates for maize found in literature are indicated. For the data of Elliot et al. (1984), a root dry matter content of 5% and a specific root length of 150 m g'1 was assumed. The dotted line indicates a proportional increase of the inflow rate with the concentration in solution, and thus has a slope of 1 in the log-log plot.
99

CHAPTER 5
Loneragan and Asher (1967) observed that with an increase in the phosphate solution concentration from 0.04 to 0.2 uM, the mean rate of P absorption increased 5.1 to 6.7 times for six out of eight plant species examined. Therefore, it may be assumed that at very low phosphate concentration in solution, inflow increases proportionally with the phosphate concentration in solution (Fig. 5, dotted line). The estimated P inflow rates in our experiment are somewhat low compared to those determined by Jungk et al. (1990) for maize grown in flowing nutrient solution, although the data obtained by Elliot et al. (1984) indicate that deviations in the P inflow rates determined in subsequent experiments may be large (Fig. 5). Also differences in cultivars used, pretreatment or plant age may affect the inflow rate (Jungk and Barber, 1975; Jungk et al., 1990; Schenk and Barber, 1980). The less than proportional increase of the inflow rate with phosphate in solution at the larger concentrations in treatments 1 and 2 may be caused by insufficient mixing of the suspensions due to the high root densities present in these treatments.
The sulphate concentration and pH had a large influence on P uptake (Fig. 1), but model calculations show that the influence on the amount of phosphate adsorbed per unit surface area is negligibly small. In treatment 1, with pH 3.7 and a sulphate concentration of 2.01 raM, 99.5 % of the total phosphate is adsorbed. At the same time, the phosphate concentration in solution in treatment 1 is about 30-fold larger than in treatment 6 with pH 5.5 and 0.11 mM sulphate (Fig. 3). Thus, due to the competitive adsorption of phosphate and sulphate, the concentration of phosphate in solution markedly increases, resulting in greater P uptake by the plants.
For soils that contain significant amounts of metal (hydr)oxides, and thus adsorb sulphate and phosphate strongly, it was suggested that the addition of sulphate and phosphate together would increase the phosphate availability more than the addition of phosphate alone (Parfitt, 1982).
Weathered topsoils from Fiji and North Queensland, Australia strongly retain phosphate and sulphate. The phosphate concentrations in the soil solution were below 0.2 uM, whereas the sulphate concentration in solution ranged from 0.02 to 0.25 mM for the soils from Fiji, and from 0.1 to 2.0 mM for the Australian soils (Gillman and Bell, 1978; Naidu et al., 1991). For a number of these soils the pH(H20) was below 4.5, indicating that competitive adsorption of sulphate and phosphate may occur. Also when the pH in the rhizosphere is low compared to the average soil solution pH, competitive adsorption of sulphate and phosphate may play a role in the availability of sorbed phosphate.
100
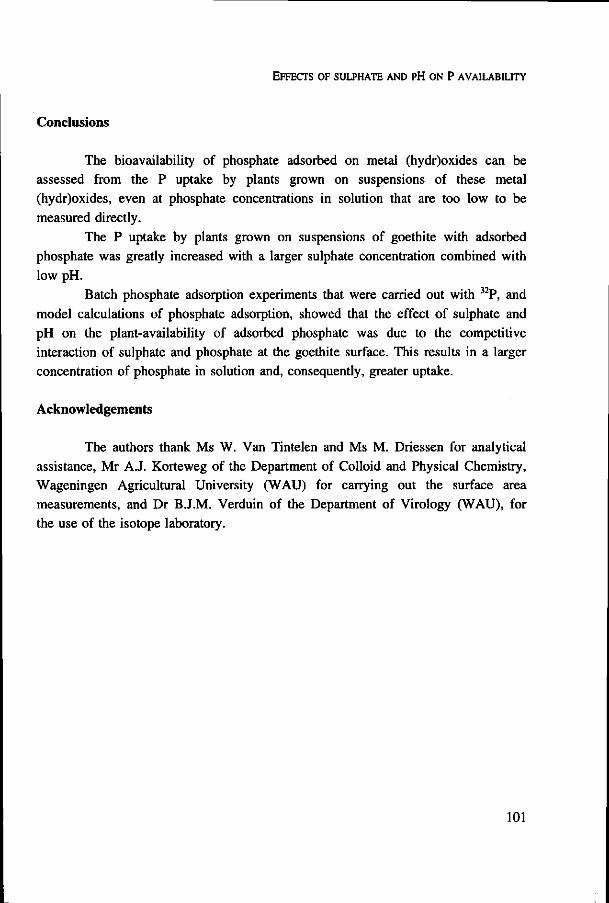
E F F E C T S O F S U L P H A T E A N D P H O N P A V A I L A B I L I T Y
Conclusions
The bioavailability of phosphate adsorbed on metal (hydr)oxides can be assessed from the P uptake by plants grown on suspensions of these metal (hydr)oxides, even at phosphate concentrations in solution that are too low to be measured directly.
The P uptake by plants grown on suspensions of goethite with adsorbed phosphate was greatly increased with a larger sulphate concentration combined with low pH.
Batch phosphate adsorption experiments that were carried out with 32P, and model calculations of phosphate adsorption, showed that the effect of sulphate and pH on the plant-availability of adsorbed phosphate was due to the competitive interaction of sulphate and phosphate at the goethite surface. This results in a larger concentration of phosphate in solution and, consequently, greater uptake.
Acknowledgements
The authors thank Ms W. Van Tintelen and Ms M. Driessen for analytical assistance, Mr A.J. Korteweg of the Department of Colloid and Physical Chemistry, Wageningen Agricultural University (WAU) for carrying out the surface area measurements, and Dr B.J.M. Verduin of the Department of Virology (WAU), for the use of the isotope laboratory.
101
Competitive interaction between phosphate and citrate
on goethite

Jeanine S. Geelhoed, Tjisse Hiemstra and Willem H. Van Riemsdijk
Accepted for publication in Environmental Science and Technology

Competitive interaction between phosphate and citrate on goethite
Interaction between various species in natural systems may affect the adsorption of these species, and thereby their mobility and bioavailability. Recently an ion adsorption model has been developed, based on the surface structure of metal (hydr)oxides and the structure of surface complexes identified by spectroscopy. This model has been applied to the adsorption of phosphate and weak organic acids on goethite in single anion systems. We studied the interaction between phosphate and citrate on goethite, which may contribute to a better understanding of the competitive binding of phosphate and organic matter in natural systems. Citrate adsorption in the presence of phosphate decreased strongly over a wide pH range, whereas phosphate adsorption was only affected at pH values below 7, with the largest interaction around pH 4.5-5. Competition for binding sites appeared to be an important factor determining the competitive adsorption of phosphate and citrate, when taking into account that a larger number of surface groups is involved in the complexation of citrate compared with phosphate. Competitive adsorption was predicted satisfactorily by applying model parameters from the single anion experiments, using surface complexes coordinated to 3 or 4 surface groups for citrate and to 1 or 2 surface groups for phosphate.
Introduction
The sorption of phosphate on metal (hydr)oxides in soils and sediments
influences the mobility and bioavailability of phosphate in terrestrial and aquatic
systems. Organic matter present in these systems may interact with metal
(hydr)oxides, thereby changing the sorption characteristics of metal (hydr)oxide
surfaces. Natural organic matter and humics isolated from aquatic systems were
shown to compete with phosphate for sorption on iron (hydr)oxides (Tipping, 1981;
Hawke et al., 1989; Gu et al., 1994).
Sorption of natural organic matter on iron oxides is dominated by ligand
exchange between carboxyl/hydroxyl groups and oxygen/water groups at the surface
(Gu et al., 1994), a binding mechanism which has also been demonstrated for small
organic acids (Cornell and Schindler, 1980; Tejedor-Tejedor et al., 1992). Therefore,
studying the influence of small organic acids on phosphate adsorption might provide
a better understanding of the interaction of organic matter and phosphate on metal
(hydr)oxides.
In soils, such small organic acids may be present because they may be
released by roots and microorganisms, and by the decomposition of organic matter
(Hoffland et al., 1989; Leyval and Berthelin, 1989; Afïf et al., 1995). In the
presence of small organic acids an increase in the mobilization of phosphate was
105

CHAPTER 6
observed for soils with a high content of Fe and Al (hydr)oxides on which phosphate was sorbed (Earl et al., 1979; Lopez-Hernandez et al., 1979, 1986; Hue, 1991; Gerke, 1992; Afif et al., 1995). The effectiveness by which phosphate is desorbed from soils and metal (hydr)oxides depends on the number of carboxyl groups of the acids. However, on the pH dependent competitive interaction between phosphate and organic acids/anions on metal (hydr)oxides only few data are available (Nagarajah et al., 1970; Parfitt, 1979; Hue, 1991; Violante et al., 1991). In this study, we examine the competitive adsorption of phosphate and citrate on goethite, and the influence of pH and the anion concentrations on the competition.
Infrared spectroscopy studies of the binding of citrate on goethite showed that the three carboxyl groups of citrate are all involved in the coordination to the surface (Cornell and Schindler, 1980). In a study in which the adsorption behaviour of different small organic acids on goethite was compared, citrate was assumed to be bound as a bidentate complex and, in addition, by hydrogen bonds between surface groups and the remaining carboxyl groups. This results in the complexation of citrate with three or four surface groups of goethite (Filius et al., 1997).
The simultaneous adsorption of citrate and phosphate on goethite can be predicted with the CD-MUSIC surface complexation model (Hiemstra and Van Riemsdijk, 1996). The model uses surface complexes proposed from spectroscopy studies and is based on a reasonable approximation of the surface structure of goethite. In this study, the surface complexes and model parameter values that were successfully used to describe the adsorption of citrate and phosphate on goethite in single anion systems (Filius et al., 1997; Geelhoed et al., 1997a) are used as a starting point.
Materials and methods
The used goethite had a BET specific surface area of 96.4 m2 g"1 and a pristine point of zero charge (PPZC) of 9.2 (goethite I: Geelhoed et al., 1997a). The pH-dependent adsorption of citrate and phosphate on goethite was determined in batch adsorption experiments in 0.01 M KN03. All solutions were prepared with distilled demineralized water and stored in plastic to avoid contamination with silica. The amounts of added goethite suspension, phosphate and citrate solution were determined by weighing. When phosphate and citrate were added simultaneously, the suspensions were equilibrated for 20 h in an end-over-end shaker, after which
106

INTERACTION BETWEEN PHOSPHATE AND CITRATE ON GOETHITE
the pHs were determined and the suspensions centrifuged. When the influence of the order of addition of phosphate and citrate was studied, phosphate was added 24 h after citrate, or vice versa, and the suspensions were equilibrated for another 20 h. The adsorption of phosphate and citrate was calculated from the difference in the initial total concentration of the anion in the system and the final concentration in solution. The concentrations mentioned below are initial total concentrations in the system.
The adsorption of citrate was determined at HO"3 M with a goethite suspension density of 4 g l"1 and at 1-10"4 M citrate with 0.5 g goethite 1'. For the latter citrate:goethite ratio, citrate adsorption was also determined in the presence of 1-10"4 and 6.5-10s M phosphate. The citrate concentration in solution was calculated from the measured dissolved organic carbon concentration (Skalar SK 12).
Phosphate adsorption was determined in the presence of 1-10"4 M citrate at phosphate concentrations of MO"4, 8-10"5 and 6.5-10"5 M with 0.5 g goethite l"1. The phosphate concentration in solution was determined using the malachite green method (Novozamsky et al., 1993) or the molybdenum blue method. At a phosphate concentration of 2.1-10"5 M at 0.2 g goethite 1', phosphate adsorption was determined in the presence of 1*105, 1-10"4 and 1-10"3 M citrate. Per suspension 0.3-5.8 kBq carrier free 32P was added. The influence of the order of addition of phosphate and citrate on phosphate adsorption was studied for 2.1-10"5 M phosphate and 1-10"4 M citrate, using 1.6-3.2 kBq carrier free 32P. After phase separation the 32P concentration in solution was determined using Cerenkov counting, and the 31P concentration in solution was calculated from the 31P:32P ratio corrected for disintegration.
Modelling anion adsorption
The adsorption of phosphate and citrate was modelled using a multi site complexation (MUSIC) approach (Hiemstra and Van Riemsdijk, 1996). The density of the various surface groups is derived from the crystal structure of goethite. The surface groups differ in the coordination with underlying Fe atoms (n), leading to singly (w=l), doubly (n=2) or triply (rc=3) coordinated surface groups. Singly coordinated surface groups are considered to be reactive for protonation and anion adsorption. Doubly coordinated surface groups are uncharged over a wide pH range
107
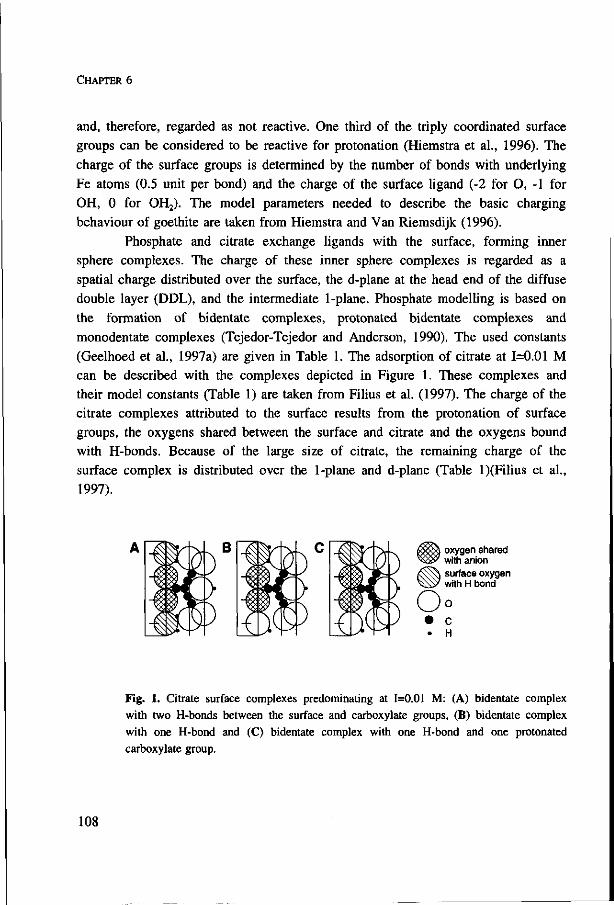
CHAPTER 6
and, therefore, regarded as not reactive. One third of the triply coordinated surface
groups can be considered to be reactive for protonation (Hiemstra et al., 1996). The
charge of the surface groups is determined by the number of bonds with underlying
Fe atoms (0.5 unit per bond) and the charge of the surface ligand (-2 for O, -1 for
OH, 0 for OH2). The model parameters needed to describe the basic charging
behaviour of goethite are taken from Hiemstra and Van Riemsdijk (1996).
Phosphate and citrate exchange ligands with the surface, forming inner
sphere complexes. The charge of these inner sphere complexes is regarded as a
spatial charge distributed over the surface, the d-plane at the head end of the diffuse
double layer (DDL), and the intermediate 1-plane. Phosphate modelling is based on
the formation of bidentate complexes, protonated bidentate complexes and
monodentate complexes (Tejedor-Tejedor and Anderson, 1990). The used constants
(Geelhoed et al., 1997a) are given in Table 1. The adsorption of citrate at 1=0.01 M
can be described with the complexes depicted in Figure 1. These complexes and
their model constants (Table 1) are taken from Filius et al. (1997). The charge of the
citrate complexes attributed to the surface results from the protonation of surface
groups, the oxygens shared between the surface and citrate and the oxygens bound
with H-bonds. Because of the large size of citrate, the remaining charge of the
surface complex is distributed over the 1-plane and d-plane (Table l)(Filius et al.,
1997).
oxygen shared with anion surface oxygen with H bond
O
Fig. 1. Citrate surface complexes predominating at 1=0.01 M: (A) bidentate complex with two H-bonds between the surface and carboxylate groups, (B) bidentate complex with one H-bond and (C) bidentate complex with one H-bond and one protonated carboxylate group.
108
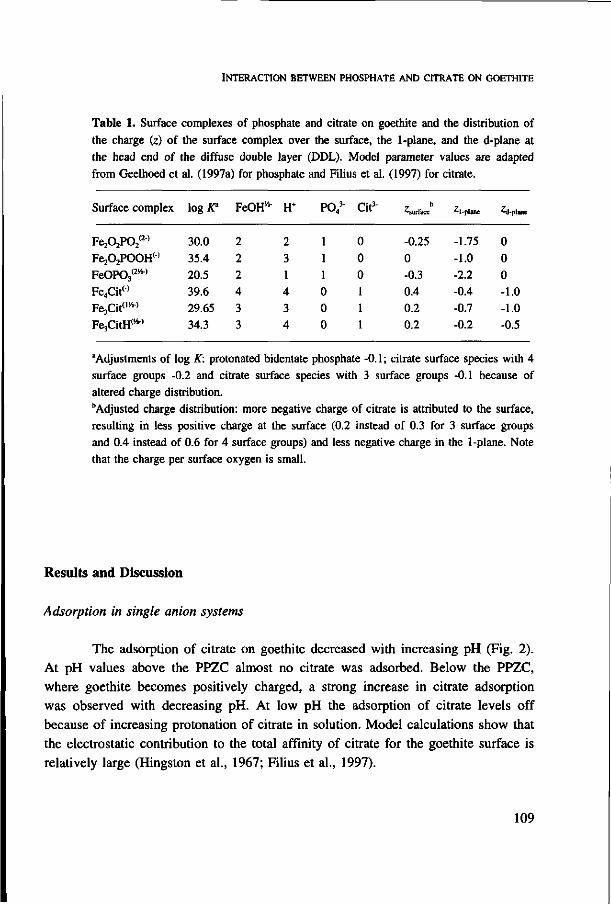
INTERACTION BETWEEN PHOSPHATE AND CITRATE ON GOETHITE
Table 1. Surface complexes of phosphate and citrate on goethite and the distribution of
the charge (z) of the surface complex over the surface, the 1-plane, and the d-plane at
the head end of the diffuse double layer (DDL). Model parameter values are adapted
from Geelhoed et al. (1997a) for phosphate and Filius et al. (1997) for citrate.
Surface complex
FeAPO;/2-» Fe202POOH(-)
FeOP03(2!W
Fe4Cit° Fe3Cit(nw
FejCitrf*0
log/T
30.0 35.4
20.5 39.6 29.65 34.3
FeOH^
2
2 2 4
3 3
H+
2
3 1 4 3 4
P043"
1 1 1
0 0 0
Cit3-
0 0 0 1 1 1
^surface
-0.25
0 -0.3 0.4 0.2 0.2
M -plane
-1.75
-1.0 -2.2 -0.4 -0.7 -0.2
£<l-pluie
0
0 0 -1.0 -1.0 -0.5
"Adjustments of log K: protonated bidentate phosphate -0.1 ; citrate surface species with 4 surface groups -0.2 and citrate surface species with 3 surface groups -0.1 because of altered charge distribution. bAdjusted charge distribution: more negative charge of citrate is attributed to the surface, resulting in less positive charge at the surface (0.2 instead of 0.3 for 3 surface groups and 0.4 instead of 0.6 for 4 surface groups) and less negative charge in the 1-plane. Note that the charge per surface oxygen is small.
Results and Discussion
Adsorption in single anion systems
The adsorption of citrate on goethite decreased with increasing pH (Fig. 2).
At pH values above the PPZC almost no citrate was adsorbed. Below the PPZC,
where goethite becomes positively charged, a strong increase in citrate adsorption
was observed with decreasing pH. At low pH the adsorption of citrate levels off
because of increasing protonation of citrate in solution. Model calculations show that
the electrostatic contribution to the total affinity of citrate for the goethite surface is
relatively large (Hingston et al., 1967; Filius et al., 1997).
109

CHAPTER 6
2.0
CM
'E1.5 o e •o Ë 1.0 o CO
CO
CD
]3 0.5
Ö
o o °ö--. '•••-. • Q •••-.
'•€»'••
citrate goethite (M) (gr1)
- • 1.10"3 4.0 o 1.10"4 0.5
i i
0.01 M KN03
\ è.
• • • . • .
.-••0 • 10
PH
Fig. 2. Citrate adsorption on goethite at two citrate:goethite ratios. Citrate adsorption was modelled using the model parameter values of Filius et al. (1997).
The adsorption of phosphate and citrate in single anion systems at equal initial total concentrations is shown in Fig. 3 (open symbols). Comparing the adsorption of phosphate and citrate at high pH (pH=PPZC) shows that phosphate is adsorbed in considerable amounts, whereas citrate is not adsorbed. This illustrates that phosphate has a much larger intrinsic affinity for the goethite surface than citrate. At low pH the adsorption of citrate is also smaller than the adsorption of phosphate, but this can be explained from the larger number of surface groups involved in the adsorption of citrate compared with phosphate. Phosphate is predominantly adsorbed as bidentate surface complexes. Model calculations for citrate adsorption at low pH indicate about 70% of the surface complexes is of type A (Fig. 1), in which citrate is coordinated to four surface groups. The resulting predicted number of occupied surface groups at pH 3 in Fig. 3 is 4.1 umol m~2 for phosphate and 5.1 umol m"2 for citrate. Compared with the total number of reactive surface groups of 5.7 umol m"2, this shows that the surface coverage of goethite with citrate can become very high.
110
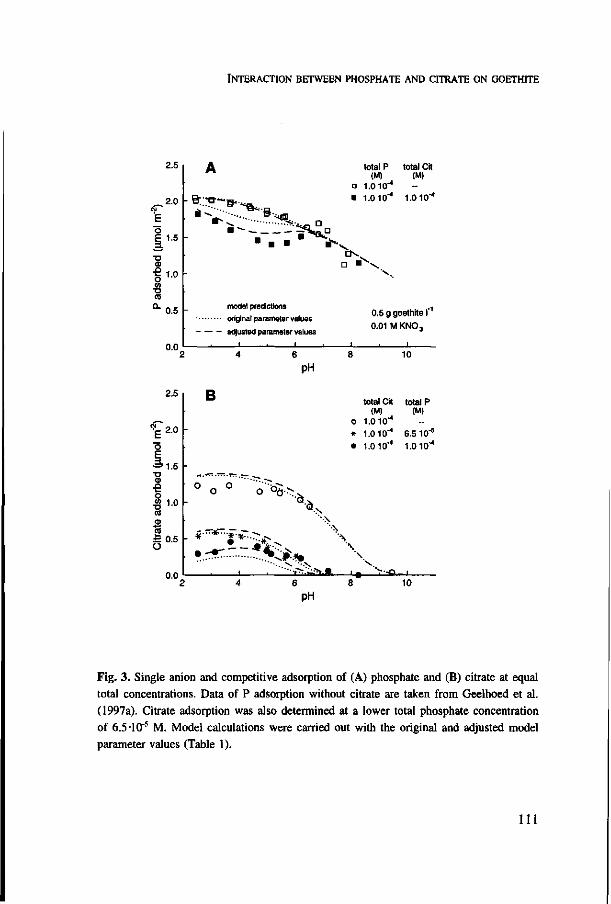
INTERACTION BETWEEN PHOSPHATE AND CITRATE ON GOETHITE
2.5
E
1.5 -
1.0
0.5
0.0
itiTT-B-*&*
total P total Cil (M) (M)
a 1.0 10"4
• 1.0 10"4 1.0 10"4
8 '*i£m
a
D •
model predictions
original parameter values
adjusted parameter values
I i I
0.5 g goethite f '
0.01 M KNO,
6 10 PH
O
2.5
2.0
1.5
1.0
0.5
n n
B o * •
° o ° o -Cfe .^
• \
- i -*- \
total Cit (M)
1.0 10"4
1.0 10"4
1.0 10""
- ^ - - - - • t - N \ • • • • • > ' • • > •
. 1 . " , , > ' : : ^ ' s - ^ L« v .
. >-o.
total P (M)
__ 6.5 10"5
1.0 10 -4
. 1
10
pH
Fig. 3. Single anion and competitive adsorption of (A) phosphate and (B) citrate at equal total concentrations. Data of P adsorption without citrate are taken from Geelhoed et al. (1997a). Citrate adsorption was also determined at a lower total phosphate concentration of 6.5-10"5 M. Model calculations were carried out with the original and adjusted model parameter values (Table 1).
I l l

CHAPTER 6
Adsorption in competitive systems
Anion adsorption in competitive systems is affected directly by competition for surface sites and indirectly by the alteration of the electrostatic charge in the plane of adsorption. The simultaneous addition of citrate and phosphate to goethite resulted in a decrease in the adsorption of both phosphate and citrate (Fig. 3, filled symbols), indicating that phosphate and citrate compete for adsorption on the goethite surface. The adsorption of citrate was strongly decreased over the whole pH range, whereas phosphate adsorption was only affected below pH 7, an effect that is caused by the difference in the intrinsic affinities.
The surface coverage of goethite in the single anion experiments was high, which implies that direct competition for binding sites must take place. For the conditions in Fig. 3, the decrease in the adsorption of citrate can largely be explained from nonelectrostatic site competition. At pH 4 phosphate adsorption amounts to 1.6 umol m"2. Due to the difference in the number of surface groups involved in surface complexation this would lead to a decrease in the adsorption of citrate with about 0.9 umol m"2, which is close to what was observed experimentally. When a smaller amount of phosphate is present in the mixed system (Fig. 3), the decrease in citrate adsorption caused by competition is less. The decrease in the adsorption of phosphate due to the presence of citrate was smaller than expected from direct site competition, indicating the influence of electrostatic interaction.
The influence of electrostatic interaction is also demonstrated by the results of the model calculations. Using the original model parameter values (Filius et al., 1997; Geelhoed et al. 1997a), the influence of citrate on phosphate adsorption is underestimated, although the general trend in the pH dependence of competitive adsorption is predicted well (Fig. 3). The competitive interaction between phosphate and citrate on goethite was enlarged by changing the distribution of charge of citrate. A small amount of negative charge, -0.1 valence unit, was shifted from the 1-plane to the surface and the corresponding log K values were adjusted because of this (Table 1). Consequently, the contribution of the electrostatic energy to the total affinity of the surface complexes changed, leading to a lower adsorption of protonated phosphate bidentate complexes. The adsorption of phosphate was further reduced by decreasing the intrinsic affinity constant of the protonated bidentate phosphate complex by 0.1 log K unit. With the adjusted parameter values the data of single anion adsorption (Hiemstra and Van Riemsdijk, 1996; Filius et al., 1997;
112

INTERACTION BETWEEN PHOSPHATE AND CITRATE ON GOETHITE
Geelhoed et al., 1997a) and adsorption interactions (Geelhoed et al., 1997a; Venema
et al., 1997) are still described well.
The effect of citrate on phosphate adsorption at various phosphate loadings
of goethite is shown in Fig. 4. With decreasing phosphate loading of goethite, the
effect of the presence of citrate on the amount of phosphate adsorbed becomes less.
This may be attributable to a decreasing competition for binding sites, because a
smaller part of the surface is covered with phosphate. Figure 5A shows that the
presence of larger total concentrations of citrate increases the competitive interaction
with phosphate. The increase in the phosphate concentration in solution caused by
the competitive adsorption of citrate and phosphate is shown in Fig. 5B. At the
relatively low phosphate loading of goethite in this experiment, citrate had a very
large effect on the phosphate concentration in solution. The phosphate concentration
in solution increased 300-600 fold in the presence of a total concentration of 0.1-1
mM citrate at pH 4. Even the presence of a low total concentration of citrate (1-10"5
M) resulted in an increase of the phosphate concentration in solution at low pH. The
effect of the order of addition of phosphate and citrate on the phosphate
concentration in solution, particularly when compared with the effect of competition,
was relatively small (Fig. 5B).
2.5
2.0
o E 1.5
•a •e o O)
T> ra o.
1.0
0.5
0.0
Û - ,
-o-o-' «"»• • j i_ .mlcLP
p (M)
• 1.0 10 • 8.0 10"5
o 6.510"^ • 2.1 10
~~%
goethite (gr1) 0.5 0.5 0.5 0.2
0.01 M KN03
1.10"4 M citrate
10
PH
Fig. 4. Phosphate adsorption on goethite at different phosphate loading in the presence of an initial total concentration of 1-10"4 M citrate. Lines indicate model calculations in the presence (dashed lines) and in the absence of citrate (dotted lines).
113

CHAPTER 6
1.2
0.8 -
•o 0.6 <D
. Q 1_
o » 0 . 4 co
0.2 -
A
\ A
_
P (M)
• 2.1 10'6
- • 2.1 10"! A 2.1 10
- « ^ ' — ' — " * • * :
_•-#''?' . * ' ' __ X
citrate (M)
I -K>: i - io : 1.10
1
• •N .
• • •
*
0.2 g goethite I'1
0.01 M KNO3 1 1
A
10
pH
10
1
0.1
0.01
B
A* N'W O * «»^v. -? • _ é
/ Hi.
: • • /" " /
• a 0 .' 0
••• ' " 1 • 1
a
• • 0
* A
P (M)
2.2 10'5
.5 2.1 10 2.1 10
citrate (M)
-5 1.10 , L iu " 4
Cit added 24 h before P P added 24 h before Cit
-5 2.1 10
-3 1.10
1
10
pH
Fig. 5. Influence of the initial total concentration of citrate on (A) the amount of phosphate adsorbed and (B) the phosphate concentration in solution. Also the measured phosphate concentration in solution in the absence of citrate is shown (data Geelhoed et al., 1997a) and for 1-10"4 M citrate the effect of different orders of addition is indicated. Lines indicate model calculations in the presence (dashed lines) and in the absence of citrate (dotted lines).
114
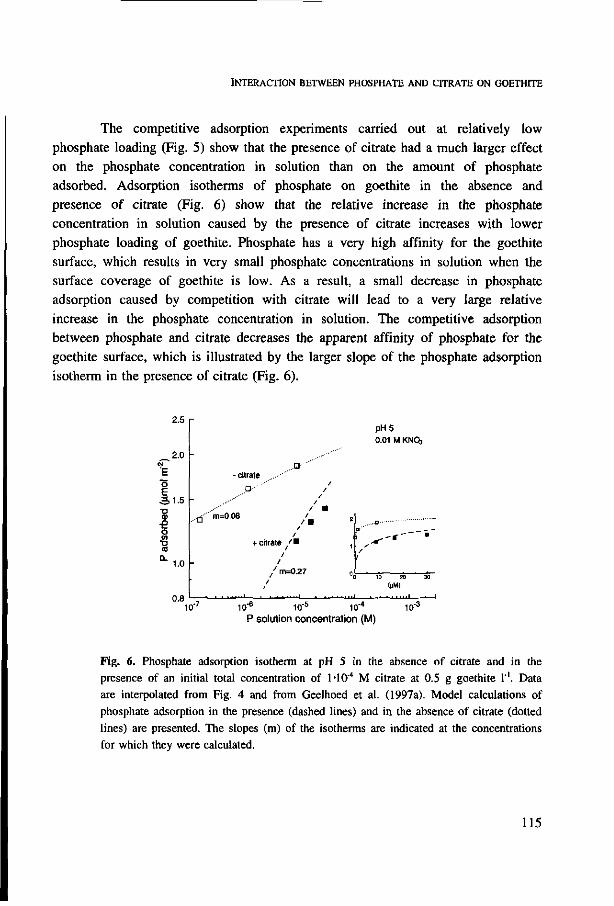
INTERACTION BETWEEN PHOSPHATE AND CITRATE ON GOETHITE
The competitive adsorption experiments carried out at relatively low phosphate loading (Fig. 5) show that the presence of citrate had a much larger effect on the phosphate concentration in solution than on the amount of phosphate adsorbed. Adsorption isotherms of phosphate on goethite in the absence and presence of citrate (Fig. 6) show that the relative increase in the phosphate concentration in solution caused by the presence of citrate increases with lower phosphate loading of goethite. Phosphate has a very high affinity for the goethite surface, which results in very small phosphate concentrations in solution when the surface coverage of goethite is low. As a result, a small decrease in phosphate adsorption caused by competition with citrate will lead to a very large relative increase in the phosphate concentration in solution. The competitive adsorption between phosphate and citrate decreases the apparent affinity of phosphate for the goethite surface, which is illustrated by the larger slope of the phosphate adsorption isotherm in the presence of citrate (Fig. 6).
2.5
~ 2 0 CM
'E o 31.5 •Ö
€ o
1.0
0.8
.-ti'
-citrate
P"""" / /
m=0.08 / / • / / + citrate ' •
/ / / m=0.27
/ / / m
2
1
U
p H 5 0.01 M KNCb
O"" — — -
10 20 30
(|lM)
I • 1
10"3 IQ"" 10"J
P solution concentration (M)
Fig. 6. Phosphate adsorption isotherm at pH 5 in the absence of citrate and in the presence of an initial total concentration of 1-10"4 M citrate at 0.5 g goethite l ' . Data are interpolated from Fig. 4 and from Geelhoed et al. (1997a). Model calculations of phosphate adsorption in the presence (dashed lines) and in the absence of citrate (dotted lines) are presented. The slopes (m) of the isotherms are indicated at the concentrations for which they were calculated.
115

CHAPTER 6
Environmental implications
In natural systems the phosphate concentration in solution is generally low. Our experiments show that under these conditions competition between phosphate and organic compounds may result in a very large increase in the phosphate concentration in solution (Fig. 6). The mobility and bioavailability of phosphate are directly related to the phosphate concentration in solution (Geelhoed et al., 1997d) and will, therefore, increase strongly as a result of competitive adsorption.
The adsorption mechanisms of natural organic matter and small organic anions are similar (Gu et al., 1994), which implies the mechanisms that determine competitive adsorption may be comparable as well. Competition for binding sites appeared to play an important role in the competitive interaction between phosphate and citrate. For organic compounds like humic and fulvic acids a large number of surface groups may be involved in the coordination to the surface, which suggests that these compounds can compete relatively strongly with anions like phosphate.
The presence of natural organic matter is likely to decrease the affinity of phosphate for adsorption on metal (hydr)oxides by competitive adsorption. Therefore, it is essential to take the competitive interaction of phosphate and organic matter into account in the modelling of the bioavailability and mobility of phosphate in natural systems.
Acknowledgements We thank Dr. B.J.M. Verduin of the Dept. of Virology, Wageningen
Agricultural University, for the use of the isotope laboratory, Mr. AJ. Korteweg, Dept. of Physical and Colloid Chemistry (WAU), for carrying out the BET surface area measurements, and Mr. R.P.J.J. Rietra for performing the Potentiometrie titrations of goethite.
116

Simulation of the effect of citrate exudation from roots on the
plant-availability of phosphate adsorbed on goethite

Jeanine S. Geelhoed, Willem H. Van Riemsdijk and Günter R. Findenegg

Simulation of the effect of citrate exudation from roots on the
plant-availability of phosphate adsorbed on goethite
Small scale rhizosphere processes strongly influence the availability of phosphorus (P) to plants. Organic anions, such as citrate, compete with phosphate for adsorption on metal (hydr)oxides, thereby affecting P mobility and plant-availability. The effect of citrate exudation from roots on P availability is predicted by combining a nutrient uptake model with an ion adsorption model. In previous studies both models have been tested, yielding good agreement between modelled and observed data. Citrate exudation rates for P deficient plants were obtained from literature. With higher rates of citrate exudation, larger P availability is predicted. Exudation of 5 nmol citrate cm"1 root day"1 increases P availability almost 2-fold at relatively high (1.9 |imol m"2) and even 30-fold at relatively low phosphate loading of goethite (1.3 umol m"2), because competitive adsorption results in a much larger relative increase in the phosphate concentration in solution at low than at high loading. Acidification of the rhizosphere during citrate exudation results in a smaller P mobilization than citrate exudation at a fixed pH 5, on account of the pH dependence of phosphate adsorption in the presence of citrate. Low P loading and a large reactive surface area result in high citrate sorption, which increases the persistence of citrate against microbial degradation.
Introduction
As a response to phosphorus deficiency, a number of plant species excrete
small organic acids or anions from their roots, and this has been shown to result in a
mobilization of phosphate and an enhanced P uptake by the plants. Well-known
examples of such plant species are white lupins, crucifers like rape and mustard and
some legumes (Dinkelaker et al., 1989; Hoffland et al., 1989; Gerke and Meyer,
1995; Li et al., 1997b). Of the exuded small organic acids, citrate, malate, oxalate,
succinate and fumarate are quantitatively the most important (Lipton et al., 1987;
Ohwaki and Hirata, 1992; Ström et al., 1994; Gerke and Meyer, 1995).
The rate of organic acid exudation depends on the root system and the
position along the root. Large accumulation of citrate as calcium citrate occurred in
the rhizosphere of proteoid roots of white lupin (Dinkelaker et al., 1989). Exudation
rates of rape roots were larger just behind the root tip than at the root base
(Hoffland et al., 1989). Furthermore, the mechanism of exudation may differ
between plant species. For white lupin, red clover and rape, an acidification of the
rhizosphere soil was observed suggesting organic anions are excreted concomitantly
with protons, whereas the rhizosphere of black mustard was not acidified
119

CHAPTER 7
(Dinkelaker et al., 1989; Hoffland et al., 1989; Gerke and Meyer, 1995). The persistence of citrate in soil may be limited because small organic
compounds are readily used by soil microorganisms (Bowen and Rovira, 1991). However, citrate has been shown to persist in soil over 90 days after addition. During this time, more phosphate was mobilized than without citrate addition (Gerke, 1992). Jones and Edwards (1998) showed that the degradation of citrate is strongly retarded by the addition of iron hydroxide. The kinetics of malate degradation in soil and in solution only agree when malate sorption is taken into account (Jones et al., 1996b). These results indicate that organic carbon substrates are only available for degradation after desorption, in agreement to what has been suggested for the biodégradation of organic pollutants (Ogram et al., 1985; Robinson et al., 1990).
The mobilization of phosphate from soils in the presence of organic anions is attributable to the enhanced dissolution of P-minerals caused by complexation of Ca, Fe and Al and to the competitive adsorption of phosphate and organic anions on metal (hydr)oxides (Bolan et al., 1997). The influence of pH on P mobilization in soils is complex, because different soil P forms may react differently to pH. A decrease in pH was shown to have a positive, negative or no effect on P mobilization by organic anions from soils and metal (hydr)oxides (Bolan et al., 1994; Gerke and Meyer, 1995; Staunton and Leprince, 1996; Geelhoed et al., 1998). The relative effect of different organic anions on the mobilization of phosphate from soils and metal (hydr)oxides increases with the number of carboxylate groups of the anion (Nagarajah et al., 1970; Hue, 1991; Bolan et al., 1994; Staunton and Leprince, 1996). Of the organic anions exuded by plant roots, citrate is therefore assumed to be the most effective in increasing P availability.
In the present study we quantitatively evaluate the effect of citrate exudation from roots on the mobilization and plant-availability of phosphate adsorbed on goethite, an important iron oxide in soils. For this, information on the adsorption behaviour of phosphate on goethite and the effect of citrate and pH on P adsorption is needed. Furthermore, a model will be used to relate P sorption in rhizosphere soil, influenced by citrate exudation from roots and pH, to P uptake by plants.
Previous adsorption studies with phosphate and citrate on goethite showed that citrate and phosphate compete for adsorption. The presence of citrate decreased the adsorption of phosphate at pH values below 7. At about pH 4.5-5 the interaction between phosphate and citrate was strongest (Geelhoed et al., 1998). Due to
120

E F F E C T O F C I T R A T E E X U D A T I O N F R O M R O O T S O N P A V A I L A B I L I T Y
competitive adsorption the phosphate concentration in solution increases, which will result in an enlarged bioavailability of phosphate (Geelhoed et al., 1997d). The pH-dependent competitive adsorption of phosphate and citrate could be predicted well with the CD-MUSIC ion adsorption model (Hiemstra and Van Riemsdijk, 1996; Geelhoed et al., 1998).
The plant-availability of phosphate is considered to equal the P uptake of plants when the uptake capacity of the roots is not limiting uptake. In a previous paper we showed that plant P uptake at these conditions can be accurately predicted assuming non linear reversible P sorption and zero sink behaviour of the root surface (Geelhoed et al., 1997c). The uptake model is combined with the ion adsorption model, to compute the distribution of phosphate and citrate over the solid and solution phase. The influence of citrate exudation rate, degradation of citrate, rhizosphere pH and phosphate content on the availability of phosphate is examined.
Model description
Ion adsorption model
The speciation of the components phosphate, citrate and H is calculated using the CD-MUSIC model (Hiemstra and Van Riemsdijk, 1996). This model is based on a reasonable approximation of the goethite surface and of surface complexes identified using spectroscopic methods. For surface reactions of the components with goethite, two types of reactive surface groups on goethite have been distinguished. Singly coordinated surface groups, which are coordinated to one Fe atom in the goethite crystal, may react with protons, phosphate and citrate. Furthermore, part of the triply coordinated surface groups, that are coordinated to three Fe atoms, may protonate (Hiemstra and Van Riemsdijk, 1996).
In the model the solution speciation of phosphate, citrate and H is taken into account. A total concentration of 0.01 M KN03 is considered as a background electrolyte. The reactions that we use to describe the binding of protons, electrolyte ions, phosphate and citrate are listed in Table 1. Phosphate may form inner sphere complexes with 1 or 2 surface groups, whereas citrate is assumed to be bound as a bidentate inner sphere complex and, in addition, by 1 or 2 H-bonds between the surface and carboxyl groups. The charge of the surface complexes is distributed over the adsorbing surface, the head end of the diffuse double layer and the intermediate
121

CHAPTER 7
1-plane (Filius et al., 1997; Geelhoed et al., 1997a, 1998).
The distribution of the components over the solid and solution phase can be
computed from the total component concentrations, but it is also possible to
compute the speciation of phosphate and citrate at a fixed pH.
Table 1. Surface speciation in the modelled system. Protonation and ion pair formation with singly (FeOH''*') and triply (Fe3O
w) coordinated surface groups', inner sphere complexation of phosphate and citrate with singly coordinated surface groups. The charge of these complexes is distributed over the surface, the plane at the head end of the diffuse double layer and the intermediate l-planeb (Geelhoed et al., 1998).
Surface speciation
FeOH* + H+
Fe30'/i- + H+
FeOH* + K+
Fe3Ow- + K+
FeOH2,At + NO,"
Fe3OH,A+ + N03-FeOH* + H+ + PO<
2 FeOH*' + 2 H+ + 2 FeOH* + 3 H+ + 4 FeOH* + 4 H+ + 3 FeOH* + 3 H+ + 3 FeOH* + 4 H+ +
3-
PO 43
P O 4V
cit3-cit3-cit3-
* F eOH^ « Fe^OH'^
* FeOHw-K+
« Fe30"'-K+
* FeOH2*+-N03-
* Fe3OH,/4t-N03-- FeOP03
2'^ + H20
« Fe202P022- + 2 H20
<* Fe202POOH + 2 H20 «* Fe4Cif + 2 H20 - Fe3CitI!t + 2 H20
- Fe3CitHw- + 2 H20
l o g *
9.2 9.2 -1
-1
8.2 8.2
20.5
30.0 35.4 39.6 29.65 34.3
Charge distribution
^surface
0.5 0.5 0
0 1
1
-0.3 -0.25
0 0.4
0.2 0.2
M -plane
0 0 0
0 0
0 -2.2
-1.75 -1 -0.4
-0.7 -0.2
^heacl DDL
0 0 1
1
-1 -1
0
0 0 -1 -1 -0.5
a Density of surface groups: singly coordinated 5.7 and triply coordinated 4.5 |imol m'2. b Capacitance of inner layer 1.1 F m2 and of outer layer 5.0 F m'2.
122
EFFECT OF CITRATE EXUDATION FROM ROOTS ON P AVAILABILITY
Uptake model
Model calculations of uptake are carried out for a single root surrounded by
a cylindrical volume of homogeneous soil. Because we are interested in the
availability of phosphate for uptake, we assume that the roots are capable of taking
up all phosphate that is transported to the root surface, i.e. the root is assumed to
behave as a zero sink (Geelhoed et al., 1997b). Root hairs are not taken into account
because this would require a very fine discretization of the soil volume and much
longer computation time. The transport of phosphate, citrate and protons in the soil
is assumed to be by diffusion and mass flow in radial direction only. The used
symbols are explained in Table 2.
For dissolved phosphate species the diffusion coefficient in water (D0) of
H2P04" is used, and for citrate species the D0 of H2Cit, because the diffusion
coefficients of some other phosphate and citrate solution species were not available.
The effective diffusion coefficient of a component in soil is calculated as (Nye,
1966b)
clf' b
Buffering is calculated as
dC, dC
b. = = e + _ ± , (2) ' d C i d C i
in which dCsi /dCu is the slope of the sorption isotherm. The distribution of the
components over the solid and the solution phase is computed each time step using
the ion adsorption model.
The continuity equation in cylindrical coordinates (r,z) may be written as
' dt r dr oJdr ° ° '• '
With the term s, a sink or source of the component can be introduced into the
continuity equation.
123

CHAPTER 7
Table 2. Symbols used.
Symbol Definition Dimension
A, Drl
L r
r0
r,
t
", v0
e
p
buffering
concentration of dissolved component
concentration of sorbed component
total concentration of component
diffusion coefficient of component in water
effective diffusion coefficient of component
tortuosity factor
indicator for component
influx of phosphate
degradation rate of citrate in solution
root density
radial distance root radius
outer boundary of cylindrical soil volume
source or sink of component time
exudation rate
water flux at the root surface volumetric moisture content
dry bulk density
m3 solution m"3 soil
mol m"3 solution
mol m3 soil
mol m"3 soil
m2 day"1
m2 day"1
mol m"2 day"1
day"1
m m"3 soil m
m
m
mol m"3 soil day"' day
mol m"1 root day'1
m3 m"2 day"1
m3 solution m"3 soil kg m"3 soil
The following initial conditions apply to Equation (3)
C =C ^ 1 , '•'l.initial/
(4)
Because of the imposed zero sink condition for P uptake at the root surface,
described with boundary condition:
r = r o C i p= 0 >
the phosphate influx into the root is calculated as:
(5)
124

E F F E C T O F C I T R A T E E X U D A T I O N F R O M R O O T S O N P A V A I L A B I L I T Y
'p = - D o p e / ^ + v 0 c l p u . (6)
The second boundary condition describes the exudation of citrate at the root surface
0 ~W Cit"
For part of the calculations we assume that the pH in the soil is constant. In other calculations we assume a concomitant exudation of citrate and protons, using
r° - a r H ar which results from the exudation of protons and the uptake of H2P04\ the phosphate species taken up by plants (Hendrix, 1967). At the outer boundary of the soil volume, r=rx, a no flux boundary is established
dC.
d; .. „ (9)
In the continuity equation (Equation (3)) for citrate, a source of citrate, sCil, is incorporated which results from exudation of citrate at the root surface (Equation (7)) and the degradation of citrate in soil. It is assumed that only citrate in solution is degradable,
9C'C" = -b k C 0 ° )
In the continuity equation for protons, sH represents the source or sink of protons that is attributable to exudation of protons from the root, degradation of protonated citrate in solution, and uptake of H2P04".
Equation (3) is solved numerically. The soil cylinder surrounding the root with root hairs is divided into 30 concentric layers, that become increasingly thicker further away from the root. With each decreasing step size, computed uptake decreased until computed uptake reached the 'true' solution.
125

CHAPTER 7
Model calculations
Model calculations of P uptake by a unit root length are carried out for a
root that is growing in quartz sand coated with goethite. The phosphate loading of
goethite and the goethite content of the sand is varied (Geelhoed et al., 1997c; Table
3). Reported citrate exudation rates for P-starved plants are 1.6-3.2 and 10.4 nmol
cm'1 root day"1 for rape and 0.14 nmol cm"1 root day"1 for chickpea (Hoffland et al.,
1989, 1992; Ohwaki and Hirata, 1992). In the calculations, we use exudation rates
of 0.5 and 5 nmol cm"' day"1 and assume that initially no citrate is present. Due to
unbalanced ion uptake and exudation of organic acids the pH in the rhizosphere may
change by 1-1.5 pH unit (Nye, 1981; Gerke et al., 1994). We perform model
calculations at a fixed pH of 5 and for the concomitant exudation of citrate and
protons. In one set of calculations we take degradation of dissolved citrate into
account. The degradation rate (kCil=50 day"1) is estimated from measured degradation
of citrate in solution (Jones and Edwards, 1998).
Table 3. Used model parameter values.
root and substrate properties (Geelhoed et al., 1997c): root radius water flux at the root surface tortuosity factor volumetric moisture content dry bulk density
' o
v 0
ƒ e p
0.15 mm
21 mm3 cm"2 day"1
0.089
0.21 1.35 g cm"3
diffusion coefficients in water:
H2Cit"
H+ Do,
0.77 cm2 day"1 (Edwards and Huffman, 1959)
0.70 cm2 day"1 (Muller and Stokes, 1957)
8.12 cm2 day'1 from equivalent mobility
(Owen and Sweeton, 1941)
126
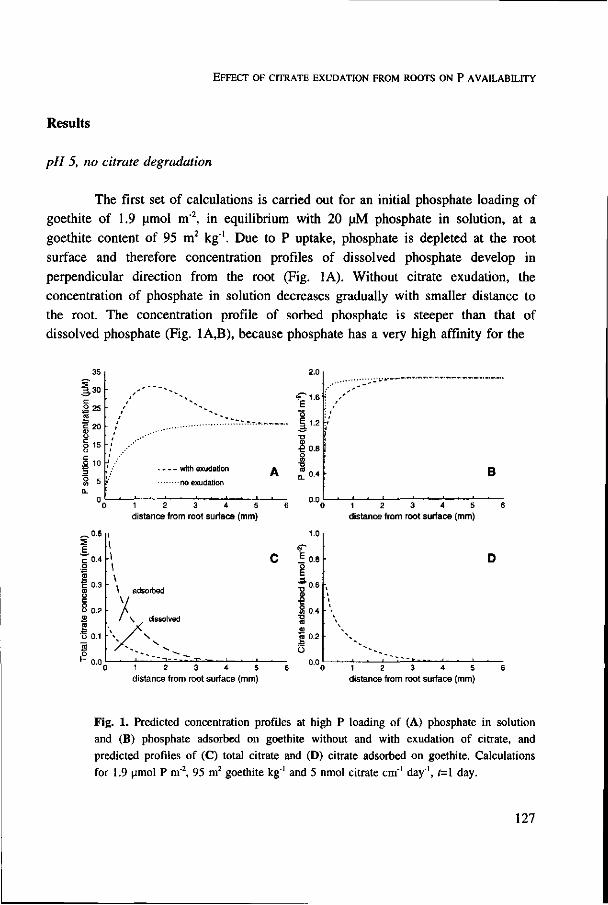
E F F E C T O F C I T R A T E E X U D A T I O N F R O M R O O T S O N P A V A I L A B I L I T Y
Results
pH 5, no citrate degradation
The first set of calculations is carried out for an initial phosphate loading of goethite of 1.9 umol m"2, in equilibrium with 20 uM phosphate in solution, at a goethite content of 95 m2 kg"1. Due to P uptake, phosphate is depleted at the root surface and therefore concentration profiles of dissolved phosphate develop in perpendicular direction from the root (Fig. 1A). Without citrate exudation, the concentration of phosphate in solution decreases gradually with smaller distance to the root. The concentration profile of sorbed phosphate is steeper than that of dissolved phosphate (Fig. 1A,B), because phosphate has a very high affinity for the
.2 25
I20 o O 15
c 0.3
- with exudation
-no exudation
1 2 3 4 5 distance from root surface (mm)
\ \ adsorbed
X \ dissolved
0 1 2 3 4 5 distance from root surface (mm)
o §1.2
C I 0.8 O E "3" n e
S 0.4 "O CO
<u ra 0.2 •
O
0.0
1 2 3 4 5 distance from root surface (mm)
1 2 3 4 5 distance from root surface (mm)
Fig. 1. Predicted concentration profiles at high P loading of (A) phosphate in solution and (B) phosphate adsorbed on goethite without and with exudation of citrate, and predicted profiles of (C) total citrate and (D) citrate adsorbed on goethite. Calculations for 1.9 umol P m"2, 95 m2 goethite kg"' and 5 nmol citrate cm'1 day', f=l day.
127
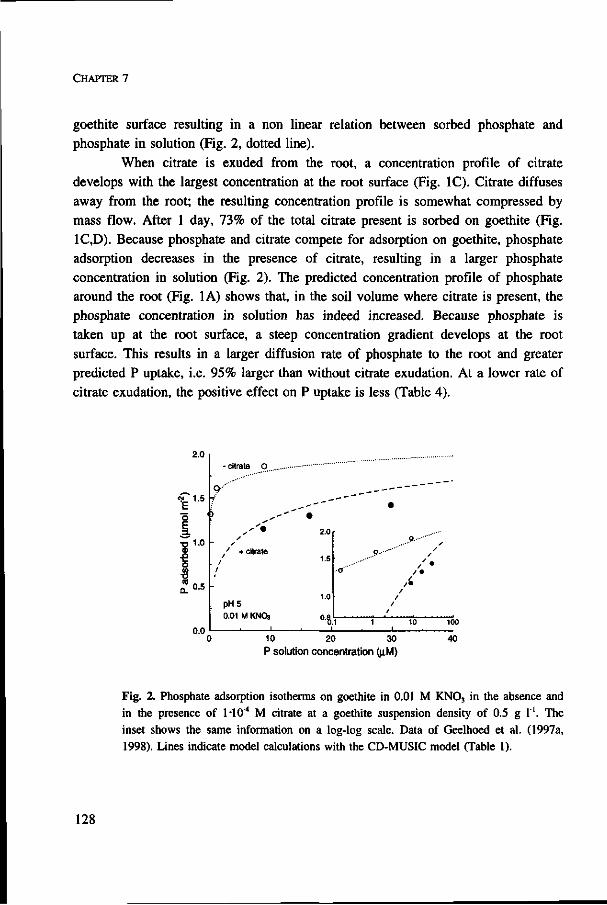
CHAPTER 7
goethite surface resulting in a non linear relation between sorbed phosphate and phosphate in solution (Fig. 2, dotted line).
When citrate is exuded from the root, a concentration profile of citrate develops with the largest concentration at the root surface (Fig. 1C). Citrate diffuses away from the root; the resulting concentration profile is somewhat compressed by mass flow. After 1 day, 73% of the total citrate present is sorbed on goethite (Fig. 1C,D). Because phosphate and citrate compete for adsorption on goethite, phosphate adsorption decreases in the presence of citrate, resulting in a larger phosphate concentration in solution (Fig. 2). The predicted concentration profile of phosphate around the root (Fig. 1A) shows that, in the soil volume where citrate is present, the phosphate concentration in solution has indeed increased. Because phosphate is taken up at the root surface, a steep concentration gradient develops at the root surface. This results in a larger diffusion rate of phosphate to the root and greater predicted P uptake, i.e. 95% larger than without citrate exudation. At a lower rate of citrate exudation, the positive effect on P uptake is less (Table 4).
2.0
<)• 1 .5
•O 1.0 <D
0.5
0.0
?"'"'
) , - ' ' . ' ' •
• •
' + citrate . / /
-PH5 0.01 M KNOa
^"" •
2.0 r
1.6
10
- , .i
• a "
1
_____ - " "
•
Q
9. /
/ /
/ / 1 10 100
10 20 30 P solution concentration (|iM)
40
Fig. 2. Phosphate adsorption isotherms on goethite in 0.01 M KN03 in the absence and in the presence of 1-10"4 M citrate at a goethite suspension density of 0.5 g 1"'. The inset shows the same information on a log-log scale. Data of Geelhoed et al. (1997a, 1998). Lines indicate model calculations with the CD-MUSIC model (Table 1).
128

E F F E C T O F C I T R A T E E X U D A T I O N F R O M R O O T S O N P A V A I L A B I L I T Y
Table 4. Effect of citrate exudation, citrate degradation and pH on predicted P uptake after 1 day for four situations differing in phosphate loading of goethite and goethite content of the sand.
Situation phosphate loading (umol m"2) initial P solution cone. (uM) goethite content (m2 kg"1)
I 1.9 20 95
II 1.3 0.1 95
III 1.9 20 32
IV 1.3 0.1 32
pH5 Citrate exud.
(nmol cm'1 day') 0 0.5
5
0.5 5
Citrate degr
(day1) 0
0 0
50 50
P uptake (nmol cm"1 root)
0.014 0.10 0.40
0.73 0.84
1.23
0.0089 0.074
0.27
0.90 1.07 1.75
0.99 (47a) 0.094 (8) 0.77 (62) 0.063 (16) 1.29 (54) 0.29 (28) 0.91 (65) 0.17 (39)
Citrate invested as % of dry matter increaseb
5 0 5 50
Acidification of rhizosphere Citrate exud.c H exudation
(nmol cm"' day"1) 5 15 5 30
3.4 7.4 5.7
7.3 10.2 16.3
P uptake (nmol cm"1 root)
1.54 0.36 1.17 1.17 0.33 1.05
10.9
17.8
0.28
0.26
a Decrease in effect of citrate exudation on P uptake due to degradation (%) b Dry matter increase resulting from enlarged P uptake caused by citrate exudation, assuming a P
content of 30 umol g"1 dry matter. c No degradation of citrate.
129

CHAPTER 7
Predicted P uptake after 1 day for different treatments is summarized in Table 4. At relatively low phosphate loading of goethite, i.e. 1.3 umol P m"2 citrate exudation caused a 30-fold increase in P uptake. Due to competition between phosphate and citrate, the overall affinity of phosphate for the goethite surface decreases, leading to a larger relative increase in the phosphate concentration in solution with lower phosphate loading of goethite (Fig. 2, inset). Upon citrate exudation from the root the concentration of dissolved phosphate in the rhizosphere increases from its equilibrium concentration in the absence of citrate (0.1 uM) to a maximum of 5.0 uM (Fig. 3A).
h / '
:,7 ;
ii ; ? : i ;
\ \ \ —
\ — \ \ \ \ \ \
0.2 days
1 day 5 days
A
distance from root surface (mm)
0 1 2 3 4 5 distance from root surface (mm)
2.0
"1.6
I 1 2 •o
•S o.B ••!' o ;/ w
"O (Ö '
n 0.4 '
0.20
0.15
0.10
0.05
\ \ \
\ \ •. i \
c
distance from root surface (mm)
CD
g 0.2 O
0.0 1 2 3 4 5 distance from root surface (mm)
Fig. 3. Predicted concentration profiles at low P loading of (A) phosphate in solution, (B) phosphate adsorbed on goethite, (C) citrate in solution and (D) citrate adsorbed on goethite. Calculations for 1.3 umol P m"2, 95 m2 goethite kg' , 5 nmol citrate cm"' day"' and 1=0.2, 1 and 5 days.
130
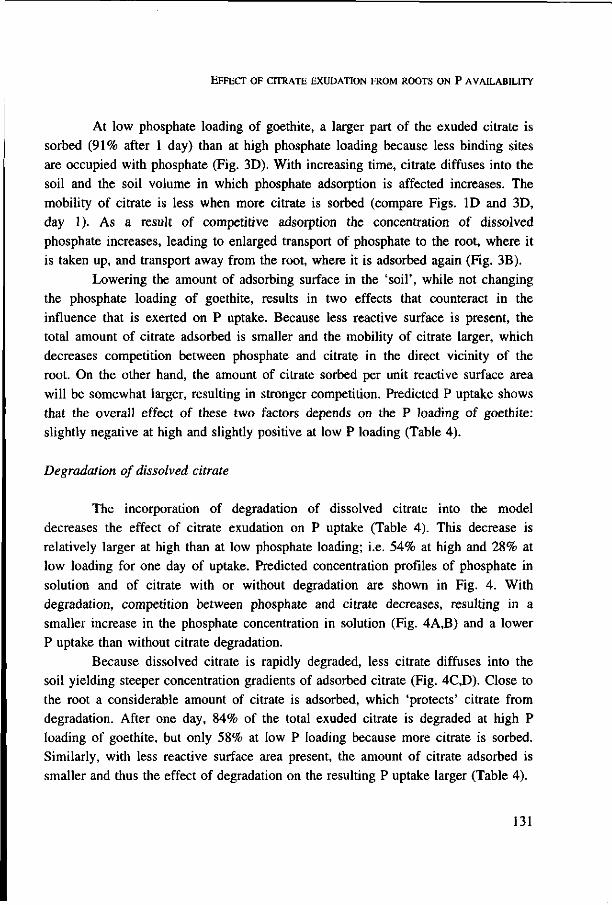
E F F E C T O F C I T R A T E E X U D A T I O N F R O M R O O T S O N P A V A I L A B I L I T Y
At low phosphate loading of goethite, a larger part of the exuded citrate is sorbed (91% after 1 day) than at high phosphate loading because less binding sites are occupied with phosphate (Fig. 3D). With increasing time, citrate diffuses into the soil and the soil volume in which phosphate adsorption is affected increases. The mobility of citrate is less when more citrate is sorbed (compare Figs. ID and 3D, day 1). As a result of competitive adsorption the concentration of dissolved phosphate increases, leading to enlarged transport of phosphate to the root, where it is taken up, and transport away from the root, where it is adsorbed again (Fig. 3B).
Lowering the amount of adsorbing surface in the 'soil', while not changing the phosphate loading of goethite, results in two effects that counteract in the influence that is exerted on P uptake. Because less reactive surface is present, the total amount of citrate adsorbed is smaller and the mobility of citrate larger, which decreases competition between phosphate and citrate in the direct vicinity of the root. On the other hand, the amount of citrate sorbed per unit reactive surface area will be somewhat larger, resulting in stronger competition. Predicted P uptake shows that the overall effect of these two factors depends on the P loading of goethite: slightly negative at high and slightly positive at low P loading (Table 4).
Degradation of dissolved citrate
The incorporation of degradation of dissolved citrate into the model decreases the effect of citrate exudation on P uptake (Table 4). This decrease is relatively larger at high than at low phosphate loading; i.e. 54% at high and 28% at low loading for one day of uptake. Predicted concentration profiles of phosphate in solution and of citrate with or without degradation are shown in Fig. 4. With degradation, competition between phosphate and citrate decreases, resulting in a smaller increase in the phosphate concentration in solution (Fig. 4A,B) and a lower P uptake than without citrate degradation.
Because dissolved citrate is rapidly degraded, less citrate diffuses into the soil yielding steeper concentration gradients of adsorbed citrate (Fig. 4C,D). Close to the root a considerable amount of citrate is adsorbed, which 'protects' citrate from degradation. After one day, 84% of the total exuded citrate is degraded at high P loading of goethite, but only 58% at low P loading because more citrate is sorbed. Similarly, with less reactive surface area present, the amount of citrate adsorbed is smaller and thus the effect of degradation on the resulting P uptake larger (Table 4).
131
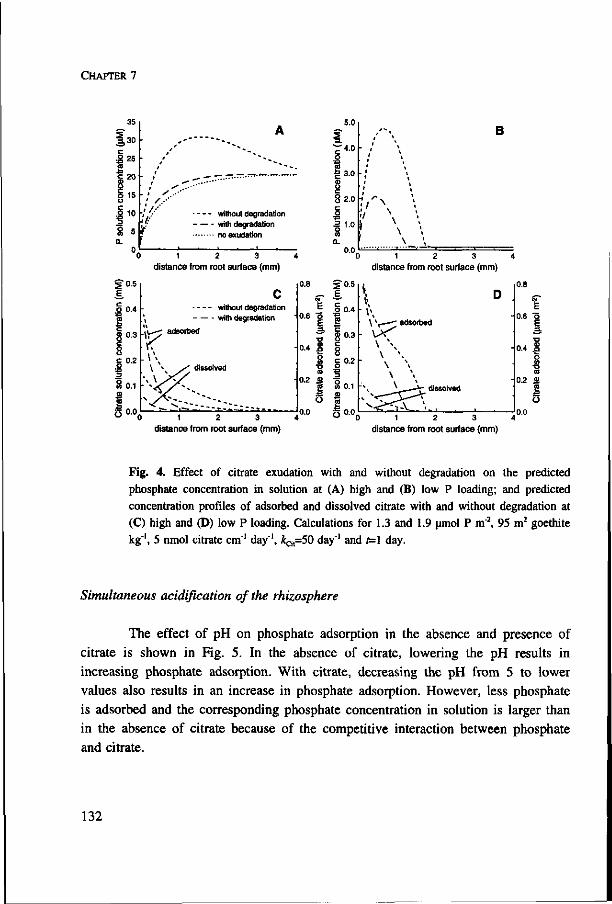
CHAPTER 7
35
.2. 25
o 15 o
.2 10
/ . •
5 I?'
without degradation with degradation no exudation
1 2 3 distance from root surface (mm)
5 0.5 E
- - without degradation - - with degradation
adsorbed
1 2 3 distance from root surface (mm)
o -«3 2 £ 3.0
0.
0.6 "5
•0.4 i
B
8 2.0 : ^
1 2 3 distance from root surface (mm)
5 0.5 E.
.1 0.4 2 c (D 0.3 c o Ü ç 0.2
0.2 S o « m 0.1
ü S ; 0.0
» . \ Y—— adsorbed
- \x< \ \ \ \ \ \ \
"Nx \_^—*r dissolved
x^<*<!vV,
D
-
.
1 2 3 distance from root surface (mm)
0.6 ö E
0.4 .S o »
TD of
0.2 S 2 8
o.o
Fig. 4. Effect of citrate exudation with and without degradation on the predicted phosphate concentration in solution at (A) high and (B) low P loading; and predicted concentration profiles of adsorbed and dissolved citrate with and without degradation at (C) high and (D) low P loading. Calculations for 1.3 and 1.9 umol P m"2, 95 m2 goethite kg"', 5 nmol citrate cm"1 day"1, &Cit=50 day"1 and t=l day.
Simultaneous acidification of the rhizosphere
The effect of pH on phosphate adsorption in the absence and presence of
citrate is shown in Fig. 5. In the absence of citrate, lowering the pH results in
increasing phosphate adsorption. With citrate, decreasing the pH from 5 to lower
values also results in an increase in phosphate adsorption. However, less phosphate
is adsorbed and the corresponding phosphate concentration in solution is larger than
in the absence of citrate because of the competitive interaction between phosphate
and citrate.
132

E F F E C T O F C I T R A T E E X U D A T I O N F R O M R O O T S O N P A V A I L A B I L I T Y
2.5
£ o
2.0
1.5
•o
°-0J!
0.0
30
10
.2 3 |
I 8 0.3
-B" É
C
-
A
• — _
- -
model predictions
P-Cit
P + Cit
•
•
i
G
•
total P (M)
1.0 10"4
• 1.0 10"4
o 6.5 1 0 s
• 6.5 10'5
•
0.5 g g
0.01 M
total Cit (M)
1.0 10"4
1.0 10"4
oethite I"1
KNO a
10
pH
1 r
3 0.1 ^ o Ut
û- 0.03
0.01
: B
- *
! » D
_
O
o ....
1
•O D
.a'
.••b 0
'b
^ ^ _ / b ..•bo
0 'o
J 3 - " "
10
pH
Fig. 5. pH dependence of phosphate adsorption at relatively high and low P loading in the absence and presence of 1-10'4 M citrate at a goethite suspension density of 0.5 g I"1. Data of Geelhoed et al. (1997a, 1998). Lines indicate model calculations with the CD-MUSIC model (Table 1).
133

CHAPTER 7
When acid is exuded from the root, the protons released may be involved in various processes in the soil-root system: adsorption, co-adsorption/co-desorption with citrate and phosphate, transport, partly as protonated solution species, and uptake of H2P04. For the conditions used in Fig. 1, a H:Citrate exudation ratio of 1.9 is required to maintain a pH of 5. Considering exudation of fully protonated citric acid, the pH in the rhizosphere decreases from 5 to about 4.5 in 1 day. This change in pH appears to be too small to alter P uptake (Table 4).
To study the effect of a pH decrease of about 1 pH unit, an additional nett efflux of (H-OH) was imposed. The concentration profiles predicted for phosphate in solution, pH and total citrate are shown in Fig. 6. At the root surface, the pH decreases from 5 to 4.1 in 1 day. Further away from the root where the pH is lower than the initial pH 5 but only very small amounts of citrate are present, phosphate
5 a. 25
o o 15 O o c 10
I \ o 5 '
• •',': /
f
• * —
> • ; •
__,-- __--</
0.2 days
1 day
5 days
^
A
4.8
4.6
4.4
4.2
. - • • " ' " - - - "
• » - " * *
," ^ -- *"~
:/ / ' B • ' y
''/
2 4 6 8 distance from root surface (mm)
2 4 6 8 distance from root surface (mm)
^ 0 . 5 S e c 0.4 O
CS
c 0.3 ü
o u 0.2
'ü 0.1
o
M '\ ; \ ; \
• i \
; « \ • \ \ '•• > \ •• \ \
> N \ S
x \
c
2 4 6 8 distance from root surface (mm)
Fig. 6. Effect of concomitant exudation of H and citrate. Predicted concentration profiles of (A) phosphate in solution, (B) pH and (C) total citrate. Calculations for 1.9 (amol P m'2, 95 m2 goethite kg', 5 nmol citrate cm"1 day"' and 30 nmol H cm"' day'.
134
EFFECT OF CITRATE EXUDATION FROM ROOTS ON P AVAILABILITY
adsorption is increased resulting in a smaller phosphate concentration in solution. Closer to the root where more citrate is present, the phosphate concentration in solution increases due to competition. However, compared with the situation at pH 5 (Fig. 1), the increase in the concentration of phosphate in solution is smaller and, therefore, P uptake is stimulated by citrate exudation to a lesser extent (Table 4).
Discussion
The model calculations show that citrate exudation from roots increases the plant-availability of sorbed phosphate. The increase is largest at low phosphate loading of goethite, where competition between phosphate and citrate causes a very large increase in the concentration of dissolved phosphate (Fig. 2). Moreover, at low phosphate loading a larger part of the exuded citrate is sorbed than at high phosphate loading and this strongly delays citrate degradation (Fig. 4).
The amount of citrate released at the high rate used in the model represents 3.4-10.9 % of the amount of dry matter that can be produced with the extra P that is taken up (Table 4). When citrate degradation is taken into account, this percentage increases, especially when only a small part of the exuded citrate is sorbed, i.e. at high phosphate loading and a small reactive surface area. In experiments with plants, citrate exudation has been compared with total plant dry matter production. For lupin, observed citrate release amounted to 11% (Gardner et al., 1983) and 23% (Dinkelaker et al., 1989) of dry matter yield, but for alfalfa only to 0.3% (Lipton et al., 1987). In judging these figures, it must be considered that plant growth is limited by P deficiency and not by the assimilation rate.
In a number of experiments with plants it has been shown that the rates of organic anion/acid exudation are not uniform along the root. Our calculations show that the increase of P uptake caused by 1 cm of root exuding at a rate of 5 nmol cm"' day"1 is smaller than that of 10 cm root with 0.5 nmol cm'1 day"1 (Table 4). This can be explained from the considerable increase in the P concentration in solution that is already caused by small amounts of citrate (105 M) (Geelhoed et al., 1998). For growing roots, the concentrated excretion of organic acids just behind the root tip also results in the spreading of citrate along the root.
Besides localized high citrate exudation, exudation of citrate may be concentrated by short exudation periods. Over the modelled 5-day period, the relative increase of P uptake due to citrate exudation is about constant, except at
135
CHAPTER 7
rather short uptake time. Apparently, increasing citrate accumulation and phosphate depletion compensate their effects on P uptake.
From the present model results it is difficult to judge the optimal strategy for the mobilization of adsorbed phosphate by citrate. In evaluating this, also temporal variations in the exudation rate need to be considered. Because the mechanisms of P mobilization from adsorbed phosphate and mineral phosphate are different, the optimal exudation strategy may be different as well. For the solubilization of phosphate rock by a fixed amount of acid per plant, model calculations by Hoffland et al. (1992) indicated an optimum in the portion of the root system exuding acid.
The rate of degradation used in one set of calculations was estimated from degradation of citrate in solution by extremely rapid growing bacteria, isolated from a grassland soil, at near optimum laboratory conditions (Jones and Edwards, 1998). Of citrate added to soil with these cultured bacteria 37% was respired in 0.2 days (Jones and Edwards, 1998). In our calculations, where a continuous supply of citrate is assumed, after 0.2 days 49% of citrate was degraded at high and 22% at low phosphate loading (data of runs in Fig. 4). It may be assumed that degradation rates in soils will be smaller, because degradation conditions such as pH, temperature and oxygen supply are often suboptimal.
Citrate degradation decreased the effect of citrate exudation on predicted P uptake by 8-65% (Table 4), depending on the amount of citrate exuded compared with the amount of unoccupied reactive surface area. In soils the sorption capacity is usually higher than used in the model, with reported iron oxide contents ranging from 132-1100 m2 kg"1 in Italian and 1100-10200 m2 kg"1 in Brazilian soils (Colombo et al., 1991; De Mesquita Filho and Torrent, 1993). Presumably, citrate will be largely sorbed in these soils which will increase its retention time and activity in P mobilization.
Exudation of fully protonated citric acid caused a decrease in rhizosphere pH from 5 to 4.5. In soils, observed pH changes in the rhizosphere attributed to organic acid exudation were as large as 2.4 units, but these measurements were carried out with a densely rooted planar root-soil interface (Gerke and Meyer, 1995; Li et al., 1997b). Introducing an additional efflux of protons, e.g. due to uptake of NH4-N, accompanying citrate exudation resulted in a larger decrease in rhizosphere pH from 5 to 4.1 and decreased the plant-availability of phosphate. The pH dependence of phosphate adsorption in competition with citrate explains this result.
136

E F F E C T O F C I T R A T E E X U D A T I O N F R O M R O O T S O N P A V A I L A B I L I T Y
The adsorption of phosphate on metal (hydr)oxides in natural systems, and its pH dependence is also influenced by other specifically sorbing ions. (In)organic anions may compete with phosphate for adsorption at moderate or low pH, whereas divalent cations may enhance phosphate adsorption at higher pH (Bolland et al., 1977; Violante et al., 1991; Manning and Goldberg, 1996; Geelhoed et al., 1997a; Venema et al., 1997).
For soils that contain a relatively large amount of Ca-phosphate minerals, a positive effect of a decreasing rhizosphere pH and organic acid exudation on P mobilization has been observed, which is probably caused by the dissolution of Ca-phosphate minerals (Hoffland et al., 1989; Bolan et al., 1994, 1997).
Earlier model calculations on the effect of interacting components in the rhizosphere on P uptake were carried out by Nye (1984), assuming a fixed relation between ApH and A(log P in solution), and Hoffland et al. (1992), using an empirical relation to describe the dissolution of phosphate rock by acid. Jones et al. (1996a) modelled the accumulation of organic acids at the root surface, assuming linear sorption of citrate in soil and neglecting biodégradation, but did not relate this to nutrient uptake.
In our model, the interactions of phosphate, citrate and H in the rhizosphere are described in more detail. With this model rhizosphere processes can be assessed quantitatively, which provides insight into the mechanisms underlying phosphate availability to plants. The use of a detailed chemical speciation model enables the separation of the effect of the organic anion and the effect of pH on phosphate availability. Citrate increases the availability of phosphate because it is competitively adsorbed on the goethite surface. Moreover, the adsorption of citrate increases its persistence. Acidification of the rhizosphere from pH 5 to lower pH had no or a small negative effect on the plant-availability of adsorbed phosphate.
137

8
Epilogue

Epilogue
In this chapter, the major results of the present study are discussed and an indication of prospects for future research is given.
Availability of phosphate adsorbed on goethite
The availability of sorbed phosphate to plants is determined by plant factors that control the phosphate uptake by roots, such as root length and the presence of root hairs, and by soil factors that govern the transport of phosphate in soil, viz. moisture content, tortuosity and phosphate sorption to soil. Using a nutrient uptake model that accounts for these factors, the availability of phosphate adsorbed on goethite can be predicted from the non linear adsorption behaviour of phosphate, assuming it is fully and instantaneously reversible. This means that the rate of desorption is determined by local equilibrium between sorbed and dissolved phosphate, and that phosphate desorption is not limiting the transport of phosphate to the roots. For the artificial substrate used in Chapter 3, i.e. quartz sand coated with goethite on which phosphate was adsorbed, it was made plausible that this is indeed the case.
Adsorption of phosphate on goethite is strongly affected by the presence of other adsorbing cations, e.g. Mg (Fig. 4 of Chapter 1), and anions, e.g. sulphate (Chapter 4) and citrate (Chapter 6). Competition between phosphate and anions for the goethite surface results in an apparent lower affinity of phosphate, especially at low phosphate loading of goethite (Fig. 6 of Chapter 6). Due to the highly non linear adsorption behaviour of phosphate, phosphate concentrations in solution are very low at low phosphate loading of goethite. Under these conditions, competitive adsorption results in a large relative increase in the phosphate concentration. The extent of competition increases with a larger affinity and relative concentration of the competing anion and when a larger number of surface groups is involved in the binding of the competing anion. Although sulphate is sorbed relatively weakly compared with phosphate, the results of the uptake experiment in Chapter 5 show that competition has a large impact on the plant-availability of phosphate at low phosphate loading and low pH. Citrate has a somewhat higher affinity for the goethite surface and competes more strongly with phosphate. Strongest competition between citrate and phosphate is found at a higher pH than strongest competition between sulphate and phosphate. This is attributable to the larger overall affinity of citrate compared with sulphate at intermediate pH and the lower electrostatic interaction of citrate with the surface at low pH due to protonation of citrate.
141

CHAPTER 8
Mechanistic ion adsorption modelling
The present work has shown that the CD-MUSIC model developed by Hiemstra and Van Riemsdijk (1996) can be successfully used to predict competitive adsorption of anions on goethite based on adsorption parameter values obtained from single anion adsorption experiments. For as much as possible, the surface complexes that were used for modelling were those identified in spectroscopic studies. Developments in this field are still progressing, especially regarding measurements of surface complexation in situ. Recently, in situ measurements of sulphate adsorption on hematite showed that monodentate inner sphere complexes are formed (Hug, 1997). Upon drying the spectra changed, indicating formation of bidentate complexes, which stresses the need for studies of surface complexation in situ.
Surface complexation calculations in the CD-MUSIC model are based on the presence of independent unoccupied surface groups. However, a number of consecutive unoccupied surface groups is involved in the coordination of multidentate complexes to the surface, which would require a modified treatment of surface complexation in the model. For latticelike chains of surface groups, the probability of a number of consecutive unoccupied surface groups has been derived by McGhee and Von Hippel (1974). For ions that are adsorbed on chains of sites, such as ion adsorption to singly coordinated surface groups of goethite, this probability can be incorporated in the definition of the affinity constant of the complexation reaction. In this definition it is implied that the complex attaches to all surface groups involved in the binding at the same time. Differences in predicted surface coverage arising from this adjusted method may be particularly important in competition studies with components that form large multidentate complexes, e.g. competition of phosphate with fulvic acids.
Use of a mechanistic ion adsorption model in uptake modelling
The traditional approach to model the uptake of phosphorus from soil by roots is to assume a linear relation between phosphate in solution and phosphate bound to the solid phase. However, this approach does not justify the non linear adsorption behaviour of phosphate. A more accurate method which has often been used to model the transport of reactive ions in soil columns is the use of a simple sorption model that describes data from independent batch adsorption experiments. This method has been applied to predict phosphorus uptake from phosphate adsorbed on goethite in a
142

EPILOGUE
goethite-sand substrate (Chapter 3). However, the obtained sorption isotherm only applies for the constant conditions of pH, ionic strength and concentration of competing ions at which the batch adsorption experiments were carried out. With the use of mechanistic ion adsorption models, such as the CD-MUSIC model, these multi-component effects on ion adsorption can be predicted. Recently, mechanistic ion adsorption models have been used to predict multicomponent transport of protons and fluoride in goethite-sand systems (Scheidegger et al., 1994; Meeussen et al., 1996). In Chapter 7 this approach was used to predict phosphate mobility and uptake affected by pH and citrate competition.
Effect of rhizosphere processes on uptake
Phosphorus uptake by roots results in the depletion of phosphate in the direct vicinity of the root. Therefore, the adsorption behaviour of phosphate in the rhizosphere rather than phosphate sorption in the bulk soil determines the plant-availability of phosphate. Besides phosphate, other nutrients are present in the rhizosphere of which the concentration may decrease in time as a result of uptake, or increase in time when mass transport of ions exceeds influx. In the model calculations presented in this work, these effects were not taken into account.
Root-induced processes in the rhizosphere may change the chemical environment and thus affect phosphate sorption. Using a model which describes solute transport, the spatial variations in e.g. pH and organic anion concentrations around the root can be predicted. To incorporate the effect of these factors in model calculations of phosphorus uptake, the influence of pH and anion competition on P sorption, and their interactions, must be well known. An accurate description of phosphate adsorption at very low phosphate concentration is especially important because phosphate influx into the root is determined by the phosphate concentration at the root surface, which is usually very low. Moreover, competitive adsorption results in a relatively larger increase in the phosphate concentration in solution at low than at high phosphate concentration. When phosphate sorption is low, rather high levels of the competing anion are adsorbed. Sorption of organic anions strongly reduces the degradation, and thus prolongs the retention time of these competing anions (Jones and Edwards, 1998).
The release of organic anions/acids from roots may result in phosphate desorption due to competition, and may cause an enhanced dissolution of minerals resulting in a larger supply of phosphate and micronutrients to plants (Mench and
143

CHAPTER 8
Martin, 1991; Jones et al., 1996a; Bolan et al., 1997). With the incorporation of mineral phases into a speciation model which is combined with an uptake model, the amount of nutrients made available by the dissolution of minerals may be quantified. As a first attempt local equilibrium between minerals and dissolved phase may be assumed, but validation of this assumption is necessary. When temporal and spatial variations in the exudation rate of organic acids along the root are introduced in the model, it may be possible to assess what would be the most effective strategy for enlarging phosphorus mobilization in soils. Knowledge of the effectiveness of organic anions in releasing phosphate by desorption and dissolution of minerals may lead to insights in P mobilization strategies of different plant species and from different soils.
The temporal variation of exudation rates from roots has only rarely been determined (Zhang et al., 1997), and more experimental data may therefore be helpful in evaluating the importance of organic anion/acid exudation in plant nutrition. Further, based on analyses of organic anions exuded by plants normally growing on acid or calcareous soils, it has been suggested that the nature and quantity of these organic anions is related to their capacity to acquire nutrients from different soil types, and thus indicates an adaptation mechanism (Ström et al., 1994; Zhang et al., 1997). The local exudation of very high rates of malate, which may complex free Al, may explain the Al-tolerance of some wheat genotypes grown in nutrient solution (Delhaize et al., 1993). In soils, excretion of organic anions may act as a tolerance mechanism to high levels of free Al, provided the dissolution kinetics of Al-containing minerals is slow.
Processes involved in the acquisition of phosphorus by hyphae of mycorrhizal fungi are comparable to those of roots. Likewise, the type of modelling used here can be used to investigate the effect of the presence of mycorrhizal hyphae on nutrient uptake, and to quantify the dissolution of minerals and complexation of Ca and Al by hyphal organic anion production (Lapeyrie, 1990; Jongmans et al., 1997).
Only recently, decomposition rates of small organic anions in solution and in soil have been determined (Jones et al., 1996b; Jones and Edwards, 1998). In these experiments, fast growing bacteria and near optimum conditions were used, which suggests that the measured degradation rates were rather high. In the model calculations of Chapter 7 citrate degradation has been approximated with a first-order decay reaction describing data of the degradation of citrate in solution obtained with this method (Jones and Edwards, 1998). Experiments with malate have shown that malate degradation conforms to Michaelis-Menten kinetics, though with a rather high Km value of 0.26 mM in solution (Jones et al., 1996b). In the model calculations, predicted citrate
144
EPILOGUE
concentrations were at maximum 0.18 mM (Fig. 3 in Chapter 7). Measurements of actual degradation rates in soil may be useful in further assessing the effect of the presence of organic anions in promoting phosphorus availability.
Availability of sorbed phosphate in soils
Phosphate desorption is controlled by local equilibrium between sorbed and dissolved phosphate. In the model, the attainment of new equilibrium upon depletion has been assumed to be instantaneous. Experiments of phosphate desorption from soil have shown that desorption is rather slow (Barrow, 1983; Lookman et al., 1995). In the application of the present work to the availability of sorbed phosphate in soils it is important to assess whether phosphate desorption may be limiting uptake.
The assumption of instantaneous reversibility of phosphate sorption does not necessarily implicate high rates of desorption, as has been illustrated for predicted phosphate desorption from sand coated with goethite (Fig. 6 in Chapter 3). For treatment H the rate of desorption decreased from 0.95 umol m"2 day"1 on the first day of uptake to 0.01 umol m"2 day"1 after 7 days. Although adsorption equilibrium on this material was only reached after two weeks, probably because phosphate was adsorbed on less accessible sites between goethite needles fixed on sand grains, it was not necessary to allow for this in the model. Apparently, phosphorus uptake was limited to an at least similar extent by slow phosphate transport to the root.
Lookman et al. (1995) measured desorption from soils and distinguished between fast phosphate desorption, assumed to originate from sites in direct contact with the solution, and slow phosphate desorption, supposedly from less accessible sites inside aggregates. Based on measurements of the rate of slow desorption it was suggested that, at relatively low dissolved phosphate concentration, the time scale of phosphate release kinetics is short compared to phosphate transport in soil. At higher phosphate concentration, desorption kinetics may influence the transport behaviour significantly. Nye and Staunton (1994) incorporated sorption to and desorption from less accessible sites into the modelling of transport of strongly adsorbing solutes by providing linked intra-aggregate and interaggregate pathways. The intra-aggregate transport was characterized by a very small impedance factor.
Slow phosphate desorption from soil was often associated with desorption from less accessible sites. However, attempts to relate isotopic exchangeability of phosphate from various synthetic and natural iron (hydr)oxides to crystal properties such as
145
CHAPTER 8
porosity and specific surface area have yielded conflicting results (Torrent, 1997). Soils most closely related to the artificial substrate of sand coated with goethite
are highly weathered acid soils. Therefore, it may be expected that the availability of phosphorus in these soils will be determined by the same processes as addressed in this thesis. This suggests that the presence of anions like sulphate, organic anions from root exudates and organic matter may be beneficial to phosphorus uptake from these soils. Organic acids may also be involved in the complexation of dissolved Al, which is usually present in considerable concentrations in weathered acid soils.
Besides goethite a number of other iron oxides occur in soils. Venema (1997) showed that only small differences exist in the amounts of phosphate adsorbed and the pH dependence of phosphate adsorption on these oxides. In a P uptake experiment with plants growing on suspensions of various iron oxides, Guzman et al. (1994) showed that the plant-availability of phosphate sorbed on hematite and ferrihydrite was somewhat larger than of goethite, and related this to the somewhat smaller affinity of phosphate for hematite and ferrihydrite.
Phosphate adsorbed on metal (hydr)oxides is also an important phosphorus source in calcareous soils (Solis and Torrent, 1989a,b; Soltan et al., 1993). Adsorption studies showed that phosphate adsorption above pH 5 was larger in the presence than in the absence of Ca (results not presented). As a result, the availability of sorbed phosphate at higher pH will decrease in the presence of Ca. Competition of phosphate with anions is likely to have less influence when the pH is relatively high. Because considerable amounts of phosphorus will be present in mineral forms, both phosphate desorption and phosphate dissolution from minerals will contribute to the phosphorus availability.
In soils high in organic matter, competition between phosphate and organic matter for binding on metal (hydr)oxides occurs, which increases the availability of phosphate in soils. However, not many data on the pH and concentration dependence of this interaction are available. The measurements of competition between phosphate and citrate, which exhibits similar adsorption behaviour to organic matter, can be considered as a first approach to the study of competitition between phosphate and organic matter. The large competitive effect of citrate on phosphate adsorption showed that the incorporation of the effect of organic compounds in models of the mobility and bioavailability of phosphate in soils is essential. Apart from phosphate desorption, mineralization will also contribute to phosphorus availability.
146

References
References
Adams M.A. and Pate J.S. 1992 Availability of organic and inorganic forms of phosphorus to lupins
(Lupinus spp.). Plant Soil 145, 107-113. Afif E., Barrón V. and Torrent J. 1995 Organic matter delays but does not prevent phosphate sorption
by Cerrado soils in Brazil. Soil Sei. 159, 207-211. Ali M.A. and Dzombak D.A. 1996a Competitive sorption of simple organic acids and sulfate on
goethite. Environ. Sei. Technol. 30, 1061-1071. Ali M.A. and Dzombak D.A. 1996b Effects of simple organic acids on sorption of Cu2+ and Ca2+ on
goethite. Geochim. Cosmochim. Acta 60, 291-304. Anderson G., Williams E.G. and Moir J.O. 1974 A comparison of the sorption of inorganic
orthophosphate and inositol hexaphosphate by six acid soils. J. Soil Sei. 25, 51-62. Anderson G. 1980 Assessing organic phosphorus in soils. In: The role of phosphorus in agriculture.
Eds. Khasawneh F.E., Sample E.C. and Kamprath E.J. ASA, CSSA, SSSA, Madison WI. pp. 411-431.
Aquilar A. and Van Diest A. 1981 Rock-phosphate mobilization induced by the alkaline uptake pattern
of legumes utilizing symbiotically fixed nitrogen. Plant Soil 61, 27-42. Aylmore L.A.G. and Karim M. 1967 Unpublished results in: Murali V. and Aylmore L.A.G. 1983
Competitive adsorption during solute transport in soils: 3. A review of experimental
evidence of competitive adsorption and an evaluation of simple competition models. Soil
Sei. 136, 279-290. Baldwin J.P., Nye P.H. and Tinker P.B. 1973 Uptake of solutes by multiple root systems from soil
III. A model for calculating the solute uptake by a randomly dispersed root system
developing in a finite volume of soil. Plant Soil 38, 621-635. Baldwin J.P. and Nye P.H. 1974 A model to calculate the uptake by a developing root system or root
hair system of solutes with concentration variable diffusion coefficients. Plant Soil 40,703-
706. Balistrieri L.S. and Murray J.W. 1981 The surface chemistry of goethite (aFeOOH) in major ion
seawater. Geochim. Cosmochim. Acta 281, 788-806. Balistrieri L.S. and Chao T.T. 1987 Selenium adsorption by goethite. Soil Sei. Soc. Am. J. 51, 1145-
1151. Baon J.B., Smith S.E. and Alston A.M. 1994 Growth response and phosphorus uptake of rye with long
and short root hairs: Interactions with mycorrhizal infection. Plant Soil 167, 247-254. Barber S.A. 1979 Soil chemistry and availability of plant nutrients. In: Chemistry in the soil
environment. Eds. Dowdy R.H., Ryan J.A., Volk V.V. and Baker D.E. ASA, SSSA, Madison, WI. pp. 1-12.
Barber S.A. 1984 Soil nutrient bioavailability. John Wiley and Sons, New York. Barrow N.J. 1969 Effects of adsorption of sulfate by soils on the amount of sulfate present and its
availability to plants. Soil Sei. 108, 193-201. Barrow N.J., Bowden J.W., Posner A.M. and Quirk J.P. 1980 Describing the effects of electrolyte on
adsorption by phosphate by a variable charge surface. Aust. J. Soil Res. 18, 395-404.
149

Barrow N.J. 1983 On the reversibility of phosphate sorption by soils. J. Soil Sei. 34, 751-758. Bar-Yosef B. 1991 Root excretions and their environmental effects; influence on availability of
phosphorus. In: Plant roots, the hidden half. Eds. Waisel Y., Eshel A. and Kafkafi U.
Marcel Dekker Inc., New York. pp. 529-557. Beck E., Fusseder A. and Kraus M. 1989 The maize root system in situ: Evaluation of structure and
capability of utilization of phytate and inorganic soil phosphates. Z. Pflanzenernähr. Bodenk.
152, 159-167. Benjamin M.M., Hayes K.F. and Leckie J.O. 1982 Removal of toxic metals from power-generation
waste streams by adsorption and coprecipitation. J. Water Pollut. Control Fed. 54, 1472-1481.
Bhat K.K.S., Nye P.H. and Baldwin J.P. 1976 Diffusion of phosphate to plant roots in soil. IV. The
concentration distance profile in the rhizosphere of roots with root hairs in a low P soil. Plant Soil 44, 63-72.
Boers P.C.M. 1996 Nutrient emissions from agriculture in the Netherlands, causes and remedies.
Water Sei. Technol. 33 (4-5), 183-189. Bolan N.S., Syers J.K., Tillman R.W. and Scotter D.R. 1988 Effect of liming and phosphate additions
on sulphate leaching in soils. J. Soil Sei. 39, 493-504. Bolan N.S., Naidu R., Mahimairaja S. and Baskaran S. 1994 Influence of low-molecular-weight
organic acids on the solubilization of phosphates. Biol. Fertil. Soils 18, 311-319. Bolan N.S., Elliot J., Gregg P.E.H. and Weil S. 1997 Enhanced dissolution of phosphate rocks in the
rhizosphere. Biol. Fertil. Soils 24, 169-174. Bolland M.D.A., Posner A.M. and Quirk J.P. 1977 Zinc adsorption by goethite in the absence and
presence of phosphate. Aust. J. Soil Res. 15, 279-286. Bowden J.W., Nagarajah S., Barrow N.J., Posner A.M. and Quirk J.P. 1980 Describing the adsorption
of phosphate, citrate and selenite on a variable-charge mineral surface. Aust. J. Soil Res. 18,
49-60. Bowen G.D. and Rovira A.D. 1991 The rhizosphere: the hidden half of the hidden half. In: Plant
roots: the hidden half. Eds. Waisel Y., Eshel A. and Kafkafi U. Marcel Dekker Inc. New York.
Breeze V.G., Wild A., Hopper M.J. and Jones L.H.P. 1984 The uptake of phosphorus from flowing
nutrient solution. II. Growth of Lolium perenne L. at constant phosphate concentrations. J.
Exp. Bot. 35, 1210-1221. Brunauer S., Emmett P.H. and Teller E. 1938 Adsorption of gases in multimolecular layers. J. Am.
Chem. Soc. 60, 309-319. Brundrett M. 1991 Mycorrhizas in natural ecosystems. Adv. Ecol. Res. 21, 171-313. Bush D.R. 1993 Proton-coupled sugar and amino acid transporters in plants. Annu. Rev. Plant Physiol.
Plant Mol. Biol. 44, 513-542. Cabrera F., De Arambarri P., Madrid L. and Toca CG. 1981 Desorption of phsophate from iron
oxides in relation to equilibrium pH and porosity. Geoderma 26, 203-216. Caradus J.R. 1981 Effect of root hair length on white clover growth over a range of soil phosphorus
150

REFERENCES
levels. New Zealand J. Agric. Res. 42, 353-358. Charlet L., Dise N. and Stumm W. 1993 Sulfate adsorption on a variable charge soil and on reference
materials. Agric. Ecosystems Environ. 47, 87-102. Ciaassen N. and Barber S.A. 1976 Simulation model for nutrient uptake from soil by a growing
plant root system. Agron. J. 68, 961-964. Clarkson D.T., Sanderson J. and Russell R.S. 1968 Ion uptake and root age. Nature 220, 805-806. Cogliatti D.H. and Santa Maria G.E. 1990 Influx and efflux of phosphorus of wheat plants in non-
growth-limiting concentration of phosphorus. J. Exp. Botany 41, 601-607. Colombo C , Buondonno A., Violante A. and Torrent J. 1991 The contrasting effect of goethite and
hematite on phosphate sorption by Terre Rosse. Z. Pflanzenernähr. Bodenk. 154, 301-305. Colombo C , Barrón V. and Torrent J. 1994 Phosphate adsorption and desorption in relation to
morphology and crystal properties of synthetic hematites. Geochim. Cosmochim. Acta 58, 1261-1269.
Coltman R.R., Gerloff G.C. and Gabelman W.H. 1982 A sand culture system for simulating plant
responses to phosphorus in soil. J. Am. Soc. Hort. Sei. 107, 938-942. Coltman R.R., Gerloff G.C. and Gabelman W.H. 1985 Differential tolerance of tomato strains to
maintained and deficient levels of phosphorus. J. Am. Soc. Hort. Sei. 110, 140-144. Cornell R.M. and Schindler P.W. 1980 Infrared study of the adsorption of hydroxycarboxylic acids
on a-FeOOH and amorphous Fe (Ill)hydroxide. Colloid Polymer Sei. 258, 1171-1175. Cushman J.H. 1979 An analytical solution to solute transport near root surfaces for low initial
concentrations: I. Equations development. Soil Sei. Soc. Am. J. 43, 1087-1090. Dalai R.C. 1977 Soil organic phosphorus. Adv. Agron. 29, 83-117. Darrah P.R. 1991 Models of the rhizosphere. II. A quasi three-dimensional simulation of the microbial
population dynamics around a growing root releasing soluble exudates. Plant Soil 138,147-
158. Darrah P.R. 1993 The rhizosphere and plant nutrition: a quantitative approach. In: Plant nutrition,
from genetic engineering to field practice. Ed. Barrow N.J. Kluwer Academic Publishers,
Dordrecht, The Netherlands, pp. 3-22. Davis J.A., James R.O. and Leckie J.O. 1978 Surface ionization and complexation at the oxide/water
interface. I. Computation of electrical double layer properties in simple electrolytes. J.
Colloid Interface Sei. 63, 480-499. Davis J.A. and Leckie J.O. 1980 Surface ionization and complexation at the oxide/water interface. 3.
Adsorption of anions. J. Colloid Interface Sei. 74, 32-43. Delgado A. and Torrent J. 1997 Phosphate-rich soils in the European Union: estimating total plant-
available phosphorus. Eur. J. Agron. 6, 205-214. Delhaize E., Ryan P.R. and Randall P.J. 1993 Aluminum tolerance in wheat (Triticum aestivum L.)
II. Aluminum-stimulated excretion of malic acid from root apices. Plant Physiol. 103, 695-
702. De Mesquita Filho M.V. and Torrent J. 1993 Phosphate sorption as related to mineralogy of a
hydrosequence of soils from the Cerrado region (Brazil). Geoderma 58, 107-123.
151

De Willigen P. and Van Noordwijk M. 1987 Roots, plant production and nutrient use efficiency. PhD thesis, Wageningen Agricultural University, The Netherlands.
De Willigen P. and Van Noordwijk M. 1994a Mass flow and diffusion of nutrients to a root with
constant or zero sink uptake. I. Constant uptake. Soil Sei. 157, 162-170. De Willigen P. and Van Noordwijk M. 1994b Mass flow and diffusion of nutrients to a root with
constant or zero-sink uptake. II. Zero-sink uptake. Soil Sei. 157, 171-175. Dinkelaker B., Römheld V. and Marschner H. 1989 Citric acid excretion and precipitation of calcium
citrate in the rhizosphere of white lupin {Lupinus albus L.). Plant Cell Environ. 12, 285-292. Drew M.C. and Nye P.H. 1969 The supply of nutrient ions by diffusion to plant roots in soil. II.
The effect of root hairs on the uptake of potassium by roots of rye grass (Lolium
multiflorum). Plant Soil 31, 407-424. Dunlop J. 1989 Phosphate and membrane electropotentials in Trifolium repens L. J. Exp. Botany 40,
803-807. Dzombak D.A. and Morel F.M-M. 1990 Surface complexation modeling: hydrous ferric oxide. Wiley,
New York. Earl K.D., Syers J.K. and McLaughlin J.R. 1979 Origin of the effects of citrate, tartrate, and acetate
on phosphate sorption by soils and synthetic gels. Soil Sei. Soc. Am. J. 43, 674-678. Edwards O.W. and Huffman E.O. 1959 Diffusion of aqueous solution of phosphoric acid at 25°. J.
Phys. Chem. 63, 1830-1833. Elliot CG., Lynch J. and Läuchli A. 1984 Influx and efflux of P in roots of intact maize plants;
double-labelling with 32P and 33P. Plant Physiol. 76, 336-341. Evans Jr. A. 1985 The adsorption of inorganic phosphate by a sandy soil as influenced by dissolved
organic compounds. Soil Sei. 140, 251-255. Fendorf S., Eick M.J., Grossi P. and Sparks D.L. 1997 Arsenate and Chromate retention mechanisms
on goethite. 1. Surface structure. Environ. Sei. Technol. 31, 315-320. Filippelli G.M. and Delaney M.L. 1996 Phosphorus geochemistry of equatorial Pacific sediments.
Geochim. Cosmochim. Acta 60, 1479-1495. Filius J.D., Hiemstra T. and Van Riemsdijk W.H. Adsorption of small weak organic acids on goethite:
Modeling of mechanisms. J. Colloid Interface Sei. 195, 368-380. Föhse D. and Jungk A. 1983 Influence of phosphate and nitrate supply on root hair formation of rape,
spinach and tomato plants. Plant Soil 74, 359-368. Föhse D., Ciaassen N. and Jungk A. 1991 Phosphorus efficiency of plants. II. Significance of root
radius, root hairs and cation-anion balance of phosphorus influx in seven plant species. Plant
Soil 132, 261-272. Gahoonia T.S., Ciaassen N. and Jungk A. 1992 Mobilization of phosphate in different soils by
ryegrass supplied with ammonium or nitrate. Plant Soil 140, 241-248. Gahoonia T.S., Care D. and Nielsen N.E. 1997 Root hairs and phosphorus acquisition of wheat and
barley cultivars. Plant Soil 191, 181-188. Gardner W.K., Parbery D.G. and Barber D.A. 1982 The acquisition of phosphorus by Lupinus albus
L. II. The effect of varying phosphorus supply and soil type on some characteristics of the
152
REFERENCES
soil/root interface. Plant Soil 68, 33-41. Gardner W.K., D.A. Barber and Parbery D.G. 1983 The acquisition of phosphorus by Lupinus albus
L. III. The probable mechanism by which phosphorus movement in the soil/root interface
is enhanced. Plant Soil 70, 107-124. Gear C.W. 1971 Numerical initial value problems in ordinary differential equations. Prentice-Hall,
Englewood Cliffs, New Jersey. Gebhardt H. and Coleman N.T. 1974 Anion adsorption by allophanic tropical soils: II. sulfate
adsorption. Soil Sei. Soc. Am. Proc. 38, 259-262. Geelhoed J.S., Hiemstra T. and Van Riemsdijk W.H. 1997a Phosphate and sulfate adsorption on
goethite: single anion and competitive adsorption. Geochim. Cosmochim. Acta 61, 2389-
2396. Geelhoed J.S., Findenegg G.R. and Van Riemsdijk W.H. 1997b Availability to plants of phosphate
adsorbed on goethite: experiment and simulation. Eur. J. Soil Sei. 48, 473-481. Geelhoed J.S., Mous S.L.J, and Findenegg G.R. 1997c Modeling zero sink nutrient uptake by roots
with root hairs from soil: comparison of two models. Soil Sei. 162, 544-553. Geelhoed J.S., Van Riemsdijk W.H. and G.R. Findenegg 1997d Effects of sulphate and pH on the
plant-availability of phosphate adsorbed on goethite. Plant Soil 197, 241-249. Geelhoed J.S., Hiemstra T. and Van Riemsdijk W.H. 1998 Competitive interaction between phosphate
and citrate on goethite. Environ. Sei. Technol. submitted. Gerke J. 1992 Phosphate, aluminium and iron in the soil solution of three different soils in relation
to varyingconcentrations of citric acid. Z Pflanzenernähr. Bodenk. 155, 339-343. Gerke J., Römer W. and Jungk A. 1994 The excretion of citric and malic acid by proteoid roots of
Lupinus albus L.; effects of soil solution concentrations of phosphate, iron, and aluminum
in the proteoid rhizosphere in samples of an oxisol and a luvisol. Z. Pflanzenernähr. Bodenk.
157, 289-294. Gerke J. and Meyer U. 1995 Phosphate aquisition by red clover and black mustard on a humic podzol.
J. Plant Nutr. 18, 2409-2429. Gillman G.P. and Bell L.C. 1978 Soil solution studies on weathered soils from tropical North
Queensland. Austr. J. Soil Res. 16, 67-77. Gu B., Schmitt J., Chen Z., Liang L. and McCarthy J.F. 1994 Adsorption and desorption of natural
organic matter on iron oxide: mechanisms and models. Environ. Sei. Technol. 28, 38-46. Guzman G., Elcantara E., Barrón V. and Torrent J. 1994 Phytoavailability of phosphate adsorbed on
ferrihydrite, hematite, and goethite. Plant Soil 159, 219-225. Hansmann D.D. and Anderson M.A. 1985 Using electrophoresis in modeling sulfate, selenite, and
phosphate adsorption onto goethite. Environ. Sei. Technol. 19, 544-551. Häussling M. and Marschner H. 1989 Organic and inorganic soil phosphates and acid phosphatase
activity in the rhizosphere of 80-year-old Norway spruce (Picea abies (L.) Karst.) trees.
Biol. Fertil. Soils 8, 128-133. Hawke D., Carpenter P.D. and Hunter K.A. 1989 Competitive adsorption of phosphate on goethite in
marine electrolytes. Environ. Sei. Technol. 23, 187-191.
153

Hayes K.F., Roe A.L., Brown Jr. G.E., Hodgson K.O., Leckie J.O. and Parks G.A. 1987 In situ x-ray
absorption study of surface complexes: selenium oxyanions on a-FeOOH. Science 238,783-786.
Haynes R.J. 1990 Active ion uptake and maintenance of cation-anion balance: A critical examination
of their role in regulating rhizosphere pH. Plant Soil 126, 247-264. He L.M., Zelazny L.W., Baligar V.C., Ritchey K.D. and Martens D.C. 1996 Hydroxyl-sulfate
exchange stoichiometry on Y-A1203 and kaolinite. Soil Sei. Soc. Am. J. 60, 442-452. He Z.L., Yuan K.N., Zhu Z.X. and Zhang Q.Z. 1991 Assessing the fixation and availability of sorbed
phosphate in soil using an isotopic exchange method. J. Soil Sei. 42, 661-669. He Z.L., Yang X., Yuan K.N. and Zhu Z.X. 1994 Desorption and plant-availability of phosphate
sorbed by some important minerals. Plant Soil 162, 89-97. Hendriks L., Ciaassen N. and Jungk A. 1981 Phosphatverarmung des wurzelnahen Bodens und
Phosphataufnahme von Mais und Raps. Z. Pflanzenernähr. Bodenk. 144, 486-499. Hendrix J.E. 1967 The effect of pH on the uptake and accumulation of phosphate and sulfate ions by
bean plants. Am. J. Botany 54, 560-564. Hiemstra T., Van Riemsdijk W.H. and Bolt G.H. 1989a Multisite proton adsorption modeling at the
solid/solution interface of (hydr)oxides: A new approach. I. model description and evaluation
of intrinsic reaction constants. J. Colloid Interface Sei. 133, 91-104. Hiemstra T., De Wit J.C.M, and Van Riemsdijk W.H. 1989b Multisite proton adsorption modeling
at the solid/solution interface of (hydr)oxides: A new approach. II. Application to various
important (hydr)oxides. J. Colloid Interface Sei. 133, 105-117. Hiemstra T. and Van Riemsdijk W.H. 1991 Physical chemical interpretation of primary charging
behaviour of metal (hydr)oxides. Colloids Surfaces 59, 7-25. Hiemstra T. and Van Riemsdijk W.H. 1996 A surface structural approach to ion adsorption: The
charge distribution (CD) model. J. Colloid Interface Sei. 179, 488-508. Hiemstra T., Venema P. and Van Riemsdijk W.H. 1996 Intrinsic proton affinity of reactive surface
groups of metal (hydr)oxides: The bond valence principle. J. Colloid Interface Sei. 184,680-
692. Hingston F.J., Atkinson R.J., Posner A.M. and Quirk J.P. 1967 Specific adsorption of anions. Nature
215, 1459-1461. Hingston F.J., Posner A.M. and Quirk J.P. 1971 Competitive adsorption of negatively charged ligands
on oxide surfaces. Diss. Faraday Soc. 52, 334-342. Hingston F.J., Posner A.M. and Quirk J.P. 1972 Anion adsorption by goethite and gibbsite. I. The role
of the proton in determining adsorption envelopes. J. Soil Sei. 23, 177-192. Higinbotham N., Etherton B. and Foster R.J. 1967 Mineral ion contents and cell transmembrane
electropotentials of pea and oat seedling tissue. Plant Physiol. 42, 37-46. Hoffland E., Findenegg G.R. and Nelemans J.A. 1989 Solubilization of rock phosphate by rape. II.
Local root exudation of organic acids as a response to P-starvation. Plant Soil 113,161-165. Hoffland E., Bloemhof H.S., Leffelaar P.A., Findenegg G.R. and Nelemans J.A. 1990 Simulation
of nutrient uptake by a growing root system considering increasing root density and inter-
154

REFERENCES
root competition. Plant Soil 124, 149-155. Hoffland E. 1991 Mobilization of rock phosphate by rape (Brassica napus L.). Chapter 1, General
introduction. PhD thesis, Wageningen Agricultural University, The Netherlands, pp 3-11. Hoffland E. 1992 Quantitative evaluation of the role of organic acid exudation in the mobilization of
rock phosphate by rape. Plant Soil 140, 279-289. Hoins U., Charlet L. and Sticher H. 1993 Ligand effect on the adsorption of heavy metals: the sulfate
- cadmium - goethite case. Water, Air, Soil Pollut. 68, 241-255. Hsu P.H. 1977 Aluminum hydroxides and oxyhydroxides. In: Minerals in Soil Environments. Eds.
Dixon S.B. and Weed J.B. Soil Science Society of America, Madison, WI. pp. 99-143. Hue N.V. 1991 Effects of organic acids/anions on P sorption and phytoavailability in soils with
different mineralogies. Soil Sei. 152, 463-471. Hug S.J. 1997 In situ Fourier transform infrared measurements of sulfate adsorption on hematite in
aqueous solutions. J. Colloid Interface Sei. 188, 415-422. Imas P., Bar-Yosef B., Kafkafi U. and Ganmore-Neumann R. 1997 Phosphate induced carboxylate
and proton release by tomato roots. Plant Soil 191, 35-39. IMSL 1991 MATH/LIBRARY Fortran subroutines for mathematical applications. Version 2.0, page
755-790. IMSL Inc., Houston, Texas. Iyamuremye F. and Dick R.P. 1996 Organic amendments and phosphorus sorption by soils. Adv.
Agron. 56, 139-185. Itoh S. and Barber S.A. 1983a Phosphorus uptake by six plant species as related to root hairs. Agron.
J. 75, 457-461. Itoh S. and Barber S.A. 1983b A numerical solution of whole plant nutrient uptake for soil-root
systems with root hairs. Plant Soil 70, 403-413. Jones D.L., P.R. Darrah and L.V. Kochian 1996a Critical evaluation of organic acid mediated iron
dissolution in the rhizosphere and its potential role in root iron uptake. Plant Soil 180, 57-
66. Jones D.L., A.M. Prabowo and L.V. Kochian 1996b Kinetics of malate transport and decomposition
in acid soils and isolated bacterial populations: The effect of microorganisms on root exudation of malate under Al stress. Plant Soil 182, 239-247.
Jones D.L. and Edwards A.C. 1998 Influence of sorption on the biological utilization of two simple
carbon substrates. Soil Biol. Biochem. submitted. Jongmans A.G., Van Breemen N., Lundstrom U., Van Hees P.A.W., Finlay R.D., Srinivasan M.,
Unestam T., Giesler R., Melkerud P.A. and Olsson M. 1997 Rock-eating fungi. Nature 389, 682-683.
Jungk A. and Barber S.A. 1975 Plant age and the phosphorus uptake characteristics of trimmed and
untrimmed com root systems. Plant Soil 42, 227-239. Jungk A., Asher C.J., Edwards D.G. and Meyer D. 1990 Influence of phosphate status on phosphate
uptake kinetics of maize (Zea mays) and soybean (Glycine max). Plant Soil 124, 175-182. Jungk A., Ciaassen N., Schulz V. and Wendt J. 1993 Pflanzenverfügbarkeit der Phosphatvorräte
ackerbaulich genutzter Böden. Langfristige Feldversuche zur Nutbarkeit des Bodenphosphors
155
und zur Bewertung der Bodenuntersuchung. Z Planzenernähr. Bodenk. 156, 397-406. Jungk A. and Ciaassen N. 1997 Ion diffusion in the soil-root system. Adv. Agron. 61, 53-110. Kamprath E.J., Nelson W.L. and Fitts J.W. 1956 The effect of pH, sulfate and phosphate
concentrations on the adsorption of sulfate by soils. Soil Sei. Soc. Am. Proc. 20, 463-366. Lapeyrie F. 1988 Oxalate synthesis from soil bicarbonate by the mycorrhizal fungus Paxillus
involutus. Plant Soil 110, 3-8. Lapeyrie F. 1990 The role of ectomycorrhizal fungi in calcareous soil tolerance by 'symbiocalcicole'
woody plants. Ann. Sei. For. 47, 579-589. Leyval C. and Berthelin J. 1989 Influence of acid-producing Agrobacterium and Laccaria laccata on
pine and beech growth, nutrient uptake and exudation. Agric. Ecosystems Environ. 28, 313-319.
Li M., Osaki M., Honma M. and Tadano T. 1997a Purification and characterization of phytase induced
in tomato roots under phosphorus deficient conditions. Soil Sei. Plant Nutr. 43, 179-190. Li M., Shinano T. and Tadano T. 1997b Distribution of exudates of lupin roots in the rhizosphere
under phosphorus deficient conditions. Soil Sei. Plant Nutr. 43, 237-245. Li Xiao-Lin, Eckhard G. and Marschner H. 1991 Phosphorus depletion and pH decrease at the root-
soil and hyphae-soil interfaces of VA mycorrhizal white clover fertilized with ammonium.
New Phytol. 119, 397-404. Lin W. 1979 Potassium and phosphate uptake in corn roots. Further evidence for an electrogenic
H+/K+ exchanger and an OH7P, antiporter. Plant Physiol. 63, 952-955. Lindsay W.L. 1979 Chemical equilibria in soils. John Wiley and Sons. New York. Lipton D.S., Blanchar R.W. and Blevins D.G. 1987 Citrate, malate, and succinate concentration in
exudates from P-sufficiënt and P-stressed Medicago sativa L. seedlings. Plant Physiol. 85, 315-317.
Loneragan J.F. and Asher C.J. 1967 Response of plants to phosphate concentration in solution culture:
II. Rate of phosphate absorption and its relation to growth. Soil Sei. 103, 311-318. Lopez-Hernandez D., Flores D., Siegelt G. and Rodriguez J.V. 1979 The effect of some organic
anions on phosphate removal from acid and calcareous soils. Soil Sei. 128, 321-326. Lopez-Hernandez D., Siegelt G. and Rodriguez J.V. 1986 Competitive adsorption of phosphate with
malate and oxalate by tropical soils. Soil Sei. Soc. Am. J. 50, 1460-1462. Lookman R., Grobet P., Merckx R. and Vlassak K. 1994 Phosphate sorption by synthetic amorphous
aluminium hydroxides: a 27A1 and 3IP solid-state MAS NMR spectroscopy study. Eur. J. Soil
Sei. 45, 37-44. Lookman R., Freese D., Merckx R., Vlassak K. and Van Riemsdijk W.H. 1995 Long-term kinetics
of phosphate release from soil. Environ. Sei. Technol. 29, 1569-1575. Lu S. and Miller M.H. 1994 Prediction of phosphorus uptake by field-grown maize with the Barber-
Cushman model. Soil Sei. Soc. Am. J. 58, 852-857. Madrid L. and Posner A.M. 1979 Desorption of phosphate from goethite. J. Soil Sei. 30, 697-707. Madrid L. and De Arambarri P. 1985 Adsorption of phosphate by two iron oxides in relation to their
porosity. J. Soil Sei. 36, 523-530.
156

REFERENCES
Manceau A. and Charlet L. 1994 The mechanism of selenate adsorption on goethite and hydrous ferrie
oxide. J. Colloid Interface Sei. 168, 87-93. Manning B.A. and Goldberg S. 1996 Modeling competitive adsorption of arsenate with phosphate and
molybdate on oxide minerals. Soil Sei. Soc. Am. J. 60, 121-131. Marsh K.B., Tillman R.W. and Syers J.K. 1987 Charge relationships of sulfate sorption by soils. Soil
Sei. Soc. Am. J. 51, 318-323. Marschner H., Römheld V., Horst W.J. and Martin P. 1986 Root-induced changes in the rhizosphere:
Importance for the mineral nutrition of plants. Z. Pflanzenernähr. Bodenk. 149, 441-456. Marschner H. 1995 Mineral nutrition of higher plants. Academic Press, London. 2nd edition. Mc Callister D.L. and Logan T.J. 1978 Phosphate adsorption-desorption characteristics of soils and
bottom sediments in the Maumee River Basin of Ohio. J. Environ. Qual. 7, 87-92. McGhee J.D. and Von Hippel P.H. 1974 Theoretical aspects of DNA-protein interactions: co-operative
and non-co-operative binding of large ligands to one-dimensional homogeneous lattice. J.
Mol. Biol. 86, 469-489. McPharlin I.R. and Bieleski R.L. 1989 Pi efflux and influx by P-adequate and P-deficient Spirodela
and Lemna. Aust. J. Plant Physiol. 16, 391-399. Meeussen J.C.L., Scheidegger A., Hiemstra T., Van Riemsdijk W.H. and Borkovec M. 1996
Predicting multicomponent adsorption and transport of fluoride at variable pH in a goethite-
silica sand system. Environ. Sei. Technol. 30, 481-488. Mench M. and Martin E. 1991 Mobilization of cadmium and other metals from two soils by root
exudates of Zea mays L., Nicotiana tabacum L., and Nicotiana rustica L. Plant Soil 132, 187-196.
Metson A.J. and Blakemore L.C. 1978 Sulphate retention by New Zealand soils in relation to the
competitive effect of phosphate. New Zealand J. Agric. Res. 21, 243-253. Mozaffari M. and Sims J.T. 1996 Phosphorus transformations in poultry litter-amended soils of the
Atlantic coastal plain. J. Environ. Qual. 25, 1357-1365. Müller G.T.A. and Stokes R.H. 1957 The mobility of the undissociated citric acid molecule in aqueous
solution. Trans. Faraday Soc. 53, 642-645. Murali V. and Aylmore L.A.G. 1983 Competitive adsorption during solute transport in soils: 3. A
review of experimental evidence of competitive adsorption and an evaluation of simple
competition models. Soil Sei. 136, 279-290. Naidu R., Haynes R.J., Gawandar J.S., Morrison R.J. and Fitzpatrick R.W. 1991 Chemical and
mineralogical properties and soil solution composition of acid soils from the South Pacific
Islands. In: Plant-Soil Interactions at Low pH. Eds. R.J. Wright, Baligar V.R. and Murrman R.P. pp 43-53. Kluwer Academic Publishers, Dordrecht, The Netherlands.
Nagarajah S., Posner A.M. and Quirk J.P. 1970 Competitive adsorption of phosphate with
polygalacturonate and other organic anions on kaolinite and oxide surface. Nature 228, 83-
85. Nielsen N.E. and Barber S.A. 1978 Differences among genotypes of corn in the kinetics of P uptake.
Agron. J. 70, 695-698.
157

Novozamsky I., Van Dijk D., Van der Lee J.J. and Houba V.J.G. 1993 Automated determination of
trace amounts of phosphate in soil extracts using malachite green. Commun. Soil Sei. Plant
Anal. 24, 1065-1076. Nye P.H. 1966a The effect of nutrient intensity and buffering power of a soil, and the absorbing
power, size and root hairs of a root, on nutrient absorption by diffusion. Plant Soil 25, 81-105.
Nye P.H. 1966b The measurement and mechanism of ion diffusion in soil. I. The relation between self-diffusion and bulk diffusion. J. Soil Sei. 17, 16-23.
Nye P.H. 1977 The rate-limiting step in plant nutrient absorption from soil. Soil Sei. 123, 292-297. Nye P.H. and Tinker P.B. 1977 Solute movement in the soil-root system. Blackwell scientific
publications, Oxford. Nye P.H. 1981 Changes of pH across the rhizosphere induced by roots. Plant Soil 61, 7-26. Nye P.H. 1984 pH changes and phosphate solubilization near roots - an example of coupled diffusion
processes. In: Roots, nutrient and water influx, and plant growth. Eds. Barber S.A., Bouldin
D.R. and D.M. Krai. SSSA, CSS A, and ASA, Madison WI. pp. 89-100. Nye P.H. and Staunton S. 1994 The self-diffusion of strongly adsorbed anions in soil: a two-path
model to simulate restricted access to exchange sites. Eur. J. Soil Sei. 45, 145-152. Ogram A.V., Jessup R.E., Ou L.T. and Rao P.S.C. 1985 Effects of sorption on biological degradation
rates of (2,4-Dichlorophenoxy)acetic acid in soils. Appl. Environ. Microbiol. 49, 582-287. Ohwaki Y. and Hirata H. 1992 Differences in carboxylic acid exudation among P-starved leguminous
crops in relation to carboxylic acid contents in plant tissue and phospholipid level in roots.
Soil Sei. Plant Nutr. 38, 235-243. Owen B.B. and Sweeton F.H. 1941 The conductance of hydrochloric acid in aqueous solutions from
5 to 65°. J. Am. Chem. Soc. 63, 2811-2817. Parfitt R.L., Atkinson A.J. and Smart R.St.C. 1975 The mechanism of phospahte fixation by iron
oxides. Soil Sei. Soc. Am. J. 39, 837-841. Parfitt R.L. and Smart R.St.C. 1977 Infrared spectra from binuclear bridging complexes of sulphate
adsorbed on goethite (a-FeOOH). J. Chem. Soc. Faraday Trans. 73, 769-802. Parfitt R.L. 1978 Anion adsorption by soils and soil materials. Adv. Agronomy 30, 1-50. Parfitt R.L. and Smart R.St.C. 1978 The mechanism of sulfate adsorption on iron oxides. Soil Sei. Soc.
Am. J. 42, 48-50. Parfitt R.L. 1979 The availability of P from phosphate-goethite bridging complexes. Desorption and
uptake by ryegrass. Plant Soil 53, 55-65. Parfitt R.L. 1982 Competitive adsorption of phosphate and sulphate on goethite (a-FeOOH): a note.
New Zealand J. Sei. 25, 147-148. Parfitt R.L. 1989 Phosphate reactions with natural allophane, ferrihydrite and goethite. J. Soil Sei. 40,
359-369. Petersen W. and Böttger M. 1991 Contribution of organic acids to the acidification of the rhizosphere
of maize seedlings. Plant Soil 132, 159-163. Reuter D.J. and Robinson J.B. 1986 Plant analysis, an interpretation manual. Inkata Press, Melbourne,
158

REFERENCES
Australia. Riley D. and Barber S.A. 1971 Effect of ammonium and nitrate fertilization on phosphorus uptake as
related to root-induced pH changes at the root-soil interface. Soil Sei. Soc. Am. Proc. 35, 301-306.
Robinson K.G., Farmer W.S. and Novak J.T. 1990 Availability of sorbed toluene in soils for
biodégradation by acclimated bacteria. Water Res. 24, 345-350. Roy W.R., Hassett J.J. and Griffin R.A. 1986 Competitive coefficients for the adsorption of arsenate,
molybdate, and phosphate mixtures by soils. Soil Sei. Soc. Am. J. 50, 1176-1182. Russell R.S. and Martin R.P. 1953 A study of the absorption and utilization of phosphate by young
barley plants. I. The effect of external concentration on the distribution of absorbed
phosphate between roots and shoots J. Exp. Bot. 4, 108-127. Ryden J.C., Syers J.K. and Tillman R.W. 1987 Inorganic anion sorption and interactions with
phosphate sorption by hydrous ferric oxide gel. J. Soil Sei. 38, 211-217. Sample E.C., Soper R.J. and Racz G.J. 1980 Reactions of phosphate fertilizers in soils. In: The role
of phosphorus in agriculture. Eds. Khasawneh F.E., Sample E.C. and Kamprath E.J. ASA, CSSA, SSSA, Madison WI. pp. 263-310.
Sanchez P.A. Properties and management of soils in the tropics. John Wiley and Sons, New York. Sanders F.E. and Tinker P.B. 1971 Mechanism of absorption of phosphate from soil by Endogone
mycorrhizas. Nature 233, 278-279. Scheidegger A., Borkovec M. and Sticher H. 1993 Coating of silica sand with goethite: preparation
and analytical identification. Geoderma 58, 43-65. Scheidegger A., Bürgisser CS., Borkovec M., Sticher H., Meeussen J.C.L. and Van Riemsdijk W.H.
1994 Convective transport of acids and bases in porous media. Water Resources Res. 30,
2937-2944. Schenk M.K. and Barber S.A. 1979 Root characteristics of corn genotypes as related to P uptake.
Agron. J. 71, 921-924. Schenk M.K. and Barber S.A. 1980 Potassium and phosphorus uptake by corn genotypes grown in
the field as influenced by root characteristics. Plant Soil 54, 65-76. Schj0rring J.K. and Jensen P. 1984 Phosphorus nutrition of barley, buchwheat and rape seedlings. II.
Influx and efflux of phosphorus by intact roots of different P status. Physiol. Plant. 61,584-590.
Schwertmann U. and Taylor R.M. 1977 Iron oxides. In: Minerals in Soil Environments. Eds. Dixon
S.B. and Weed J.B. Soil Science Society of America, Madison, WI. pp. 145-180. Shand A.S., Macklon A.E.S., Edwards A.C. and Smith S. 1994 Inorganic and organic P in soil
solutions from three upland soils. I. Effect of soil solution extraction conditions, soil type
and season. Plant Soil 159, 255-264. Silberbush M. and Barber S.A. 1983 Sensitivity of simulated phosphorus uptake to parameters used
by a mechanistic-mathematical model. Plant Soil 74, 93-100. Solis P. and Torrent J. 1989a Phosphate sorption by calcareous vertisols and inceptisols of Spain. Soil
Sei. Soc. Am. J. 53, 456-459.
159

Sous P. and Torrent J. 1989b Phosphate fractions in calcareous vertisols and inceptisols of Spain. Soil
Sei. Soc. Am. J. 53, 462-466. Soltan S., Römer W., Adgo E., Gerke J. and Schilling G. 1993 Phosphate sorption by Egyptian,
Ethiopian and German soils and P uptake by rye (Secale cereale L.) seedlings. Z
Pflanzenernähr. Bodenk. 156, 501-506. Spanswick R.M. 1981 Electrogenic ion pumps. Armu. Rev. Plant Physiol. 32, 267-289. Staunton S. and Leprince F. 1996 Effect of pH and some organic anions on the solubility of soil
phosphate: implications for P bioavailability. Eur. J. Soil Sei. 47, 231-239. Strauss R., Brummer G.W. and Barrow N.J. 1997 Effects of crystallinity of goethite II. Rates of
sorption and desorption of phosphate. Eur. J. Soil Sei. 48, 101-114. Ström L., Olsson T. and Tyler G. 1994 Differences between calcifuge and acidifuge plants in roots
exudation of low-molecular organic acids. Plant Soil 167, 239-245. Sun X. and Doner H.E. 1996 An investigation of arsenate and arsenite bonding structures on goethite
by FTJ.R. Soil Sei. 161, 865-872. Tarafdar J.C. and Jungk A. 1987 Phosphatase activity in the rhizosphere and its relation to the
depletion of soil organic phosphorus. Biol. Fertil. Soils 3, 199-204. Tarafdar J.C. and Ciaassen N. 1988 Organic phosphorus compounds as a phosphorus source for higher
plants through the activity of phosphatases produced by plant roots and microorganisms.
Biol. Fertil. Soils 5, 308-312. Tarafdar J.C. and Marschner H. 1994 Phosphatase activity in the rhizosphere and hyphosphere of VA
mycorrhizal wheat supplied with inorganic and organic phosphorus. Soil Biol. Biochem. 26,
387-395. Tejedor-Tejedor M.I. and Anderson M.A. 1990 Protonation of phosphate on the surface of goethite
as studied by CIR-FTIR and electrophoretic mobility. Langmuir 6, 602-611. Tejedor-Tejedor M.I., Yost E.C. and Anderson M.A. 1992 Characterization of benzoic and phenolic
complexes at the goethite/aqueous solution interface using cylindrical internal reflection
Fourier transform infrared spectroscopy. 2. Bonding structures. Langmuir 8, 525-533. Thomson C.J., Marschner H. and Römheld V. 1993 Effect of nitrogen fertilizer form on pH of the
bulk soil and rhizosphere, and on the growth, phosphorus, and micronutrient uptake of bean.
J. Plant Nutr. 16, 493-506. Tipping E. 1981 The adsorption of aquatic humic substances by iron oxides. Geochim. Cosmochim.
Acta 45, 191-199. Tisdale S.L., Nelson W.L. and Beaton J.D. 1985 Soil fertility and fertilizers. Macmillan publishing
company, New York. 4th edition. Torrent J., Barrón V. and Schwertmann U. 1990 Phosphate adsorption and desorption by goethites
differing in crystal morphology. Soil Sei. Soc. Am. J. 54, 1007-1012. Torrent J., Schwertmann U. and Barrón V. 1992 Fast and slow phosphate sorption by goethite-rich
natural materials. Clays Clay Min. 40, 515-527. Torrent J. 1997 Interactions between phosphate and iron oxide. Adv. in GeoEcology 30, 321-344. Turner L.J. and Kramer J.R. 1991 Sulfate ion binding on goethite and hematite. Soil Sei. 152, 226-
160
REFERENCES
230. Ullrich-Eberius CL, Novacky A., Fischer E. and Lüttge U. 1981 Relationship between energy-
dependent phosphate uptake and the electrical membrane potential in Lemna gibba Gl . Plant
Physiol. 67,797-801. Van der Eijk D. 1997 Phosphate fixation and the response of maize to fertilizer phosphate in Kenyan
soils. PhD thesis, Wageningen Agricultural University. Van der Zee S.E.A.T.M. and Van Riemsdijk W.H. 1988 Model for long-term phosphate reaction
kinetics in soil. J. Environ. Qual. 17, 35-41. Van Riemsdijk W.H., Van der Linden A.M.A. and Boumans L.J.M. 1984 Phosphate sorption by soils:
III. The P diffusion-precipitation model tested for three acid sandy soils. Soil Sei. Soc. Am.
J. 48, 545-548. Venema P., Hiemstra T. and Van Riemsdijk W.H. 1996 Multisite adsorption of cadmium on goethite.
J. Colloid Interface Sei. 183, 515-527. Venema P. 1997 Charging and ion adsorption behaviour of different iron (hydr)oxides. Chapter 7,
Comparison of different iron (hydr)oxides with respect to their charging, cat- and anion
adsorption behaviour. PhD thesis, Wageningen Agricultural University, The Netherlands. Venema P., Hiemstra T. and Van Riemsdijk W.H. 1997 Interaction of cadmium with phosphate on
goethite. J. Colloid Interface Sei. 192, 94-103. Violante A., Colombo C. and Buondonno A. 1991 Competitive adsorption of phosphate and oxalate
by aluminum oxides. Soil Sei. Soc. Am. J. 55, 65-70. Waychunas G.A., Rea B.A., Fuller C.C. and Davis J.A. 1993 Surface chemistry of ferrihydrite: Part
1. EXAFS studies of the geometry of coprecipitated and adsorbed arsenate. Geochim.
Cosmochim. Acta 57, 2251-2269. Willett LR., Chartres C.J. and Nguyen T.T. 1988 Migration of phosphate into aggregated particles of
ferrihydrite. J. Soil Sei. 39, 275-282. Xu H., Allard B. and Grimvall A. 1988 Influence of pH and organic substance on the adsorption of
As(V) on geologic materials. Water, Air, Soil Pollut. 40, 293-305. Yao W. and Millero F.J. 1996 Adsorption of phosphate on manganese dioxide in seawater. Environ.
Sei. Technol. 30, 536-541. Zachara J.M., Girvin D.C., Schmidt R.L. and Resch C.T. 1987 Chromate adsorption on amorphous
iron oxyhydroxide in the presence of major groundwater ions. Environ. Sei. Technol. 21, 589-594.
Zech W., Alt H.G., Haumaier L. and Blasek R. 1987 Characterization of phosphorus fractions in
mountain soils of the Bavarian alps by 3IP NMR spectroscopy. Z. Pflanzenemähr. Bodenk.
150, 119-123. Zhang F.S., Ma J. and Cao Y.P. 1997 Phosphorus deficiency enhances root exudation of low-
molecular weight organic acids and utilization of sparingly soluble inorganic phosphates by
radish (Raghanus sativus L.) and rape (Brassica napus L.) plants. Plant Soil 196, 261-264. Zhang P.C. and Sparks D.L. 1990 Kinetics and mechanisms of sulfate adsorption/desorption on
goethite using pressure-jump relaxation. Soil Sei. Soc. Am. J. 54, 1266-1273.
161

Summary
The sorption of phosphate on iron and aluminium (hydr)oxides in soils strongly influences its mobility and bioavailability. Generally, in both acid and calcareous soils, phosphate desorbed from metal (hydr)oxides is an important source of phosphorus for plant uptake. In acid weathered soils that contain high amounts of oxides, phosphate is strongly adsorbed, which results in very low concentrations of phosphate in solution and P limited crop growth. Conversely, in soils in which high amounts of phosphorus have accumulated due to very high P fertilization rates over a very long period, phosphate concentrations in the soil solution are high and phosphate may leach to ground and surface water.
For both soil fertility and environmental problems it is important to gain more quantitative insight in the mobility and availability of phosphate that is sorbed on metal (hydr)oxides in soil. The availability of soil phosphorus is usually assessed by chemical extraction of the soil. However, these methods are only to a very limited degree based on knowledge of the chemical behaviour of phosphorus in soils. This study aims to relate the availability of phosphorus to plants to fundamental physico-chemical knowledge of P binding on metal (hydr)oxides.
Apart from phosphate sorbed on metal (hydr)oxides, phosphorus in soils is present in different forms; organic phosphate, phosphorus in minerals and phosphate adsorbed on edges of clay minerals. Because these different P forms react differently to e.g. changes in the phosphate concentration in solution and pH, this research was not carried out with soils but with artificial substrates containing goethite on which phosphate is adsorbed as P source. Goethite was chosen because it is the most abundant iron oxide in soils. Experiments and model calculations of phosphate adsorption and uptake by plants have been integrated to study the plant-availability of phosphate adsorbed on goethite and the influence that plant and soil factors may have on the plant-availability of phosphate.
The plant-availability of phosphate can be estimated from P uptake by plants growing under P limiting conditions. To predict uptake with a mathematical model under these conditions, the root surface is assumed to behave as a zero sink, which means that all phosphate arriving at the root surface is taken up. At P limiting conditions, root hairs make a considerable contribution to total uptake. Two methods to compute zero sink uptake by a root with root hairs are compared. In the TERM model, the continuity equation for zero sink uptake by roots is extended with a sink term to account for influx into root hairs. An approximate analytical solution for a
163

steady rate concentration profile around the root hair is used to compute this sink term. In the other model, the diffusion equation defined in three dimensions is solved for boundary conditions that impose zero sink uptake behaviour of the root and root hairs.
With the two models uptake was predicted at P limiting conditions, and the influence of root hair length, root hair density and buffering on predicted uptake was computed. Differences in uptake computed with the models were small and could be attributed to the use of the approximate analytical solution for root hair influx in the TERM model. During uptake phosphate is transported from the bulk soil into the root hair cylinder, resulting in concentration profiles around the root hairs that do not conform to a steady rate profile. Because the TERM model needs much less computation time than the 3D model, the TERM model is preferred for the calculation of nutrient uptake by a growing root system.
The plant-availability of phosphate adsorbed on goethite has been determined experimentally from the P uptake of plants grown on an artificial substrate containing phosphate adsorbed on goethite as P source. The substrate was sand coated with goethite on which phosphate was adsorbed, and this sand was mixed with nutrient solution containing all nutrients except phosphate. When more phosphate was adsorbed per unit surface area of goethite, the plant-availability of the sorbed phosphate increased. With high P loading of goethite, less empty surface sites are available for binding and the electrostatic interaction between phosphate and the surface decreases, which results in a larger concentration of phosphate in solution and thus larger availability. Increasing the amount of reactive surface area in the substrate, while the total amount of phosphorus present was not changed, decreased the availability of phosphate.
Plant P uptake was predicted accurately based on non-linear phosphate sorption on goethite and zero sink uptake by a growing root system. Phosphate sorption was assumed to be fully and instantaneously reversible, implicating that P desorption is not limiting uptake. Because the plants were grown at P limiting conditions, the phosphate concentrations in solution were relatively low and phosphate concentration gradients in the substrate were small. To maintain equilibrium at these small concentrations in solution only relatively low desorption rates are needed.
Non-linear phosphate adsorption on goethite was incorporated into the model with a Langmuir-Freundlich equation that described measured adsorption data determined at the initial experimental conditions. This means that changes from the
164
SUMMARY
initial conditions that influence P sorption behaviour could not be included in the model. For one treatment, P uptake was strongly underestimated and this was attributed to a decrease in pH during the uptake experiment. Batch adsorption experiments showed that P adsorption in a background of nutrient solution decreased with lower pH and it was suggested that this effect was due to the presence of sulphate.
The adsorption of both phosphate and sulphate on goethite was studied in single anion experiments and in competition experiments at concentrations relevant for natural systems. Phosphate adsorption was determined at P solution concentrations ranging from 10"8 - 10"3 M and showed highly non-linear adsorption behaviour even at the very low concentrations, indicating high-affinity adsorption behaviour of phosphate. The affinity of sulphate for the goethite surface was much lower than the affinity of phosphate. This resulted in a stronger pH dependence of sulphate adsorption and no adsorption of sulphate above the pristine point of zero charge.
The difference in affinity between sulphate and phosphate was also illustrated in competitive adsorption experiments. Sulphate adsorption decreased strongly in the presence of phosphate over the whole pH range at which sulphate is adsorbed. Conversely, the presence of sulphate only slightly decreased the adsorption of phosphate at low pH. At low P loading of goethite almost all phosphate present is adsorbed, leading to very low phosphate concentrations in solution. Competition between sulphate and phosphate under these conditions results in only a small decrease in the amount of phosphate adsorbed, expressed per unit reactive surface area, but in a considerable increase in the phosphate concentration in solution.
Ion adsorption was modelled with the CD-MUSIC model, which is based on a description of the goethite surface with different types of reactive sites and on the use of surface complexes that have been identified in spectroscopic studies. Using bidentate, protonated bidentate and monodentate complex formation, phosphate adsorption was described well over the whole range of P concentrations. Model calculations of sulphate adsorption showed that the data could be described accurately when bidentate complexation of sulphate was considered, but not when outer sphere complexation assuming ion pairs or a combination of bidentate complexation and ion pairs was used. Competitive adsorption of phosphate and sulphate was predicted well using the model constants obtained from the adsorption experiments with phosphate or sulphate in indifferent electrolyte solution.
165

The competitive effect of sulphate on the availability of adsorbed phosphate to plants was tested in a P uptake experiment. Because of the influence of pH on competitive adsorption it was important to create treatments with a different but constant pH. Therefore, plants were grown on suspensions of goethite on which phosphate was adsorbed at different but constant pH values. These suspensions were mixed with nutrient solution at two levels of sulphate. The total amount of phosphate in all treatments was the same. Plant P uptake differed strongly between the treatments. At low sulphate concentration and pH 5.5 uptake was very low, 2 umol plant', whereas at high sulphate concentration combined with a low pH of 3.7 uptake amounted to 55 umol P plant"1. The P solution concentration in these treatments was too low to be measured directly, but separate adsorption experiments using 32P showed that the P concentration in solution could be predicted accurately with the CD-MUSIC model and the model parameters determined previously. Phosphorus uptake by the plants was closely correlated to the predicted P concentration in solution, indicating that competitive adsorption of sulphate and phosphate caused the large differences in the plant-availability of phosphate.
Next to inorganic anions also organic matter and smaller organic anions may be adsorbed on metal (hydr)oxides. Small weak organic anions such as citrate may be present in soil due to excretion from roots and microorganisms and decomposition of organic matter, but can also be regarded as a model component for organic matter because of their similar adsorption behaviour. In single anion adsorption experiments smaller amounts of citrate were adsorbed on goethite compared with phosphate, which was attributed to the larger number of reactive surface groups of goethite involved in the binding of citrate and the somewhat lower affinity of citrate for the goethite surface in comparison with phosphate.
Competition between citrate and phosphate was strongest in the pH range 4-5 and was suggested to be predominantly due to competition for binding sites. The competitive effect of citrate on phosphate is strong: the phosphate concentration in solution increased up to 600-fold in the presence of citrate. The extent of competition depends on the relative concentrations of the two anions in relation to the amount of reactive surface area. Because of the highly non-linear adsorption behaviour of phosphate on goethite, which results in very small phosphate concentrations in solution at low P loading of goethite, anion competition causes a much larger increase of the P concentration in solution at low than at high P loading.
166

SUMMARY
The competitive adsorption of citrate and phosphate on goethite was predicted satisfactorily with the CD-MUSIC model using the phosphate adsorption complexes described above and assuming inner sphere complexation and hydrogen bonding of citrate with the goethite surface involving in total 3 or 4 surface groups of goethite. Because competition for surface sites was dominating the interaction between citrate and phosphate, interaction between large organic compounds and phosphate may be expected to be even stronger due to the larger number of binding sites of these organic compounds.
The competitive effect of small organic anions on phosphate adsorption is important in evaluating the P mobilizing effect of organic anion exudation by plant roots. By integrating the CD-MUSIC ion adsorption model and the uptake model, the effect of citrate exudation by roots on P uptake was quantified. Degradation of citrate in soil was incorporated assuming that only dissolved citrate can be utilized by microorganisms. The model study was carried out for a substrate of sand coated with goethite on which phosphate is adsorbed and with model parameter values, concerning the rate of citrate exudation and degradation of dissolved citrate, derived from literature.
Citrate exudation from roots resulted in an increase in predicted P uptake, particularly when the P loading of goethite was low. Exudation about doubled uptake at high P loading of goethite, and increased uptake even 30-fold at low P loading. Due to competitive adsorption of phosphate and citrate on the goethite surface, the concentration of phosphate in solution increases resulting in larger plant-availability of phosphate. At low P loading of goehtite, the relative increase in the P concentration in solution is much larger than at high P loading. Moreover, at low P loading, more citrate is sorbed at the goethite surface which increases the retention time of citrate in the 'soil'.
The present results show that the combination of a detailed speciation model and an uptake model is a powerful tool to evaluate the plant-availability of phosphate and to assess the potential effect of P mobilizing strategies quantitatively. For this type of modelling it is very important that the speciation model gives a good prediction of the influence of pH, anion competition etc., also when these parameters change simultaneously. Especially, good predictions of P speciation at very low concentrations are important, because the phosphate concentration in solution at the root surface, which ultimately determines the P uptake rate, may become very low.
167
Samenvatting
De mobiliteit en biobeschikbaarheid van fosfaat in de bodem wordt sterk beïnvloed door de adsorptie van fosfaat aan ijzer en aluminium(hydr)oxiden. Het geadsorbeerde fosfaat is in evenwicht met fosfaat in oplossing. De ligging van dit evenwicht wordt o.a. bepaald door de totaal aanwezige hoeveelheid fosfaat, de zuurgraad (pH) van de oplossing en de aanwezigheid van andere ionen die kunnen adsorberen. Fosfaat dat wordt gedesorbeerd van metaal (hydr)oxiden is over het algemeen een belangrijke bron van fosfor voor plantengroei in zowel zure als kalkhoudende gronden. In zure verweerde gronden die grote hoeveelheden oxiden bevatten wordt fosfaat sterk gebonden, waardoor de fosfaatconcentratie in de bodemoplossing erg laag is en de groei van gewassen wordt beperkt door fosfaatgebrek. Daarentegen, in gronden waarin zich grote hoeveelheden fosfaat bevinden als gevolg van decennialange overmesting is de fosfaatconcentratie in de bodemoplossing hoog en kan fosfaatuitspoeling naar het grond- en oppervlaktewater plaatsvinden.
Voor zowel problemen met een te lage als een te ruime fosfaattoestand van de bodem is het belangrijk om meer kwantitatief inzicht te krijgen in de mobiliteit en beschikbaarheid van fosfaat dat is gebonden aan metaal(hydr)oxiden. Deze fosfaattoestand wordt doorgaans bepaald door middel van chemische extractie van grond. Echter, deze extractiemethoden zijn maar in heel beperkte mate gebaseerd op kennis van het chemisch gedrag van fosfaat in de bodem. In deze studie is getracht de beschikbaarheid van fosfaat voor opname door planten te relateren aan fundamentele fysisch-chemische eigenschappen van fosfaatbinding aan metaal(hydr)oxiden.
In de bodem komen, naast fosfaat geadsorbeerd aan metaal(hydr)oxiden, andere bindingsvormen van fosfaat voor, namelijk organisch fosfaat, fosfaat in mineralen en fosfaat geadsorbeerd aan randen van kleimineralen. Omdat deze verschillende fosfaatvormen op een verschillende manier reageren op bijvoorbeeld veranderingen van de fosfaatconcentratie in oplossing en de bodem-pH, is dit onderzoek niet met grond uitgevoerd maar met kunstmatige substraten. Deze substraten bevatten het ijzeroxide goethite waaraan fosfaat is gebonden. Goethite is het ijzeroxide dat het meest voorkomt in de bodem. Experimenten en modelberekeningen van fosfaatbinding aan goethite en fosfaatopname door planten zijn geïntegreerd om de beschikbaarheid van geadsorbeerd fosfaat voor opname door planten te bestuderen.
De beschikbaarheid van fosfaat voor planten kan worden geschat uit de fosfaatopname van planten die groeien onder fosfaatgebrekkige omstandigheden. De opname kan worden berekend met een wiskundig model waarin wordt aangenomen dat
169
de wortel zich gedraagt als een zogenaamde 'zero sink', dat wil zeggen dat al het fosfaat dat is getransporteerd naar het worteloppervlak wordt opgenomen. Onder fosfaatgebrekkige omstandigheden leveren wortelharen een belangrijke bijdrage aan de totale opname. Twee methoden om de opname van een wortel met wortelharen te berekenen zijn vergeleken. In de ene methode is een model voor de zero sink opname van de wortel uitgebreid met een aparte term voor opname door de wortelharen (TERM model). In de andere is de diffusievergelijking in drie dimensies opgelost voor randvoorwaarden die zero sink gedrag van de wortel en wortelharen opleggen (3D model).
Met de twee modellen is de opname onder P gebrekkige omstandigheden, en de invloed van wortellengte, wortelhaardichtheid en buffering op opname berekend. De verschillen in opname berekend met de twee modellen waren gering en zijn veroorzaakt door het gebruik van een benaderende analytische oplossing voor wortelhaaropname in het TERM model, die het ontstane concentratieprofiel rond de wortelharen niet goed beschrijft. Omdat het TERM model veel minder rekentijd nodig heeft dan het 3D model, is aan het TERM model de voorkeur gegeven voor het modelleren van de opname door een groeiend wortelstelsel.
De beschikbaarheid van fosfaat dat is gebonden aan goethite is bepaald door de fosfaatopname van planten te meten die groeien op een kunstmatig substraat van zand gecoat met goethite waaraan fosfaat is geadsorbeerd. Dit substraat is gemengd met voedingsoplossing die alle essentiële voedingsstoffen behalve fosfaat bevat. Wanneer per eenheid goethite-oppervlak meer fosfaat werd geadsorbeerd, nam de beschikbaarheid van fosfaat toe. Bij hogere fosfaatbezetting van goethite neemt het aantal lege bindingsplaatsen af en daalt de electrostatische interactie tussen fosfaat en het goethite-oppervlak, waardoor de concentratie van fosfaat in oplossing stijgt en de beschikbaarheid groter is. Bij een grotere hoeveelheid goethite-oppervlak in het substraat, maar een gelijke totale hoeveelheid fosfaat, nam de beschikbaarheid van fosfaat af.
De opname van fosfaat door de planten werd goed voorspeld aan de hand van de gemeten niet-lineaire adsorptie van fosfaat aan goethite, uitgaande van het zero sink opnamegedrag van een groeiend wortelstelsel. In het model wordt aangenomen dat het geadsorbeerd fosfaat volledig en onmiddellijk desorbeerbaar is, wat betekent dat het proces van fosfaatdesorptie de opname niet vertraagd. De juistheid van deze veronderstelling is aannemelijk gemaakt met modelberekeningen waarin werd aangetoond dat slechts lage desorptiesnelheden nodig zijn om evenwicht tussen het geadsorbeerd fosfaat en de lage concentraties in oplossing die in dit experiment bestonden te handhaven.
170

SAMENVATTING
Fosfaatadsorptie aan goethite is in het model ingebracht met een Langmuir-Freundlich vergelijking die is gefit op fosfaatadsorptiedata die zijn bepaald voor de initiële experimentele condities in het opname-experiment. Dit betekent dat het effect van veranderingen in de experimentele condities op de fosfaatadsorptie niet in het model kunnen worden meegenomen. In een van de behandelingen veroorzaakte een pH-daling een stijging van de fosfaatconcentratie in oplossing, waarschijnlijk door de aanwezigheid van sulfaat in de voedingsoplossing, en hierdoor nam de beschikbaarheid van fosfaat toe. Omdat dit effect niet kon worden meegenomen in de modellering, werd voor deze behandeling de fosfaatopname sterk onderschat.
De adsorptie van fosfaat en sulfaat aan goethite in concentraties die relevant zijn in natuurlijke systemen is bepaald in experimenten met de afzonderlijke en met beide anionen. De adsorptie van fosfaat vertoont een sterk niet-lineair verband met de fosfaatconcentratie in oplossing over het volledige concentratietraject van 10"8 tot 10"3
M waarvoor de fosfaatadsorptie werd bepaald. De affinititeit van sulfaat voor het goethite-oppervlak is veel lager dan van fosfaat, wat tot uiting kwam in de pH-afhankelijkheid van sulfaatadsorptie en in experimenten waarin sulfaat en fosfaat beide aan goethite werden toegevoegd. De adsorptie van sulfaat neemt sterk af wanneer ook fosfaat aanwezig is, maar omgekeerd heeft sulfaat maar een klein effect op de fosfaatadsorptie en dan alleen bij lage pH. Wanneer de fosfaatbezetting aan goethite laag is, wordt fosfaat erg sterk geadsorbeerd wat betekent dat de hoeveelheid fosfaat die nog in oplossing is erg klein is. Als onder deze omstandigheden competitie optreedt leidt dat tot een geringe afname van de hoeveelheid fosfaat die is geadsorbeerd, maar tot een aanzienlijke toename van de concentratie fosfaat in oplossing.
De adsorptie van fosfaat en sulfaat aan goethite is gemodelleerd met het CD-MUSIC ion adsorptie model. Dit model is gebaseerd op de eigenschappen van het adsorberend oppervlak, zoals de verschillende typen reactieve oppervlaktegroepen, en de vorming van adsorptiecomplexen zoals die zijn aangetoond met spectroscopische technieken. Voorspelling van de competitieve adsorptie van sulfaat en fosfaat met behulp van modelparameterwaarden verkregen uit experimenten met steeds één van de beide anionen leidde tot een goede overeenkomst met de gemeten data.
De invloed van sulfaat op de beschikbaarheid van geadsorbeerd fosfaat voor planten is onderzocht in een fosfaatopname-experiment. Omdat er een duidelijk effect is van de pH op competitie van sulfaat en fosfaat aan goethite zijn de planten gegroeid
171
op suspensies van goethite waaraan fosfaat is geadsorbeerd bij verschillende maar constante pH-waarden. Deze suspensions zijn gemengd met voedingsoplossing, waarmee twee sulfaatniveau's werden aangebracht. De totale hoeveelheid fosfaat in elke suspensie is gelijk. De fosfaatopname van de planten in de verschillende behandelingen verschilde sterk. Bij lage sulfaatconcentratie en pH 5.5 was de fosfaatopname erg gering, 2 umol plant', terwijl bij hoge sulfaatconcentratie en een lage pH van 3.7 ongeveer 55 umol fosfaat per plant werd opgenomen. De concentratie fosfaat in oplossing was te laag om direct te kunnen meten, maar aparte adsorptie-experimenten met 32P toonden aan dat de fosfaatconcentratie kon worden voorspeld met het CD-MUSIC model en de eerder gevonden parameterwaarden. De fosfaatopname van de planten was nauw gecorreleerd met de voorspelde fosfaatconcentratie in oplossing. Dit toont aan dat het verschil in fosfaatbeschikbaarheid tussen de behandelingen kan worden verklaard uit competitie tussen sulfaat en fosfaat voor het goethite-oppervlak.
Naast anorganische anionen zoals fosfaat en sulfaat kunnen ook organische stof en kleinere organische anionen adsorberen aan metaal(hydr)oxiden. Anionen van kleine zwakke organische zuren zoals citraat kunnen in de bodem aanwezig zijn doordat ze worden uitgescheiden door wortels en microorganismen of vrijkomen bij de afbraak van organische stof, maar kunnen ook beschouwd worden als modelionen voor organische stof omdat ze op vergelijkbare manier binden aan oxiden. In vergelijking tot fosfaat wordt citraat in kleinere hoeveelheden aan goethite geadsorbeerd, omdat citraat bindt aan een groter aantal oppervlaktegroepen van goethite en omdat het een wat lagere affiniteit heeft voor het goethite-oppervlak dan fosfaat.
Competitie tussen citraat en fosfaat voor adsorptie aan goethite was het sterkst in het pH traject 4-5, en was waarschijnlijk vooral het gevolg van competitie voor bindingsplaatsen aan het goethite-oppervlak. De invloed van competitie van citraat op de fosfaatadsorptie is groot: de fosfaatconcentratie in oplossing nam tot 600-voud toe in aanwezigheid van citraat. De mate van competitie hangt af van de relatieve concentraties van de twee anionen en de hoeveelheid goethite-oppervlak dat aanwezig is. Door het sterk niet-lineaire adsorptiegedrag van fosfaat, wat leidt tot zeer lage fosfaatconcentraties in oplossing bij lage fosfaatbezetting van goethite, veroorzaakt anion competitie een relatief veel sterkere toename in de fosfaatconcentratie in oplossing bij lage dan hogere fosfaatbezetting van goethite.
Wanneer rekening gehouden werd met het verschillend aantal bindingsplaatsen dat nodig is voor de adsorptie van citraat (3 of 4) en fosfaat (1 of 2) kon de
172

SAMENVATTING
competitieve adsorptie van citraat en fosfaat heel redelijk worden voorspeld. Omdat de competitie tussen citraat en fosfaat wordt gedomineerd door competitie voor lege bindingsplaatsen aan goethite is het te verwachten dat grotere organische moleculen een nog sterkere interactie met fosfaat zullen vertonen.
Competitie tussen kleine organische anionen en fosfaat voor adsorptie kan een belangrijke rol spelen in de mobilisatie van fosfaat zoals dat is waargenomen na de exudatie van organische zuren door plantenwortels. Door het CD-MUSIC ion adsorptie-model te combineren met het opnamemodel kan de invloed van de exudatie van citraat op de beschikbaarheid van fosfaat worden gekwantificeerd. De afbraak van citraat is meegenomen in het model onder de aanname dat alleen opgelost citraat kan worden afgebroken door microorganismen. De modelberekeningen zijn uitgevoerd voor een substraat van zand gecoat met goethite waaraan fosfaat is geadsorbeerd. De modelparameterwaarden voor de exudatiesnelheid van citraat en de afbraak van opgelost citraat zijn afgeleid uit de literatuur.
De exudatie van citraat uit plantenwortels resulteert in een toename van de voorspelde fosfaatopname van de planten. Bij relatief hoge fosfaatbezetting van goethite veroorzaakte uitscheiding van citraat ongeveer een verdubbeling van de voorspelde opname, terwijl bij lage fosfaatbezetting de opname zelfs 30-maal hoger was. Als gevolg van competitie tussen citraat en fosfaat aan het goethite-oppervlak neemt de concentratie van fosfaat in oplossing toe, waardoor de beschikbaarheid van fosfaat groter wordt. Bij lage fosfaatbezetting van goethite is de relatieve toename van de fosfaatconcentratie in oplossing veel groter dan bij hoge fosfaatbezetting. Bovendien kan bij lage fosfaatbezetting meer van het uitgescheiden citraat geadsorbeerd worden, wat de verblijftijd van citraat verlengd omdat het pas kan worden afgebroken nadat het gedesorbeerd en dus vrij in de oplossing aanwezig is.
De resultaten laten zien dat de combinatie van een gedetailleerd speciatiemodel en een opnamemodel gebruikt kan worden om de beschikbaarheid van fosfaat te evalueren en om het potentiële effect van fosfaatmobiliserende strategieën kwantitatief te bestuderen. Voor dit soort modelberekeningen is het echter van groot belang dat het speciatiemodel een goede voorspelling geeft van de invloed van pH, anion competitie enz., ook wanneer deze tegelijk veranderen. In het bijzonder is een goede voorspelling bij erg lage concentraties van belang, omdat de fosfaatconcentratie in oplossing aan het worteloppervlak, die uiteindelijk de fosfaatopnamesnelheid bepaalt, erg laag kan worden.
173
Levensloop
Jeanine (Jannetje Susanna) Geelhoed werd geboren op 23 oktober 1966 te Wissenkerke. In 1985 behaalde zij het VWO-diploma aan het Christelijk Lyceum voor Zeeland te Goes. Vervolgens studeerde ze landbouwplantenteelt aan de Landbouwuniversiteit in Wageningen, waarvoor ze in 1990 de stage uitvoerde bij het Department of Scientific and Industrial Research te Palmerston North, Nieuw Zeeland. Met de afstudeervakken Plantenfysiologie, Graslandkunde en Theoretische Teeltkunde rondde ze in 1991 haar studie af.
Van februari 1992 tot april 1996 werkte ze bij de vakgroep Bodemkunde en Plantenvoeding van de Landbouwuniversiteit als Assistent in Opleiding aan een project bij de secties Bodemvruchtbaarheid en Bodemscheikunde getiteld: 'Kwantitatieve evaluatie van de beschikbaarheid van bodemfosfaat voor plantenwortels'. De belangrijkste resultaten van dit onderzoek zijn beschreven in het proefschrift.
Sinds 1 januari 1998 is ze aangesteld als toegevoegd onderzoeker bij de sectie Bodemkunde en Plantenvoeding, leerstoelgroep Bodemvruchtbaarheid en de daar gedetacheerde afdeling van het Nutriënten Management Instituut.
175

Nawoord
Nu het proefschrift klaar is, is het goed om terug te kijken en een aantal mensen te bedanken.
Allereerst wil ik mijn promotoren, Günter Findenegg en Willem van Riemsdijk, bedanken voor de mogelijkheid om aan dit veelzijdige onderwerp te werken. Het werk was zeer afwisselend: in het lab, experimenten met en zonder plantjes, en achter het bureau, lezen, modelleren en schrijven. Deze combinatie beviel me erg goed. Günter, jij nam het initiatief voor een project waarin de beschikbaarheid van bodemfosfaat zou worden bestudeerd. Alleen al de beschikbaarheid van fosfaat geadsorbeerd aan oxiden bleek veel uitdagingen te herbergen. Willem, jij raakte in de loop van de tijd steeds meer betrokken bij het onderzoek. We werden steeds enthousiaster toen het mogelijk (b)leek om met het CD-MUSIC model voorspellingen te doen over de beschikbaarheid van geadsorbeerd fosfaat. Bedankt voor de begeleiding, het becommentariëren van manuscripten en voor de vrijheid die jullie me hebben gegeven.
Tijdens mijn project heb ik ook samengewerkt met een aantal andere mensen. In sommige gevallen komt dit tot uitdrukking in een gezamenlijke publicatie, maar vaker ook niet. Alle hulp, discussie en samenwerking waardeer ik daar zeker niet minder om. Tjisse Hiemstra heeft mij geholpen om wegwijs te worden in de modellering van adsorptieprocessen en heeft twee manuscripten zeer kritisch doorgenomen. Sipko Mous legde mij uit dat ik de aannames die ik deed om wortelharen in het opnamemodel te stoppen 'gewoon' kon narekenen. Het model wat ik hiervoor heb gebruikt was relatief eenvoudig, maar kon wel een computer bij de vakgroep Wiskunde dagenlang aan het werk houden. Bij Peter Venema kon ik altijd terecht met al mijn vragen over goethite, adsorptie, titratie-experimenten en het CD-MUSIC model. Zijn antwoord op mijn vragen begon steevast met 'O, maar dat is toch niet zo moeilijk...', waarna er altijd uitleg volgde. Samen met René Rietra heb ik heel veel adsorptie-experimenten uitgevoerd op het isotopenlab van de vakgroep Virologie. Tijdens dit werk, en zeker ook daarna, voerden we vele discussies over het gebruik van de verschillende adsorptiemodellen en het schrijven van artikelen. Van Jeroen Filius heb ik de modelbeschrijving voor de adsorptie van citraat aan goethite overgenomen. Verder bogen we ons over de statistiek van de lege plaatsen aan het oppervlak voor de binding van grotere complexen, een discussie geïnitieerd door Hans Meeussen van het Macaulay Land Use Research Institute in Aberdeen, Schotland.
Op het lab kreeg ik, vooral als het ging om experimenten met planten, goede adviezen en ondersteuning van Jaap Nelemans en Willeke van Tintelen, waarvoor ik hen wil bedanken. Erik Hey, Winnie van Vark, Lianne Rou en Monique Driessen dank
176
ik voor het analyseren van de vele monsters. Vaak volgens een methode die net even anders was dan de standaardmethode, om te voorkomen dat het fosfaatgehalte te laag en dus niet nauwkeurig te meten zou zijn.
Twee studenten, Anjelin Shresta en Hans Bakker, voerden binnen het project hun afstudeervak uit. Voor beiden was het een groot vak, waarvoor ze een potproef en experimenten naar de binding van fosfaat aan grond of goethite uitvoerden. Hen begeleiden was voor mijzelf een heel leerzame ervaring.
Verder wil ik alle medewerkers van de vakgroep bedanken voor de collegialiteit en de goede sfeer. Van hen wil ik Winfried, Michiel, Peter, Dirkje en Jacqueline noemen die het een tijd met mij op één kamer hebben uitgehouden. Na de renovatie van het gebouw bleek de kelder een aangename werkruimte, niet in het minst door de goede verstandhouding tussen de collega's daar. In het bijzonder denk ik met veel plezier (terug) aan de Zuiderzee-fietstocht en (hopend op veel zon en voldoende wind) aan het zeilweekend.
Tenslotte wil ik Piet de Groot bedanken voor het lezen van concepten, voor al zijn commentaar en voor de tijd die hij heeft besteed aan het in elkaar zetten van de omslag van het proefschrift.
Dank jullie wel!
Jeanine.
177