Phone-based Heart and Lung Functions Monitor · Phone-based Heart and Lung Functions Monitor João...
100
FACULDADE DE E NGENHARIA DA UNIVERSIDADE DO P ORTO Phone-based Heart and Lung Functions Monitor João Filipe Trindade da Silva Master in Informatics and Computing Engineering Supervisor: António Miguel Pontes Pimenta Monteiro (Ph.D.) July 2011
Transcript of Phone-based Heart and Lung Functions Monitor · Phone-based Heart and Lung Functions Monitor João...

FACULDADE DE ENGENHARIA DA UNIVERSIDADE DO PORTO
Phone-based Heart and Lung FunctionsMonitor
João Filipe Trindade da Silva
Master in Informatics and Computing Engineering
Supervisor: António Miguel Pontes Pimenta Monteiro (Ph.D.)
July 2011

Phone-based Heart and Lung Functions Monitor
João Filipe Trindade da Silva
Master in Informatics and Computing Engineering
Approved in oral examination by the committee:
Chair: Pedro Alexandre Guimarães Lobo Ferreira do Souto (PhD)
External Examiner: Álvaro Manuel Reis da Rocha (PhD)
Supervisor: António Miguel Pontes Pimenta Monteiro (PhD)
July 2011

Abstract
The growing aging people coupled with the rise in the incidence of people living inchronic health conditions is creating an unsustainable burden on health and social careservices. On the other hand, mobile technologies have been impressively growing in mostcountries for the last years, as greater efforts are devoted into research work in this area.And mobile phones are not an important tool only in urban regions, more and more peoplefrom rural areas are making use of them.
On the other hand, wireless systems provide "anytime and anywhere" services, al-lowing data entered somewhere else to be accessed by the healthcare professionals at thepoint of care. It also provides a way to remotely monitor a patient. This is extremely im-portant as it allows patient mobility and efficient response in emergency situations. Newapplications and industries will continue to address healthcare issues in the coming yearsand wireless monitors will be commonly used in hospitals and for home monitoring.
This project aims to make some improvement in this still gapped-area, by studying theavailable technologies and combine them to develop a solution that will provide peoplea way to monitor their heart and lung functions everyday, taking greater care on theirhealth status. The solution will allow people to perform daily tests and build a history ofresults which will be shared with health care professionals. By doing this, we will give animportant contribution in the prevention of serious diseases, through early diagnosis.
In this dissertation, a review of the state of the art of m-Health systems is presented,including the theoretical background, the available technologies and existing related workin this area. The problems that this research tried to solve in the context of a projectundertaken in Fraunhofer Portugal research center are also presented as well as a solutionapproach and some results.
i

ii
Resumo
O crescente envelhecimento da população e o aumento na incidência de pessoas aviver em condições crónicas de saúde tem vindo a criar um custo insustentável para asaúde e assistência social. Por outro lado, as tecnologias móveis vêm evoluindo de formaimpressionante na maioria dos países nos últimos anos, resultante do crescente esforçodedicado em trabalho de investigação nesta área. Os aparelhos móveis deixaram de serum instrumento importante somente em regiões urbanas, cada vez mais pessoas das zonasrurais estão a fazer uso deles.
Por outro lado, os sistemas sem fios são projectados para fornecer serviços "a qual-quer hora e em qualquer lugar", possibilitando a introdução de dados seja onde for e oseu acesso por parte dos profissionais de saúde no local de atendimento. Estes serviçospermitem assim a monitorização de um paciente à distância, o que é de verdadeiramenteassinalável visto não apenas oferecerem mobilidade ao paciente como também permitemuma resposta eficiente em situações de emergência. Novas aplicações e indústrias con-tinuarão a abordar e a tentar solucionar questões relacionadas com a saúde nos próximosanos e os aparelhos de monitorização à distância vão ser usados com frequência em hos-pitais e para acompanhamento do paciente em sua casa.
Este projecto pretende dar um contributo nesse sentido, estudando as tecnologiasdisponíveis e combinando-as por forma a desenvolver uma solução que irá proporcionaràs pessoas uma maneira de monitorar diariamente as funções do coração e dos pulmões,assumindo assim uma maior responsabilidade e um maior cuidado no seu estado de saúde.A solução permitirá às pessoas realizarem testes diários e construir um histórico de resul-tados que serão partilhados com profissionais de saúde. Ao fazer isso, estaremos a dar umpasso importante na prevenção de doenças graves, através do diagnóstico precoce.
Nesta dissertação, é apresentada uma revisão do estado da arte dos sistemas móveisde saúde, incluindo a fundamentação teórica, as tecnologias disponíveis e trabalhos ex-istentes relacionados. São ainda enunciados os problemas que este trabalho de pesquisatentou solucionar no contexto de um projecto desenvolvido no centro da investigaçãoFraunhofer Portugal, bem como a abordagem feita e alguns resultados obtidos.
iii

iv

Acknowledgements
My special thanks to my supervisor Miguel Pimenta Monteiro for his guidance andadvices that were very important for my work. I want also to thank Fraunhofer Portugaland particularly my co-supervisor Dirk Elias for giving me, on one hand, the opportunityto work on this project and, on the other hand, the means to accomplish it. I would like togive a special thank to Luis Carvalho. His help and criticism were fundamental. Also, Iwould like to acknowledge Professor Dr. José Cardoso and Dra. Carla Sousa for their timeand help. Finally, I would like to thank my family and friends for their comprehensionand support during all this journey.
João Filipe Trindade da Silva
v

vi
Contents
1 Introduction 11.1 Context . . . . . . . . . . . . . . . . . . . . . . . . . . . . . . . . . . . 11.2 Goals and Motivation . . . . . . . . . . . . . . . . . . . . . . . . . . . . 21.3 Dissertation Overview . . . . . . . . . . . . . . . . . . . . . . . . . . . 2
2 State of the Art 32.1 Mobile Devices and m-Health . . . . . . . . . . . . . . . . . . . . . . . 3
2.1.1 Mobile Devices for Healthcare Professionals . . . . . . . . . . . 32.1.2 Emergent Technology in m-Health . . . . . . . . . . . . . . . . . 42.1.3 Classification of m-Health Systems . . . . . . . . . . . . . . . . 42.1.4 m-Health Potential . . . . . . . . . . . . . . . . . . . . . . . . . 5
2.2 Cardiopulmonary System . . . . . . . . . . . . . . . . . . . . . . . . . . 52.2.1 Respiratory System . . . . . . . . . . . . . . . . . . . . . . . . . 62.2.2 Chronic Obstructive Pulmonary Disease (COPD) and Heart Failure 92.2.3 Cardiovascular System . . . . . . . . . . . . . . . . . . . . . . . 112.2.4 Atrial Fibrillation . . . . . . . . . . . . . . . . . . . . . . . . . . 14
2.3 Sound Signals Capture and Processing . . . . . . . . . . . . . . . . . . . 162.3.1 Signals . . . . . . . . . . . . . . . . . . . . . . . . . . . . . . . 162.3.2 Digital Signal Processing . . . . . . . . . . . . . . . . . . . . . . 172.3.3 Application Areas . . . . . . . . . . . . . . . . . . . . . . . . . 172.3.4 Sampling . . . . . . . . . . . . . . . . . . . . . . . . . . . . . . 182.3.5 The Fourier Transform . . . . . . . . . . . . . . . . . . . . . . . 192.3.6 Discrete Fourier Transform . . . . . . . . . . . . . . . . . . . . . 192.3.7 Fast Fourier Transform . . . . . . . . . . . . . . . . . . . . . . . 21
2.4 Technologies . . . . . . . . . . . . . . . . . . . . . . . . . . . . . . . . 222.4.1 Android . . . . . . . . . . . . . . . . . . . . . . . . . . . . . . . 222.4.2 Communicating with Web Services . . . . . . . . . . . . . . . . 252.4.3 Google Health . . . . . . . . . . . . . . . . . . . . . . . . . . . 29
2.5 Related Work . . . . . . . . . . . . . . . . . . . . . . . . . . . . . . . . 292.5.1 iStethoscope . . . . . . . . . . . . . . . . . . . . . . . . . . . . 292.5.2 Instant Heart Rate . . . . . . . . . . . . . . . . . . . . . . . . . 30
3 Requirements and Architecture 313.1 Architecture . . . . . . . . . . . . . . . . . . . . . . . . . . . . . . . . . 313.2 Requirements . . . . . . . . . . . . . . . . . . . . . . . . . . . . . . . . 32
3.2.1 Functional Requirements . . . . . . . . . . . . . . . . . . . . . . 323.2.2 Non-Functional Requirements . . . . . . . . . . . . . . . . . . . 33
vii

CONTENTS
3.2.3 Why Android . . . . . . . . . . . . . . . . . . . . . . . . . . . . 333.2.4 The stethoscope . . . . . . . . . . . . . . . . . . . . . . . . . . . 34
3.3 Functionalities . . . . . . . . . . . . . . . . . . . . . . . . . . . . . . . . 35
4 System Implementation 374.1 Audio Recording . . . . . . . . . . . . . . . . . . . . . . . . . . . . . . 37
4.1.1 Audio Properties . . . . . . . . . . . . . . . . . . . . . . . . . . 394.1.2 Prepared for Multi-core Smartphones Generation . . . . . . . . . 40
4.2 Digital Signal Processing Algorithms . . . . . . . . . . . . . . . . . . . 414.2.1 Heart Sounds . . . . . . . . . . . . . . . . . . . . . . . . . . . . 414.2.2 Lungs Sounds . . . . . . . . . . . . . . . . . . . . . . . . . . . . 48
4.3 Mobile application . . . . . . . . . . . . . . . . . . . . . . . . . . . . . 524.3.1 The Graphical User Interface . . . . . . . . . . . . . . . . . . . . 524.3.2 Local Storage . . . . . . . . . . . . . . . . . . . . . . . . . . . . 60
4.4 REST Web Services Implementation . . . . . . . . . . . . . . . . . . . . 604.4.1 Data Compression - ZIP archive . . . . . . . . . . . . . . . . . . 604.4.2 Web Service Specification . . . . . . . . . . . . . . . . . . . . . 624.4.3 JSON . . . . . . . . . . . . . . . . . . . . . . . . . . . . . . . . 64
4.5 Integration with Google Health . . . . . . . . . . . . . . . . . . . . . . . 65
5 Tests and Results 695.1 Algorithms Testing . . . . . . . . . . . . . . . . . . . . . . . . . . . . . 695.2 Google Health Integration Testing . . . . . . . . . . . . . . . . . . . . . 705.3 Graphical User Interface . . . . . . . . . . . . . . . . . . . . . . . . . . 715.4 Integration and System Testing . . . . . . . . . . . . . . . . . . . . . . . 715.5 DSP benchmarking . . . . . . . . . . . . . . . . . . . . . . . . . . . . . 72
6 Conclusions 736.1 State of the project . . . . . . . . . . . . . . . . . . . . . . . . . . . . . 746.2 Future work . . . . . . . . . . . . . . . . . . . . . . . . . . . . . . . . . 75
References 77
viii

List of Figures
2.1 Patient’s medical history. . . . . . . . . . . . . . . . . . . . . . . . . . . 72.2 Admissions of patients with COPD in portuguese hospitals [dA08]. . . . 102.3 The heart anatomy. . . . . . . . . . . . . . . . . . . . . . . . . . . . . . 112.4 Points of auscultation of the heart. . . . . . . . . . . . . . . . . . . . . . 122.5 Maximal intensity and radiation of isolated systolic murmurs . . . . . . . 132.6 Comparison between a normal sinus rhythm and atrial fibrillation . . . . . 142.7 Analogy and Digital Signals. . . . . . . . . . . . . . . . . . . . . . . . . 162.8 Signal sampling. . . . . . . . . . . . . . . . . . . . . . . . . . . . . . . 182.9 The Discrete Fourier Transform. . . . . . . . . . . . . . . . . . . . . . . 202.10 From time-domain to frequency representation with FFT. . . . . . . . . . 212.11 The FFT decomposition . . . . . . . . . . . . . . . . . . . . . . . . . . . 222.12 Flow diagram of the FFT . . . . . . . . . . . . . . . . . . . . . . . . . . 222.13 Android OS architecture . . . . . . . . . . . . . . . . . . . . . . . . . . 232.14 SOAP model . . . . . . . . . . . . . . . . . . . . . . . . . . . . . . . . 262.15 SOAP message . . . . . . . . . . . . . . . . . . . . . . . . . . . . . . . 262.16 Rest web services concept . . . . . . . . . . . . . . . . . . . . . . . . . 282.17 Heart wave form on iStethoscope . . . . . . . . . . . . . . . . . . . . . . 292.18 Heartbeat monitoring with Instant Heart Rate . . . . . . . . . . . . . . . 30
3.1 High-level architecture of the solution. . . . . . . . . . . . . . . . . . . . 313.2 The electronic low-cost stethoscope used. . . . . . . . . . . . . . . . . . 343.3 System’s Use Cases Diagram. . . . . . . . . . . . . . . . . . . . . . . . 35
4.1 AudioRecord and MediaRecord communication. . . . . . . . . . . . . . 384.2 Heartbeat sound in time and frequency representation. . . . . . . . . . . . 444.3 Collecting the peaks of the signal after filtering. . . . . . . . . . . . . . . 454.4 Atrial fibrillation appearance in the time-domain. . . . . . . . . . . . . . 474.5 Crackles sample . . . . . . . . . . . . . . . . . . . . . . . . . . . . . . . 484.6 Crackles’ frequency components and timing . . . . . . . . . . . . . . . . 504.7 Crackles recording before and after filtering. . . . . . . . . . . . . . . . . 514.8 Look of the Start menu. . . . . . . . . . . . . . . . . . . . . . . . . . . . 534.9 Toast notification display. . . . . . . . . . . . . . . . . . . . . . . . . . . 534.10 Choosing a Google account. . . . . . . . . . . . . . . . . . . . . . . . . 544.11 Result after choosing the account. . . . . . . . . . . . . . . . . . . . . . 544.12 Help on a button. . . . . . . . . . . . . . . . . . . . . . . . . . . . . . . 554.13 Some guidelines before the exam. . . . . . . . . . . . . . . . . . . . . . 554.14 Exam screen before record. . . . . . . . . . . . . . . . . . . . . . . . . . 56
ix
LIST OF FIGURES
4.15 Exam screen while recording. . . . . . . . . . . . . . . . . . . . . . . . . 564.16 A short tutorial demo explaining how to auscultate. . . . . . . . . . . . . 564.17 History folders listing in landscape mode - grid view. . . . . . . . . . . . 574.18 History folders listing in portrait mode. . . . . . . . . . . . . . . . . . . 574.19 List of exams from April 2011. . . . . . . . . . . . . . . . . . . . . . . . 584.20 Results of an exam. . . . . . . . . . . . . . . . . . . . . . . . . . . . . . 584.21 Weight evolution on the last 8 days. . . . . . . . . . . . . . . . . . . . . 594.22 Changing the period of time. . . . . . . . . . . . . . . . . . . . . . . . . 594.23 Credits of the application. . . . . . . . . . . . . . . . . . . . . . . . . . . 594.24 Commenting the application. . . . . . . . . . . . . . . . . . . . . . . . . 594.25 Local database tables. . . . . . . . . . . . . . . . . . . . . . . . . . . . . 604.26 UML Sequence Diagram of the system. . . . . . . . . . . . . . . . . . . 614.27 JSON syntax . . . . . . . . . . . . . . . . . . . . . . . . . . . . . . . . 654.28 Choosing an account to store data in Google Health. . . . . . . . . . . . . 654.29 Tree diagram with the CCR elements supported by Google Health. . . . . 664.30 Google Health: Table with heart rates sent from the mobile. . . . . . . . . 674.31 Weight progress tracking in Google Health. . . . . . . . . . . . . . . . . 67
x

List of Tables
2.1 Typical Chest Examination Findings in Selected Clinical Conditions . . . 92.2 Major causes of death in the world. . . . . . . . . . . . . . . . . . . . . . 10
4.1 Heartrate variation in atrial fibrilation. . . . . . . . . . . . . . . . . . . . 474.2 Distinguishing between fine and coarse crackles. . . . . . . . . . . . . . 49
5.1 Average execution time (in milliseconds) for 1D complex forward FFT(powers of two). . . . . . . . . . . . . . . . . . . . . . . . . . . . . . . . 72
xi

LIST OF TABLES
xii

xiii

ACRONYMS
Acronyms
3G 3rd Generation Mobile Telecommunications3GP 3GPP (Third Generation Partnership Project) File Format4G 4th Generation Mobile TelecommunicationsAAC Advanced Audio CodingACM Apache Commons MathAF Atrial FibrillationAMR Adaptive Multi-RateAPI Application Programming InterfaceCCR Continuity of Care RecordCOPD Chronic Obstructive Pulmonary DiseaseCRM Customer relationship managementECG ElectrocardiogramEDGE Enhanced Data rates for GSM EvolutionEEG ElectroencephalographyDFT Discrete Fourier TransformDSP Digital Signal ProcessingFhP Fraunhofer Portugal AICOSFFT Fast Fourier TransformGH Google HealthGPRS General Packet Radio ServiceGPS Global Positioning SystemGSM Global System for Mobile CommunicationsGUI Graphical User InterfaceIDE Integrated Development EnvironmentHF Heart FailureHTML HyperText Markup LanguageHTTP Hypertext Transfer ProtocolIPC Inter-Process CommunicationJAX-RS Java API for RESTful Web ServicesJNI Java Native InterfaceJPEG (JPG) Joint Photographic Experts GroupJSON JavaScript Object NotationMIME Multipurpose Internet Mail ExtensionsMPEG Moving Picture Experts GroupMP3 MPEG-1 or MPEG-2 Audio Layer IIIm-Health Mobile HealthNDK Native Development KitOpenGL Open Graphics Library
xiv
ACRONYMS
PCM Pulse-Code ModulationPNG Portable Network GraphicsRPC Remote Procedure CallR&D Research and DevelopmentS1 1st heart toneS2 2nd heart toneSD Secure Digital CardSOAP Simple Object Access ProtocolUDDI Universal Description Discovery and IntegrationURI Uniform Resource IdentifierURL Uniform Resource LocatorXML Extensible Markup LanguageW3C World Wide Web ConsortiumWAR Web application ARchiveWAVE WAVEform audio formatWSDL Web Service Description Language
xv

ACRONYMS
xvi

Chapter 1
Introduction
Mobile Phones have become an integral part of most people’s life. The majority ofpeople today owns a mobile phone. There are many reasons behind this increasing popu-larity of mobile phones, although the main one remains to be to keep in touch with family,friends and work contacts. However, the continuous growth of the Web and the servicesit provides, as well as the reliability it offers, have been diversifying the reasons and goalsthat drive people to purchase mobile devices.
Nowadays, these devices are no longer used only with the purpose of communicationbut are also loaded with a great diversity of entertainment features. The latest mobilephones are wrapped with an ample variety of features such as high resolution camerawith video recorder, Internet, MP3 player, radio, GPS and gaming. Apart from this, thesedevices also come up with ultimate connectivity options like Bluetooth, EDGE, GPRS,etc.
Though the generalized crisis, the market for mobile device applications didn’t stopgrowing. According to International Data Corporation, a market research firm specializ-ing in information technology, and if the expectations were met, the worldwide marketreached $3.5 billion by the end of 2010 [oCoEoC].
The creation of applications related to health and health care is also moving quickly.This sector deserves more and more attention and efforts from the developers of applica-tions for mobile devices. It is believed that these devices can play an important role in thefuture people’s healthcare, taking advantage of its features and capabilities to make dailytests and, that way, monitor people’s medical status with the convenient regularity.
1.1 Context
This dissertation project was developed at the Fraunhofer Portugal Research Centerfor Assistive Information and Communication Solutions (FhP AICOS), the first researchcenter operated by Associação Fraunhofer Portugal Research.
1
Introduction
The research center aims to popularize the access to Information and CommunicationTechnologies (ICT) through the development of market-oriented R&D assistive solutions.Focused on emergent technologies, Fraunhofer Portugal explores mutual interests in sci-ence and technology, targeting the enhancement of people’s living standards by offeringthem intuitive and useful technology solutions.
FhP has particular concern with people that have been deprived of using technologydue to the frequent non-user-friendly solutions, that somehow exclude groups less able, asare the elderly. Continuous collaboration between Fraunhofer Institutes, R&D institutionsin Portugal and customers will contribute to provide people with a good and sustainablequality of life.
1.2 Goals and Motivation
The main target of this work is to connect a low cost stethoscope microphone to thehands-free audio connector of the device and to develop software that will allow specifi-cally elderly people to perform every-day tests of their heart and lung functions.
Very special attention shall be given to the fact that the users will be aging, so not onlya user friendly interface is important, but also an interactive guidance that will tell users,step by step, how to use the application and perform the tests. In addition, the mobilephone shall build a history of results and match the results with a "health pattern" thatcharacterizes a "healthy and safe" status. Functions to exchange the test results with thehealth care professionals shall be implemented as well.
The target device to be used will be an Android based smart phone, well suited to thetask due to the set of sensors and the possibility to install additional software to be usedas mobile e-Health device. A highly automated, daily monitoring of the heart and lungfunctions can help to prevent serious illnesses by early diagnosis. No only there will bean increased quality of life, but also a reduction of related health care costs.
1.3 Dissertation Overview
Besides introduction, this dissertation contains 5 more chapters.Chapter 2 describes the state of the art, regarding the theoretical background, as well
as the technologies and related work. Chapter 3 specifies the system’s requirements, alongwith the designed architecture and the functionalities it provides. Then, in Chapter 4 is de-tailed the system’s implementation, explaining how things were done and why, whenevernecessary. In Chapter 5 are presented some tests carried out and the respective resultsobtained. Finally, Chapter 6 presents some conclusions about the research carried outsuggests some future work.
2

Chapter 2
State of the Art
2.1 Mobile Devices and m-Health
The progresses in the technologies provided by mobile devices, its portability and easeof use along with the falling of prices, make these devices an appropriate tool for health-care purposes. More and more, m-technology is being used in the healthcare field [PL07].The use of this technology tends to become a cost-effective method of identifying andmonitoring health issues.
Rob Chesters, manager of MedilinkWM, said, at a conference focused on existingand emerging technologies for home-based healthcare, that mobile technologies deliverconvenient personalized healthcare solutions using mainstream technologies and help in-dividuals to self-manage their conditions and take greater ownership of their health. Headded that the future for the health and social care services lies in the collaboration ofhealthcare providers, users and industry, in order to provide a range of solutions in whichvital signs monitoring are included [New10].
Besides offering patients the opportunity to monitor themselves regularly, m-Healthalso provides healthcare professionals with access to the patient data, extremely valuableand useful in the diagnosis and formulation of the treatment. This technology can beof vital importance for people living in remote areas or for those who are physicallyimpaired [uni07].
2.1.1 Mobile Devices for Healthcare Professionals
“One physician, while vacationing with his family in Arapahoe, N.M., useda smartphone to access patient updates from the ski slopes some 12,000 feetabove sea level. The doctor knew he had left his patients back at the hospitalin good hands. He just felt the need, as doctors often do, to check and see howthey were doing.” [Cro10]
3
State of the Art
Although this may be one of the most extreme examples of physician commitment, thestory indeed illustrates the today’s reality. A significant majority of doctors and healthcareprofessionals rely on the emergent technology to improve the healthcare they deliver andto solidify relationships with their patients.
In contrast to the common perception of healthcare professionals, most doctors will-ingly adopt technologies that meet a business need or improve the quality and safety ofpatient care. Since the first handheld devices were launched, the impact and adherencewas tremendous among doctors, who found the devices convenient for taking notes, ac-cessing information and managing their schedules while making patient rounds.
Though some people may not think about doctors this way, the truth is that they areinformation workers and, therefore, they require access to current information about dis-eases, medications and patient histories to determine the most appropriate treatment. Onlythus it is possible to provide patients with the excellent healthcare they deserve. The onlyone difference between them and most information workers is that they cannot alwaysbe at their desks to reference the material they need. Instead, they require informationat the patient’s bedside, in the exam room or when responding to emergencies out in thefield [Cro10].
2.1.2 Emergent Technology in m-Health
Home observation through a network equipped mobile is sometimes the only practicalapproach when a large number of potential patients exist. Continuous monitoring of theheart (m-ECG) and brain (m-EEG) is possible from the technical point of view, thoughdifficult due to the presence of perturbing signals and noise, frequently called artifacts.Breathing abnormalities associated with bronchial asthma and other chronic respiratorysystem diseases as well as sleep disorders are also areas being focused in the emergentm-Health techniques [SM].
2.1.3 Classification of m-Health Systems
Based on the definitions given above, m-Health systems can be classified according tothe characteristics of the source and destination of the medical information flow [SM]:
1. Patient to medical supervisor;
2. Patient to physician;
3. Physician to physician;
4. Physician to expert system;
4

State of the Art
5. Patient to medical CRM system (management of patients and medical interven-tions).
Depending on the target group, m-Health systems can be classified as follows:
• m-Health for hospital patients;
• m-Health for healthy people (preventive m-Health);
• m-Health for the chronically ill or vulnerable individuals.
2.1.4 m-Health Potential
The current changing in healthcare environment is increasing the need to transform thesector in order to meet new challenges and to benefit from new opportunities [RHI06]. Itis expected that in the next few years both wireless technologies and m-Health systemswith will be developing at great rhythm.
The rising demands from different medical applications and roaming applications, inwhat concerns to data traffic, might lead to some incompatible issues with 3G’s data rates,under specific conditions. Therefore, the implementation of 4G systems will be of greatimportance in medical care. Along with the proliferation of 4G systems, home medicalcare and remote diagnosis will become common. From prescription of medicines at hometo remote surgery, there is a long way to be built and followed targeting the realization of avirtual hospital, with no resident doctors. Preventive medical care will also be focused andpersonal accessories that are used every day by the individual will be able to constantlytransmit data to the hospital and, after medical diagnosis, receive such results [Ist04].
The dominant trends in healthcare are shifting towards shared and integrated care. Theindividual’s healthcare will no longer be the sole responsibility of a team of professionalsacross all levels of the healthcare system hierarchy but also of the individual who mustcooperate in favor of a benefit that is, primarily, of his interest.
2.2 Cardiopulmonary System
The cardiovascular and respiratory systems work closely together to ensure that enoughoxygen is received by organ tissues in order to be able to perform cellular functions. Theoxygen contained in the air breathed in and held in the lungs is transferred to the blood,which is responsible for transporting the oxygen to all cells of the body. The oxygenatedblood is pumped by the heart, from the lungs to the body. Additionally, the respiratoryand circulatory systems work together to remove carbon dioxide, which is a metabolicwaste product.
5
State of the Art
2.2.1 Respiratory System
2.2.1.1 The Lungs
The lungs are spongy organs, approximately with 25cm in length, where carbon diox-ide and oxygen are exchanged. The process is called gas exchange. When a personinhales, the alveoli in the lungs fill with oxygen. The oxygen is then sent to blood cells inthe capillaries that surround the alveoli. In reverse way, the carbon dioxide in the blood issent to the alveoli, where it is expelled from the body through the process of expiration.
2.2.1.2 Approach to the Patient with Disease of the Respiratory System
A disease of the respiratory system may be identified based on symptoms, on an ab-normality detected on a chest radiograph, or both. There is a set of different diagnosticpossibilities, which will be shortened, until there is only one. To do so, additional infor-mation is required including patient’s medical history, physical examination, testing ofthe pulmonary functions, additional images, etc.
This Section considers only the approach to the patient based on the major patternsof presentation, clinical history and physical examination, Although its importance onthe diagnosis, the radiography to the chest will not be contemplated here, since it is non-relevant for the project, at least for now.
CLINICAL HISTORY
Four main symptoms can be experienced by a patient with respiratory system disease:dyspnea, cough, hemoptysis and chest pain, with higher incidence rate on the first two.
• Dyspnea, generally known as shortness of breath, it frequently occurs in situationsof high demanding physical effort. However, it may present a pathological conditionin case it occurs in unpredicted situations. It is mostly caused by asthma, pneumo-nia, congestive heart failure, chronic obstructive pulmonary disease or psychogenicreasons;
• Cough is not per se a lung disease indicator, since it may be caused by a no numberof factors. Nevertheless, if accompanied by sputum it may suggest airway disease(asthma, chronic bronchitis).
• Hemoptysis can originate from disease of the airways, the pulmonary parenchyma,or the vasculature. Diseases of the airways can be of two different types: inflamma-tory or neoplastic [ASF08a].
6
State of the Art
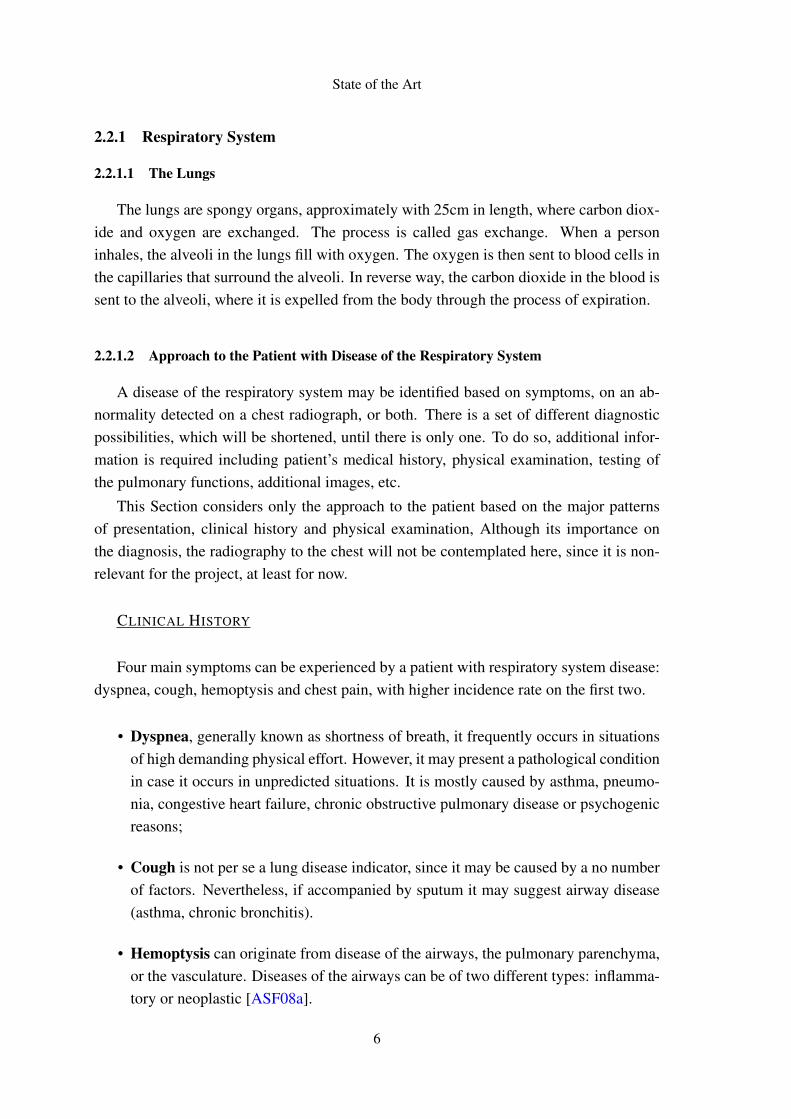
• Chest pain - usually presents diseases of the respiratory system. If the pain orig-inates from some problem in the parietal pleura, it is likely to be accentuated byrespiratory motion. [ASF08b].
Figure 2.1: Patient’s medical history.
ADDITIONAL HISTORIC INFORMATION
There are some risk factors for lung disease about which it is important to collect facts,ensuring complete historic data of the patient. One crucial information concerns currentand past smoking, particularly cigarettes for being more harmful. In case the patientpresents smoking history, things like the number of years of smoking and the intensity(numbers of packs per day) should be referred. If, on the other hand, the patient hasquitted smoking, it is relevant to know the exact interval of time since cessation. Thereason for this is that the risk of lung cancer falls progressively in the decade after theinterruption of smoking, and loss of lung function above the expected age-related declineceases as soon as the patient stops smoking.
Although the two most serious respiratory diseases are neoplasia and chronic obstruc-tive lung disease, there are some other complications associated with smoking whichmust not be forgotten, for instance, pneumothorax and respiratory bronchiolitis. Alsosignificant passive inhalation of smoke, i.e. by exposure, whether at home or at work-place, shall be reported since it is a factor that can lead to the aggravation of airwaysdisease [ASF08c].
There is yet the chance that the patient has been exposed to other kind of inhalableagents related with lung disease. This agents can act either via direct (immediate toxicinjury) or indirect (through immune mechanisms) and include organic antigens (e.g. fromanimal proteins) and inorganic dusts (e.g. from silica). The exposure to environmentalallergens normally exacerbates diseases such as Asthma, which is more commonly found
7

State of the Art
in woman. Sometimes, this pathology may even originate from occupational exposures,for instance people who work daily with cork during some years [ASF08c].
2.2.1.3 Physical Examination
The general principles of inspection, palpation, percussion, and auscultation apply tothe examination of the respiratory system. It is important that the physical examinationfocus not only on detecting abnormalities on thorax and lungs but also on recognizinganother findings that give important information towards the lung disease diagnosis.
On inspection, it is examined the pattern and rate of breathing, on one hand, and ob-served the symmetry of lung expansion, on the other hand. Regarding the first point, anuncommon fast breathing normally indicates either a breathing work increase or a boostin respiratory demands. In relation to the expansion of the chest, if it shows up to beasymmetric it is because there is an disproportionate process affecting the lungs (an ob-struction on a large airway, pleural disease, etc). Visible alterations on the size of thethorax increase the breathing work, and result in dyspnea [ASF08c].
On palpation, it is verified the symmetry of lung expansion, generally confirming thefindings observed by inspection. Spoken sounds produce vibration that is transmitted tothe chest wall, allowing the healthcare practitioner assess the presence or absence of thetactile fremitus, as well as its symmetry. If there is liquid in the pleural space, i.e. betweenthe lung and the diaphragm, the transmission of the vibration is diminished. Contrarily, anarea of pulmonary consolidation will amplify the vibration [ASF08c]. The normal soundcoming from an air-containing lung is resonant, in contrast to the consolidated lung thatsounds dull. Air between the chest and the lung results in a hyper-resonant percussionnote.
On auscultation of the lungs, the examiner focus on both the quality and intensityof the breath sounds, while at the same time tries to listen to extra sounds. Placing thestethoscope’s diaphragm at the periphery of the lungs, normal breath sounds (describedas vesicular breath sounds) can be heard, which are clearly divided in two moments:inspiration and expiration, the first of which is longer and louder than the second one.In some situations, there is an endobronchial obstruction or just air or liquid existing inthe pleural space, compromising the sounds transmission. In the opposite case, when aconsolidated lung improves the propagation of the sound, the bronchial transmission canbe verified by listening to whispered sounds.The most common pathologic sounds that can be heard include crackles, wheezes andrhonchi.
8

State of the Art
Crackles are referred to as discontinuous, intermittent and brief sounds. Though theycan be heard either on inspiration or expiration, they are typically an inspiratory soundcaused by fluid in the small airways called alveoli or by interstitial lung disease. Cracklesappear to be caused by both the sudden open of airways and the presence of fluid insidethe airways. There are two types of crackles: fine and coarse.
Wheezes, unlike the crackles, are more frequently heard during expiration and aredescribed as continuous sounds. They are caused by air moving through airways narrowedby constriction or swelling of airway or partial airway obstruction.
Rhonchi is the term applied to the sounds created when there is a mucus in the airway;the viscous interaction between the secretion and the moving air creates a low-pitchedvibratory sound [ASF08c].
Table 2.1 found below, summarizes the patterns of physical findings in common patho-logic conditions regarding the respiratory system.
Table 2.1: Typical Chest Examination Findings in Selected Clinical Conditions
Condition Percussion Fremitus Breath Voice AdventiciousSounds Transmission Sounds
Normal Resonant Normal Vesicular Normal AbsentConsolidation Dull Increased Bronchial Bronchophony, Cracklesof atelectasis whispered
Asthma Resonant Dull Decreased Decreased DecreasedIntersticial Resonant Normal Vesicular Normal Crackles
lung diseasePneumothorax Hyperresonant Decreased Decreased Decreased Absent
Pleural effusion Dull Decreased Decreased Decreased Absent
A meticulous general physical examination is mandatory in patients with disorders ofthe respiratory system.
2.2.2 Chronic Obstructive Pulmonary Disease (COPD) and Heart Failure
Several studies that have been undertaken revealed a high rate of coexistence of COPDand heart failure (HF), which is more accentuated in aging people [GOL06] [PM08][NMJP09]. Between 7,2% and 20,9% of patients with COPD also present heart failureevidences [CS06] [MP03]. On the other hand, studies report that approximately 10,0%to 39,9% of patients with heart failure show up to have COPD [BJ03] [HE02]. All theseinvestigations conclusions were based on clinical-data or on self-reported information.
Tobacco smoke is seen as the main triggering factor for COPD, for both active smokersand passive ones (exposed to it). More than 85% of cases of COPD are caused by tobacco.
9

State of the Art
COPD is a serious disease, conditioning relevant degrees of disability and high mortality.In fact, it is responsible for 3 million deaths every year, as can be shown in Table 2.2,being the 4th main cause of death worldwide (nearly 5,1% of the the total deaths). Thisdisease is slightly more frequent in men than women, with percentages of 53,5% and46,5% respectively.
Table 2.2: Major causes of death in the world.
Rank Disease Deaths per year (millions) % of the total deaths1 Ischaemic heart disease 7,2 12,22 Cerebrovascular disease 5,7 9,73 Lower airway inflammation 4,2 7,14 COPD 3,0 5,15 Diarrhoea 2,2 3,76 AIDS 2,0 3,57 Tuberculosis 1,5 2,58 Lung cancer 1,3 2,3
2.2.2.1 COPD prevalence in Portugal
More than 5000 interviews conducted between smokers over 45 years revealed thatabout 70% had symptoms consistent with being at risk of or already suffering fromCOPD [dA07] [dA08]. The currently accepted value points to the existence of at least540,000 cases in Portugal [dA08] but it appears to be underestimated. The prevalence isparticularly high over 60 years, reaching 1 in 4 men and 1 in 7 women.
Figure 2.2: Admissions of patients with COPD in portuguese hospitals [dA08].
10

State of the Art
COPD is one of the most frequent causes of hospitalization for respiratory disease. Achart with the official values of last years is presented in Figure 2.2.
COPD is considered the cause of death of more than 2400 cases every year, which rep-resents between 27% and 30% of deaths from respiratory disease [dA06] [dA07] [dA08].It is the second leading cause of death in this group (excluding lung cancer).
The estimated direct costs with patients with COPD exceed 240 million euros annu-ally [dA05] [dA07] [dA08].
2.2.3 Cardiovascular System
2.2.3.1 Heart and heart murmurs
The heart is a muscular organ found in every animal with circulatory system, that isresponsible for pumping the blood throughout the blood vessels by rhythmic contractions.
The heart anatomy is shown in Figure 2.3.
Figure 2.3: The heart anatomy.1
The speeding up of blood flow through orifices (normal or abnormal ones) generatesvibrations which are reflected in the form of audible turbulence called heart murmurs.These murmurs are typically defined in terms of their timing within the cardiac cycle.
Thus, there are three distinct kinds of murmurs: systolic, diastolic and continuous.The first one starts with or after the first heart sound, S1, and ends at or before the thesecond heart sound, S2, while the diastolic mutter begins with or after the sound S2, and
1 http://www.medicalook.com/Heart_diseases/
11

State of the Art
finishes before or at the following S1 sound. Oppositely, the continuous murmur startsin early systole (S1) and continues until part or the totality of diastole (S2), so it is notrestricted to either phase.
It is easy then to understand that the very first step in their identification is to determinewith accuracy the timing of the heart mutter. Differentiating the S1 and S2 componentsis quite simple using the auscultation method but it might be quite more complicated in atachyarrhythmia situation. In this case, palpation of the carotid arterial pulse (in the neck)shall be done simultaneously. S1 should be closely followed by the upstroke [ASF08d].
2.2.3.2 Approach to the Patient with a Heart Murmur
A differential diagnosis requires a complete evaluation of the patient, although thereare some major attributes. The relevance that is given to a heart murmur is based not onlyon the associated findings but also on additional information such as the patient historyand clinical context.
If at the end of these steps, still any ambiguity or doubt prevails, a noninvasive testingmay follow, in order to provide some extra information regarding anatomic and physio-logic issues.
Accuracy on the heart murmur identification is very important for posterior referralto a cardiovascular specialist. Meanwhile, it is told to the patient some physical activityrestrictions that he should follow, along with the medicines prescribed [ASF08d].
There are four distinct points where the stethoscope must be placed in order to auscul-tate the heart functioning, which are illustrated in Figure 2.4.
Figure 2.4: Points of auscultation of the heart.2
When auscultating, the examinator listens to the internal sounds of the body and char-acterizes them in terms of:
2 http://medinfo.ufl.edu/year1/bcs/clist/cardio.html
12

State of the Art
• Duration — The duration of a heart murmur is related with the elapsed time inthe cardiac cycle during which a difference of pressure exists between two cardiacchambers: the left ventricle and the aorta, the right ventricle and the pulmonaryartery, or the great vessels. The magnitude of this pressure, along with its varia-tion, is responsible for the flow speed, the turbulence level and the intensity andconfiguration of the mutter.
• Intensity — The intensity of a heart murmur is measured using a scale that rangesfrom 1 to 6. Depending on the grade, it characterizes different kinds of murmurs.
1. very soft, hardly heard;
2. easily heard but not particularly loud;
3. loud, with no palpable thrill;
4. very loud, accompanied by a thrill;
5. loud enough to be heard with only the edge of the stethoscope touching thechest;
6. loud enough to be heard with the stethoscope slightly off the chest.
From grade 3 on (inclusive), the murmur is likely to be caused by important struc-tural heart disease and it indicates high speed on the blood flow on the area ofproduction. Obesity or an obstruction on the lung may decrease the intensity ofthe sound. However, this intensity can be misleadingly low when cardiac output isconsiderably reduced;
• Location and Radiation - For an accurate identification of the murmur, it is impor-tant to recognize its exact location and radiation. Additional clues can be providedby evidence on abnormalities of the components S1 and S2 or by some adventitioussounds (f.e. a systolic click or a diastolic snap).
Figure 2.5: Maximal intensity and radiation of isolated systolic murmurs.3
3 http://www.accessmedicine.ca/
13

State of the Art
Particular attention shall be given to the characteristics of the murmur, in order tosuccessfully complete the physical examination.
2.2.4 Atrial Fibrillation
Atrial fibrillation is the most common heart rhythm abnormality in adults world-wide [SMW+04], affecting over 9 million people in the European Union and theUnited States alone [MBG+06].
AF occurs when a chaotic electrical activity develops in the upper chambers oratria, which completely inhibits the action of the sinus node. Then, the left atriumstarts to contract haphazardly and the blood is pumped in a less efficient way. Theatrioventricular (AV) node is overloaded with impulses, trying to move on to theventricles. Consequently, the ventricles beat faster, but not as fast as the atriums.Fortunately, some of these impulses can be prevented by the AV node due to itslimited conduction speed. If not this protection, there could be severe ventriculartachycardia resulting in a serious reduction of cardiac output.
Figure 2.6 shows the behavioral differences on a heart with AF.
Figure 2.6: Comparison between a normal sinus rhythm and atrial fibrillation.4
4 http://mykentuckyheart.com/information/AtrialFibrillation.htm
14
State of the Art
The result of this behavior is a fast and irregular heart rhythm [BDI09]. The heartrate in AF may range from 100 to 175 beats per minute, whereas a normal restingpulse ranges from 60 to 100 beats.
AF can be classified into 3 categories, depending on its persistence along the time:
– Paroxysmal, if episodes cease within maximum 7 days;
– Persistent, if episodes persist for more than 7 days;
– Permanent, if episodes last for more than 1 year.
AF is a risk factor for stroke, reason why it is essential to promote prevention strate-gies.
CAUSES AND SYMPTOMS
The reasons behind AF are not yet fully understood, though its frequent develop-ment in patients with abnormalities or damage in the heart’s structure. Some causesfor AF are:
– High blood pressure
– Congenital heart defects
– Heart attacks
– Abnormal heart valves
– Sleep apnea
Atrial Fibrillation is also sometimes associated with changes in the functioning ofthyroid gland, high alcohol intake and lung infections.
The most common symptoms include, among others, palpitations, tiredness, short-ness of breath, dizziness and chest paint.
2.2.4.1 AF in Portugal
According to a recent study released by Instituto Português do Ritmo Cardíaco(IPRC) 2,5% of the Portuguese over 40 years suffer from atrial fibrillation, whichreveals that 121,825 Portuguese live in this condition, some of them without know-ing [BMA+10]. Comparing to studies carried out in other countries, this is a rela-tively high incidence rate.
The research included 10,477 individuals from all regions of the country, 55% ofwhich were women. The data collected allowed not only to access the prevalence ofFA in +40 years old people but also to characterize the population in demographic,socioeconomic, clinical and therapeutic terms [BMA+10].
15

State of the Art
“The probability that a person with atrial fibrillation has a stroke is fivetimes higher than the general population in that age group.” [BMA+10].
Daniel Bonhorst, President of IPRC
João Primo, from Associação Portuguesa de Arritmologia, Pacing e Electrofisiolo-gia (APAPE), stated that after 50 years old, the incidence rate doubles for eachdecade of life, and it can exceed the 10% among people over 80 years.
Among the 261 individuals that were identified with AF, 38% were not diagnosed,which reveals that a great percentage of the people living in this condition is notaware of the situation. Moreover, only 74% from the 72% of people aware of theirFA condition were taking medication. In every 12 episodes only 1 is symptomatic,i.e, the symptoms may go unnoticed, specially if people reduce their physical activ-ity [BMA+10].
The study found that about one quarter of strokes happen, directly or indirectly dueto this arrhythmia. Control of atrial fibrillation can reduce the number of strokes - aleading cause of death in Portugal.
2.3 Sound Signals Capture and Processing
2.3.1 Signals
Signal processing deals with signals’ analysis, in either discrete or continuous time.A signal is any variable that contains some kind of information that can be conveyed,modified, manipulated or displayed. They are analogue or digital representations of time-varying or spatial-varying physical quantities.
Figure 2.7: Analogy and Digital Signals.
16
State of the Art
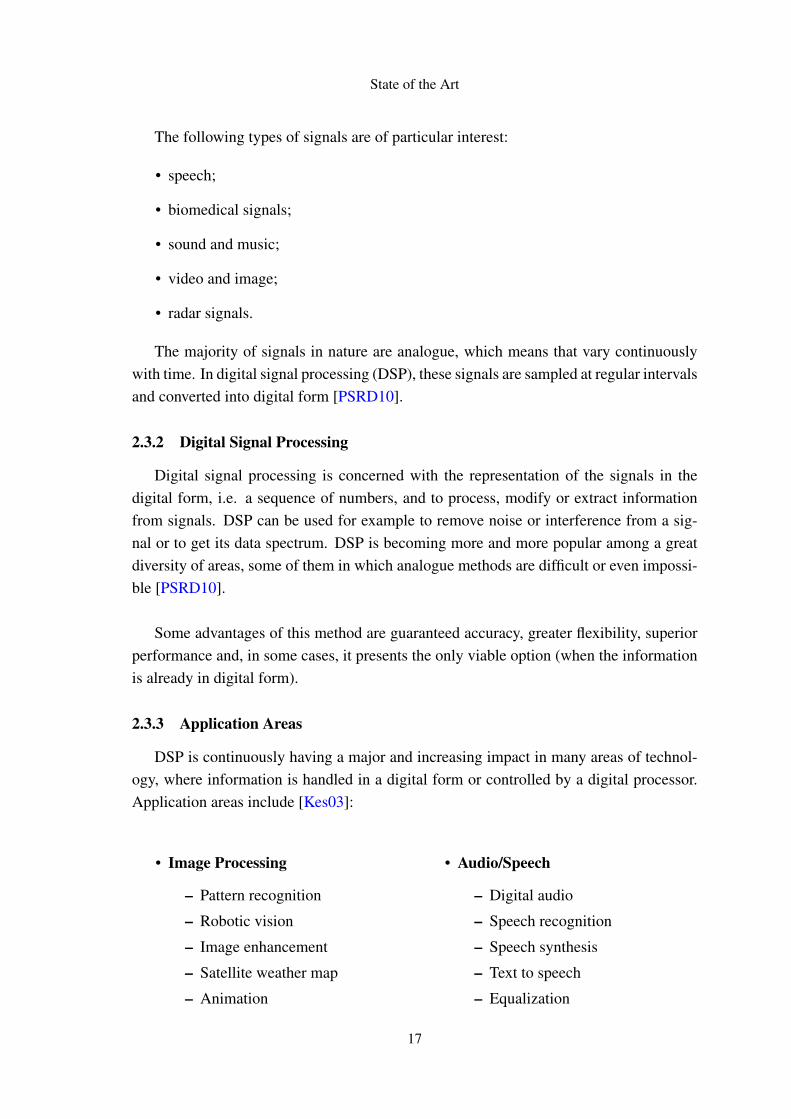
The following types of signals are of particular interest:
• speech;
• biomedical signals;
• sound and music;
• video and image;
• radar signals.
The majority of signals in nature are analogue, which means that vary continuouslywith time. In digital signal processing (DSP), these signals are sampled at regular intervalsand converted into digital form [PSRD10].
2.3.2 Digital Signal Processing
Digital signal processing is concerned with the representation of the signals in thedigital form, i.e. a sequence of numbers, and to process, modify or extract informationfrom signals. DSP can be used for example to remove noise or interference from a sig-nal or to get its data spectrum. DSP is becoming more and more popular among a greatdiversity of areas, some of them in which analogue methods are difficult or even impossi-ble [PSRD10].
Some advantages of this method are guaranteed accuracy, greater flexibility, superiorperformance and, in some cases, it presents the only viable option (when the informationis already in digital form).
2.3.3 Application Areas
DSP is continuously having a major and increasing impact in many areas of technol-ogy, where information is handled in a digital form or controlled by a digital processor.Application areas include [Kes03]:
• Image Processing
– Pattern recognition
– Robotic vision
– Image enhancement
– Satellite weather map
– Animation
• Audio/Speech
– Digital audio
– Speech recognition
– Speech synthesis
– Text to speech
– Equalization
17

State of the Art
• Telecommunications
– Echo cancellation
– Data communication
– Video conference
– Adaptive equalisation
– Satellite weather map
• Biomedical
– Patient monitoring
– Scanners
– EEG brain mappers
– ECG analysis
– X-ray storage/enhancement
• Military
– Radar processing
– Sonar processing
– Missile guidance
– Secure communication
– Navigation
• Consumer applications
– Digital, cellular mobile phones
– Digital televisions
– Digital cameras
– Voice mail system
– Internet phones, music and video
The list, though not complete, reveals the importance of DSP.
2.3.4 Sampling
Signals that appear in nature are continuous in time, and not few times, it is of our in-terest to study them using powerful algorithms. But to be possible for a computer to pro-cess it, we first need to convert it into a discrete time digital signal which is accomplishedwith the sampling method [vdL95]. This operation consists in picking up discrete valuesfrom the original signal at certain points of time, which must be equidistant. The samplerate defines the number of samples to be taken per unit of time (often second) [Smi97a].This method is demonstrated in Figure 2.8.
Figure 2.8: Signal sampling.
18
State of the Art
From the built discrete signal, it is always possible to go back and reconstruct theanalogy signal, as long as the sampling was done properly. Integrally or not, if the criticaldata has been captured, the reversing process is possible. [Smi97a].
2.3.5 The Fourier Transform
The Fourier transform, given the time-domain representation of the signal, obtainsthe corresponding spectrum, decomposing the signal into its frequencies. For a single-variable continuous function, f(t), the Fourier transform, F(f), is defined by:
F(t) =∫
∞
−∞
f (t)e− j2π f t dt
and the its inverse by:
f (t) =∫
∞
−∞
F( f )e− j2π f t d f
with j being the imaginary number
j =√−1
which denotes the exponent
e jθ = cos(θ)+ j sin(θ)
Normally, the signal’s decomposition takes sine and cosine waves, although it can bedone in an infinite number of ways. This operation is intended to get something easierto deal with, and the sine and cosine waves offer something that the others do not. Giv-ing a sinusoid input to a system, produces a sinusoidal wave too, perhaps with differentphase and amplitude, but its shape remains exactly the same, as well as frequency. It isfrequently know as the sinusoidal fidelity. [Smi97a].
2.3.6 Discrete Fourier Transform
The discrete Fourier transform (DFT) is a particular kind of discrete transform, used inFourier analysis. Given a signal in the time-domain representation, the sampling methoddescribed in 2.3.4 is used in order to obtain the input function [Bri88]. This function mustto be discrete and to have a finite duration for non-zero values.
19

State of the Art
For complex series of discrete values, it is used the DFT. Say we have a complex seriess(k), with N number of samples in the form
s0,s1,s2, ...,sk, ...,sN−1
with s representing the complex number
si = sreal + jsimaginario
then the DFT is given by:
s(n) =1N
N−1
∑k=0
s(k)e− jk2πn/Nwith n=0, ..., N-1.
Figure 2.9: The Discrete Fourier Transform.
To calculate the DFT, three different approaches can be taken [Smi97b]:
• view the problem as a set of simultaneous equations, which is quite good methodto understand the DFT, but too inefficient for practical use;
• use correlation, focused on detecting a known waveform in another signal;
• use the Fast Fourier Transform (FFT), an algorithm that is typically hundreds oftimes faster than the other methods.
20
State of the Art
2.3.7 Fast Fourier Transform
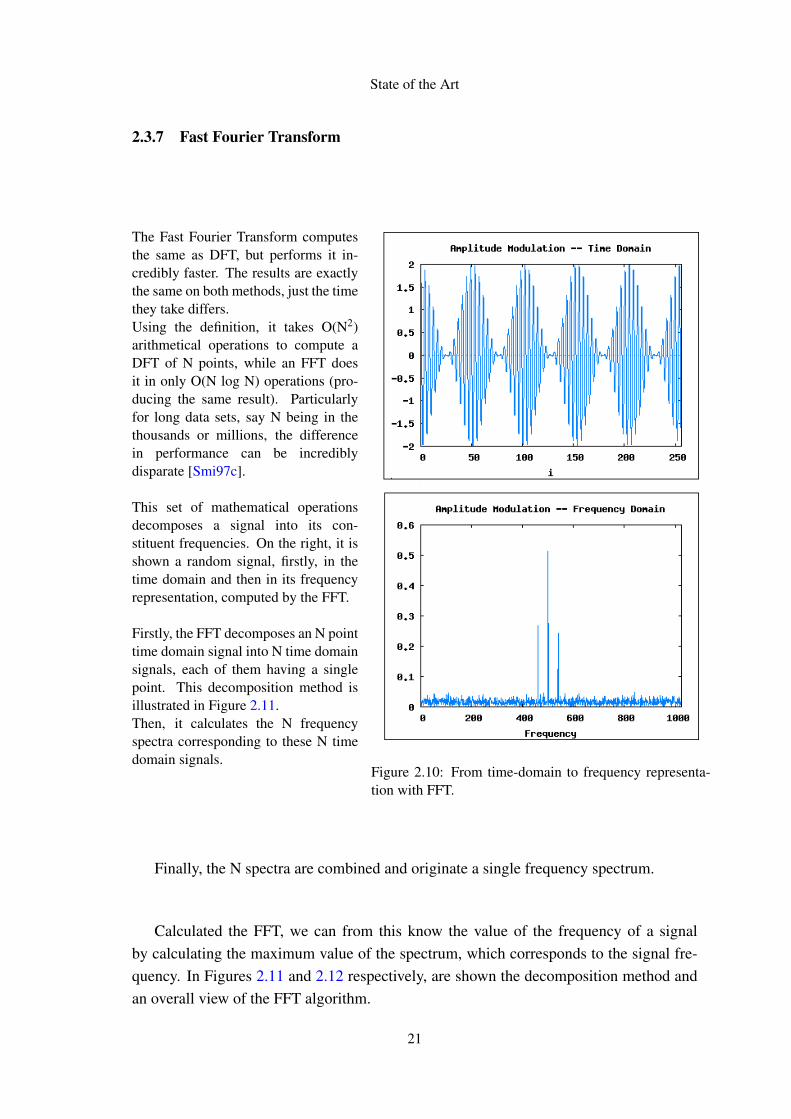
The Fast Fourier Transform computesthe same as DFT, but performs it in-credibly faster. The results are exactlythe same on both methods, just the timethey take differs.Using the definition, it takes O(N2)arithmetical operations to compute aDFT of N points, while an FFT doesit in only O(N log N) operations (pro-ducing the same result). Particularlyfor long data sets, say N being in thethousands or millions, the differencein performance can be incrediblydisparate [Smi97c].
This set of mathematical operationsdecomposes a signal into its con-stituent frequencies. On the right, it isshown a random signal, firstly, in thetime domain and then in its frequencyrepresentation, computed by the FFT.
Firstly, the FFT decomposes an N pointtime domain signal into N time domainsignals, each of them having a singlepoint. This decomposition method isillustrated in Figure 2.11.Then, it calculates the N frequencyspectra corresponding to these N timedomain signals.
Figure 2.10: From time-domain to frequency representa-tion with FFT.
Finally, the N spectra are combined and originate a single frequency spectrum.
Calculated the FFT, we can from this know the value of the frequency of a signalby calculating the maximum value of the spectrum, which corresponds to the signal fre-quency. In Figures 2.11 and 2.12 respectively, are shown the decomposition method andan overall view of the FFT algorithm.
21

State of the Art
Figure 2.11: The FFT decomposition.5 Figure 2.12: Flow diagram of the FFT.5
2.4 Technologies
This Section presents some of the technologies that were considered and used for thedevelopment of the project.
2.4.1 Android
Android is a linux-based mobile phone operating system, initially developed by An-droid Inc., a company later purchased by Google (2005). Nowadays, it is supported byOpen Handset Alliance which has the collaboration of over 70 major hardware, softwareand telecoms companies including Google, HTC, Motorola and T-Mobile.
2.4.1.1 Android Architecture
The Android operating system’s architecture is structured in layers. On the bottom,there is the (optimized) virtual machine, Dalvik VM, which runs a set of Java libraries.On the top of these libraries, a Java-based application framework is responsible for run-ning the Java applications. The Android layered-architecture is shown in Figure 2.13 andmain components are described in further detail below [Bur09].
5 http://dspguide.com/ch12/2.htm
22

State of the Art
Figure 2.13: Android OS architecture.6
APPLICATIONS LAYER
A core set of applications that include an e-mail client, calendar, maps, browser andcontact manager. All done in Java.
APPLICATION FRAMEWORK
The way the framework was designed and developed simplifies the concept of com-ponent reuse. The developers are encouraged to publish and share their contents, theirapplications functionalities so that they can be reused in other systems. The developeris given complete access to the framework APIs that are used in the central application,allowing to take advantage according to the interest [Bur09].
LIBRARIES
A set of C/C++ libraries that allow working with common media files such as MP3,AAC, AMR, MPEG4, JPG and PNG run on the top of kernel and different componentsuse them. The Surface Manager is responsible for the 2D and 3D content display. Animplementation of 3D graphics based on OpenGL is also included.
ANDROID RUNTIME
Every application runs in its own process, which in turn have their own instance ofthe Dalvik virtual machine (several VMs can be run efficiently). The executable files take
6 http://developer.android.com/guide/basics/what-is-android.html
23
State of the Art
the format Dalvik Executable (.dex) and are optimized in order to occupy a small sliceof memory. The files are created by a Java compiler, which converts the result into .dexformat [Bur09].
LINUX KERNEL
The Linux kernel provides a hardware abstraction layer (HAL) between hardware de-vices and the remainder of the stack. A Linux 2.6 version is used to handle core servicesincluding memory management, process management, security, network and power man-agement
2.4.1.2 Android SDK
Android SDK is a software development kit that enables developers to create appli-cations for Android platform. It includes required libraries to build Android programs,development tools, an emulator and some sample projects with source code [Mei08].
The following list highlights some of the most important features that the APIs, inwhich Android development environment lies, provide.
• No licensing, distribution, or development fees or release approval processes;
• Wi-Fi hardware access;
• GSM, EDGE and 3G networks telephony or data transfer;
• Comprehensive APIs for location-based services such as GPS;
• APIs for using sensor hardware (accelerometer, compass);
• Libraries for using Bluetooth ;
• Shared data stores;
• IPC message passing;
• Multimedia hardware control, including playback and recording (both with the mi-crophone and camera);
• Background applications and processes;
• Home-screen Widgets, Live Folders, and Live Wallpaper;
• An integrated open-source HTML5 WebKit-based browser;
• Full support for applications that integrate map controls as part of their user inter-face;
24

State of the Art
• Media libraries for playing and recording a variety of audio/video formats;
• Mobile-optimized hardware-accelerated graphics, including a 2D graphics libraryand support for 3D graphics using OpenGL ES 2.0;
• An application framework that encourages application components reuse.
2.4.2 Communicating with Web Services
Web service is a solution used in systems integration and communication betweendifferent applications. This technology makes possible the interaction between new ap-plications and existing ones, regardless the platform in which they were developed or thearchitecture on which they are deployed, the compatibility is ensured.
Different programs communicate through web services, sending and receiving data ina standard format, frequently using XML. Therefore, it is not important what languagethey "speak" (they may have their own language) since to communicate the data is "trans-lated" into a standard format [Erl04]. Web services allow applications to dispose theircontents and features over the network, in a recognized way.
Some other technologies do pretty much the same. The browsers, for instance, useInternet standards such as HTTP and HTML to access the content of a specific web page.Unfortunately, they are not successful in applications communication [W3S].
Web services aim to create an environment where any networked client, running onany type of device, is able to find a service on the network and use it as it was a localservice.
2.4.2.1 SOAP Solutions
SOAP is a communication protocol for exchanging information in a distributed envi-ronment. In other words, SOAP allows two processes (i.e. two applications), running inseparated machines, to communicate and share data and functionalities, independently ofthe hardware and platform they run on. [FCM03].
A SOAP web service consists of 3 main components: a service registry, a serviceprovider, a service consumer, as shown in Figure 2.14.
This protocol uses XML to format its messages, applying conventions and encodingrules. The trading and messaging process is done after connecting to other applicationlayer protocol, specifically the Hypertext Transfer Protocol (HTTP).
Figure 2.15 illustrates the SOAP message model. It includes a SOAP envelope, aheader (optional) and a body.
25

State of the Art
Summing up, this communication protocol consists of 3 basic things:
• an envelope that defines the message and the way to process it;
• a set of rules specifying data types instances defined in the application;
• a convention for representing calls and responses.
Figure 2.14: SOAP model Figure 2.15: SOAP message.7
EXTENSIBLE MARKUP LANGUAGE (XML)
eXtensible Markup Language defines a set of rules for encoding data in machine-readable form, and it is a W3C recommendation for generating markup languages forspecial needs, as tags are not predefined and the programmer must define his own tags.XML technology was designed to carry data, not to display it and it works along withsome other technologies that complement it. It actually represents a distinct way of do-ing things and the main novelty is that it enables to share data at all levels, across allplatforms and applications. Thus, XML has an important role in globalization and com-patibility between systems, since information sharing in a easy, safe and reliable way lieson it [FCM03].
Moreover, XML allows the developer to focus and devote their efforts to the importanttasks rather than to time-consuming tasks such as structural validation which is standard-ized, and so the programmer does not have to worry about it. It is extensively used in Webservices paradigm as it provides a transportable means of describing system and configu-ration information that can be shared between applications. Both SOAP and WSDL filesare written using XML [Mah05].
7 http://download.oracle.com/docs/cd/E19798-01/821-1796/aeqex/index.html
26
State of the Art
WEB SERVICE DESCRIPTION LANGUAGE (WSDL)
WSDL is a document written in XML that describes a Web service. It specifies theoperations the service provides, the way to invoke them, where it can be found on thenetwork as well as its interface.
It simplifies the communication between applications, since the client can know whichoperations are available on the web service by accessing this WSDL file, when connect-ing. The client can then use SOAP to actually call one of the operations listed in theWSDL file [RC07].
The main conceptual objects of WSDL 2.0 are listed below:
• Service: container for the set of functions exposed to web-based protocols;
• Endpoint: defines the address to connect to the Web service, typically a HTTPURL string;
• Binding: specifies the interface and defines the binding style as well as the transport(SOAP);
• Interface: defines the web service, its operations and the messages required toperform those operations;
• Operation: defines a function or method;
• Types: describes the data.
2.4.2.2 REST
REST stands for Representational State Transfer and it is a software architectural style.It was developed in parallel with HTTP/1.1, which conforms with REST style (in fact itrepresents the largest implementation of a REST architecture).
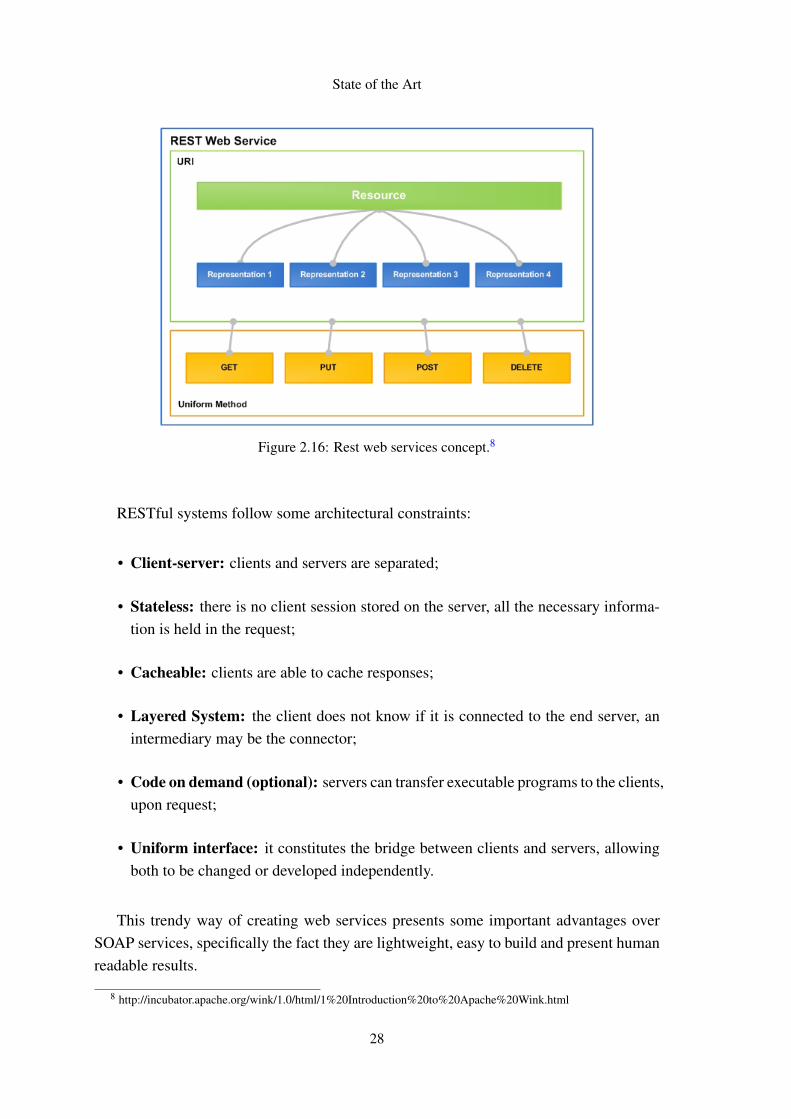
The concept behind defends an environment where clients and servers co-exist andcommunicate. Clients send requests to servers which in turn process the requests andreturn appropriate responses. All the messages are built around the transfer of representa-tions of resources, which are identified by uniform resource identifiers (URIs). Resourcesare manipulated through their representation and messages are self-descriptive.Figure 2.16 illustrates the REST concept above explained.
27
State of the Art
Figure 2.16: Rest web services concept.8
RESTful systems follow some architectural constraints:
• Client-server: clients and servers are separated;
• Stateless: there is no client session stored on the server, all the necessary informa-tion is held in the request;
• Cacheable: clients are able to cache responses;
• Layered System: the client does not know if it is connected to the end server, anintermediary may be the connector;
• Code on demand (optional): servers can transfer executable programs to the clients,upon request;
• Uniform interface: it constitutes the bridge between clients and servers, allowingboth to be changed or developed independently.
This trendy way of creating web services presents some important advantages overSOAP services, specifically the fact they are lightweight, easy to build and present humanreadable results.
8 http://incubator.apache.org/wink/1.0/html/1%20Introduction%20to%20Apache%20Wink.html
28

State of the Art
2.4.3 Google Health
Google Health is a personal health record (PHR) service launched in 2008 that al-lows users to store and manage their health information online. The use of the service iscompletely free, only a Google account is required.
Users are allowed to enter basic personal information, along with details about anyhealth conditions, medications, allergies, procedures, etc. GH follows the "anywhere,anytime" systems concept, by having all the data stored in the cloud. Users do not haveto worry with issues that few time ago were a reality such as the free space in disk, howto access information stored in a different device, etc. Users just concede GH the right toorganize and manage all their health and wellness information. Things like monitor theprogress with weight loss goals or create custom trackers for wellness issues (e.g. dailysleep) are now straight forward using this platform.
2.5 Related Work
In this Section the related work on the field is presented, specifically two different-purpose applications, one for iPhone and the other one for Android. Both case studies arefairly brief and do not go into much detail mainly because there is a lack of informationto support them.
2.5.1 iStethoscope
iStethoscope [Ben] is an iPhone application that turns the device into a stethoscope,allowing listening to the heartbeat and seeing the respective heart waveform.
Figure 2.17: Heart wave form on iStethoscope.9
To pick up on the heart beat, the surface of the iPhone where the microphone is built-in in, must be pressed against the chest. Shaking the iPhone after some seconds, the
9 http://www.dailymail.co.uk/sciencetech/article-1307646/iStethoscope-The-iPhone-app-replacing-real-thing-hospitals.html
29

State of the Art
last eight seconds of recording are played back at the same time that a spectrogram isdisplayed on the screen. Both the recorded sound and the diagram may be emailed to aspecialist for further information.
2.5.2 Instant Heart Rate
Designed for the Android platform, Instant Heart Rate [ins] is an accurate heart ratemonitor application that does not need any external hardware. Below, in Figure 2.18, ispresented a screenshot of this application working.
Figure 2.18: Heartbeat monitoring with Instant Heart Rate.10
It works by placing and holding the finger over the built-in camera while waiting fora reading, which should not take more than 10 seconds. It measures the color of the skinon the fingertip, detecting tiny shifts in color each time the heart beats.
10http://medgadget.com/2010/09/instant_heart_rate_turns_your_android_phone_into_a_heart_rate_monitor_1.htm
30
Chapter 3
Requirements and Architecture
3.1 Architecture
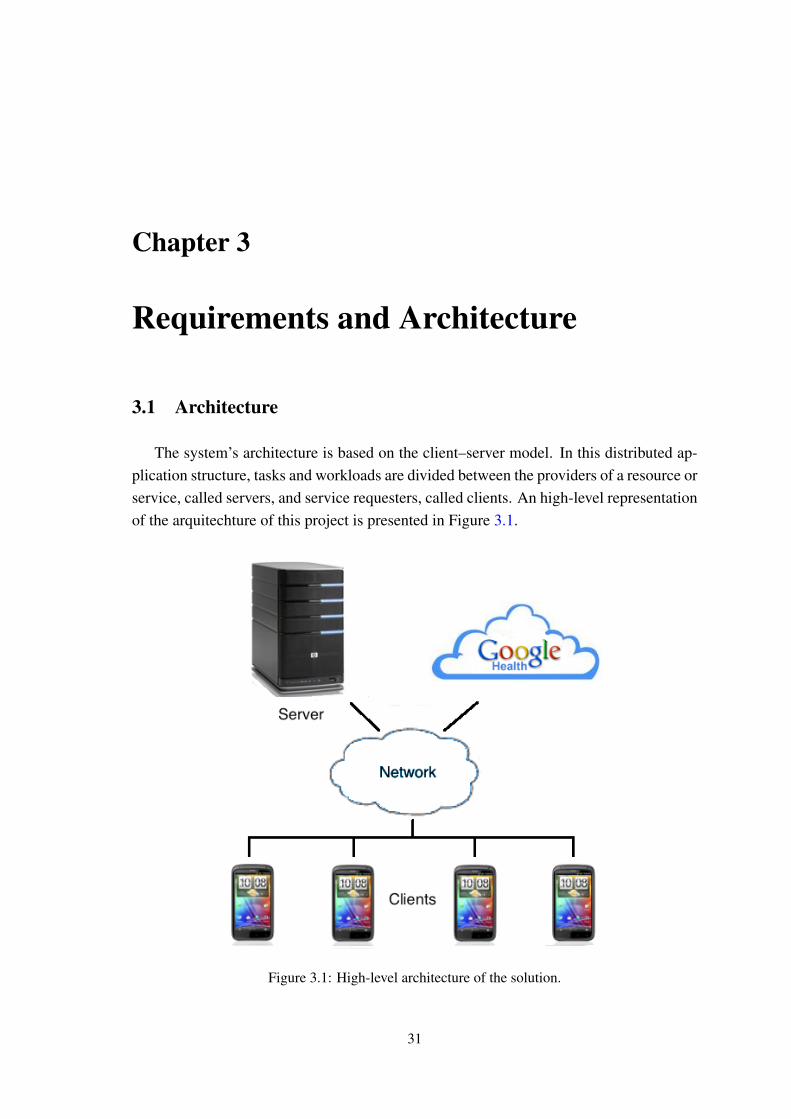
The system’s architecture is based on the client–server model. In this distributed ap-plication structure, tasks and workloads are divided between the providers of a resource orservice, called servers, and service requesters, called clients. An high-level representationof the arquitechture of this project is presented in Figure 3.1.
Figure 3.1: High-level architecture of the solution.
31
Requirements and Architecture
In this model, there is a network environment in which information exchanges are per-formed between a server machine and a client machine, and where server has resourcesthat can be shared by different clients. Clients and server communicate over a computernetwork generally on separate hardware, although both may reside in the same system. Aclient, an Android smartphone, requests a server’s content or service function and there-fore initiates communication with the server which is waiting for incoming requests. Theclient then just waits for the answer from the server which, on the other hand, does what-ever the client asked it to do and then returns the expected result. In this project, theserver is responsible for the digital processing of the sound recordings captured using thesmartphone.
3.2 Requirements
3.2.1 Functional Requirements
The system shall:
• Allow people to perform every-day tests to their heart and lung functions;
• Process the results of the exam, by cloud computing;
• Match the results with a "heath pattern" that characterizes the patient’s status;
• Build a history of results;
• Exchange the test results with health care professionals;
• Advice patient to go to the doctor if some pathology is found;
The target device to be used is an Android based smartphone. The stethoscope micro-phone must be low-cost.
Graphical User Interface
Very special attention shall be given to the fact that the users will be aging and elderlypeople, so not only a user friendly interface, but also an interactive user manual that willguide the users through the tests will be needed.
Information sharing
To be effective, an application requires good data visibility and ease of integration withother applications so that the right information is always at our fingertips. The applicationis intended to offer information of great value and that might be reused along with otherm-health systems. Functions to exchange the test results with health care professionalsshall be implemented as well.
32

Requirements and Architecture
3.2.2 Non-Functional Requirements
Usability
The system should follow the usability standards so that the users can use it easily.The design of the mobile application should take in consideration the possible differentaging groups of users, specially the elderly which capabilities are naturally decreased.Simplicity and intuition must be present.
Reliability
Although the system’s purpose is not to substitute the Healthcare professionals (and itshould not be taken as such), it is still extremely important to be careful with the messagesthat are displayed to the user, avoiding misinformation about their health status. Theresults shall then be accurate and reliable. Private user data must be confidential in orderto establish a high degree of trust.
Performance
In mobile applications, the device’s characteristics, features and limited resources dic-tate tough requirements to satisfy user’s expectations. Therefore, the mobile applicationshould be designed carefully and employ every possibility to improve its performance. Itis important to be reasonably fast in every single task.
3.2.3 Why Android
One of the reasons that supported the decision to develop for Android was the fact thatit is open source and so we do have access to the code as anybody else has. On the otherhand, with Android we are not limited to a particularly device manufacturer or serviceprovider, as it happens with iOS.
Also the programming language influenced the option, since Android is based on thepowerful Java language, while in iOS we would have to program in Objective-C which isnot widely used.
One last reason is related with the market. It is far easier and faster to get your ap-plication accepted and published in the Android Market than in the App Store. Whilein Android it just needs to conform with the Market rules and it is quickly checked, inApp Store, apart from the time it takes to be reviewed, it might be rejected at the end justbecause [app].
33

Requirements and Architecture
3.2.4 The stethoscope
To collect the heart and lung sounds, it was used a very simple low-cost electronicstethoscope which is shown below in Figure 3.2.
Figure 3.2: The electronic low-cost stethoscope used.
The official description is presented below:
• Ambient Noise Reduction technology cancels out room noise;
• Sprague diaphragm - single head;
• Sensitivity: -44 dB;
• No battery required.
SPECIFICATIONS:
• Chestpiece Design and Technology: Finished Plated Alloy;
• Standard Length: 20" or 62.6 cm;
• Total Weight: 150 grams;
• Diaphragm Diameter: 1.31" or 2.9 cm;
• Bell (20-200Hz);
• Diaphragm (100-500 Hz);
• Extended Range (20-1000 Hz);
34
Requirements and Architecture
3.3 Functionalities
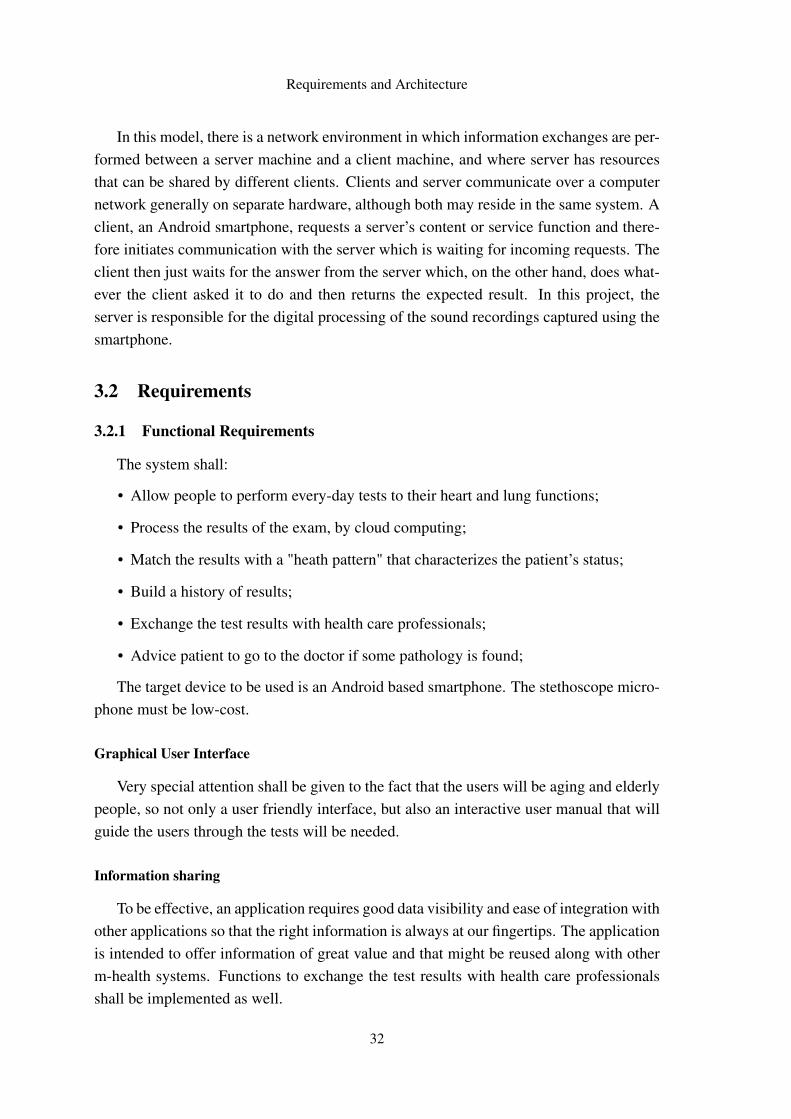
All the requirements specified in Section 3.2 were accomplished. The mobile applica-tion allows users to perform daily-tests to their heart and lung functions and keep a historyof results somewhere on the cloud (GoogleHealth) and also locally on a small database.The users can at anytime and anyplace access their information, either from the mobile oron a browser through Google Health.
A diagram with the actors that interact with the system and the correspondent usecases are shown below in Figure 3.3.
Figure 3.3: System’s Use Cases Diagram.
The term "heart and lung functions" is too general and there is a wide range of pathol-ogy medical conditions that can be diagnosed through the physical examination using astethoscope, reason why we had to choose a more specific direction to focus on. It itwould be unwise to focus on all of them on this project, bearing in mind the short time
35
Requirements and Architecture
allocated for it. Therefore, it was decide to concentrate on the prevention of strokes andheart failure, through the detection of:
• Atrial fibrilitation - disfunctioning of the heart (chaotic);
• Crackles in the lungs - frequently audible during inspiration;
Additionally, the system calculates the heartbeat rates of the patient during the exam-ination, and its variation. Along with some more information, the user can visualize onthe screen the maximum, minimum and average values of heartrate.The application also matches the patient status with a "health pattern", and in case anyabnormality is detected, the patient is advised to go to the doctor.
Each exam consists of two different steps:
• Auscultation of the heart;
• Auscultation of the lungs.
36

Chapter 4
System Implementation
In this chapter, it is detailed the system implementation. Is is described what wasdone, how it was done and what were the alternatives in some particular situationsl. Thenecessary justifications are added whenever adequate.
4.1 Audio Recording
Android offers built-in encoding and decoding for a variety of common audio andvideo types, allowing easy integration of media into the application.
There are three distinct ways to capture and record audio from the built-in microphoneof the Android smartphone, using three different classes: MediaRecorder, AudioRecordand AudioRecord - Native Interface. These media capabilities, which can be accessedfairly straightforwardly, are useful in different situations, depending on the purpose andneeds. Thus, the various alternatives were compared so that the most appropriate one waschosen. Below are enumerated some advantages and disadvantages of each solution.
1- MEDIARECORDER
MediaRecorder, as the name suggests, records media. Thus, it can be used to recordaudio from the built-in microphone of the device and write it into a file on the SD card.However, the recorded audio is encoded in one of the following formats: AMR, MPEG4,WAR or 3GP.
+ Pros +
• Android standard class to record audio and video;
• Easy to use;
- Cons -
37

System Implementation
• Records audio in compressed format;
• No access to the audio buffers;
• Difficult to process the recorded audio due to its compressed format;
• Sampling rate cannot be changed;
• No control on the recording.
Figure 4.1: AudioRecord and MediaRecord communication.
The picture 4.1 shows how this class works. The MediaRecorder class works like awrapper API, invoking the C++ MediaRecorder class via JNI. Most of the android APIshave been implemented as such. For efficiency reasons, the core functionalities are imple-mented in the C++ and then these are called from the Java API. The service that actuallyrecords the audio is called AudioFlinger.
2 - AUDIORECORD
AudioRecord solution overcomes the limitations of MediaRecorder, providing greaterflexibility. Audio can be recorded into buffers for post processing. The Java AudioRecordAPI invokes the C++ AudioRecord class via JNI.
+ Pros +
• Records audio in uncompressed and lossless format: Pulse-Code Modulation (PCM)8 or 16 bits;
• Control on how the recording is performed;
• Different properties can be set: sample rate, sample size, buffer size, etc.;
• Access to the audio buffers.
38

System Implementation
- Cons -
• Data is provided in buffers: more difficult to handle it;
• Data can be lost if there is no certain on how to proceed.
3 - NATIVE INTERFACE
There is also a native interface AudioRecord that can be used for recording audio. Thenative interface provides API that can be invoked from C/C++ libraries. These librariescan then be called from Java activity via JNI. Programs using the interface can be com-piled with the NDK and used in android applications via JNI.
+ Pros +
• Provides a C/C++ interface for recording;
• Processing is more efficient when done in C/C++ using this API.
- Cons -
• No documentation available;
• Google does not officially support it.
OPTION TAKEN
Having considered and compared the different alternatives available, it was decided touse the AudioRecord (Java) option, since it allowed, on one hand, to record data in rawformat and, on the other hand, to set some important parameters as the sample rate, thesize of the data, etc. The API also allowed getting the data into a buffer rather than a file,which was exactly what was needed to perform some lightweight pre-processing.
4.1.1 Audio Properties
The audio was recorded using the uncompressed and lossless format PCM (Pulse-Code Modulation). Some of the properties regarding the way sound is captured are pre-sented and described below.
1 final int samplingRate = 44100;
2 final int audioSource = MediaRecorder.AudioSource.MIC;
3 final int channelConfig = AudioFormat.CHANNEL_CONFIGURATION_MONO;
4 final int audioFormat = AudioFormat.ENCODING_PCM_16BIT;
5 final int bufferSize = AudioRecord.getMinBufferSize(samplingRate,
6 channelConfig, audioFormat);
39

System Implementation
7
8 AudioRecord recorder = new AudioRecord(audioSource, samplingRate,
9 channelConfig, audioFormat, bufferSize);
samplingRate defines the number of samples per unit of time (second) taken from acontinuous signal to build the discrete signal, and it is expressed on Hertz. The highfrequency limit of human hearing is about 20 kHz and, according to the samplingtheorem 2.3.4, the sampling rate must be twice the maximum frequency we wish toreproduce, so the sampling rate had to be at least 40 kHz, reason why it was chosen44100. Besides that, 44100 Hz is the standard sampling frequency in digital audio.
audioSource tells the source to be used in the recording. In this case the sounds arecaptured by the built-in microphone (MIC).
channelConfig describes the configuration of the audio channels. Using MONO, all theaudio signals are mixed together and routed through a single audio channel.
audioFormat defines the format in which the audio data is recorded. The data is rep-resented in the PCM format using 16 bit per sample, meaning that the values willrange from -32768 to 32767 (2ˆ16 = 65536).
bufferSize is the minimum buffer size required for the successful creation of an Au-dioRecord object.
4.1.2 Prepared for Multi-core Smartphones Generation
The first dual-core smartphone was launched early on this year but 2011 may evenusher in the age of the quad-core mobile. The multi-core processor (currently two 1GHzcores) offers more power to be squeezed out of the processor, as the cores can be used inparallel in order to speed up performance.
However, it is necessary that the device software is optimized to take advantage of theparallel processing capability. For this reason, this application uses multi-threading, par-ticularly in the I/O operations. This option was taken considering the incredible renewalspeed in the area of the smartphones and, also, the great receptivity of the users to thesechanges.
In a multi-core system, these threads will take maximum advantage as they can runconcurrently on separate processors, which should enable a noticeable speed and perfor-mance hike, particularly when it comes to multitasking. In addition, they can also improveprogram’s performance on single processor system by permitting the overlap of input andoutput or other slow operations with computational operations.
40
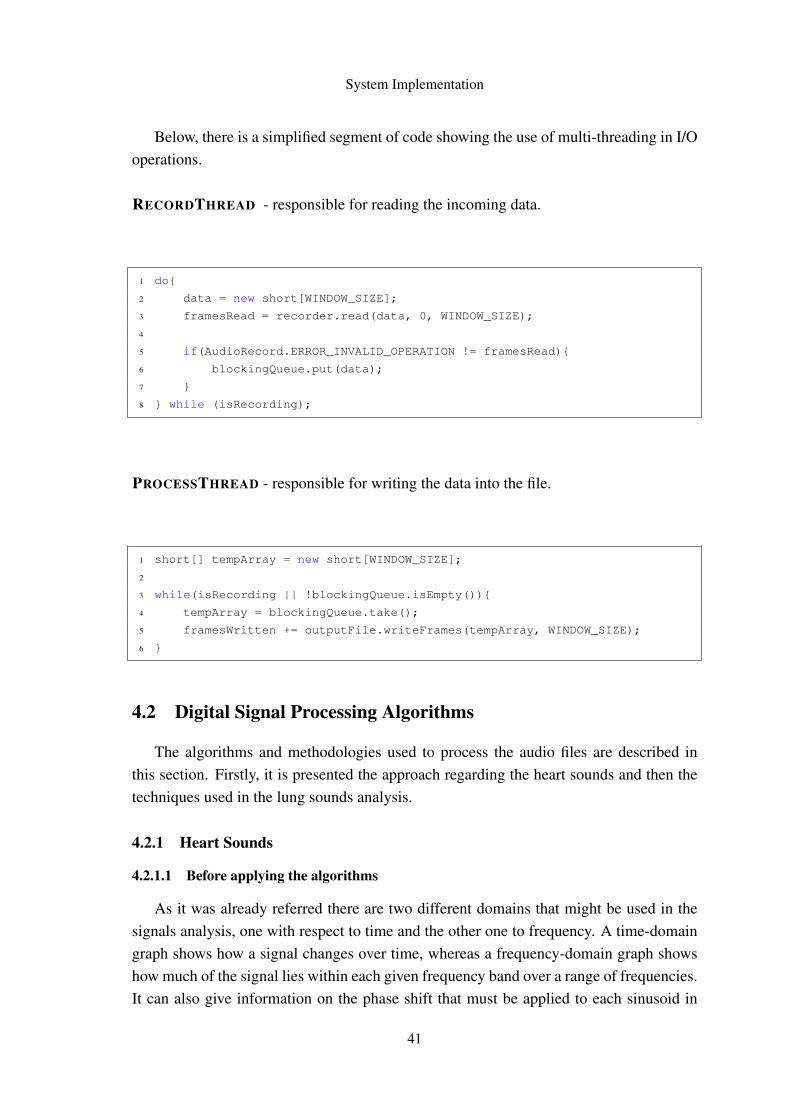
System Implementation
Below, there is a simplified segment of code showing the use of multi-threading in I/Ooperations.
RECORDTHREAD - responsible for reading the incoming data.
1 do{
2 data = new short[WINDOW_SIZE];
3 framesRead = recorder.read(data, 0, WINDOW_SIZE);
4
5 if(AudioRecord.ERROR_INVALID_OPERATION != framesRead){
6 blockingQueue.put(data);
7 }
8 } while (isRecording);
PROCESSTHREAD - responsible for writing the data into the file.
1 short[] tempArray = new short[WINDOW_SIZE];
2
3 while(isRecording || !blockingQueue.isEmpty()){
4 tempArray = blockingQueue.take();
5 framesWritten += outputFile.writeFrames(tempArray, WINDOW_SIZE);
6 }
4.2 Digital Signal Processing Algorithms
The algorithms and methodologies used to process the audio files are described inthis section. Firstly, it is presented the approach regarding the heart sounds and then thetechniques used in the lung sounds analysis.
4.2.1 Heart Sounds
4.2.1.1 Before applying the algorithms
As it was already referred there are two different domains that might be used in thesignals analysis, one with respect to time and the other one to frequency. A time-domaingraph shows how a signal changes over time, whereas a frequency-domain graph showshow much of the signal lies within each given frequency band over a range of frequencies.It can also give information on the phase shift that must be applied to each sinusoid in
41

System Implementation
order to be able to recombine the frequency components to recover the original timesignal.
A given signal can be converted between the time and frequency domains using a setof mathematical operations. Below are presented some lines of code, written in Java,along with comments that explain these operations one by one.
Say we have already read the ".wav" file into an array of doubles, values_Re, and thesize of the data is sampleSize. The FFT computation is faster if the size of the input datais a power of 2. Therefore, we start by meeting this need.
1 % Use next highest power of 2 greater than or equal to length(x) to ...
calculate FFT.
2 nfft = Utils.nextpow2(sampleSize);
3
4 % Create array of doubles and fill it with the data.
5 double x[] = new double[nfft];
6 int i=0;
7 for(; i<sampleSize; i++){
8 x[i] = (double)values_Re[i];
9 }
10
11 % Pad with zeros so that length(fftx) is equal to nfft.
12 for(; i<nfft; i++){
13 x[i] = 0;
14 }
Secondly, we compute the discrete Fourier transform using the FFT algorithm. Thenwe just drop the second half of the FFT array. When the length of the data array iseven, which in this case was forced to be (nfft is a power of 2, and, therefore, even), themagnitude of the FFT will be symmetric, such that the first (n f f t
2 +1) points are unique,and the rest are symmetrically redundant.
1 % Calculate fft.
2 FastFourierTransformer transformer = new FastFourierTransformer();
3 fftx = transformer.transform(x);
1 % Calculate the number of unique points.
2 numUniquePts = (int) Math.ceil((nfft+1)/2);
3
4 % FFT is symmetric, throw away second half.
5 fftx = Utils.subArray(fftx, 0, numUniquePts);
6 fftx_filtered = fftx;
7
42
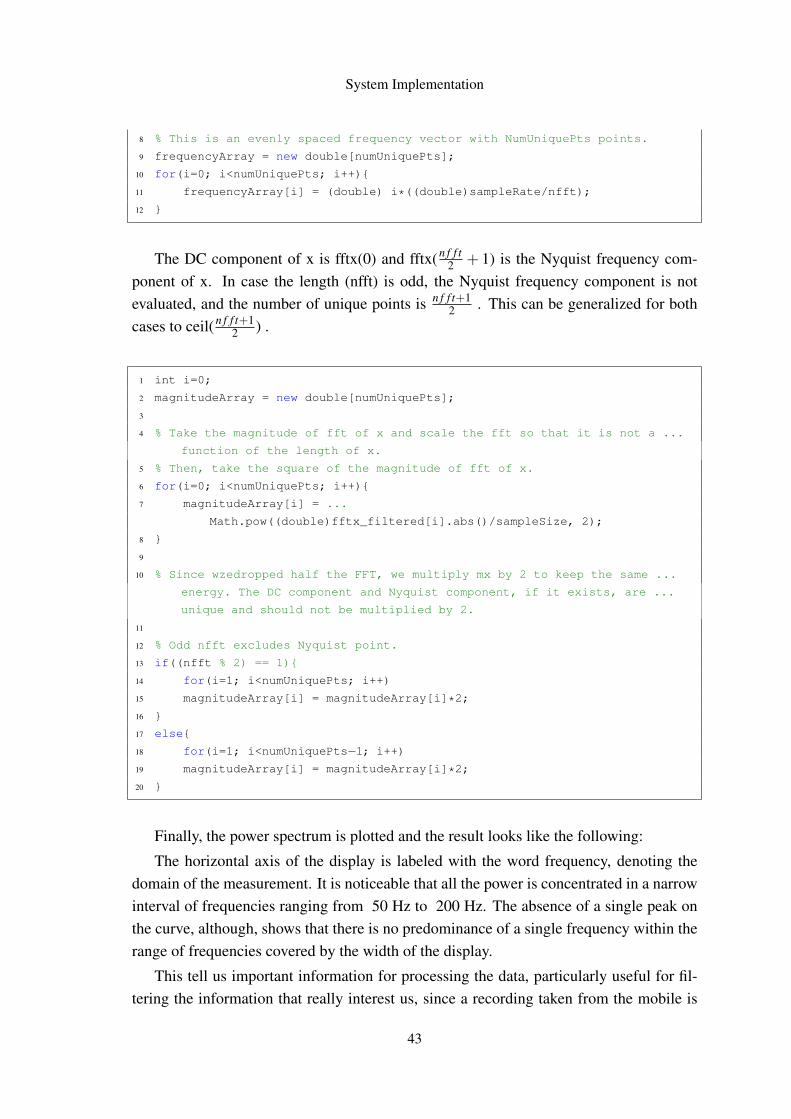
System Implementation
8 % This is an evenly spaced frequency vector with NumUniquePts points.
9 frequencyArray = new double[numUniquePts];
10 for(i=0; i<numUniquePts; i++){
11 frequencyArray[i] = (double) i*((double)sampleRate/nfft);
12 }
The DC component of x is fftx(0) and fftx(n f f t2 + 1) is the Nyquist frequency com-
ponent of x. In case the length (nfft) is odd, the Nyquist frequency component is notevaluated, and the number of unique points is n f f t+1
2 . This can be generalized for bothcases to ceil(n f f t+1
2 ) .
1 int i=0;
2 magnitudeArray = new double[numUniquePts];
3
4 % Take the magnitude of fft of x and scale the fft so that it is not a ...
function of the length of x.
5 % Then, take the square of the magnitude of fft of x.
6 for(i=0; i<numUniquePts; i++){
7 magnitudeArray[i] = ...
Math.pow((double)fftx_filtered[i].abs()/sampleSize, 2);
8 }
9
10 % Since wzedropped half the FFT, we multiply mx by 2 to keep the same ...
energy. The DC component and Nyquist component, if it exists, are ...
unique and should not be multiplied by 2.
11
12 % Odd nfft excludes Nyquist point.
13 if((nfft % 2) == 1){
14 for(i=1; i<numUniquePts; i++)
15 magnitudeArray[i] = magnitudeArray[i]*2;
16 }
17 else{
18 for(i=1; i<numUniquePts−1; i++)
19 magnitudeArray[i] = magnitudeArray[i]*2;
20 }
Finally, the power spectrum is plotted and the result looks like the following:
The horizontal axis of the display is labeled with the word frequency, denoting thedomain of the measurement. It is noticeable that all the power is concentrated in a narrowinterval of frequencies ranging from 50 Hz to 200 Hz. The absence of a single peak onthe curve, although, shows that there is no predominance of a single frequency within therange of frequencies covered by the width of the display.
This tell us important information for processing the data, particularly useful for fil-tering the information that really interest us, since a recording taken from the mobile is
43

System Implementation
Figure 4.2: Heartbeat sound in time and frequency representation.
not so "clean", i.e., it comes with a wide variety of noises that are obviously unavoidablebut necessary to put away.
4.2.1.2 Heartbeat rate detection
The high sample rate used on the recordings (44100 Hz) offers, on one hand, a goodquality of the sound but has, on the other hand, an handicap since it significantly increasesthe amount of data to be processed, making it harder and more demanding. Each recordhas a duration of approximately 20 seconds which means the corresponding audio bufferwill have (20×44100) of length, that is, 882.000 positions.
The sound that is shown on Figure 4.3 is a little bit smaller, it lasts 10 seconds, butis enough to explain the method used to get the heartbeat rates. It is firstly presented theoriginal signal and then, below it, the same signal after being filtered.
The red and blue points marked on the chart correspond respectively to the heartsounds S1 and S2. These two sounds are present in a healthy patient and should bethe first identifiable heart sounds. S1 precedes S2 and they can be described simply asthe basic "lub-dub" sounds. In order to calculate the heartbeat frequency it is necessary toidentify the peaks, colored red and blue.
The data is read and processed in windows of size 2000. This means that 1 second ofsound is traversed shifting the window 22,05 times (44100
2000 ). For each windows (actually,for each position of the window, since it is a single window that is just being translated),the maximum value that is covered by the width of the window is calculated. This valueis then saved into a list containing every window’s maximum.
44

System Implementation
Figure 4.3: Collecting the peaks of the signal after filtering.
Each time this list is updated, it is verified if a new peak was achieved. To do so,several points are taken in consideration:
• The penultimate point on the list (last window’s maximum) has to be higher (inamplitude) than the previous and following points (the following point was preciselythe last to be added to the list which means it is the current window’s maximum);
• The height of the point must be considerably greater than the average height of thesignal so far. To discard points that might pass the first condition described abovebut that correspond to peaks of non-interest (for instance produced by unwantednoise), an eliminating factor is introduced, which multiplied by the average heightof the signal gives a more reliable boundary.
pointHeight > f actor ∗averageHeightO f T heSignal
45
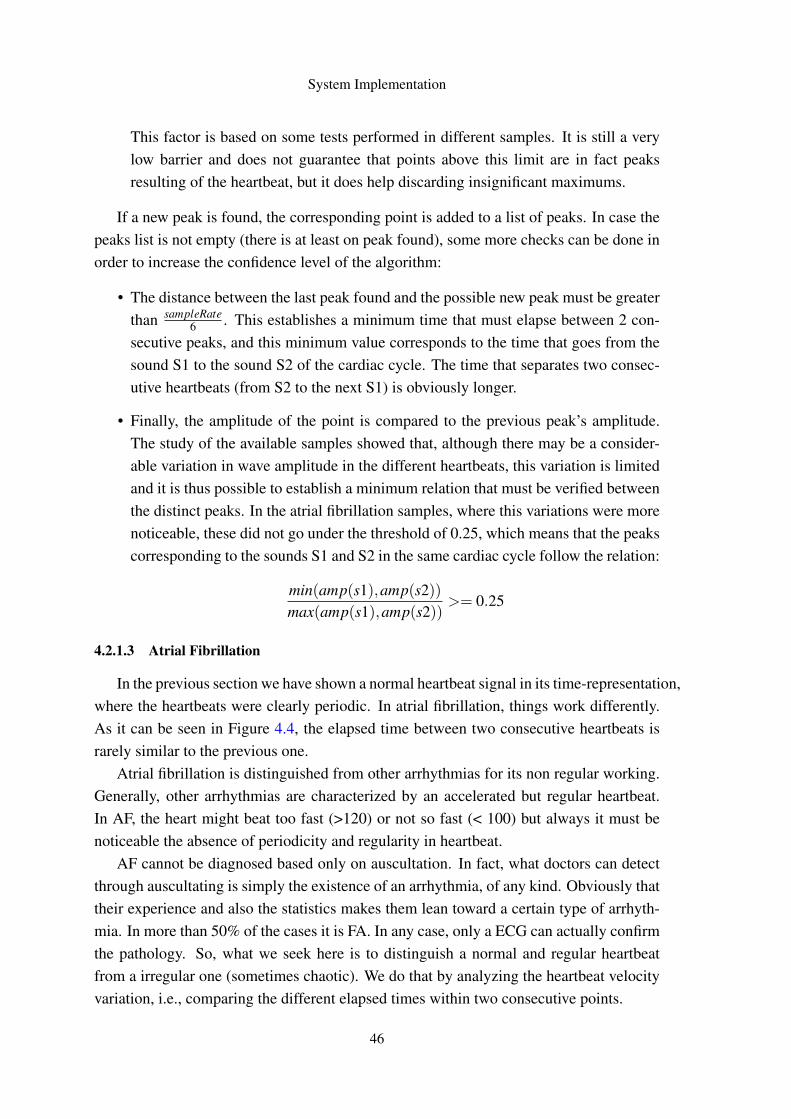
System Implementation
This factor is based on some tests performed in different samples. It is still a verylow barrier and does not guarantee that points above this limit are in fact peaksresulting of the heartbeat, but it does help discarding insignificant maximums.
If a new peak is found, the corresponding point is added to a list of peaks. In case thepeaks list is not empty (there is at least on peak found), some more checks can be done inorder to increase the confidence level of the algorithm:
• The distance between the last peak found and the possible new peak must be greaterthan sampleRate
6 . This establishes a minimum time that must elapse between 2 con-secutive peaks, and this minimum value corresponds to the time that goes from thesound S1 to the sound S2 of the cardiac cycle. The time that separates two consec-utive heartbeats (from S2 to the next S1) is obviously longer.
• Finally, the amplitude of the point is compared to the previous peak’s amplitude.The study of the available samples showed that, although there may be a consider-able variation in wave amplitude in the different heartbeats, this variation is limitedand it is thus possible to establish a minimum relation that must be verified betweenthe distinct peaks. In the atrial fibrillation samples, where this variations were morenoticeable, these did not go under the threshold of 0.25, which means that the peakscorresponding to the sounds S1 and S2 in the same cardiac cycle follow the relation:
min(amp(s1),amp(s2))max(amp(s1),amp(s2))
>= 0.25
4.2.1.3 Atrial Fibrillation
In the previous section we have shown a normal heartbeat signal in its time-representation,where the heartbeats were clearly periodic. In atrial fibrillation, things work differently.As it can be seen in Figure 4.4, the elapsed time between two consecutive heartbeats israrely similar to the previous one.
Atrial fibrillation is distinguished from other arrhythmias for its non regular working.Generally, other arrhythmias are characterized by an accelerated but regular heartbeat.In AF, the heart might beat too fast (>120) or not so fast (< 100) but always it must benoticeable the absence of periodicity and regularity in heartbeat.
AF cannot be diagnosed based only on auscultation. In fact, what doctors can detectthrough auscultating is simply the existence of an arrhythmia, of any kind. Obviously thattheir experience and also the statistics makes them lean toward a certain type of arrhyth-mia. In more than 50% of the cases it is FA. In any case, only a ECG can actually confirmthe pathology. So, what we seek here is to distinguish a normal and regular heartbeatfrom a irregular one (sometimes chaotic). We do that by analyzing the heartbeat velocityvariation, i.e., comparing the different elapsed times within two consecutive points.
46
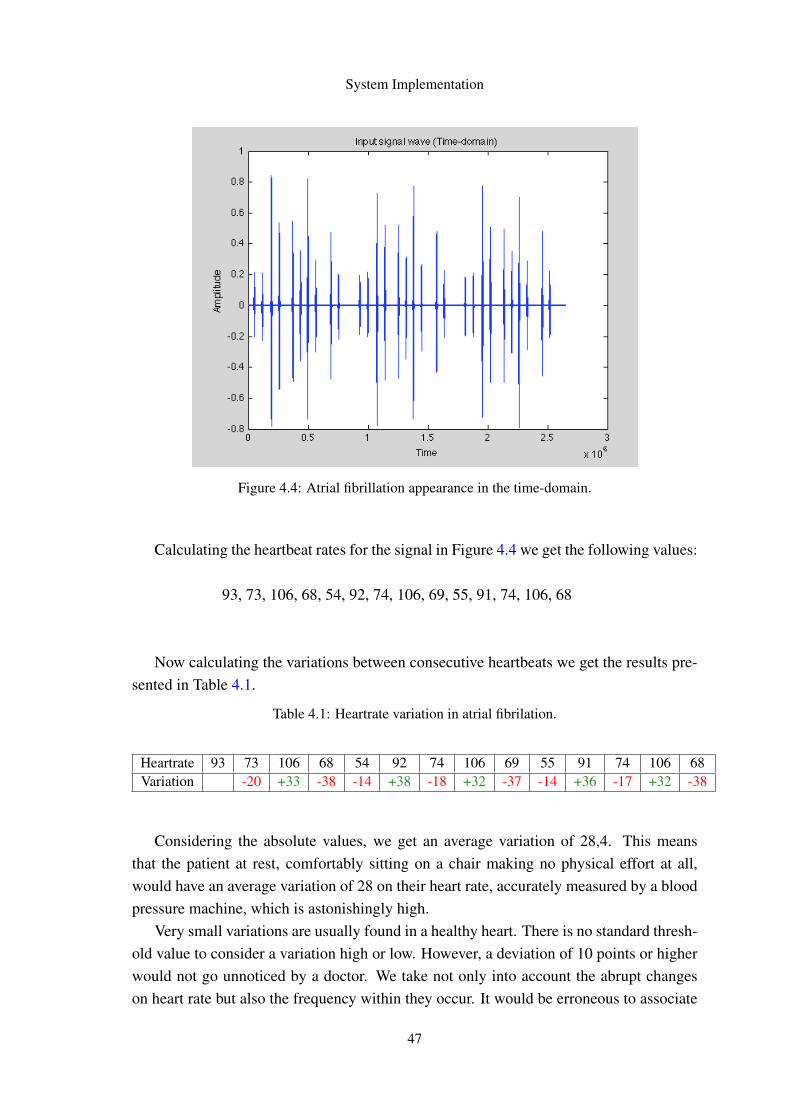
System Implementation
Figure 4.4: Atrial fibrillation appearance in the time-domain.
Calculating the heartbeat rates for the signal in Figure 4.4 we get the following values:
93, 73, 106, 68, 54, 92, 74, 106, 69, 55, 91, 74, 106, 68
Now calculating the variations between consecutive heartbeats we get the results pre-sented in Table 4.1.
Table 4.1: Heartrate variation in atrial fibrilation.
Heartrate 93 73 106 68 54 92 74 106 69 55 91 74 106 68Variation -20 +33 -38 -14 +38 -18 +32 -37 -14 +36 -17 +32 -38
Considering the absolute values, we get an average variation of 28,4. This meansthat the patient at rest, comfortably sitting on a chair making no physical effort at all,would have an average variation of 28 on their heart rate, accurately measured by a bloodpressure machine, which is astonishingly high.
Very small variations are usually found in a healthy heart. There is no standard thresh-old value to consider a variation high or low. However, a deviation of 10 points or higherwould not go unnoticed by a doctor. We take not only into account the abrupt changeson heart rate but also the frequency within they occur. It would be erroneous to associate
47
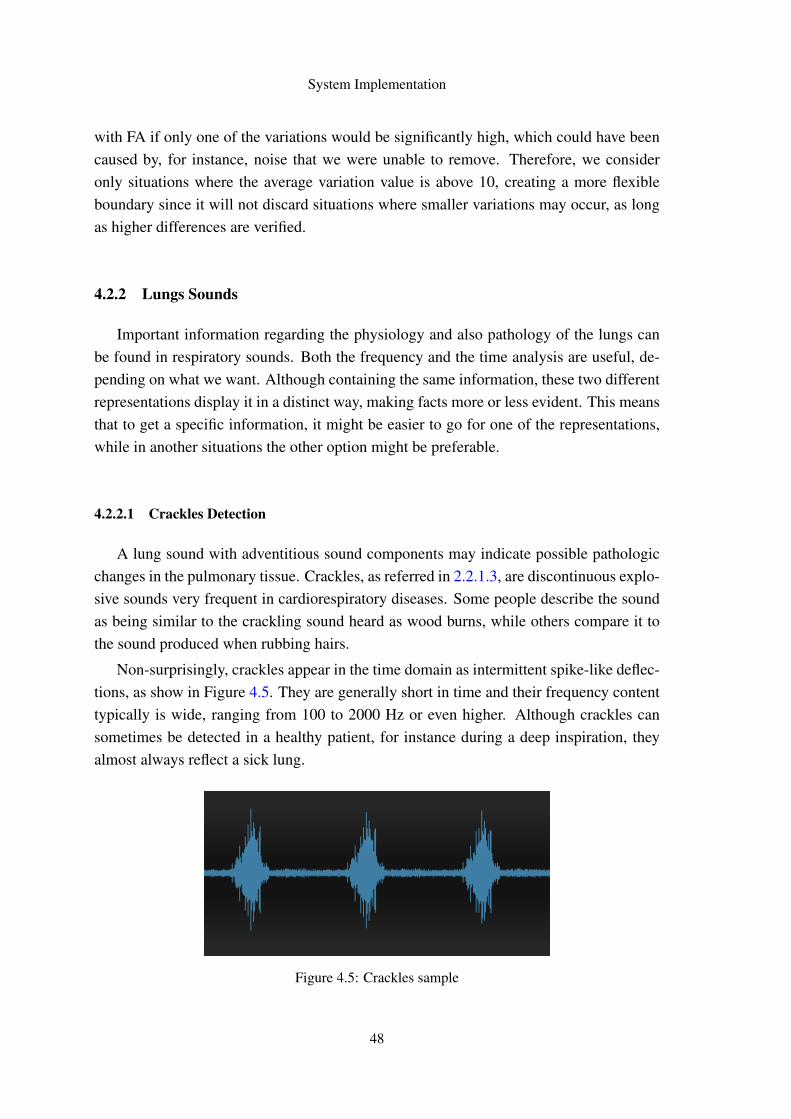
System Implementation
with FA if only one of the variations would be significantly high, which could have beencaused by, for instance, noise that we were unable to remove. Therefore, we consideronly situations where the average variation value is above 10, creating a more flexibleboundary since it will not discard situations where smaller variations may occur, as longas higher differences are verified.
4.2.2 Lungs Sounds
Important information regarding the physiology and also pathology of the lungs canbe found in respiratory sounds. Both the frequency and the time analysis are useful, de-pending on what we want. Although containing the same information, these two differentrepresentations display it in a distinct way, making facts more or less evident. This meansthat to get a specific information, it might be easier to go for one of the representations,while in another situations the other option might be preferable.
4.2.2.1 Crackles Detection
A lung sound with adventitious sound components may indicate possible pathologicchanges in the pulmonary tissue. Crackles, as referred in 2.2.1.3, are discontinuous explo-sive sounds very frequent in cardiorespiratory diseases. Some people describe the soundas being similar to the crackling sound heard as wood burns, while others compare it tothe sound produced when rubbing hairs.
Non-surprisingly, crackles appear in the time domain as intermittent spike-like deflec-tions, as show in Figure 4.5. They are generally short in time and their frequency contenttypically is wide, ranging from 100 to 2000 Hz or even higher. Although crackles cansometimes be detected in a healthy patient, for instance during a deep inspiration, theyalmost always reflect a sick lung.
Figure 4.5: Crackles sample
48
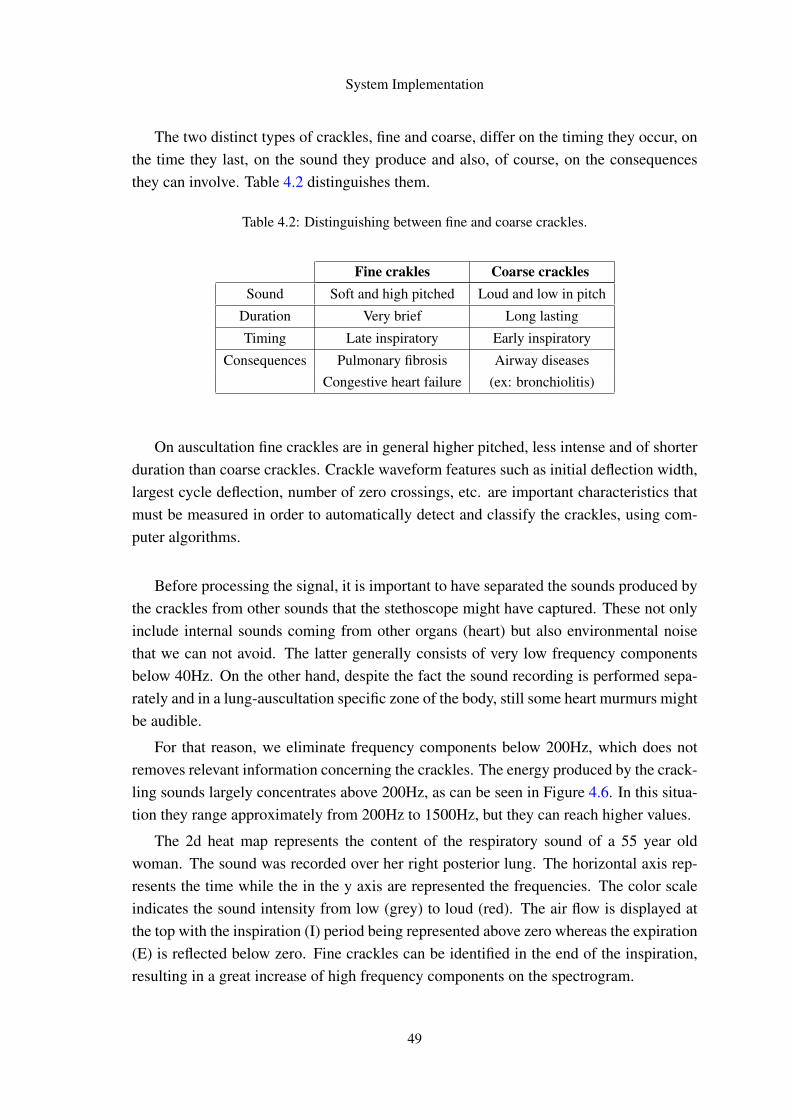
System Implementation
The two distinct types of crackles, fine and coarse, differ on the timing they occur, onthe time they last, on the sound they produce and also, of course, on the consequencesthey can involve. Table 4.2 distinguishes them.
Table 4.2: Distinguishing between fine and coarse crackles.
Fine crakles Coarse cracklesSound Soft and high pitched Loud and low in pitch
Duration Very brief Long lasting
Timing Late inspiratory Early inspiratory
Consequences Pulmonary fibrosis Airway diseasesCongestive heart failure (ex: bronchiolitis)
On auscultation fine crackles are in general higher pitched, less intense and of shorterduration than coarse crackles. Crackle waveform features such as initial deflection width,largest cycle deflection, number of zero crossings, etc. are important characteristics thatmust be measured in order to automatically detect and classify the crackles, using com-puter algorithms.
Before processing the signal, it is important to have separated the sounds produced bythe crackles from other sounds that the stethoscope might have captured. These not onlyinclude internal sounds coming from other organs (heart) but also environmental noisethat we can not avoid. The latter generally consists of very low frequency componentsbelow 40Hz. On the other hand, despite the fact the sound recording is performed sepa-rately and in a lung-auscultation specific zone of the body, still some heart murmurs mightbe audible.
For that reason, we eliminate frequency components below 200Hz, which does notremoves relevant information concerning the crackles. The energy produced by the crack-ling sounds largely concentrates above 200Hz, as can be seen in Figure 4.6. In this situa-tion they range approximately from 200Hz to 1500Hz, but they can reach higher values.
The 2d heat map represents the content of the respiratory sound of a 55 year oldwoman. The sound was recorded over her right posterior lung. The horizontal axis rep-resents the time while the in the y axis are represented the frequencies. The color scaleindicates the sound intensity from low (grey) to loud (red). The air flow is displayed atthe top with the inspiration (I) period being represented above zero whereas the expiration(E) is reflected below zero. Fine crackles can be identified in the end of the inspiration,resulting in a great increase of high frequency components on the spectrogram.
49

System Implementation
Figure 4.6: Crackles’ frequency components and timing.1
The picture 4.7, taken after filtering the signal through a high pass filter, offers a lotmore informative sample for the presence of crackles. The cut off frequency was set at200 Hertz.
The picture speaks for itself. We get a quite good approximation to a typical crackleswaveform. The noise was completely eliminated and also part of normal breath soundsdisappeared. Listening to the output sound file, we can hear nothing but the crackles. Ahealthcare professional would probably find it weird and artificial, since the sound wasmodified, but for DSP it is just fine. The key information was kept and this filtered sampleallows us to verify the presence or absence of crackles. Note that if no crackles would bedetected, the signal positioned at the bottom of the picture 4.7 would have an horizontallyflat waveform, close to zero.
What we try to do is to separate the frequency components produced by normal breathsounds from the ones produced by crackles. Although this is not achievable in perfection,since there is not a frequency interval that clearly separates them, the key information iswell distinguished. After having filtered the crackling sounds, through a highpass filterwith a cut off frequency of 200 Hertz, we calculate the respective frequency spectrum.Then, we compute the same frequency spectrum but now of the original file, i.e., beforehaving been filtered, exactly as it was recorded by the smartphone.
1 http://www.rale.ca/Crackles_b.htm
50

System Implementation
Figure 4.7: Crackles recording before and after filtering.
Having done this, we have two different arrays: one representing the frequency spec-trum of the original audio recording and the other one representing the frequency spectrumthat characterizes crackles. These arrays contain the energy produced in each frequencylevel.
For each array, we calculate its total energy, by summing up all the their values. Fi-nally, we just compare this two energies in the form:
Energy produced in crackles frequency rangeEnergy produced in all frequencies
×100
This gives us the percentage of the total energy whose components in frequency arecovered by the possible frequency range of crackles.
In a normal vesicular breath sound, this percentage shows up to be very low, inferiorto 5%. In contrast, when there is clear evidence of crackles, this percentage rises toconsiderable values such as 30%, 50%, 60%, depending on the type of crackles. But itseemed evident that there is a comfortable confidence interval, between 5% and 25% thatseparates this two happenings. Therefore, we defined a threshold of 10% under which
51
System Implementation
we consider there is no evidence of crackles and above which we do consider there arecrackles.
4.3 Mobile application
Since the very first lines of code were produced, it was intended to produce a GUI(graphical user interface) as much simple and pleasant as possible. But it is also importantto be efficient, i.e., that does not induce the users in error, or at least that does it fewtimes. In any application, its usability and efficiency are very important points in thedecision between using it or not. Bearing that on mind, the contents were placed in themost concise and simple way possible, accompanied whenever possible with colors andimages in order to be more aesthetically pleasing.
To develop the application it was used the Android SDK tool, programming in An-droid and XML. The code was structured and organized in order to simplify possiblefuture changes. Everything that concerns the layout, the appearance and organization ofthe diverse components of the screen is defined in XML files. Each screen, an Activity inAndroid, has its own XML file whose name is similar to the activity that inflates it. Allthe strings used in the application are defined in a single file, named strings.xml.
Locally, data is stored in a SQLite database, which is updated every time the resultsof a new exam are returned from the web service.
4.3.1 The Graphical User Interface
The key for the acceptance of a mobile application is the user experience it provides,i.e., how easy and pleasant it is for the user to navigate through the application features.No matter how useful it might be if people cannot use (too complicated) or they just donot like its graphical appearance. Therefore, we tried to design a user-friendly interface,keeping it as much simple and intuitive as possible. We included pictures and icons when-ever we found it helpful. The user has also access to help buttons, test guides and a tutorialvideo. Almost all the screen views are presented in this section.
Let us start with the Start menu, which comes right after the splash screen with theapplication name and logo, not presented here. This screen appearance is shown in Fig-ure 4.8.
In the center of the screen there is a circular menu which consists of 6 clickable lay-outs: (1) Exam now, (2) History, (3) Last exam, (4) Weight, (5) Help, and (6) About. Thereason why we have numbered the different options has to do with their spatial organiza-tion, that we will now explain. It was not by mere chance (neither randomness) that the"buttons" were placed in these positions. In fact, it was based in some tests carried out
52

System Implementation
without without telling people in advance that we were about to check their interactionwith the application. We just kindly asked them to try it.
We found that the majority of users firstly visualize the option in the center of thecircle. It is the one that immediately captures the attention of their eyes. Consequently, itis also the one that is more easily clicked.
Figure 4.8: Look of the Start menu. Figure 4.9: Toast notification display.
As most important functionality, the button to start the exam was placed here. Afterlooking at this option, people tend to turn their eyes to the left, where it is placed theHistory folder, which is, we believe, the second most important taking into account thefunctionality it provides and the number of times that it will possibly be requested. Therest of the options are arranged as a clock and the degree of importance decreases clock-wisely.
The notification that appears on the bottom of the screen in 4.9 is displayed whenpressing the help button. It tells us the users to press and hold the other buttons to get aclue about their functionality. This is presented later in this section.
Yet on this screen, at the top of it, we have the Google Health Account button. It wasplaced here, above the menu, not because it is more relevant, but because it is important
53
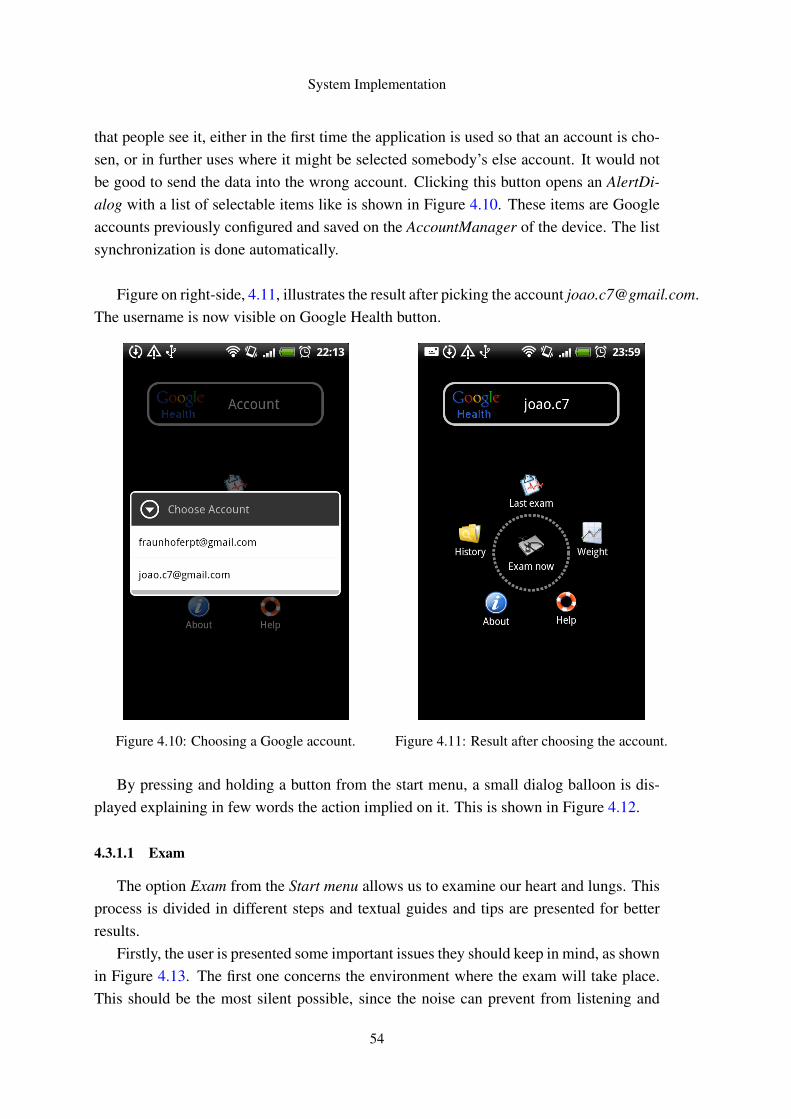
System Implementation
that people see it, either in the first time the application is used so that an account is cho-sen, or in further uses where it might be selected somebody’s else account. It would notbe good to send the data into the wrong account. Clicking this button opens an AlertDi-alog with a list of selectable items like is shown in Figure 4.10. These items are Googleaccounts previously configured and saved on the AccountManager of the device. The listsynchronization is done automatically.
Figure on right-side, 4.11, illustrates the result after picking the account [email protected] username is now visible on Google Health button.
Figure 4.10: Choosing a Google account. Figure 4.11: Result after choosing the account.
By pressing and holding a button from the start menu, a small dialog balloon is dis-played explaining in few words the action implied on it. This is shown in Figure 4.12.
4.3.1.1 Exam
The option Exam from the Start menu allows us to examine our heart and lungs. Thisprocess is divided in different steps and textual guides and tips are presented for betterresults.
Firstly, the user is presented some important issues they should keep in mind, as shownin Figure 4.13. The first one concerns the environment where the exam will take place.This should be the most silent possible, since the noise can prevent from listening and
54
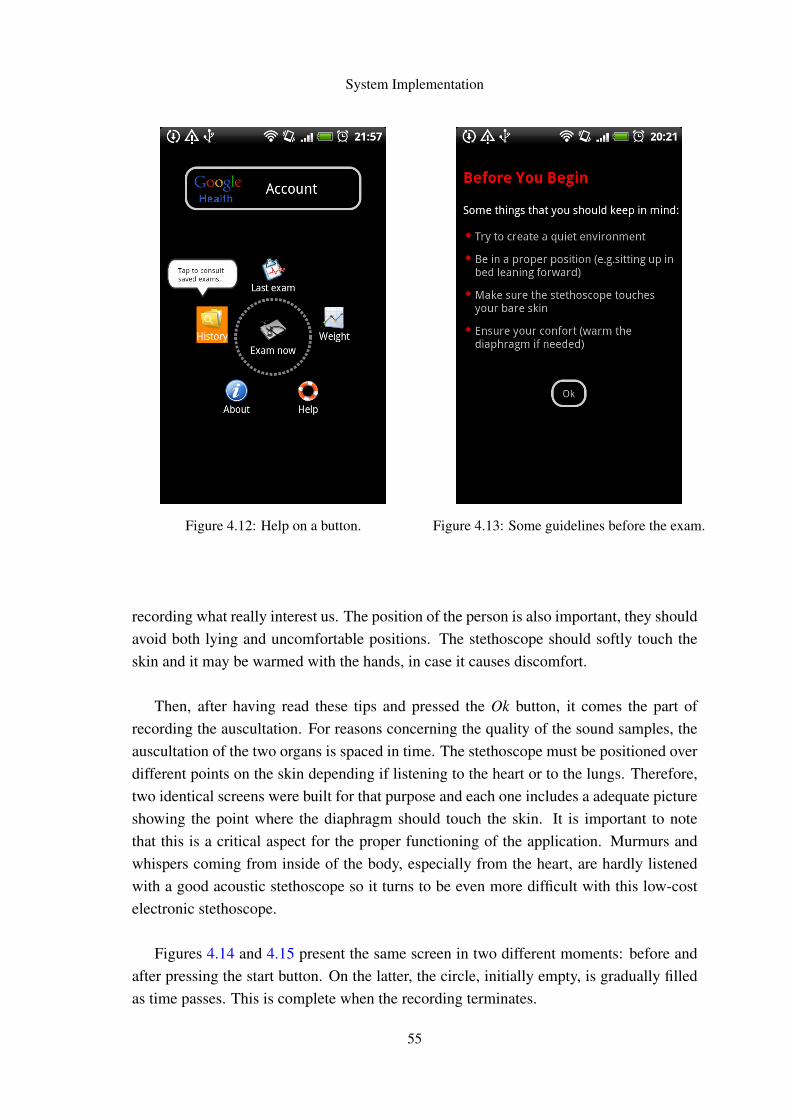
System Implementation
Figure 4.12: Help on a button. Figure 4.13: Some guidelines before the exam.
recording what really interest us. The position of the person is also important, they shouldavoid both lying and uncomfortable positions. The stethoscope should softly touch theskin and it may be warmed with the hands, in case it causes discomfort.
Then, after having read these tips and pressed the Ok button, it comes the part ofrecording the auscultation. For reasons concerning the quality of the sound samples, theauscultation of the two organs is spaced in time. The stethoscope must be positioned overdifferent points on the skin depending if listening to the heart or to the lungs. Therefore,two identical screens were built for that purpose and each one includes a adequate pictureshowing the point where the diaphragm should touch the skin. It is important to notethat this is a critical aspect for the proper functioning of the application. Murmurs andwhispers coming from inside of the body, especially from the heart, are hardly listenedwith a good acoustic stethoscope so it turns to be even more difficult with this low-costelectronic stethoscope.
Figures 4.14 and 4.15 present the same screen in two different moments: before andafter pressing the start button. On the latter, the circle, initially empty, is gradually filledas time passes. This is complete when the recording terminates.
55
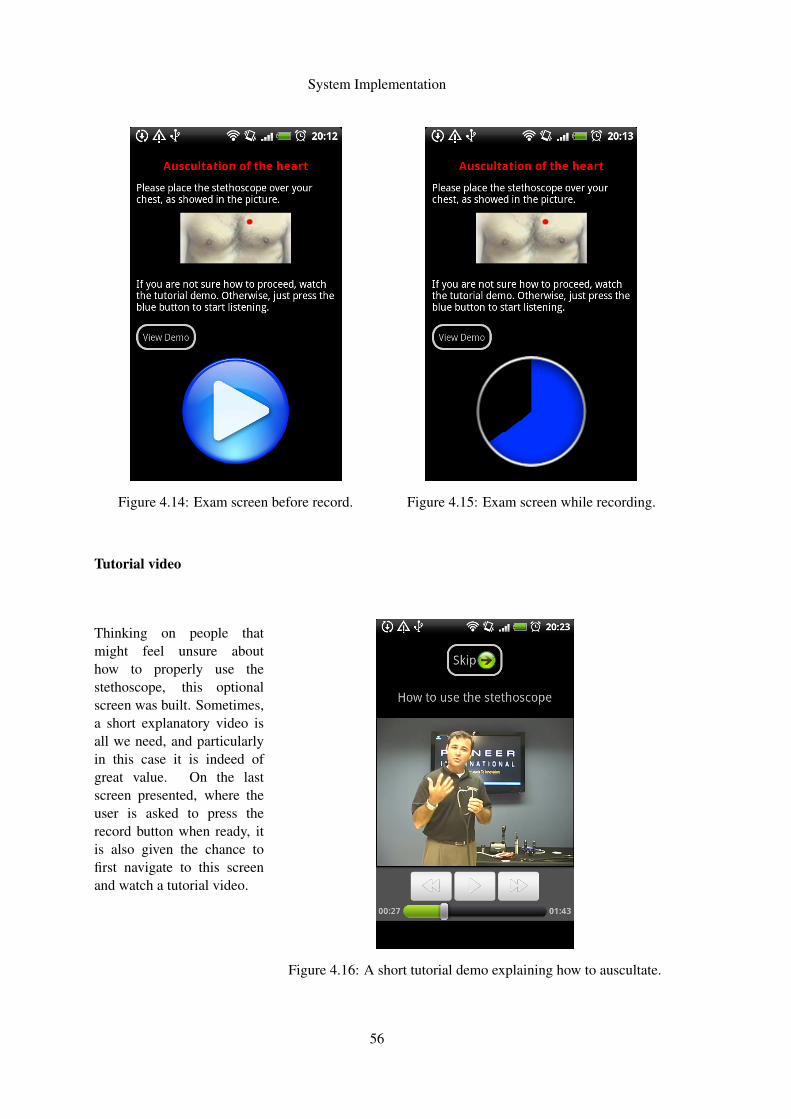
System Implementation
Figure 4.14: Exam screen before record. Figure 4.15: Exam screen while recording.
Tutorial video
Thinking on people thatmight feel unsure abouthow to properly use thestethoscope, this optionalscreen was built. Sometimes,a short explanatory video isall we need, and particularlyin this case it is indeed ofgreat value. On the lastscreen presented, where theuser is asked to press therecord button when ready, itis also given the chance tofirst navigate to this screenand watch a tutorial video.
Figure 4.16: A short tutorial demo explaining how to auscultate.
56
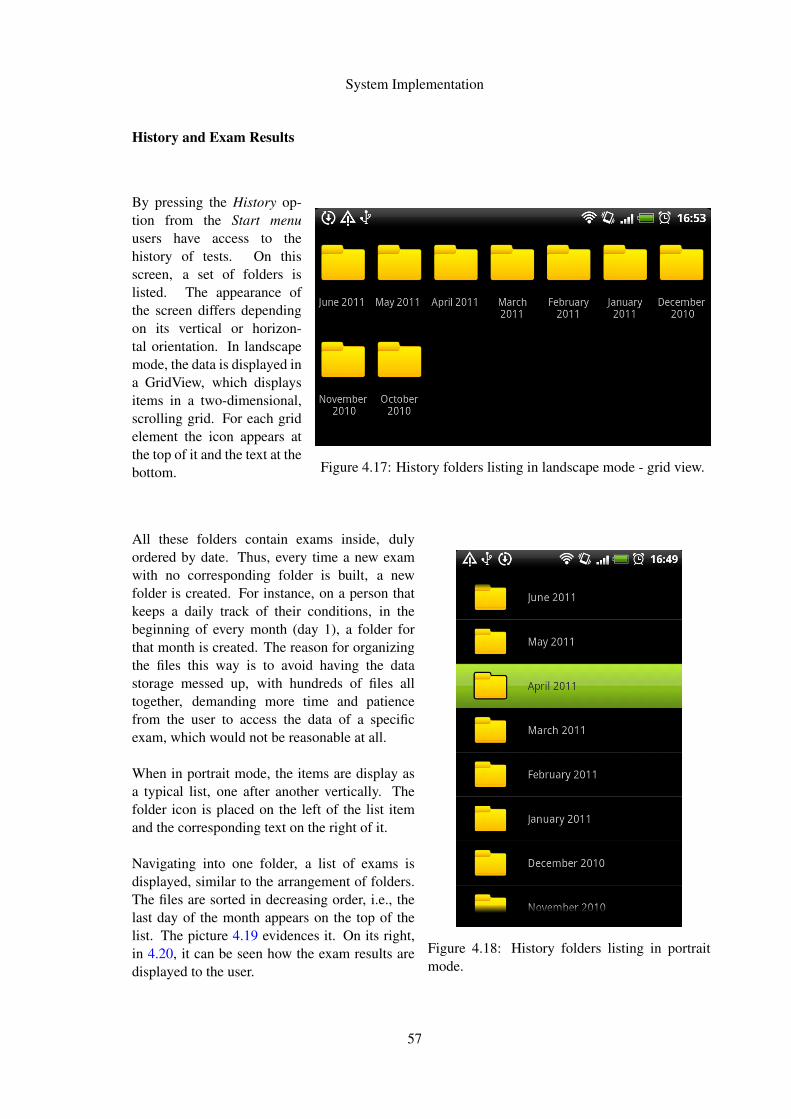
System Implementation
History and Exam Results
By pressing the History op-tion from the Start menuusers have access to thehistory of tests. On thisscreen, a set of folders islisted. The appearance ofthe screen differs dependingon its vertical or horizon-tal orientation. In landscapemode, the data is displayed ina GridView, which displaysitems in a two-dimensional,scrolling grid. For each gridelement the icon appears atthe top of it and the text at thebottom. Figure 4.17: History folders listing in landscape mode - grid view.
All these folders contain exams inside, dulyordered by date. Thus, every time a new examwith no corresponding folder is built, a newfolder is created. For instance, on a person thatkeeps a daily track of their conditions, in thebeginning of every month (day 1), a folder forthat month is created. The reason for organizingthe files this way is to avoid having the datastorage messed up, with hundreds of files alltogether, demanding more time and patiencefrom the user to access the data of a specificexam, which would not be reasonable at all.
When in portrait mode, the items are display asa typical list, one after another vertically. Thefolder icon is placed on the left of the list itemand the corresponding text on the right of it.
Navigating into one folder, a list of exams isdisplayed, similar to the arrangement of folders.The files are sorted in decreasing order, i.e., thelast day of the month appears on the top of thelist. The picture 4.19 evidences it. On its right,in 4.20, it can be seen how the exam results aredisplayed to the user.
Figure 4.18: History folders listing in portraitmode.
57

System Implementation
Figure 4.19: List of exams from April 2011. Figure 4.20: Results of an exam.
4.3.1.2 Weight Progress
The application also allows users to monitor their weight progress. It is displayed aline chart with the time being represented in the X axis and the weight on the Y line. Thedifferent weights values are marked with red points and a yellow line connects them. Nearthe points are displayed the absolute values of weight.
The display period can be changed on the top-right Spinner - a drop-down list thatallows scrolling when the list exceeds the available vertical space on the screen, which isnot the case.
Figures 4.21 and 4.22 exhibit these two screens.
4.3.1.3 Credits and Feedback
Information about the application can be found on About screen, navigable from theStart menu. Here, apart from some information regarding the application use, there is alsoa button which redirects users to another screen where they can send feedback about theapplication and its features. These messages will be particularly useful in improving it.Both screens are shown below.
58
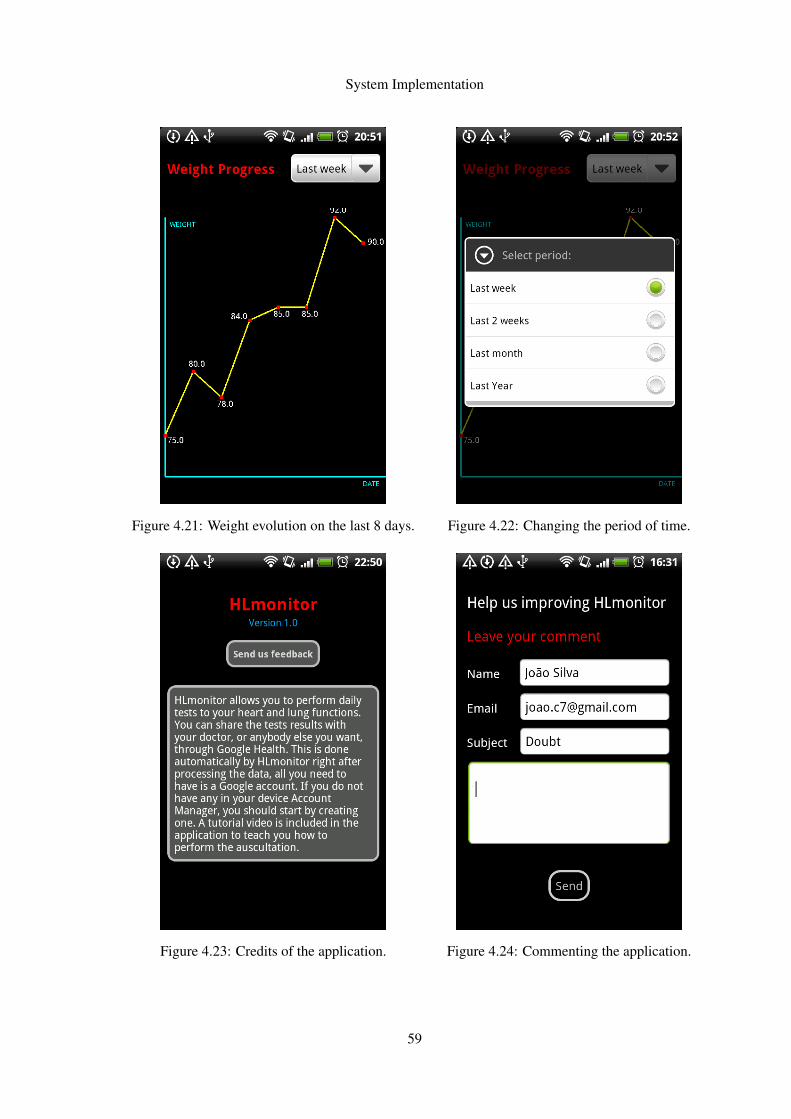
System Implementation
Figure 4.21: Weight evolution on the last 8 days. Figure 4.22: Changing the period of time.
Figure 4.23: Credits of the application. Figure 4.24: Commenting the application.
59
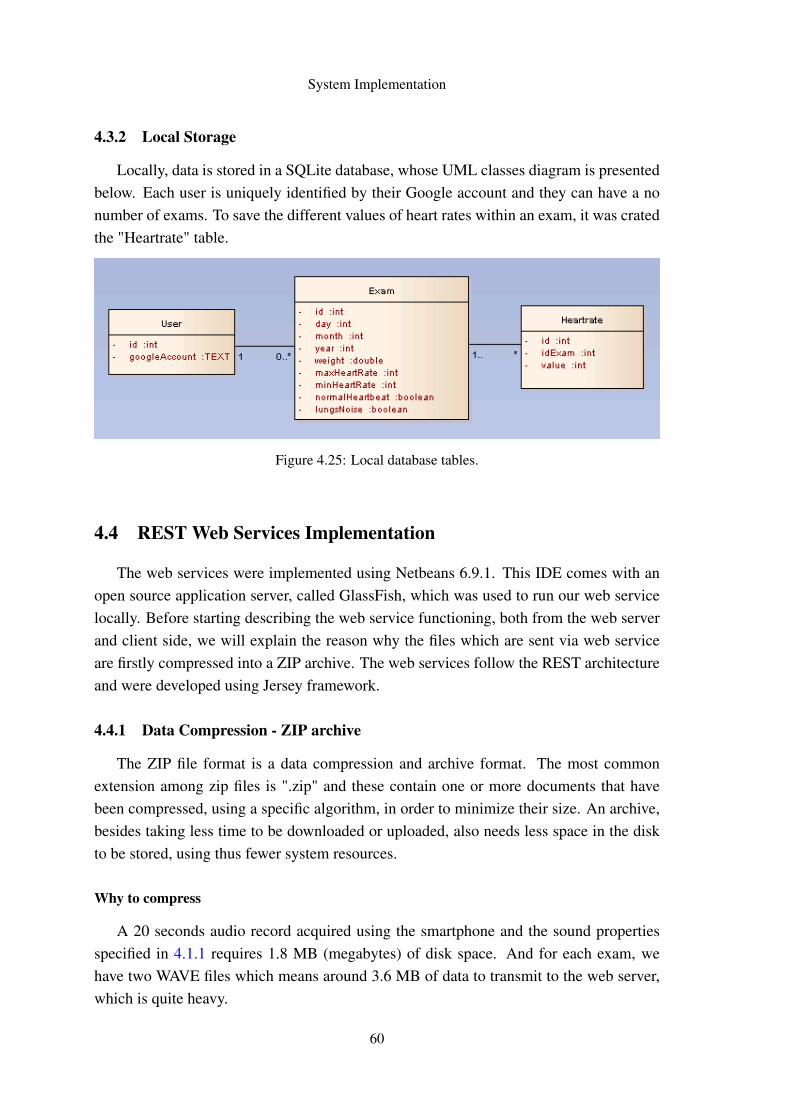
System Implementation
4.3.2 Local Storage
Locally, data is stored in a SQLite database, whose UML classes diagram is presentedbelow. Each user is uniquely identified by their Google account and they can have a nonumber of exams. To save the different values of heart rates within an exam, it was cratedthe "Heartrate" table.
Figure 4.25: Local database tables.
4.4 REST Web Services Implementation
The web services were implemented using Netbeans 6.9.1. This IDE comes with anopen source application server, called GlassFish, which was used to run our web servicelocally. Before starting describing the web service functioning, both from the web serverand client side, we will explain the reason why the files which are sent via web serviceare firstly compressed into a ZIP archive. The web services follow the REST architectureand were developed using Jersey framework.
4.4.1 Data Compression - ZIP archive
The ZIP file format is a data compression and archive format. The most commonextension among zip files is ".zip" and these contain one or more documents that havebeen compressed, using a specific algorithm, in order to minimize their size. An archive,besides taking less time to be downloaded or uploaded, also needs less space in the diskto be stored, using thus fewer system resources.
Why to compress
A 20 seconds audio record acquired using the smartphone and the sound propertiesspecified in 4.1.1 requires 1.8 MB (megabytes) of disk space. And for each exam, wehave two WAVE files which means around 3.6 MB of data to transmit to the web server,which is quite heavy.
60

System Implementation
After compression, the data size is reduced from 3.6 MB to 2.6 MB, approximately72% of the original size and thus we have a compression rate around 28%, which is quitesatisfactory.
Although the compression process means time-consuming, it will shorten the timeneeded to send the file in almost 1
3 and thus, it is worth. By shortening this time, wereduce the probability of data lost and components’ failures, and consecutively the overallfailure of the system (for instance, in case the Wi-Fi connection is lost in the middle ofthe transmission).
4.4.1.1 The logic flow
For an overall view of the system functioning, it is presented in Figure 4.26 a sequencediagram that models the logic flow within the system.
Figure 4.26: UML Sequence Diagram of the system.
61

System Implementation
4.4.2 Web Service Specification
Explained the reasons behind the compression of the files, we explain now the webservice implementation as well as its operating mode. Let us firstly consider the serverside, where it was implemented.
4.4.2.1 Web Server
For better understanding, few lines of code describing the web service behavior arepresented and explained below.
ff@POST@Path("test") @Consumes(MediaType.MULTIPART_FORM_DATA)@Produces("application/json")public String test(@FormDataParam("zipfile") File file,
@FormDataParam("zipfile") FormDataContentDisposition info,@Context ServletContext context)throws FileNotFoundException, IOException {
(...)Utils.decompressZipArchive(ofile.getAbsolutePath());Exam e = new Exam();DSP dsp = new DSP(oFile);
(...)Gson gson = new Gson();String result = gson.toJson(e);return result;
}The @POST annotation tells the web service that every time a client sends a request,
the web server should receive some additional data sent together in the request. It contrastswith the GET request, which just fetches data based on a URL.
The @Path annotation defines a relative path for the URI. In the web service above,the Java class will be hosted at the URI path /test. JAX-RS is particularly useful as itallows to embed variables in the URIs.
The @Consumes annotation specifies the MIME (Multipurpose Internet Mail Exten-sions) media types of representations the resource consumes (accepts). Therefore, theweb service will be only accepting MIME of the type MULTI_PART_FORM_DATA.
A multipart-form-data type, as the name suggests, consists of different parts. Thecontent of each part is specified in the header as a name-value pair, where the namedefines the field name within the form and the value is "form-data". The parts of the
62

System Implementation
multipart stream, i.e. the form fields, are sent in the order in which they occur within theform. In our web service, there is only one part: the ZIP archive.
The @Produces annotation specifies the MIME media types of representations theresource produces and sends back to the client. Our web service produces contents inJSON, as specified by the MIME type "application/json".
When a client sends a POST request, the web service starts by copying the receivedfile to the web server. Then, the ZIP archive is uncompressed and it is started the digi-tal signal processing of the WAV files, using the algorithms and techniques described insection 4.2. An instance of the object type Exam is created and assigned the resultingvalues from the sound files processing. The object is converted into a JSON string andthen returned by the web service.
The Exam consists of:
• A date in the form dd/mm/yy hh:mm:ss
• A list with the heartbeat rates captured during the auscultation
• The maximum value of heart rate detected
• The minimum value of heart rate detected
• The average value of heart rate
• An indicator the measures a possible completely deregulated functioning of theheart, regarding Atrial fibrilliation
• An indicator of the presence or absence of pathologic sounds in the breathing,specifically the crackles
The implemented REST service is:
• platform-independent (no matter the server is Unix, the client a Mac, etc);
• language-independent (C can talk to Java, etc.);
• based on the standards.
4.4.2.2 The client
From the client-side, a POST request in accordance with the specified in 4.4.2.1 issent to the web server. This is accomplished with few lines of code, as presented below.Some comments were included to explain the statements.
63

System Implementation
1 HttpClient httpclient = new DefaultHttpClient();
2 File file = new File("/data/data/com.hlmonitor/files/test.zip");
3
4 %Prepare request and response objects
5 HttpPost httppost = new ...
HttpPost(http://10.211.103.127:8080/RestService/Res/files/test);
6 HttpResponse response;
7
8 %Create multipart entity
9 MultipartEntity dataEntity = new MultipartEntity();
10
11 %Add the .zip Archive to multipart entity
12 dataEntity.addPart("zipfile", new FileBody(file, "application/zip"));
13 httppost.setEntity(dataEntity);
14
15 try {
16 %Execute the request
17 response = httpclient.execute(httppost);
18 %Get the response entity
19 HttpEntity entity = response.getEntity();
20 %Convert from stream to string
21 result = EntityUtils.toString(entity);
22 }
4.4.3 JSON
JSON stands for JavaScript Object Notation and it is a lightweight data-interchangeformat. As the noun self-suggests, it is based on JavaScript Programming Language andit is ideal for data exchange as it is completely language-independent, although it usessome conventions from object-oriented languages.
JSON is built on two structures: (1) a collection of name/value pairs (object, struct,hashtable, associative array) and (2) an ordered list of values (array, vector, list).
The JSON format is often used for serializing and transmitting structured data over anetwork connection. It is primarily used to transmit data between a server and web appli-cation, serving as an alternative to XML. Below is presented a JSON message returnedby the web service, which conforms with the JSON syntax that is shown in Figure 4.27.
{"heartrates":[76,75,76,76,76,75,76,76,76,75,76], "af":false,"crackles":false}
64

System Implementation
Figure 4.27: JSON syntax.2
4.5 Integration with Google Health
It was our intention to integrate our application with an online platform where it wouldbe possible to store and maintain health information. The options were very limited, theonly alternative capable of providing the same Google Health does, would be perhapsMicrosoft Health Vault, but it would require a license to work on it, so we decided forGH.
The device, after receiving the results of an exam from the web service, automaticallystarts sending them to GH so that they will be available online. But for this to be possible,the user must own a Google account, which is free to get, and must have it stored on themobile, on the AccountManager. The AccountManager provides access to a centralizedregistry of the user’s online accounts. All the user needs is to enter their credentials,username and password, once.
By doing it, they are granting applications access
to online resources with simple click approval
and they will not be asked in the future to re-
peatedly insert the credentials, since they will be
available on the device. The first time the ap-
plication will try to store the results in Google
Health, it will search for saved Google Accounts
on the device. If Google accounts are found, the
user will be asked to choose one from the list, like
is illustrated in Figure 4.28. Below it is presented
a small example of the syntax used to submit a
result of a test (in this case, weight).
Figure 4.28: Choosing an account to store data inGoogle Health.
It is a fragment of code, not the complete XML file, and conforms to GH API CCRReference. Part of the supported CCR elements are shown in Figure 4.29.
2 http://mql.freebaseapps.com/ch03.html
65
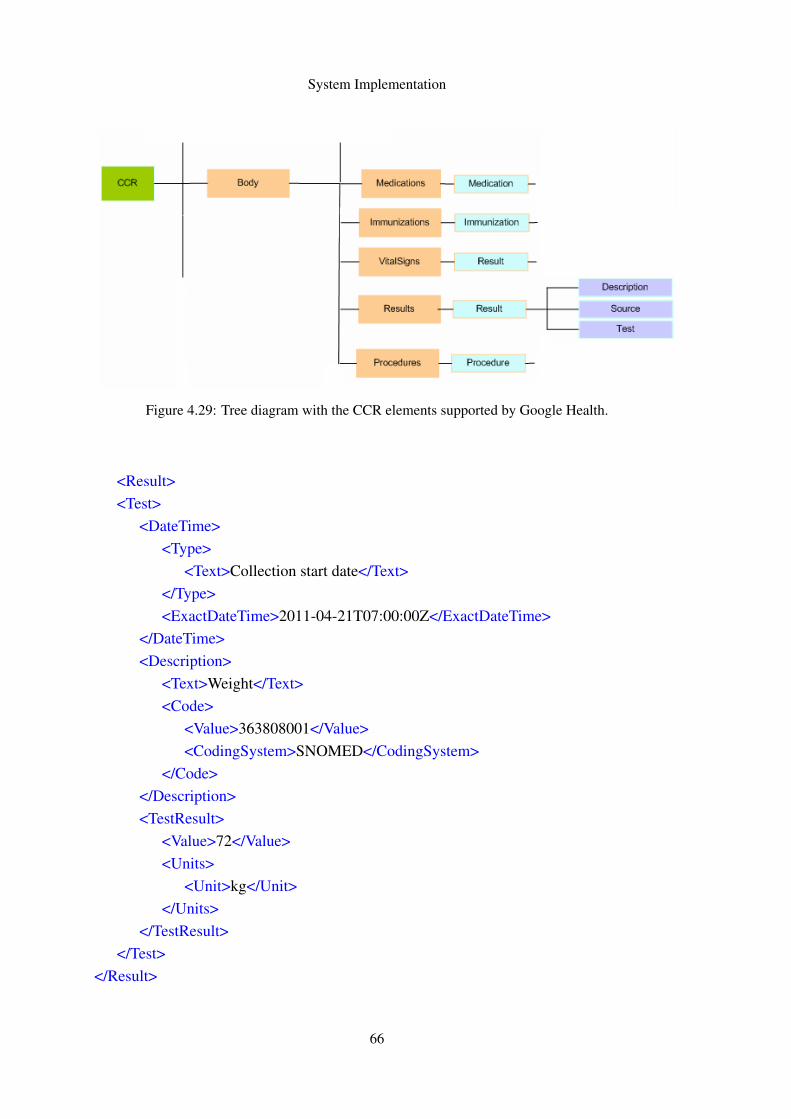
System Implementation
Figure 4.29: Tree diagram with the CCR elements supported by Google Health.
<Result><Test>
<DateTime><Type>
<Text>Collection start date</Text></Type><ExactDateTime>2011-04-21T07:00:00Z</ExactDateTime>
</DateTime><Description>
<Text>Weight</Text><Code>
<Value>363808001</Value><CodingSystem>SNOMED</CodingSystem>
</Code></Description><TestResult>
<Value>72</Value><Units>
<Unit>kg</Unit></Units>
</TestResult></Test>
</Result>
66

System Implementation
Two different screenshots were taken to Google Health platform, which are now pre-sented here. They evidence a table with heartbeats and a chart of weight progress respec-tively in 4.30 and 4.31. The data was sent from the smartphone and successfully sharedinto Google Health platform.
Figure 4.30: Google Health: Table with heart rates sent from the mobile.
Users can opt to share this information with others, who must also have Google ac-counts, and can stop doing it at any time. This is particular interesting for this project asit allows the users to share their medical information with their family doctor or whoeverthey want. This way, they will be continuously monitored by the healthcare professional,with regard to the major risk factors.
Figure 4.31: Weight progress tracking in Google Health.
67

System Implementation
Files
Google Health allows the import of health information and records from many healthproviders across the Web. A complete profile of a person’s health may include more thanjust what is currently possible to import or enter from medical records. Thinking on that,Google Health allows to upload files from a computer into the Google Health profile. Thedetails for the uploading are itemized below:
• Uploaded files are visible to the account owner when signed in, and to anyone elsethis person has shared the profile with;
• The maximum file size for upload is set to 4MB;
• Each person (considering one account) can upload a maximum of 100MB.
However, the health API does not support this feature yet . It was intended to createsomething like a report with more complete information about the results of the exam(including charts) and share it with to the healthcare professional, which was not possiblefor now to include it in the project due to this API limitation.
68

Chapter 5
Tests and Results
This Chapter presents some tests carried out and the results obtained. Software testingis very important and its impact on software cannot be underestimated. It is fundamentalto ensure quality assurance and represents a review of specification, design and coding.
5.1 Algorithms Testing
The DSP algorithms were initially tested using a relatively small data set of samplescollected over the Internet, which was composed by 25 WAVE files. This set includedsamples of normal heartbeat, atrial fibrillation, normal breath sounds and crackles in thelungs.
The quality of these sound files is good (few noise), and they offered us a way tohave the algorithms reasonably tested before trying them in real life. The data set wascontinuously used to improve the algorithms robustness. They were tested one by oneand the results were very satisfactory. Regarding the heart sounds, normal and healthyheart sounds were well differentiated from atrial fibrillation characteristic sounds. Andin all them, the heartbeat rate was apparently well measured. About the lung sounds, theimplemented algorithm was able to detect when there were present crackling murmursand when there were not. Therefore, for this data set, we got 100% of success rate.
Later on, the same algorithms were tested using real samples captured by an Androiddevice, using the stethoscope and our application for recording. The tests took place atFraunhofer AICOS facilities, in a very silent place. It was asked the collaboration of 20people. The testing only allowed to truly validate the heartbeat rate measurement, since itwas not possible to confirm whereas the remaining results were correct or not - we did nothave information regarding the examinees’ medical status. For the heartbeat, it was askedanother collaborator to place his index and ring fingers on the wrist of the examinee,at the base of the thumb, just over the radial artery which runs on the anterior part ofthe forearm. Each time the heart beats it is created a wave of pressure, as blood flows
69

Tests and Results
along the arteries. In areas where these arteries lie closest to the surface, this pressurecan be felt and it is called pulse. This is a simple method that allows to measure theheart rate, without any special equipment and it is frequently used by doctors. Duringthe recording the collaborator was responsible for counting the number of times he couldfeel the pulse. That number was then compared with the actual peaks number present onthe time-domain representation of the signal, allowing us to know if the sounds were wellrecorded and enough clear after the filtering process. Finally the heart rate calculatedby the algorithm was compared with these two values we have just talked, in order tomeasure the degree of reliability.
From the 20 tests, 90% (18/20) revealed positive results. The average beat rate wascovered by the typical heartbeat range found in a normal resting pulse of an adult, whichis from 60 to 100 beats per minute. Some sporadic errors were detected in the calculationof instantaneous beat rates, i.e, considering the elapsed time between two consecutivebeats, and which are not caused by any unexpected behavior of in the algorithm. Rather,they are due to the poor quality of the stethoscope, that adds a lot of noise to the record-ing (sometimes even non-existent noise on the room, originated on the appliance itself).Occasionally this noise is graphically reflected in a peak very similar to the ones causedby a hear beat, both in frequency and amplitude, making it hard to be ignored.
Unfortunately it was not possible to get the algorithms medically validated. It is farmore complicated than it might seem, there are a lot of ethical issues that must be com-bined and also some bureaucracy that needs to be overcame. Anyway, it is expected thatin a near future this will become a reality.
5.2 Google Health Integration Testing
Google Health offers a developer’s sandbox called H9, which was used to performtests. H9 exists precisely for testing, so we do not need to worry about the quality ofthe data we send there, since we will be only "spamming" our, lets call, testing accountinstead of our real Google Health account. This one will be still "clean" and safe.
All that is needed to use the sandbox is to have a normal Google account, so westarted by adding two existing ones to the Account Manager of the smartphone. Then,a simple stand-alone application was created with the intuit of learning how to send andget existing data on Google Health from an Android device. After having managed to doit, the required functionalities were implemented and then transferred to the main mobileapplication. For sending and retrieving information, the use of asynchronous threads waspreferred, avoiding the block of the screen while the task is running. Four different testswere performed to verify the correct synchronization between the device and H9:
• Add a new test on the device;
70

Tests and Results
• Delete a test on the device;
• Add a new test on H9;
• Delete a test on H9.
5.3 Graphical User Interface
Concerning the GUI design, no tests were conducted with elderly. However, Human-Computer Interaction Department from FhP has given some recommendations and guide-lines on the topic which were followed targeting the continuous enhancement of the userinterface, both in terms of its usability and visual appearance. Some of these tips areenumerated below.
• Provide good contrast between text and background;
• Use a consistent color coding;
• Place the main information in the middle of the screen;
• Sufficient lighting;
• Choose colors that prevent glare;
• Make certain that text has the size and dimensions in relation to reading distanceand light;
• Use simple, plain words in an understandable language;
• Relegate to second plan tasks that the user does not need to see;
• Avoid popups abuse;
• Use of icons associated with the underlying text;
• Use of textual guidelines;
• Use of tutorial media.
5.4 Integration and System Testing
At the end, all components were integrated into a complete final system, and sometests were conducted on it to evaluate the system’s compliance with the requirementsspecified in Section 3.2. The purpose of these integration tests were to detect any incon-sistencies between the software components that were joined together or between any ofthe units and the hardware.
71

Tests and Results
To conclude the testing, the application was used and tested several times, by differentusers, and everything showed up to be working properly. All functionalities of the systemwere tested and validated.
5.5 DSP benchmarking
Some benchmarking tests were performed in order to evaluate the Fourier Transformcomputation, which is highly computationally demanding and, thus, the most significantslice of the DSP.
Initially, it was used the Apache Commons Math (ACM) library, which is a completeand well maintained math library. With respect to the Fast Fourier Transform, this librarywas not satisfactory enough since the calculation speed is limited by implementation rea-sons, such as the use of objects to represent complex numbers.
Later on, when the project was well underway, some effort was spent trying to improvethe computation speed. This was achieved with the multi-threaded JTransforms library,which is supposed to be nearly as fast as the C library FFTW. The necessary changes weremade and the results were incredibly good.
Below, in Table 5.1, are shown the results obtained of the comparison of the two FFTlibraries JTransforms and ACM. For each one, there were performed 500 runs. This wasconducted on a Quad-Core laptop machine running Mac OS X 10.6.7. The arrays werefilled with random data.
Table 5.1: Average execution time (in milliseconds) for 1D complex forward FFT (powers of two).
Input size JTransforms Apache CM Factor by which(ms/run) (ms/run) JTransforms is faster
216 2,737 78,870 28,816217 3,683 205,274 55,736218 7,355 741,955 100,878219 13,883 2871,046 206,803220 29,932 Out of memory —
ACM is well over an order of magnitude slower than JTransforms. The only advantageto using ACM for FFTs is that the rest of the library comes with it, reason why it wasdeprecated.
72
Chapter 6
Conclusions
This chapter presents some conclusions about this project and the environment inwhich it operates and assesses the potential areas of future development. The overallimportance and contribution given with this project is handled first. Then, the continuousmove to smaller, portable and low-power devices is discussed. Finally, different areas forfuture studies are suggested.
The continuous progresses in technology are delivering new portable systems everyday. The devices tend to be smaller and lighter but they offer nearly the same com-putational capabilities as the non-portable ones. And even when they do not provideenough computational resources, they do provide wireless technology allowing to per-form a specific task anywhere else rather than in the phone itself. The use of these devicesin telemedicine is not something new, it has been used for a couple of years, althoughtheir computing power and size were very limiting. But nowadays, with the introductionof portable devices like smartphones and tablets, systems designers are able to deliversystems that would be unimaginable a short time ago. And the great thing is that thesedevices are moving towards to be wearable, to have the shape and weight of a necklace,for instance.
Mobile health is playing an important role in the future of health supervision and willcontinue to do it. A lot of effort concerning the individuals’ health is currently beingdevoted to ensure that a wide range of issues are all done virtually over the phone. Specif-ically on this project, we sought to give a small contribution on that direction, making amobile device able to auscultate the human’s heart and lung functions and detect someimportant pathologies like atrial fibrillation and lungs crackling.
Now that the dissertation is finished, the overall balance of the work done is positive.The feeling is of accomplishment, we combined science with low-cost technology to de-velop a system that can be extremely important in prevention of heart failure and strokes,which are major causes of death in Portugal and in the world. This prevention will bepossible by early diagnosis and will have greater relevance among the elderly, who are
73

Conclusions
obviously more exposed to the risks.
With an Android smartphone and a low-cost stethoscope, people are able to track theirheart and lung conditions without needing to go to the doctor. This device makes uses Wi-Fi connectivity in order to send the signal and process it remotely. The idea is that peoplewill perform daily tests and that their doctor will be access the exam results. For now, thisis done using Google Health, whose API is still a bit limited but we expect it to satisfy ourneeds in a near future. The idea of having every individual’s medical data on a securedcentral data system is extremely interesting. By keeping a history of medical records andmaking them available from anywhere, we provide a major contribution to all healthcareprofessionals, including doctors, since we simplify their work, specially in countries orplaces where the doctor to patient ratio is astoundingly low. Being able to get the entiremedical history of a specific patient on their phone by just hitting a simple tab on thescreen of the device would be a huge step forward in health care, and it would surely bewelcome by the professionals on this area. Besides saving a lot of time, it also gets rid ofall the paper work that it still involves nowadays.
We have tested the system with small data sets and the results were quite positive.However, with respect to crackles and atrial fibrillation detection, it was not possible totest the system in real, since we need "sick" people apart from the healthy ones that are atour disposal. We were unable to have access to patients diagnosed with these pathologies,so it lacks of medical validation, that we hope it will be possible in the future.
6.1 State of the project
In the beginning, there was the hope that the work accomplished in this thesis couldbe a first step towards a general purpose m-health system, and we will now describe theprogress made towards this goal.
Concluded the thesis, it is now possible to capture heart and lung sounds with an An-droid device and filter important information about the individual’s health status, specifi-cally regarding causes of Heart Failure, which is responsible for thousands of deaths everyyear. The developed system differentiates a normal heart functioning from a completelyderegulated one, which characterizes Atrial Fibrillation. Also crackling murmurs can bedetected by the device, when listening to the lungs. In addition, the heartbeat is measuredand included in the exam information, along with the weight of the individual that must beintroduced by himself. It also allows to graphically visualize the evolution of the weightfor a period of time.
This information is saved in Google Health’s cloud, allowing its share with other ap-plications. It is possible for the healthcare professionals to access this information, afterthe patient grants him the necessary permission.
74
Conclusions
6.2 Future work
In this section, there are presented some suggestions for future research directions thatcould provide the next steps along the path to a practical and widely applicable system.
Future work related to this project inevitably involves investigating other pathologiesthat can be detected through the auscultation method, and which can have serious conse-quences for the individual’s health, if not diagnosed in time. A number of open problems(regarding other pathologies) must be solved to allow the development of a truly generalpurpose prevention system. And such a diversity of problems that can affect the car-diopulmonary functioning implies a variety of research directions that need to be pursuedto make such a system feasible. Depending on the motivation and effort engaged on it,we might be talking about a great piece of research that may last for several years.
Apart from the scientific component of the project, also the mobile application can beenriched and provided with other features. Particularly, it would be important to make itpossible for the user to listen to the sounds/murmurs in real-time with reasonably goodquality, so that it will be easier for him to know the best place to make the stethoscopetouch the skin and thus get the best record for examination. Another good idea wouldbe to change the way the individual’s weight is introduced in the system. It would be farmore interesting and practical to gather the information directly from the weighing scale,rather than asking the person to type it. To do so, we could use Bluetooth technology.
From the perspective of the development of a real-time collaborative system, it mightbe also challenging to add audio and video streaming capabilities, allowing the doctor toexamine in real-time, from his home or office, his patient, who would have not to standfrom his comfortable couch. And not few times, the doctors need more information thatwhat they listen to can offer them. What the patient feels, what he has been doing, if ishas been taking the medicines as prescribed or not, etc., is also very important. And so,this condition would be satisfied with such feature.
75

Conclusions
76

References
[app] Apple application submission feedback. http://appreview.tumblr.com/. Accessed on June 15, 2011.
[ASF08a] Dennis L. Kasper Stephen L. Hauser Dan L. Longo J. Larry JamesonJoseph Loscalzo Anthony S. Fauci, Eugene Braunwald, editor. Harrison’sPrinciples of Internal Medicine, chapter 34. The McGraw-Hill Companies,17 edition, 2008.
[ASF08b] Dennis L. Kasper Stephen L. Hauser Dan L. Longo J. Larry JamesonJoseph Loscalzo Anthony S. Fauci, Eugene Braunwald, editor. Harrison’sPrinciples of Internal Medicine, chapter 13. The McGraw-Hill Companies,17 edition, 2008.
[ASF08c] Dennis L. Kasper Stephen L. Hauser Dan L. Longo J. Larry JamesonJoseph Loscalzo Anthony S. Fauci, Eugene Braunwald, editor. Harrison’sPrinciples of Internal Medicine, chapter 245. The McGraw-Hill Companies,17 edition, 2008.
[ASF08d] Dennis L. Kasper Stephen L. Hauser Dan L. Longo J. Larry JamesonJoseph Loscalzo Anthony S. Fauci, Eugene Braunwald, editor. Harrison’sPrinciples of Internal Medicine, chapter e8. The McGraw-Hill Companies,17 edition, 2008.
[BDI09] National Heart Blood, Lung Institute Diseases, and Conditions Index. Whatis atrial fibrillation? http://www.nhlbi.nih.gov/health/dci/Diseases/af/af_what.html, 2009. Accessed on June 10, 2011.
[Ben] Peter J Bentley. istethoscope. http://www.peterjbentley.com/istethoscope.html. Accessed on June 10, 2011.
[BJ03] Gerstenblith G et al Braunstein JB, Anderson GF. Non-cardiac comorbidityincreases preventable hospitalizations and mortality among Medicare ben-eficiaries with chronic heart failure. Journal of the American College ofCardiology, 42:1226–1233, 2003.
[BMA+10] Daniel Bonhorst, Miguel Mendes, Pedro Adragao, João de Sousa, JoãoPrimo Eva Leiria, and Pedro Rocha. Prevalência de fibrilhação auricularna população portuguesa com 40 ou mais anos. -estudo fama. Revista por-tuguesa de cardiologia, 29(3):331–350, 2010.
[Bri88] E. Brigham. The Fast Fourier Transform and Its Applications. Prentice Hall,Englewood Cliffs, 1988.
77
REFERENCES
[Bur09] Ed Burnette. Hello, Android. Pragmatic Bookshelf, 2 edition, 2009.
[Cro10] Dr. Bill Crounse. Mobile devices usher in new era in healthcare delivery,2010.
[CS06] Jones JK et al Curkendall SM, DeLuise J. Cardiovascular disease in patientswith chronic obstructive pulmonary disease, Saskatchewan Canada cardio-vascular disease in COPD patients. Annals of Epidemiology, 16:63–70, 2006.
[dA05] A. Teles de Araújo. Relatório do observatório nacional das doenças respi-ratórias. Observatório Nacional das doenças respiratórias, 2005.
[dA06] A. Teles de Araújo. Relatório do observatório nacional das doenças respi-ratórias. Observatório Nacional das doenças respiratórias, 2006.
[dA07] A. Teles de Araújo. Relatório do observatório nacional das doenças respi-ratórias. Observatório Nacional das doenças respiratórias, 2007.
[dA08] A. Teles de Araújo. Relatório do observatório nacional das doenças respi-ratórias. Observatório Nacional das doenças respiratórias, 2008.
[Erl04] Thomas Erl. Service-Oriented Architecture: A Field Guide to IntegratingXML and Web Services. Prentice Hall PTR Upper Saddle River, NJ, USA,2004.
[FCM03] Gustavo Alonso Fabio Casati, Harumi Kuno and Vijay Machiraju. Web Ser-vices: Concepts, Architectures and Applications. Springer Verlag, 2003.
[GOL06] GOLD. Global Initiative for Chronic Obstructive Lung Disease. Global strat-egy for the diagnosis, management and prevention of chronic obstructivepulmonary disease: NHLBI/WHO workshop report. 2006.
[HE02] Westfall KA et al Havranek EP, Masondi FA. Spectrum of heart failure inolder patients: results from National Heart Failure project. American HeartJournal, 143:412–417, 2002.
[ins] Instant heart rate official website. http://www.instantheartrate.com/. Accessed on June 10, 2011.
[Ist04] R. Istepanian. Non-telephone healthcare: The role of 4g and emerging mo-bile systems for future m-health systems. IOS PRESS, 2004. Medical andCare Compunentics.
[Kes03] Walt Kester. Mixed-Signal and Dsp Design Techniques. Newnes, OxfordEngland, 2003.
[Mah05] Qusay H. Mahmoud. Service-oriented architecture (soa) and webservices: The road to enterprise application integration (eai).http://www.oracle.com/technetwork/articles/javase/soa-142870.html, 2005. Accessed on January 21, 2011.
78

REFERENCES
[MBG+06] Y. Miyasaka, M.E. Barnes, B.J. Gersh, S.S. Cha, K.R. Bailey, W.P. Abha-yaratna, J.B. Seward, and T.S.M. Tsang. Secular trends in incidence of atrialfibrillation in olmsted county, minnesota, 1980 to 2000, and implications onthe projections for future prevalence. Circulation, 114(2):119–25, 2006.
[Mei08] Reto Meier. Professional Android Application Development. Wrox PressLtd. Birmingham, UK, UK, 2008.
[MP03] Nowak RM et al McCullough PA, Hollander JE. Uncovering heart failurein patients with a history of pulmonary disease: rationale for the early useof Btype natriuretic peptide in the emergency department. Academic Emer-gency Medicine, 10:198–204, 2003.
[New10] Midlands Business News. Healthcare conference spotlights importance ofmobile technologies, 2010.
[NMJP09] Hawkins NM, Petrie MC, and et al Jhund PS. Heart failure and chronic ob-structive pulmonary disease: diagnostic pitfalls and epidemiology. EuropeanJournal of Heart Failure, 11:130–139, 2009.
[oCoEoC] Networks of Centres of Excellence of Canada. Meeting global de-mand for mobile device applications. http://www.nce-rce.gc.ca/ReportsPublications-RapportsPublications/ExcelleNCENewsletter-BulletinExcellence/v1_i3/MobileDevice-AppareilsMobiles_eng.asp. Accessed on June 10,2011.
[PL07] Valerie Gay Peter Leijdekkers. Personal heart monitoring and rehabilitationsystem using smart phones. Technical report, Faculty of IT, University ofTechnology Sydney, 2007.
[PM08] LeJemtel TH Padeletti M, Jelic S. Coexistent chronic obstructive pulmonarydisease and heart failure in the elderly. International Journal of Cardiology,125:298–215, 2008.
[PSRD10] Sergio L. Netto Paulo S. R. Diniz, Eduardo A. B. da Silva. Digital SignalProcessing: System Analysis and Design. Cambridge University Press, 2edition, 2010.
[RC07] Arthur Ryman Sanjiva Weerawarana Roberto Chinnici, Jean-Jacques Moreau. Web services description language (wsdl) version2.0 part 1: Core language. http://www.w3.org/TR/wsdl20/, 2007.Accessed on January 25, 2011.
[RHI06] Constantinos S. Pattichis Robert H. Istepanian, Swamy Laxminarayan. Re-mote monitoring for healthcare and for safety in extreme environments.Technical report, Centre for Telematics and Information Technology/Facultyof Electrical Engineering, Mathematics and Computer Science, Universityof Twente„ 2006.
[SM] Indra Pratap Singh Saroj Mishra. mhealth: A developing country perspec-tive. Publication Date: August 9, 2008.
79

REFERENCES
[Smi97a] Steven W. Smith. The Scientist and Engineer’s Guide to Digital Signal Pro-cessing 2nd Edition, chapter 3. California Technical Publishing, 1997.
[Smi97b] Steven W. Smith. The Scientist and Engineer’s Guide to Digital Signal Pro-cessing 2nd Edition, chapter 12. California Technical Publishing, 1997.
[Smi97c] Steven W. Smith. The Scientist and Engineer’s Guide to Digital Signal Pro-cessing 2nd Edition, chapter 12. California Technical Publishing, 1997.
[SMW+04] S Stewart, N Murphy, A Walker, A McGuire, and JJV McMurray. Cost ofan emerging epidemic: an economic analysis of atrial fibrillation in the uk.Heart, 90:286–292, 2004.
[uni07] Compendium of ICT Applications on Electronic Government, volume 1: Mo-bile Applications on Health and Learning. United Nations, 2007.
[vdL95] Marten Derk van der Laan. Signal sampling techniques for data acquisitionin process control. Master’s thesis, Universiteitsdrukkerij Groningen, 1995.
[W3S] W3Schools. Web services tutorial. http://www.w3schools.com/webservices/default.asp. Accessed on January 20, 2011.
80