Philosophy, Performance and Direction
33
Philosophy, Performance and Direction JPMorgan Investor Conference JPMorgan Investor Conference Edinburgh October 2009 October 2009
Transcript of Philosophy, Performance and Direction
Philosophy, Performance and Direction
JPMorgan Investor ConferenceJPMorgan Investor ConferenceEdinburghOctober 2009October 2009

DisclaimerThis presentation has been prepared by Wesfarmers Limited. The information contained in this presentation is for information purposes only and does not constitute an offer to issue or arrange to issue, securities or other financial products, nor is it intended to constitute legal, tax or accounting advice or opinion. The information contained in this presentation is not investment orfinancial product advice and is not intended to be used as the basis for making an investment decision This presentation hasfinancial product advice and is not intended to be used as the basis for making an investment decision. This presentation hasbeen prepared without taking into account the investment objectives, financial situation or particular needs of any particular person.
No representation or warranty, express or implied, is made as to the fairness, accuracy, completeness or correctness of the information, opinions and conclusions contained in this presentation. To the maximum extent permitted by law, none of Wesfarmers Limited, its directors, employees or agents, nor any other person accepts any liability, including, without limitation, any liability arising out of fault or negligence, for any loss arising from the use of the information contained in this presentation. In particular no representation or warranty express or implied is given as to the accuracy completeness likelihood of achievementparticular, no representation or warranty, express or implied, is given as to the accuracy, completeness, likelihood of achievement or reasonableness of any forecasts, prospects or returns contained in this presentation and Wesfarmers Limited disclaims any liability for any omissions or mistakes in the aforementioned information. Such forecasts, prospects or returns are by their nature subject to significant uncertainties and contingencies, many of which will be outside the control of Wesfarmers Limited.
Before making an investment decision, your should conduct your own due diligence and consult with your own legal, tax or accounting adviser as to the accuracy and application of the information set forth herein. You should also obtain and rely onprofessional advice from your own tax, legal, accounting and other professional advisers in respect of your particular investment needs, objectives and financial circumstances. Past performance is no guarantee of future performance.
This presentation is not an offer of securities for sale in the United States or any other jurisdiction in which an offer may not be made under applicable laws. Securities may not be offered or sold in the United States unless the securities have been registered
2
made under applicable laws. Securities may not be offered or sold in the United States unless the securities have been registered under the U.S. Securities Act of 1933 (“Securities Act”) or an exemption from registration is available. The shares to be issued in the scheme will not be registered under the Securities Act.
Philosophy Based On A Single FocusPhilosophy Based On A Single Focus
Satisfactory Returns To Shareholders Satisfactory Returns To Shareholders

Long-term consistent strategiesLong term, consistent strategies
MANAGING BALANCE SHEET EFFECTIVELY
4
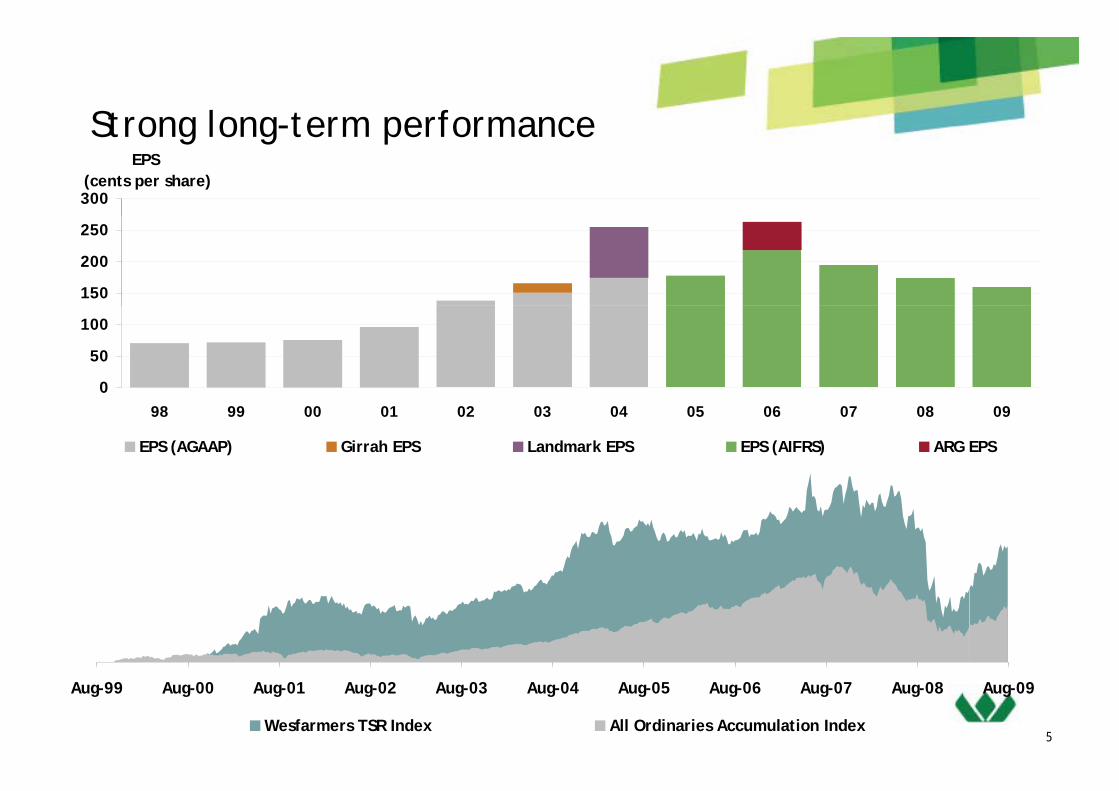
Strong long-term performanceStrong long-term performance
300
EPS (cents per share)
150
200
250
0
50
100
98 99 00 01 02 03 04 05 06 07 08 09
EPS (AGAAP) Girrah EPS Landmark EPS EPS (AIFRS) ARG EPS
5
Aug-99 Aug-00 Aug-01 Aug-02 Aug-03 Aug-04 Aug-05 Aug-06 Aug-07 Aug-08 Aug-09
Wesfarmers TSR Index All Ordinaries Accumulation Index
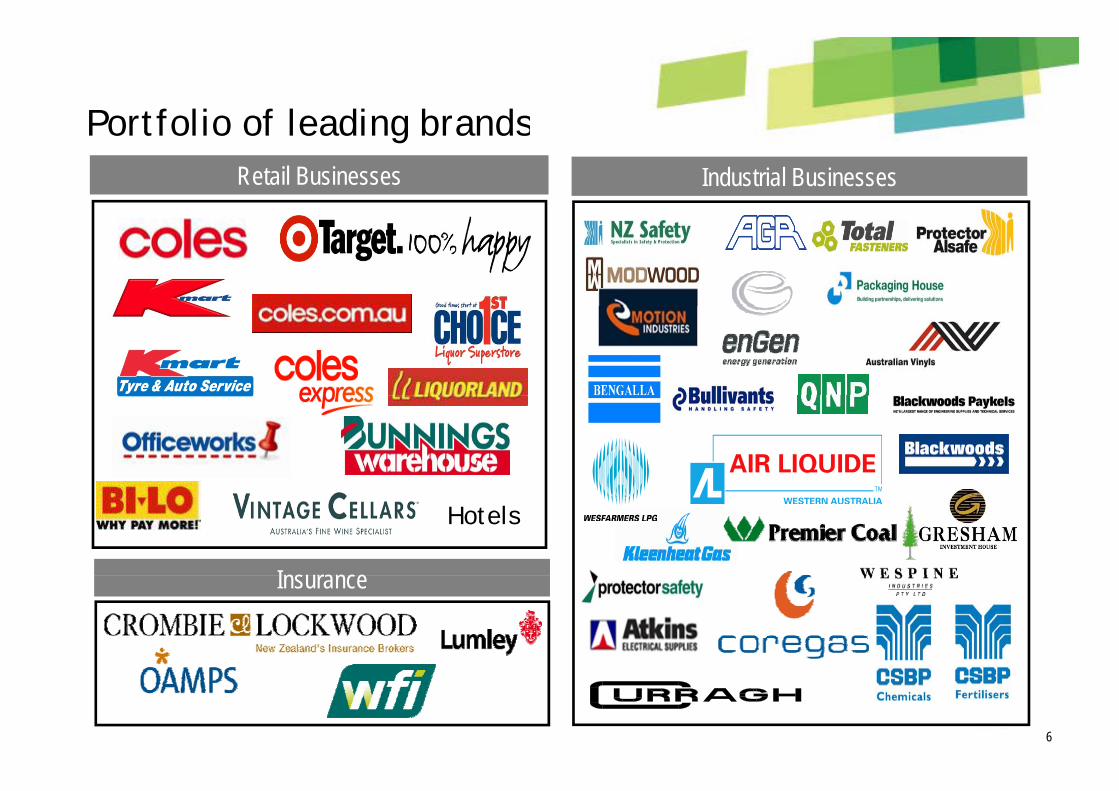
Portfolio of leading brandsPortfolio of leading brandsRetail Businesses Industrial Businesses
Ins rance
Hotels
Insurance
6

Management TeamManagement TeamManaging Director Richard Goyder
Fi Di t T BFinance Director Terry Bowen
Divisional Managing Directors
Home Improvement & Office Supplies John GillamHome Improvement & Office Supplies John Gillam
Coles Ian McLeod
T L ITarget Launa Inman
Kmart Guy Russo
Insurance Rob Scott
Chemicals & Fertilisers Ian Hansen
Resources Stewart Butel
Industrial & Safety Olivier Chretien
7
Energy Tom O’Leary
Group ResultsGroup Results
Group Performance HighlightsGroup Performance Highlights
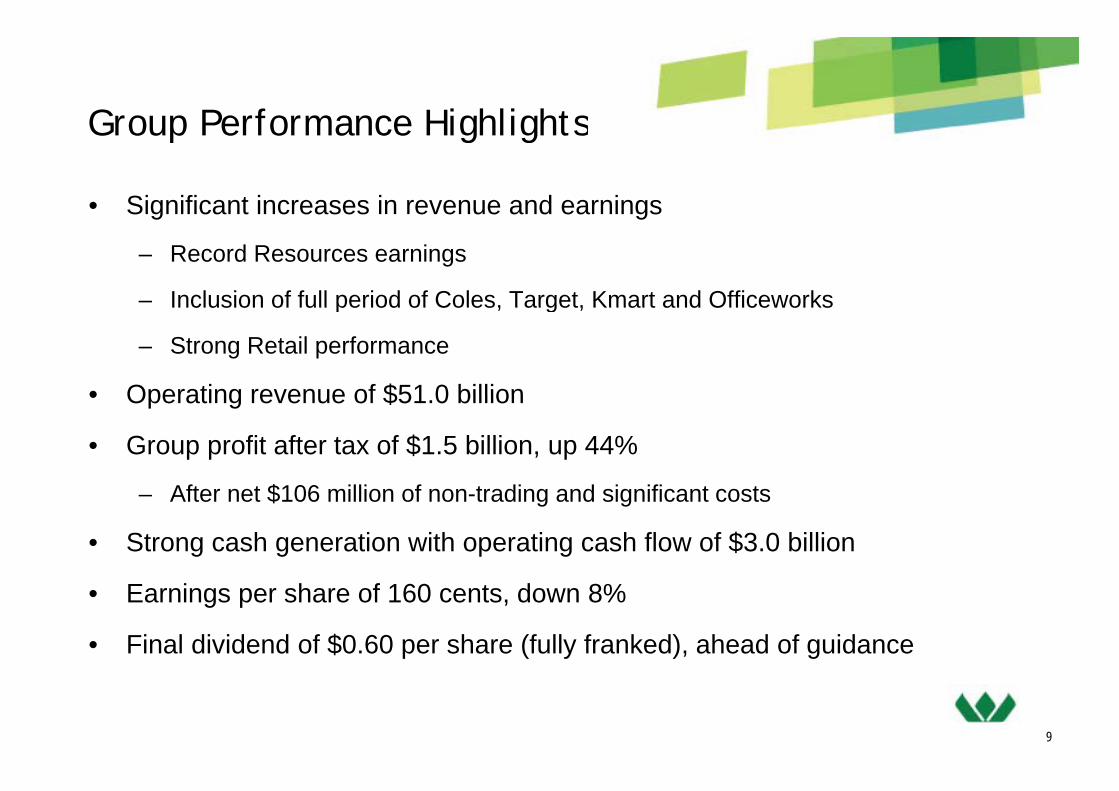
• Significant increases in revenue and earningsg g
– Record Resources earnings
– Inclusion of full period of Coles, Target, Kmart and OfficeworksInclusion of full period of Coles, Target, Kmart and Officeworks
– Strong Retail performance
• Operating revenue of $51 0 billion• Operating revenue of $51.0 billion
• Group profit after tax of $1.5 billion, up 44%
Aft t $106 illi f t di d i ifi t t– After net $106 million of non-trading and significant costs
• Strong cash generation with operating cash flow of $3.0 billion
• Earnings per share of 160 cents, down 8%
• Final dividend of $0.60 per share (fully franked), ahead of guidance
9

Group Performance Highlights (cont)Group Performance Highlights (cont)
• Coles turnaround continues to meet Wesfarmers’ expectationsp
• Bunnings and Target delivered strong performances
• Officeworks and Kmart transformations progressing well• Officeworks and Kmart transformations progressing well
– Kmart still at an early stage
R d R d ti d l• Record Resources production and sales
• Other Industrial and Insurance divisions impacted by external factors and a slowing economy
• Balance sheet strengthened with closing Net Debt to Equity of 18.3%
10
Group Performance SummaryGroup Performance Summary
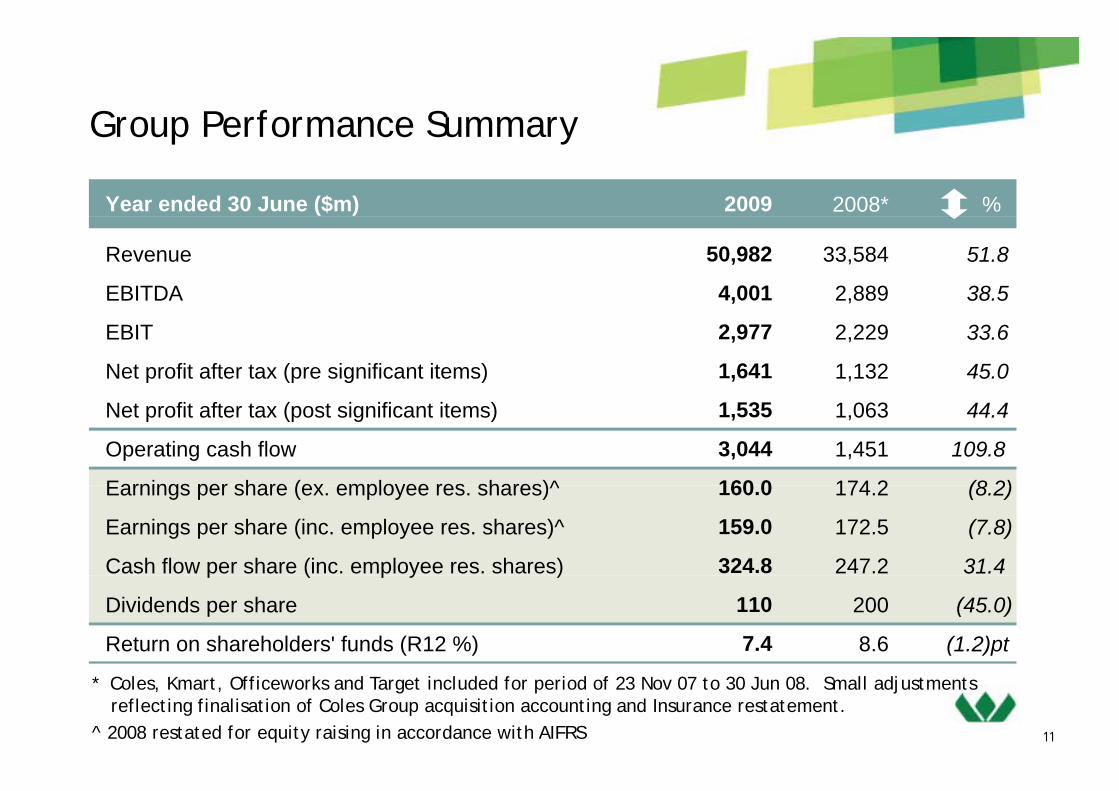
Year ended 30 June ($m) 2009 2008* %
Revenue 50,982 33,584 51.8
EBITDA 4,001 2,889 38.5
EBIT 2,977 2,229 33.6
Net profit after tax (pre significant items) 1,641 1,132 45.0
Net profit after tax (post significant items) 1,535 1,063 44.4
Operating cash flow 3,044 1,451 109.8
Earnings per share (ex employee res shares)^ 160 0 174 2 (8 2)Earnings per share (ex. employee res. shares)^ 160.0 174.2 (8.2)
Earnings per share (inc. employee res. shares)^ 159.0 172.5 (7.8)
Cash flow per share (inc. employee res. shares) 324.8 247.2 31.4 p ( p y )
Dividends per share 110 200 (45.0)
Return on shareholders' funds (R12 %) 7.4 8.6 (1.2)pt
11
* Coles, Kmart, Officeworks and Target included for period of 23 Nov 07 to 30 Jun 08. Small adjustments reflecting finalisation of Coles Group acquisition accounting and Insurance restatement.
^ 2008 restated for equity raising in accordance with AIFRS
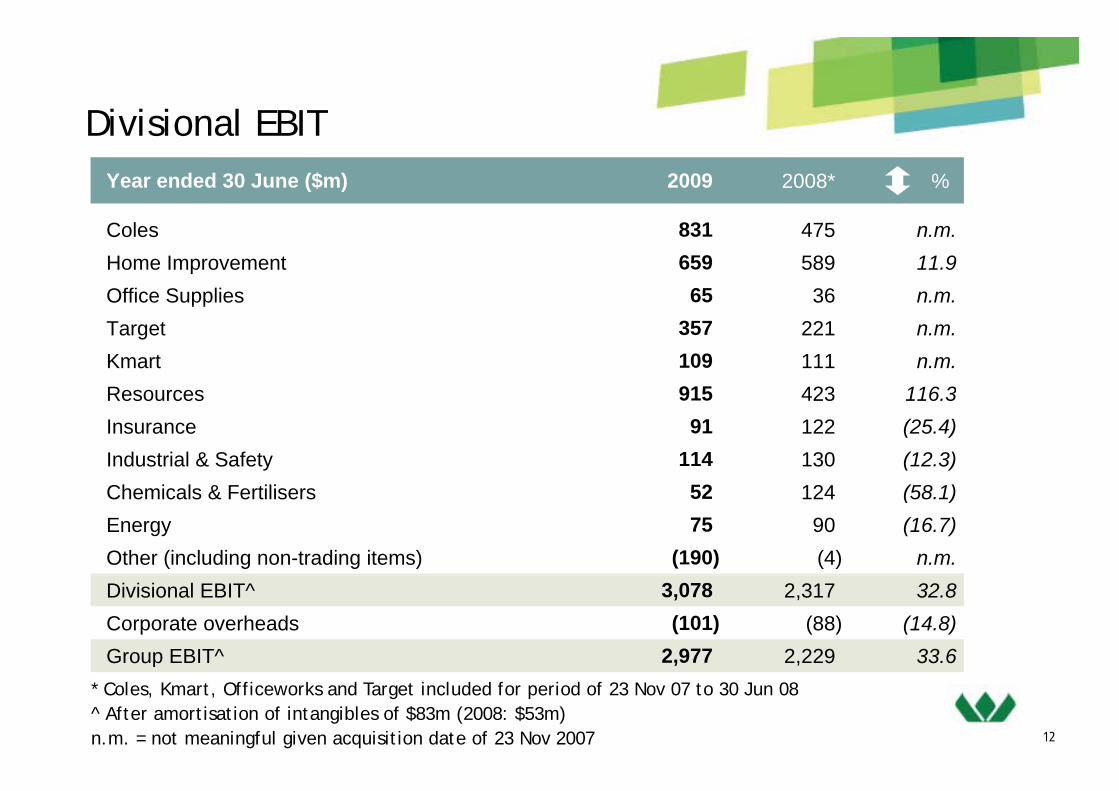
Divisional EBITDivisional EBITYear ended 30 June ($m) 2009 2008* %
Coles 831 475 n.m.Home Improvement 659 589 11.9Office Supplies 65 36 n.m.ppTarget 357 221 n.m.Kmart 109 111 n.m.Resources 915 423 116 3Resources 915 423 116.3Insurance 91 122 (25.4)Industrial & Safety 114 130 (12.3)Ch i l & F tili 52 124 (58 1)Chemicals & Fertilisers 52 124 (58.1)Energy 75 90 (16.7)Other (including non-trading items) (190) (4) n.m.Divisional EBIT^ 3,078 2,317 32.8Corporate overheads (101) (88) (14.8)Group EBIT^ 2,977 2,229 33.6
12
* Coles, Kmart, Officeworks and Target included for period of 23 Nov 07 to 30 Jun 08^ After amortisation of intangibles of $83m (2008: $53m)n.m. = not meaningful given acquisition date of 23 Nov 2007
p , ,
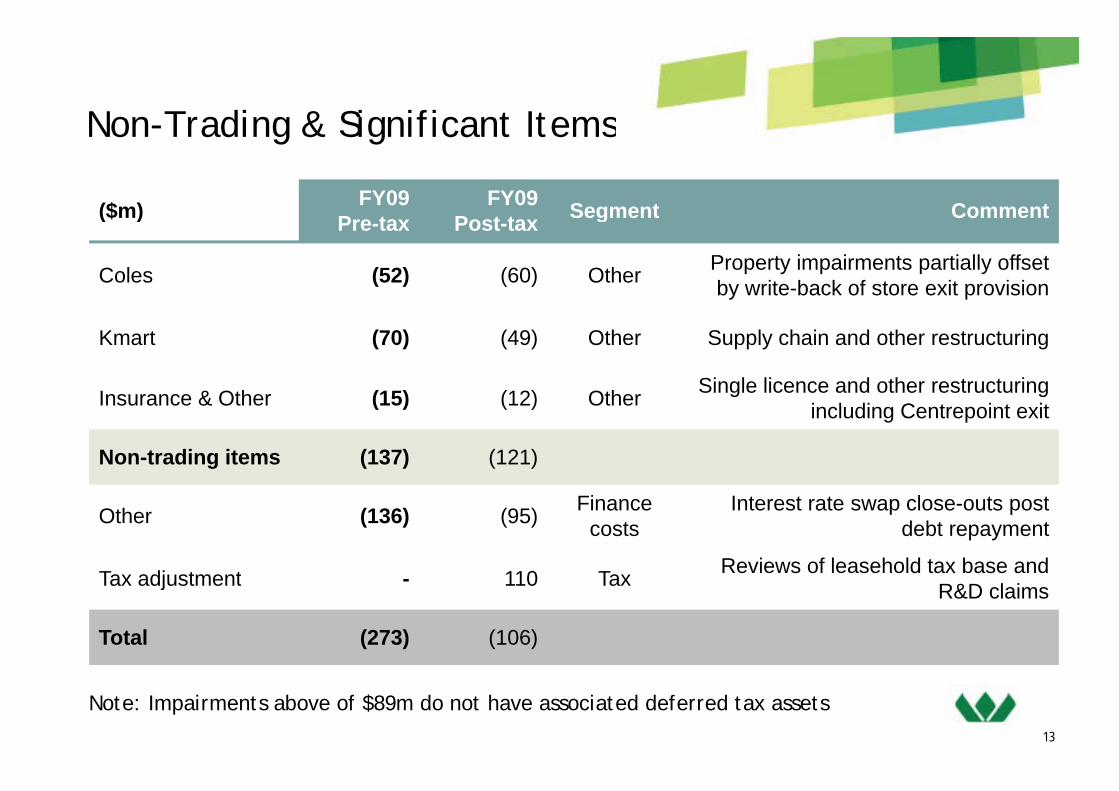
Non-Trading & Significant ItemsNon-Trading & Significant Items
($m) FY09P t
FY09P t t Segment Comment($m) Pre-tax Post-tax Segment Comment
Coles (52) (60) Other Property impairments partially offset by write-back of store exit provision
Kmart (70) (49) Other Supply chain and other restructuring
Insurance & Other (15) (12) Other Single licence and other restructuring Insurance & Other (15) (12) Other g gincluding Centrepoint exit
Non-trading items (137) (121)
Other (136) (95) Finance costs
Interest rate swap close-outs post debt repayment
Tax adjustment 110 Tax Reviews of leasehold tax base and Tax adjustment - 110 Tax R&D claims
Total (273) (106)
13
Note: Impairments above of $89m do not have associated deferred tax assets

Operating DivisionsOperating Divisions

ColesColes
1. Building a solid foundation
Coles Food & LiquorComp Sales by Quarter (FY09)#
7.3%0.08
Strategies
1. Building a solid foundation
2. Delivering consistently well
6.6%
0.05
0.06
0.07
3. Driving the Coles difference
• Food & Liquor comp sales growth of 4 6% (7 3% in 4Q09 Easter adjusted)
3.8%
0 02
0.03
0.04
FY09 Trading Update
4.6% (7.3% in 4Q09, Easter adjusted)
• Increasing customer transactions and basket value growth
• In-store offer & service improving
1.3%
0
0.01
0.02
Q1 Q2 Q3 Q4
• In-store offer & service improving
• New Liquor team driving improvement
• Economic conditions remain fragile
Outlook
• Economic conditions remain fragile
• Focus on quality, service & value
• Five year turnaround programme to continue at pace
15
continue at pace
# Excluding property. Easter adjusted.

Coles – Strategy5 years – 3 phases of recovery
Building a Solid F d ti
Delivering C i t tl W ll
Driving the Coles Diff
PerformanceFoundation Consistently Well Difference
• Embed the new culture• Culture of continuous improvement
• Create a strong top team
• Cultural change
• Availability & store standards
• Team member development
• Improved customer service
• Improved efficiency
• Strong customer trust and loyalty
• Strong operational efficiencyAvailability & store standards
• Value and customer trust
• Renewal store development
• Improved efficiency
• Appealing Fresh food offer
• Stronger delivery of value
Strong operational efficiency
• Innovative & Improved offer
• New stores, new categories
• IT & supply chain infrastructure
• Liquor renewal
• Efficient use of capital
• Scale rollout of new format
• Auto replenishment completed
16Year 1 - 2 Year 2 - 4 Year 4 - 5+
Efficient use of capital

Coles – StrategyPhase 1 Progress
Create a strong top team 100% of leadership team new to Coles/role with over 125 years of retailing experience 50% of zone manager new 44% of Merchandise Generalexperience. 50% of zone manager new, 44% of Merchandise General Managers new. Continual increase in expectations and calibre of team.
Cultural change Move to customer centric structures and processes. Quarterly road-shows improving interaction with store managers. Absenteeism down materially.improving interaction with store managers. Absenteeism down materially. Launch of Coles Retail Leaders programme and Coles graduate programme.
Availability & store standards Out of stocks down over 66%. Easy ordering trials near completion. Customer facing service investment. Rising expectations in store standards. Customer response encouraging with customer satisfaction highest in over two years.
Value and customer trust Investment in weekly promotions; private label sales growing in double digits; NPD pipeline developing. Reinvestment in prices.
Renewal store development 13 Pilot stores landed, showing encouraging early results.
IT & supply chain infrastructure DC modernisation complete; Improved service to stores
Li l Top team strengthened and restructured including appointment of Tony LeonLiquor renewal Top team strengthened and restructured including appointment of Tony Leon. Accelerated change programme. Improved store standards and improved service and execution.
Efficient use of capital Inventory overstocks 65% lower than at acquisition 5 day reduction in net
17
Efficient use of capital Inventory overstocks 65% lower than at acquisition. 5 day reduction in net working capital. Returns focus on capital expenditure.

Home Improvement and Office SuppliesHome Improvement and Office SuppliesBunnings
1. Profitable sales growth• Maintain strength of focus on
Strategies2. Better stock flow
3. Engaging and developing a strong team
4. Improving productivity and execution
• Maintain strength of focus on customer and business improvements
5. Sustainability
• 13% cash sales growth with store-on-store growth of 10 1%
• 30 – 40 Warehouses to open in Australia in the next 3 years
FY09 Trading Update
store growth of 10.1%
• Continued investment in store upgrades and category enhancements
Opened 13 new stores and 10 trade
years
• Opened 13 new stores and 10 trade centres
• Cash sales growth albeit tempered for
Outlook
Cash sales growth albeit tempered for impact of recent Aust. Govt. stimulus
• 10 – 14 new warehouse stores & more trade centres
18
trade centres
Home Improvement and Office SuppliesHome Improvement and Office SuppliesOfficeworks
C ti d t ti f t1. Improving the customer offer
• Continued traction from reset
strategic agenda Strategies
2. Improving customer service
3. Building a stronger team
4 R d d t d l it• Small business sector
sentiment to remain volatile
4. Reduced costs and complexity
5. Drive sales profitability
Officeworks retail store sales growth of
FY09 Trading U d t
• Officeworks retail store sales growth of 7.7%; 10.6% lift in transactions
• Adverse sales trends in Officeworks Business & Harris Technology
Updategy
• Customer-facing channel conflict eliminated
Outlook
• Moderate sales growth in retail stores
• Focus on executing strategic agenda to reinvigorate the business
19
g
TargetTarget
• Absolute focus on the 1. Profitable store sales growth through Absolute focus on the
customer and delivering
what they demandStrategies
network expansion and volume mix
2. Product leadership supported by new
and differentiated product developmentwhat they demand
• Cost control continued in a
and differentiated product development
3. Sustainability
• EBIT margin strength maintained at 9.4%difficult environment
FY09 Trading Update
g g
• Comparative store sales growth of 4.2% with 4Q growth of 6.4% (Easter adjusted)
16 t i d 33 Update • 16 new store openings and 33 refurbishments
• More subdued conditions expected
Outlook
pfollowing Aust. Govt. Stimulus
• Ongoing leverage of major expenses
7 t d 20 f bi h t
20
• 7 new stores and 20 refurbishments
KmartKmart
• Profitability improving 1. Outstanding customer experienceProfitability improving
through Renewal strategies
R b ildi f t i blStrategies
2. Ranges customers want
3. Great value everyday
4. Clear communication• Rebuilding for sustainable
growth will take time5. Every site a success
6. Best people, great company
• Comparative store sales flat;
FY09 Trading Update
• Comparative store sales flat; unprofitable categories being exited
• Margin improvement with reduced discounting
Updateg
• Inventory healthy and $100m lower than last year
• Focus on improving profitability
Outlook
Focus on improving profitability
• Ongoing improvements to customer experience and in store execution
2 i FY10
21
• 2 new stores in FY10

ResourcesResources
• Forecast Curragh 1. Maximise export sales and optimise l imetallurgical sales of 6.2 –
6.7mt in FY10 Strategies
sales mix
2. Cost reduction programmes
3. Expansion opportunities
• Positive signs of global steel production recovery
4. Extend product and market reach
5. Sustainability
• Record production sales and earnings
FY09 Trading Update
• Record production, sales and earnings
• Curragh remains a lowest quartile cost producer
• Blackwater Creek Diversion on schedule p • Blackwater Creek Diversion on schedule and budget
• Significantly reduced earnings in FY10 with export coal prices down ~60%
Outlook
with export coal prices down ~60%• Aggressive cost reduction programmes
in place• Timing of expansion projects subject to
22
market conditions
InsuranceInsurance
• Management and licence UnderwritingManagement and licence restructuring in Aust. recently completed
Strategies
1. Business improvement2. New business – retail distributionBrokingy p
• Continuing consolidation of brokers/distribution
1. Business improvement2. Acquisitions and new businesses
• Earnings affected by increased number
FY09 Trading Update
• Earnings affected by increased number and severity of weather-related claims
• Lumley NZ delivering on turnaround
• Restructuring and management changes Update • Restructuring and management changes in Lumley Australia
• Competition for new business is constraining market hardening
Outlook
constraining market hardening• Strong focus on underwriting and claims
disciplines• Improvements in business processes and
23
sales effectiveness

Industrial & SafetyIndustrial & Safety
1. Increase sales to existing customers• Challenging market
conditions with business activity slowdown from 2H09
Strategies2. Target higher growth sectors
3. Increase SME penetrationactivity slowdown from 2H09
• Strengthening capabilities for growth
4. Increase competitiveness
• Solid result given challenging market conditionsfor growth
FY09 Trading Update
conditions
• Continued strong DIFOT and customer service performance
• Operational improvements and cost focus
• Challenging market conditions and
Outlook
g g
margin pressure expected to continue
• Ongoing expenses and capital
management disciplines
24
management disciplines
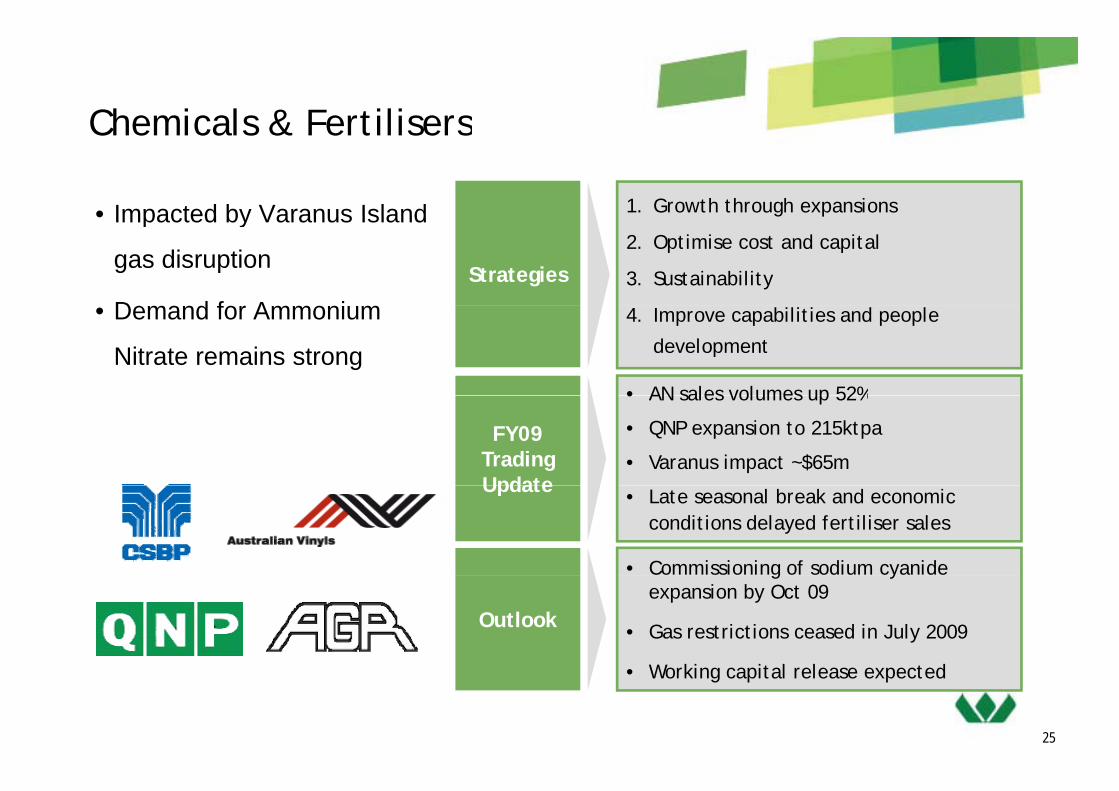
Chemicals & FertilisersChemicals & Fertilisers
• Impacted by Varanus Island 1. Growth through expansions • Impacted by Varanus Island
gas disruption
D d f A iStrategies
g p
2. Optimise cost and capital
3. Sustainability
• Demand for Ammonium
Nitrate remains strong
4. Improve capabilities and people
development
• AN sales volumes up 52%
FY09 Trading Update
• AN sales volumes up 52%
• QNP expansion to 215ktpa
• Varanus impact ~$65mUpdate • Late seasonal break and economic
conditions delayed fertiliser sales
• Commissioning of sodium cyanide
Outlook
g yexpansion by Oct 09
• Gas restrictions ceased in July 2009
W ki i l l d
25
• Working capital release expected
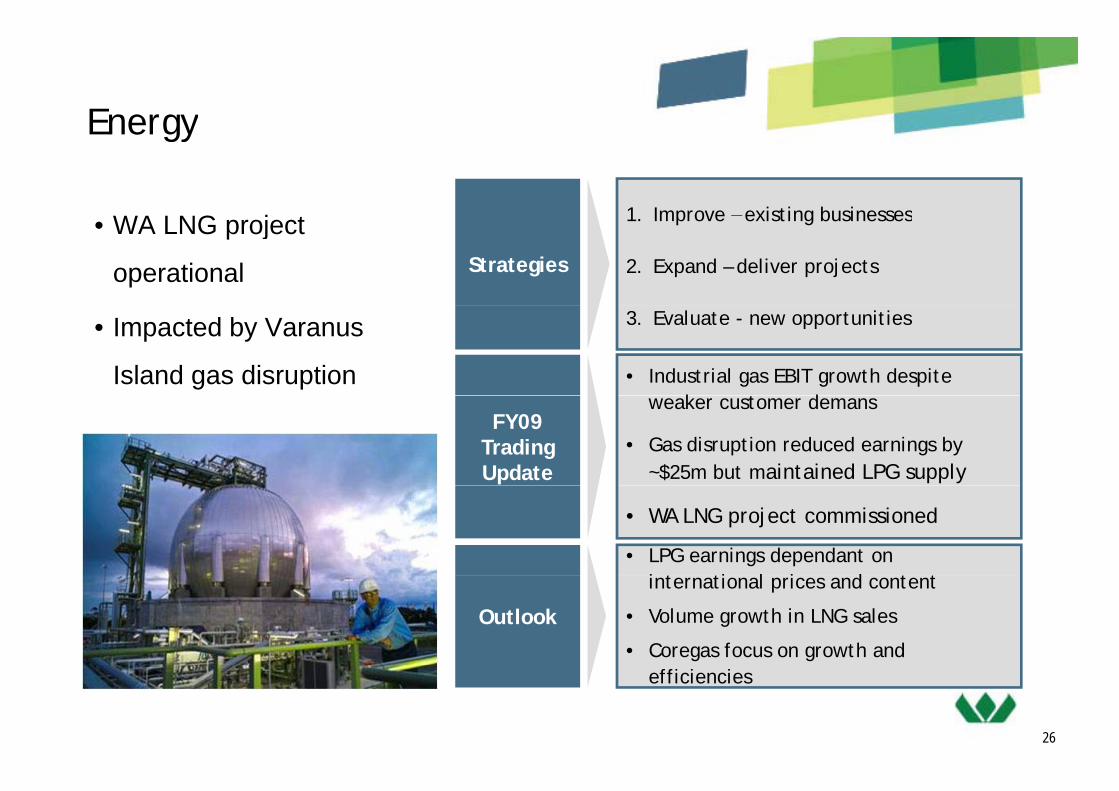
EnergyEnergy
WA LNG j t 1 Improve – existing businesses• WA LNG project
operational Strategies
1. Improve existing businesses
2. Expand – deliver projects
• Impacted by Varanus
Island gas disruption
3. Evaluate - new opportunities
• Industrial gas EBIT growth despite k d
FY09 Trading Update
weaker customer demans
• Gas disruption reduced earnings by ~$25m but maintained LPG supply
• WA LNG project commissioned
• LPG earnings dependant on i t ti l i d t t
Outlook
international prices and content
• Volume growth in LNG sales
• Coregas focus on growth and
26
efficiencies

Capital Management Capital Management

Capital ManagementCapital Management
• Net Debt to Equity of 18.3% at 30 June 2009
– Gross debt $6.2bn, Net debt $4.4bn (net of cash at bank and on deposit)
• Cash Interest Cover Ratio of 5.3 times (rolling 12 month basis)Cash Interest Cover Ratio of 5.3 times (rolling 12 month basis)
• Net Debt to EBITDA of 1.11 times at 30 June 2009
S&P ti BBB ( t bl ) M d ’ B 1 ( t bl )• S&P rating BBB+ (stable), Moody’s Baa1 (stable)
• Final dividend $0.60 per share (fully-franked), ahead of guidance
– Retain dividend investment plan with no underwrite
– DIP to be neutralised with shares purchased on-market
• Seek to deliver stable and growing dividends subject to cash/debt availability, capex requirements, retained earnings, franking credits and general market
diti
28
conditions

Debt Maturity Profile (at 30 June 09) Debt Maturity Profile (at 30 June 09)
• Relatively low levels of debt going forward
• Cash to be used for funding upcoming dividends, seasonal working capital, debt repayments and potential growth opportunities
$4 6b h d d i FY10 ith ll i t f d bt i l di i f 8 5%
4,000$m
• $4.6bn hedged in FY10 with all in cost of debt, including margins, of ~8.5%
2,000
3,000
0
1,000
-1,000
0
Current FY10 FY11 FY12 FY13 FY14 FY15
-2,000
Cash at bank and on deposit Syndicated Wholesale Capital Markets29
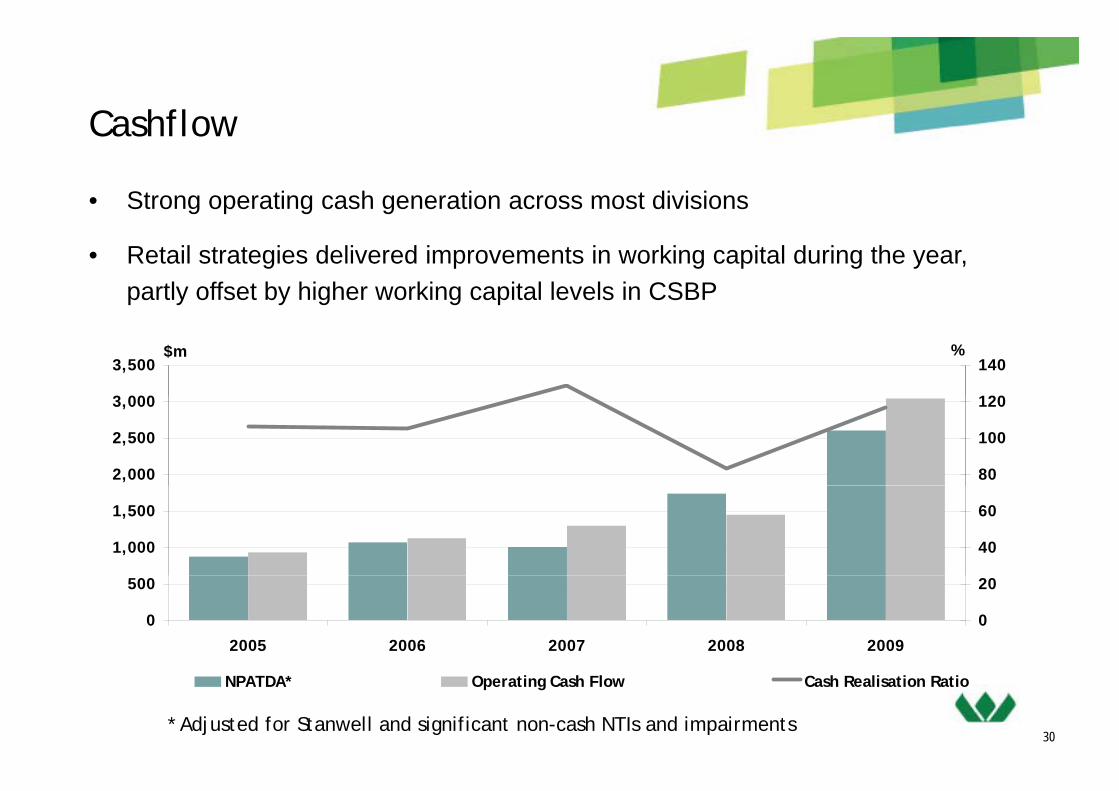
CashflowCashflow
• Strong operating cash generation across most divisions
• Retail strategies delivered improvements in working capital during the year, partly offset by higher working capital levels in CSBP
3 000
3,500$m
120
140%
2,000
2,500
3,000
80
100
120
1,000
1,500
40
60
0
500
2005 2006 2007 2008 2009
0
20
NPATDA* Operating Cash Flow Cash Realisation Ratio
30* Adjusted for Stanwell and significant non-cash NTIs and impairments

Capital ExpenditureCapital Expenditure
St i t t i i th Y d d 30 J ($ ) Actual Actual• Strong investment in organic growth
opportunities across the Group
• Retail Store roll outs and
Year ended 30 June ($m) 2009 2008^
Home Improvement & Office Supplies 377 301
Coles 567 349 • Retail - Store roll outs and
refurbishments
• Industrials – expansions incl. AN2
Target 92 47
Kmart 64 42
Resources 251 140(2008), LNG (2008) and Blackwater Creek (2009/10)
Resources 251 140
Insurance 26 17
Industrial & Safety 26 21
• Strong returns focus maintained
• FY10 expected to be $1.7-1.9bn
Chemicals & Fertiliser 44 201
Energy 39 118
Other 17 5
• Retail ~$1.3 - $1.5bn, depending on property development opportunities
Total 1,503 1,241
Capex/D&A* (%) 176% 206%
31
^ Coles, Kmart, Officeworks and Target included from 23 Nov 07 * Excl Stanwell Amortisation

OutlookOutlook
• Cautiously optimistic about the economic outlook in FY10 although Cau ous y op s c abou e eco o c ou oo 0 a ougcognisant of a degree of ongoing fragility
• Underlying retail trading conditions remain somewhat volatile and difficult toUnderlying retail trading conditions remain somewhat volatile and difficult to predict despite recent signs of growing consumer confidence
Impact of cycling 2008/09 Government stimulus packages– Impact of cycling 2008/09 Government stimulus packages
• Focus on retail business turnarounds to continue
• Resources’ FY10 earnings to reduce significantly due to lower export prices
• Remaining businesses expected to improve assuming more normalised conditions prevail
• Continued focus on growth in ROC, cash flows and balance sheet strength
32
g g

For all the latest news visitFor all the latest news visit
www.wesfarmers.com.au
33