Phillips Carbon Black Ltd. - Myirisbreport.myiris.com/SKPSEC/PHICARBL_20121010.pdfPhillips Carbon...
14
October 10, 2012 Phillips Carbon Black Ltd. On a recovery path... CMP INR 106.0 Target INR 148.0 Initiating Coverage - BUY SKP Securities Ltd www.skpmoneywise.com Page 1 of 14 Key Share Data Face Value (INR) 10.0 Equity Capital (INR Mn) 344.7 52 Week High/Low (INR) 145.2 / 76.1 6 months Avg. Daily Volume (NSE) 73,461 BSE Code 506590 NSE Code PHILIPCARB Reuters Code PHIL.BO Bloomberg Code PHCB IN Shareholding Pattern (as on 30th Jun. 2012) Promoter 52.26% FII's, 10.68% Others, 29.65% DII's, 7.41% Source: Company Particulars FY11 FY12 FY13E FY14E Net Sales 16,957.2 21,867.8 23,861.1 27,418.2 Growth (%) 37.6% 29.0% 9.1% 14.9% EBITDA 2,213.2 2,071.6 2,247.7 2,648.6 PAT 1,127.0 856.1 851.8 1,098.3 Growth (%) -7.8% -24.0% -0.5% 28.9% EPS (INR) 34.3 25.4 24.7 31.9 BVPS (INR) 155.2 176.2 196.2 222.2 Key Financials (INR Million) Particulars FY11 FY12 FY13E FY14E P/E (x) 4.3 4.4 4.3 3.3 P/BVPS (x) 0.9 0.6 0.5 0.5 Mcap/Sales (x) 0.3 0.2 0.2 0.1 EV/EBITDA (x) 3.9 5.0 4.8 4.5 ROCE (%) 19.1% 13.4% 12.0% 13.0% ROE (%) 26.9% 15.3% 13.3% 15.2% EBITDA Mar (%) 13.1% 9.5% 9.4% 9.7% PAT Mar (%) 6.6% 3.9% 3.6% 4.0% Debt - Equity (x) 0.9 1.1 1.1 1.1 Key Financials Ratios Source: Company, SKP Research 1 Yr price performance PCBL vis-à-vis BSE Small Cap -60% -45% -30% -15% 0% 15% Oct-11 Dec-11 Mar-12 May-12 Jul-12 Oct-12 PCBL BSE Small Cap Company Background Phillips Carbon Black Ltd (PCBL) incorporated in 1960, is a part of RP- Sanjiv Goenka Group. The company is engaged in the manufacturing of carbon black having a capacity of 422,000 MT along with power generation capacity of 76 MW. Columbian Chemical Corporation, US, a leading international producer of rubber blacks is the technical collaborator of the company. Investment Rationale Strategic plant location with dominant market share PCBL enjoys a Pan India presence with four manufacturing plants, which are strategically located to cater to the tyre demands of the respective regions, thereby reducing the cost of freight. The domestic industry is consolidated with five players with PCBL having a market share of ~46 percent in FY12, in terms of production. Growth in the Automobile Industry to drive volumes To meet the growing demand (OEM & Replacement markets), majority of the tyre manufacturers are in the process of capacity expansion especially in the radials segment which would lead to utilisation of newer capacities of carbon black. Going forward, the radialization in truck segment is expected to reach ~35 percent (next 3 years) owing to infrastructure thrust and OE thrust, leading to an increase in the demand for tyres. Capacity expansion plan to propel growth PCBL is implementing a Greenfield expansion of 140,000 MT carbon black plant at Chennai along with 25 MW CPP at a total cost of INR 4,000 million which is expected to get commissioned in FY15. It is also setting up of a new coal tar distillation plant in Orissa with capacity of 1,50,000 mtpa coal tar processing and 50,000 mtpa soft pitch processing at an investment of INR 1,800 million. The 1,50,000 mtpa coal tar processing plant is expected to get commissioned in FY14 while 50,000 mtpa soft pitch processing will get commissioned in FY15. Surplus power sales to maintain margins With increase in the power generation capacity from 68 MW in FY12 to 84 MW by Oct. ’12, the share of revenues from power sale is expected to increase to ~4.5 percent by FY14E from current 3.8 percent. The power business enjoys EBITDA margins of ~90 percent in the absence of raw material cost. Valuation We rate a BUY rating on PCBL with a price target of INR148/share, implying an upside potential of 39.6 percent from current levels. Our target price is based on PCBL’s FY14E EV/EBITDA multiple of 5x. Analyst: Nikhil Saboo Ph: +91 33 4007 7027, M: +91 9330186643 Email: n[email protected]om
-
Upload
truongkhuong -
Category
Documents
-
view
217 -
download
2
Transcript of Phillips Carbon Black Ltd. - Myirisbreport.myiris.com/SKPSEC/PHICARBL_20121010.pdfPhillips Carbon...

October 10, 2012
Phillips Carbon Black Ltd.
On a recovery path...
CMP INR 106.0 Target INR 148.0 Initiating Coverage - BUY
SKP Securities Ltd www.skpmoneywise.com Page 1 of 14
Key Share Data
Face Value (INR) 10.0
Equity Capital (INR Mn) 344.7
52 Week High/Low (INR) 145.2 / 76.1
6 months Avg. Daily Volume (NSE) 73,461
BSE Code 506590
NSE Code PHILIPCARB
Reuters Code PHIL.BO
Bloomberg Code PHCB IN
Shareholding Pattern (as on 30th Jun. 2012)
Promoter 52.26%
FII's, 10.68%
Others, 29.65%
DII's, 7.41%
Source: Company
Particulars FY11 FY12 FY13E FY14E
Net Sales 16,957.2 21,867.8 23,861.1 27,418.2
Growth (%) 37.6% 29.0% 9.1% 14.9%
EBITDA 2,213.2 2,071.6 2,247.7 2,648.6
PAT 1,127.0 856.1 851.8 1,098.3
Growth (%) -7.8% -24.0% -0.5% 28.9%
EPS (INR) 34.3 25.4 24.7 31.9
BVPS (INR) 155.2 176.2 196.2 222.2
Key Financials (INR Million)
Particulars FY11 FY12 FY13E FY14E
P/E (x) 4.3 4.4 4.3 3.3
P/BVPS (x) 0.9 0.6 0.5 0.5
Mcap/Sales (x) 0.3 0.2 0.2 0.1
EV/EBITDA (x) 3.9 5.0 4.8 4.5
ROCE (%) 19.1% 13.4% 12.0% 13.0%
ROE (%) 26.9% 15.3% 13.3% 15.2%
EBITDA Mar (%) 13.1% 9.5% 9.4% 9.7%
PAT Mar (%) 6.6% 3.9% 3.6% 4.0%
Debt - Equity (x) 0.9 1.1 1.1 1.1
Key Financials Ratios
Source: Company, SKP Research
1 Yr price performance PCBL vis-à-vis BSE Small Cap
-60%
-45%
-30%
-15%
0%
15%
Oct-11 Dec-11 Mar-12 May-12 Jul-12 Oct-12
PCBL BSE Small Cap
Company Background
Phillips Carbon Black Ltd (PCBL) incorporated in 1960, is a part of RP-Sanjiv Goenka Group. The company is engaged in the manufacturing of carbon black having a capacity of 422,000 MT along with power generation capacity of 76 MW. Columbian Chemical Corporation, US, a leading international producer of rubber blacks is the technical collaborator of the company.
Investment Rationale
Strategic plant location with dominant market share
� PCBL enjoys a Pan India presence with four manufacturing plants, which are strategically located to cater to the tyre demands of the respective regions, thereby reducing the cost of freight.
� The domestic industry is consolidated with five players with PCBL
having a market share of ~46 percent in FY12, in terms of production.
Growth in the Automobile Industry to drive volumes
� To meet the growing demand (OEM & Replacement markets), majority of the tyre manufacturers are in the process of capacity expansion especially in the radials segment which would lead to utilisation of newer capacities of carbon black.
� Going forward, the radialization in truck segment is expected
to reach ~35 percent (next 3 years) owing to infrastructure thrust and OE thrust, leading to an increase in the demand for tyres.
Capacity expansion plan to propel growth
� PCBL is implementing a Greenfield expansion of 140,000 MT carbon black plant at Chennai along with 25 MW CPP at a total cost of INR 4,000 million which is expected to get commissioned in FY15.
� It is also setting up of a new coal tar distillation plant in Orissa with
capacity of 1,50,000 mtpa coal tar processing and 50,000 mtpa soft pitch processing at an investment of INR 1,800 million. The 1,50,000 mtpa coal tar processing plant is expected to get commissioned in FY14 while 50,000 mtpa soft pitch processing will get commissioned in FY15.
Surplus power sales to maintain margins
� With increase in the power generation capacity from 68 MW in FY12 to 84 MW by Oct. ’12, the share of revenues from power sale is expected to increase to ~4.5 percent by FY14E from current 3.8 percent. The power business enjoys EBITDA margins of ~90 percent in the absence of raw material cost.
Valuation
We rate a BUY rating on PCBL with a price target of INR148/share, implying an upside potential of 39.6 percent from current levels. Our target price is based on PCBL’s FY14E EV/EBITDA multiple of 5x.
A Analyst: Nikhil Saboo
Ph: +91 33 4007 7027, M: +91 9330186643
Email: [email protected]

Phillips Carbon Black Ltd.
SKP Securities Ltd www.skpmoneywise.com Page 2 of 14
The domestic industry is globally
competitive, as most of the capacity
in modern and product quality
matches international standards
Environmental issue have made it
difficult to produce carbon black in
major developed countries as a result
of which production is shifting to
emerging countries
Industry Overview
� Carbon black is a form of amorphous carbon that has an extremely
high surface area to volume ratio and it is one of the first nano-
materials to find common use. Carbon black is a material, usually
produced by the incomplete combustion of petroleum products.
� Carbon black is used in the tyre industry as well as in the non-tyre
sector as reinforcing filler in rubber products and in the printing ink
and paint industry. The tyre industry accounts for about 65 percent
of carbon black demand in India followed by 15 percent in rubber
and 20 percent is utilized by ink, printing, belts & hoses and other
speciality chemicals etc. Carbon black helps in conducting heat
away from the tread and belt area of the tyre, reducing thermal
damage and increasing the durability of the tyre.
Exhibit: Sector Wise Utilization of Carbon Black
Source: Company, SKP Research
65.0%
15.0%
10.0%
10.0%
Tyre Rubber Belts & Hoses Printing, Ink & Other Speciality
� During 2011, the global demand for carbon black rose by 5.8
percent from 10.2 million MT to 10.8 million MT, while global
capacity and utilization stood at 13.9 million MT and 77 percent
respectively. The demand growth was led by regions like North
America (9.0 percent), European Union (11.0 percent) and Eastern
Europe (14.7 percent), while Asia (excluding China) saw a modest
growth of 5.2 percent compared to last year y-o-y growth of 18
percent.
Particulars CY09 CY10 CY11
Capacity 12.7 13.4 13.9
Growth (%) - 5.5% 3.7%
Capacity Utilization (%) 71% 76% 77%
Demand 8.9 10.2 10.8
Source: Company, SKP Research
Exhibit: Global Carbon Black Scenario Figs. in Million MT

Phillips Carbon Black Ltd.
SKP Securities Ltd www.skpmoneywise.com Page 3 of 14
The domestic carbon black industry
was impacted by a slowdown within
the automobile sector as well as by
the increasing dumping of carbon
black into India by China and other
countries
Around 40 percent of the tyre
demand is led by the OEM segment
while 60 percent is from the
replacement segment (by revenue)
Demand growth for carbon black
continues to be robust with the global
demand expected to grow at a CAGR
of 4.6 percent from 2010 to 2015
� In India, the demand for carbon black during FY12 was 657,000 MT
witnessing a y-o-y growth of 2.5 percent. Total production during
FY12 was 694,000 MT, which is at the same level as FY11. The
total capacity of the Indian carbon black industry stood at 935,000
MT, with capacity utilization of 74 percent.
Particulars FY10 FY11 FY12
Capacity 0.700 0.790 0.935
Growth (%) - 12.9% 18.4%
Production 0.633 0.693 0.694
Capacity Utilization (%) 90% 88% 74%
Demand 0.605 0.641 0.657
Source: Company, SKP Research
Exhibit: India Carbon Black Scenario Figs. in Million MT
� Domestic tyre production is expected to get a boost from the high
OEM and replacement demand from the tyre and automobile
industry. Around 40 percent of the tyre demand is led by the OEM
segment while 60 percent is from the replacement segment (by
revenue). Furthermore, a number of international car makers are
increasingly focusing on the Indian automobile industry and
ramping up investment. In view of this, tyre manufacturers have
lined-up capacity expansion plans in the near future, which are
expected to benefit the domestic carbon black industry.
� The industry sold about 122.8 million tyres in various segments in
FY12 compared to 118.1 million tyres sold in FY11. Demand
growth for carbon black continues to be robust with the global
demand expected to grow at a CAGR of 4.6 percent from 2010 to
2015. Domestic demand for carbon black is expected to grow at
~7-8 percent during FY13. Exhibit: Domestic Auto Sales Volumes
Source: Industry, SKP Research
9.9 10.7 11.6 11.7 13.6 14.7 14.43.1 3.3 3.7 3.7 4.3 4.6 513.6 14.2 16.8 18.8
22.529.3 30.3
3 3.83.8 3.8
4.9
5.4 5.6
30.335.2
38.7 40.1
48.4
61.965.2
2.22.4
2.72.4
2.3
2.22.3
0
10
20
30
4050
60
70
80
90100
110
120
130
FY06 FY07 FY08 FY09 FY10 FY11 FY12
Fig
s. in
Mill
ions
Truck/Bus Light Trucks Pasng. Cars Farm Two Wheelers Others

Phillips Carbon Black Ltd.
SKP Securities Ltd www.skpmoneywise.com Page 4 of 14
PCBL is the leading carbon black
manufacturer in the country and
seventh largest player across the
globe
The strategic location of four plants in
different parts of India facilitate PCBL
to optimize logistic costs within India
and outside
Company Profile
� Phillips Carbon Black Limited (PCBL), incorporated in 1960, is a
part of RP-Sanjiv Goenka Group. The company is engaged in the
manufacturing of carbon black and power generation. It is the
leading carbon black manufacturer in the country and seventh
largest player across the globe. Columbian Chemical Corporation,
US, a leading international producer of rubber blacks is the
technical collaborator of the company.
Source: Company, SKP Research
Exhibit: Key Milestones
Started with Phillips Petroleum Co, USA at Durgapur with 14,000 MT.
Collaboration with Columbian Chemical, Acquisition of CB division of
Gujarat Carbon & Carbon & Chemicals, Ltd, Kochi etc.
1960 -
2004:
2005: Durgapur capacity increased to 1,40,000 MT & 12 MW CPP commissioned at
2007: Signed a MOU for plant in Vietnam
2008: 30 MW CPP commissioned at Durgapur
2009: 90000 MT & 16 MW CPP commissioned at Mundra
2011: 10 MW CPP commissioned at Kochi
2012: Mundra & Durgapur capacity increased to 1,40,000 & 1,52,000 MT
Q1FY13: 8 MW CPP commissioned at Mundra
� The company has four manufacturing facilities in India with total
installed carbon black manufacturing capacity of 422,000 MT and
power generation capacity of 76 MW. Its plant is located at
Durgapur (West Bengal), Palej & Mundra (Gujarat) and Kochi
(Kerala). PCBL is setting up a green field carbon black plant at
Chennai and carbo chemical plant at Orissa, which going forward
will further strengthen its geographical reach.
Location Carbon Black Capacity Power Capacity
Durgapur, West Bengal 1,52,000 MT 30 MW
Palej, Gujarat 90,000 MT 12 MW
Mundra, Gujarat 1,40,000 MT 24 MW
Kochi, Kerala 40,000 MT 10 MW
Total 4,22,000 MT 76 MW
Exhibit: Current Plant Overview
Source: Company, SKP Research

Phillips Carbon Black Ltd.
SKP Securities Ltd www.skpmoneywise.com Page 5 of 14
PCBL products are exported to more
than 20 countries, which contribute
~30 percent of its revenue.
PCBL is setting up a green field
carbon black plant at Chennai, which
going forward will further strengthen
its geographical reach
� Multi-locational production facilities along with focus on product
innovation and global technological alliance helps, PCBL to cater
the demand of its customers across India. Its products are exported
to more than 20 countries, which contribute ~30 percent of its
revenue. PCBL manufacturers ~20-25 grades of carbon black
which is supplied to the tyre industry, non-tyre industry and
specialty chemicals sector.
Investment Rationale
Strategic plant location with dominant market share
� PCBL is the only player in the carbon black industry with a Pan
India presence. It has four manufacturing plants in India which are
strategically located to cater to the tyre demands of the respective
regions, thereby reducing the cost of freight. Further, PCBL is
setting up a green field carbon black plant at Chennai, which going
forward will further strengthen its geographical reach.
LocationCapacity
(FY12)
Capacity
(FY14E) *
Mundra140000 MT +
16 MW
140000 MT +
24 MW
Palej90000 MT +
12 MW
90000 MT +
20 MW
Kochi40000 MT +
10 MW
90000 MT +
10 MW
Orissa - 150000 MT
Durgapur152000 MT +
30 MW
152000 MT +
30 MW
Exhibit: Strategic Plant Locations
Note: * Chennai capacity of 140000 MT &
25 MW power plant is expected to get
commissioned in FY15. Also excluding
Vietnam project of 115000 MT & 18 MW
power plant.
Source: Company, SKP Research
Mundra
Orissa
Chennai
Palej
Kochi
Durgapur
Carbon Black Plants
Carbo Chemical Plants
MRF Tyres
Apollo Tyres
JK Tyres
0Ceat Tyres
� The domestic carbon black industry is consolidated with five
players, accounting for the entire carbon black capacity. PCBL is
the largest player in the domestic market having a market share of
~46 percent in FY12, in terms of production while globally it is
ranked seventh. It takes around ~20-24 months to build a new
carbon black manufacturing facility; hence, PCBL is well placed to
take advantage of the expansions in the industry.
Phillips Carbon Black Ltd.
SKP Securities Ltd www.skpmoneywise.com Page 6 of 14
The Indian markets is dominated by
top three players in the industry –
PCBL, Hi-Tech (Aditya Birla Nuvo)
and Cabot India (a subsidiary of
Cabot Corporation)
Going forward, we expect a robust
demand, on account of improvement
in the macro environment and
reversal in interest rates
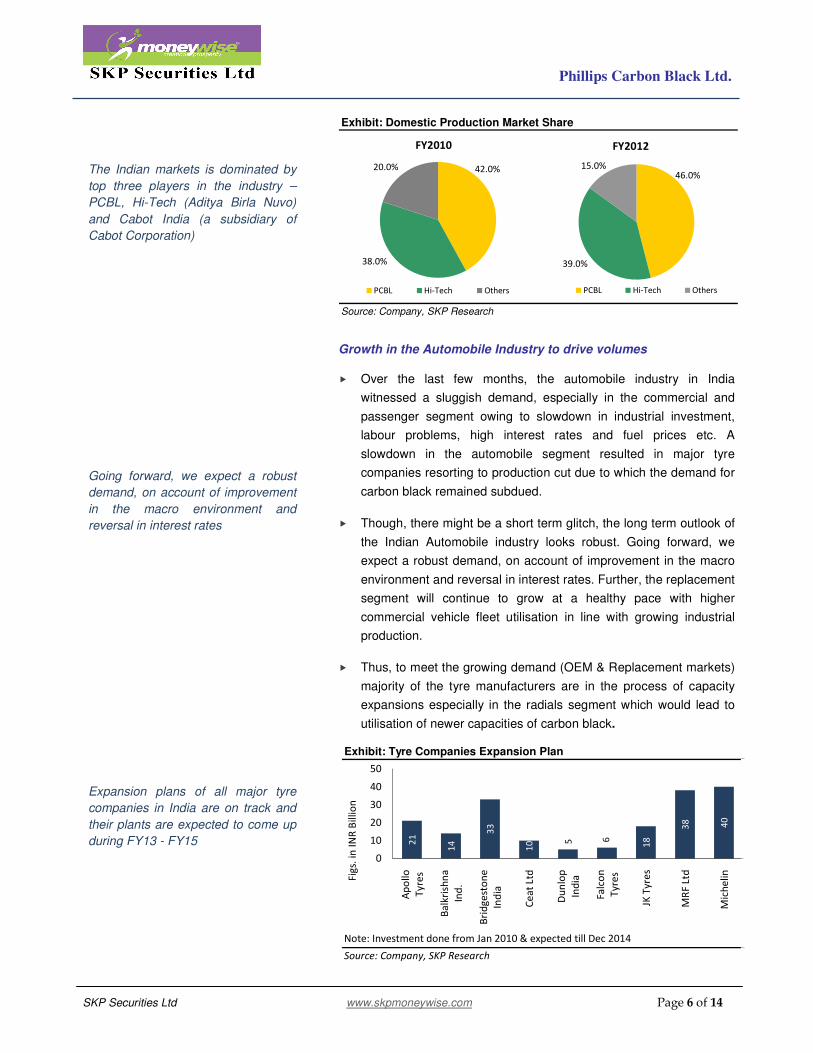
Expansion plans of all major tyre
companies in India are on track and
their plants are expected to come up
during FY13 - FY15
Exhibit: Domestic Production Market Share
Source: Company, SKP Research
42.0%
38.0%
20.0%
FY2010
PCBL Hi-Tech Others
46.0%
39.0%
15.0%
FY2012
PCBL Hi-Tech Others
Growth in the Automobile Industry to drive volumes
� Over the last few months, the automobile industry in India
witnessed a sluggish demand, especially in the commercial and
passenger segment owing to slowdown in industrial investment,
labour problems, high interest rates and fuel prices etc. A
slowdown in the automobile segment resulted in major tyre
companies resorting to production cut due to which the demand for
carbon black remained subdued.
� Though, there might be a short term glitch, the long term outlook of
the Indian Automobile industry looks robust. Going forward, we
expect a robust demand, on account of improvement in the macro
environment and reversal in interest rates. Further, the replacement
segment will continue to grow at a healthy pace with higher
commercial vehicle fleet utilisation in line with growing industrial
production.
� Thus, to meet the growing demand (OEM & Replacement markets)
majority of the tyre manufacturers are in the process of capacity
expansions especially in the radials segment which would lead to
utilisation of newer capacities of carbon black. Exhibit: Tyre Companies Expansion Plan
Source: Company, SKP Research
Note: Investment done from Jan 2010 & expected till Dec 2014
21
14
33
10 5 6
18
38 40
0
10
20
30
40
50
Ap
oll
o
Ty
res
Ba
lkri
shn
a
Ind
.
Bri
dg
est
on
e
Ind
ia
Ce
at
Ltd
Du
nlo
p
Ind
ia
Fa
lco
n
Ty
res
JK T
yre
s
MR
F L
td
Mic
he
lin
Fig
s. i
n I
NR
Bil
lio
n

Phillips Carbon Black Ltd.
SKP Securities Ltd www.skpmoneywise.com Page 7 of 14
Going forward, the radialization in
truck segment is expected to reach
~35 percent (next 3 years) owing to
infrastructure and OE thrust, leading
to an increase in the demand for
tyres
PCBL is implementing a Greenfield
expansion of 140,000 MT carbon
black plant at Chennai along with 25
MW CPP at a total cost of INR 4,000
million which is expected to get
commissioned in FY15
� The radialization of truck tyres is still at extremely low levels in India
and offers huge opportunity for tyre companies. Going forward, the
radialization in truck segment is expected to reach ~35 percent
(next 3 years) owing to infrastructure and OE thrust, leading to an
increase in the demand for tyres, thereby boosting the demand for
carbon black.
Source: Industry Sources, SKP Research
Exhibit: Radialisation in Truck Segment
100%
96%
95%
72%
68%
65%
52%
27%
21%
0% 20% 40% 60% 80% 100% 120%
Western Europe
North America
Central Europe
Africa/Middle East
World
South America
Asia
Eastern Europe
India
Capacity expansion plan to propel growth
� To meet the growing demand of carbon black, PCBL had
undertaken significant capacity addition across all its manufacturing
plants over the last two years as well increased its co-generation
power capacity. In FY12, PCBL completed expansion of carbon
black plant of 50,000 MT at Mundra, 11,000 MT at Durgapur along
with 10 MW captive power plant (CPP) plant at Kochi. During
Q1FY13, PCBL commissioned its 8 MW CPP at Mundra, and is
underway to commission 50,000 MT of carbon black capacity at
Cochin plant and 8 MW CPP at Palej, Gujarat (expected by
September 2012), thereby taking the total carbon black capacity to
472,000 and co-generation power capacity to 84 MW.
� The company is implementing a Greenfield expansion of
140,000 MT carbon black plant at Chennai along with 25 MW
CPP at a total cost of INR 4,000 million which is expected to
get commissioned in FY15. The funding for the same will be done
through a mix of debt and internal accruals in the ratio of 2:1. PCBL
has already signed Memorandum of Understanding (MoU) with the
Tamil Nadu Government and is in the process of obtaining all
approvals for the same.

Phillips Carbon Black Ltd.
SKP Securities Ltd www.skpmoneywise.com Page 8 of 14
In order to partially offset its volatility,
PCBL has planned to use coal tar as
its raw material. Coal Tar is a by-
product generated through the
processing of coal into coke for use
in steel manufacturing
The entire Vietnam projects have
been kept under review on account
of slowing demand scenario
Waste gases from plants being used
to produce electricity, Surplus power
sold to grid at an average realization
of INR 3.2 – 3.3/unit
� The key raw material for PCBL is Carbon Black Feed Stock
(CBFS), which is directly linked to the international crude oil prices
and is imported from USA. In order to partially offset its volatility,
PCBL has planned to use coal tar as its raw material. Coal Tar is a
by-product generated through the processing of coal into coke for
use in steel manufacturing. PCBL is setting up of a new coal tar
distillation plant (Carbo Chemical business) in Orissa with capacity
of 1,50,000 mtpa coal tar processing and 50,000 mtpa soft pitch
processing at an investment of INR 1,800 million. The 1,50,000
mtpa coal tar processing plant is expected to get
commissioned in FY14 while 50,000 mtpa soft pitch
processing will get commissioned in FY15.
� PCBL planned to set up 115,000 MT carbon black plant at Vietnam
along with 18 MW CPP in two phases at an investment of USD 84
million, which was to be funded through a debt equity ratio of 2:1.
The first phase of 60,000 MT carbon black along with 12 MW CPP
was expected to get commissioned in FY13 while the second
phase consisting of 55,000 MT carbon black and 21 MW was
scheduled to get commissioned in FY14. Though, the entire
Vietnam projects have been kept under review on account of
slowing demand scenario. Till date, investments in Vietnam
projects stand at ~USD 5-7 million.
Surplus power sales to maintain margins
� The process of manufacturing of carbon black results in generation
of lean gases which have both sensible heat and low calorific
value. Instead of wasting the energy, PCBL has installed extremely
specialized and state of the art 30 MW CPP at Durgapur, 12 MW
CPP at Palej, 24 MW CPP at Mundra and 10 MW CPP at Kochi.
� The entire lean gas is used to generate power for meeting the
entire internal process requirements for production of carbon black
as well as surplus is sold to the grid. At present, about 35-40
percent of power produced is used for own captive consumption
while rest is sold to the grid at an average realization of INR 3.2-
3.3/unit.
� During FY12, 3.8 percent of the revenues accrue from the sale of
power. With the increase in the power generation capacity from 68
MW in FY12 to 84 MW by October 2012, the share of revenues
from power sale is expected to increase to ~4.5 percent in the
next two years.

Phillips Carbon Black Ltd.
SKP Securities Ltd www.skpmoneywise.com Page 9 of 14
The power business enjoys EBITDA
margins of ~90 percent in the
absence of raw material cost
With the increase in the power
generation capacity from 68 MW in
FY12 to 84 MW by October 12, the
share of revenues from power sale is
expected to increase to ~4.5 percent
in the next two years
Source: Company, SKP Research
Exhibit: Co-Generation Power
Earlier
Waste Gas
generated at the
Carbon Black Plant
Waste Gas
Incineration
Waste Gas Co- Electricity
Internal Plant
Requirement
Surplus
power sold to
76 MW green power generating capacity
� The power business enjoys EBITDA margins of ~90 percent in the
absence of raw material cost. Its increasing presence in PCBL’s
revenue profile is likely to provide a cushion to the overall EBITDA
margins and reduce the dependence of PCBL’s earnings from
carbon black.
Source: Company, SKP Research
Exhibit: Revenue & EBIT Breakup
95.9%
3.8%
Revenue Split (FYRevenue Split (FYRevenue Split (FYRevenue Split (FY12121212))))
Carbon Black Power
59.4%40.6%
EBIT Split (FYEBIT Split (FYEBIT Split (FYEBIT Split (FY12121212))))
Carbon Black Power
Strong clientele base
� The carbon black industry typically has a product mix of 70:30 for
Tyre: Non-Tyre customers. Being present for over five decades in
the industry has enabled PCBL to develop long standing customer
relationship.
� It has a wide range of customers which comprises of prominent and
growing companies like MRF, Apollo Tyres, CEAT Tyres, Good
Year, Bridgestone, Loadstar etc. Long-established relationship with
its clients and diversified client profile helps PCBL to get repeat
orders and also reduces customer concentration risk.

Phillips Carbon Black Ltd.
SKP Securities Ltd www.skpmoneywise.com Page 10 of 14
Any unfavourable movement in
CBFS prices vis-à-vis carbon black
prices and inability to completely
pass it on to the end consumers will
have an adverse impact on the
PCBL’s margins
Exhibit: Clientele Base
Source: Company, SKP Research
Domestic
Customers
International
Customers
Key Concerns
� CBFS which is the key raw material for PCBL is directly linked to
the international oil prices and is imported from USA. Over the last
couple of year’s international oil prices is on an uptrend and is
subject to frequent volatility while the prices of finished carbon
black are revised every quarter. In order to partially offset its
volatility, PCBL has planned to use coal tar as its raw material.
Though, this might take time as plant is expected to get
commissioned in FY14-15 only. Therefore, any unfavourable
movement in CBFS prices and inability to completely pass it on to
the end consumers will have an adverse impact on the PCBL’s
margins.
Exhibit: CBFS Expense as a %age of Sales
Source: Company, SKP Research
60%
65%
70%
75%
80%
0
3
6
9
12
15
18
FY09 FY10 FY11 FY12
Fig
s in
IN
R B
illio
n
CBFS Expense CBFS Expense as a %age of Sales
� Despite anti-dumping duty on carbon black, import has been
increasing over the past few years. Total imports of carbon black in
India rose to 117,000 MT during FY12 from 70,000 MT in the
earlier year, and the major chunk of imports was from China, at
83,000 MT. As a result, domestic companies resorted to production
cuts during FY12. Thus, the threat of cheap imports always
remains high which may prove detrimental to the interest of PCBL.

Phillips Carbon Black Ltd.
SKP Securities Ltd www.skpmoneywise.com Page 11 of 14
We maintain a BUY rating with a
price target of INR 148.0/share,
reflecting an upside potential of 39.6
percent from current levels
PCBL historically traded in a narrow
band of 3x to 6x on the one year
forward EV/EBITDA basis, despite
high volatility in earnings on account
of CBFS prices
� The carbon black industry is treated as high pollution emitting
industry by the Ministry of Environment and Forest (GOI). The
Central Pollution Control Board has categorized the carbon black
industry under the highly polluting industry (red category) and
companies need to comply with the norms in this regard. Any
negative impact on the same would impact PCBL growth going
forward.
Valuations
At current market price of INR 106/share, PCBL is trading at an
EV/EBITDA of 4.81x and 4.45x FY13E and FY14E EBITDA
respectively. We valued PCBL’s business at FY14E EV/EBITDA
multiple of 5x. Thus, we arrived at a price target of INR 148/share,
implying an upside potential of 39.6 percent in 18 months.
Target EV/EBITDA Multiple 5.0 x
FY14E EBITDA (INR Million)
Target Enterprise Value (INR Million)
Less: FY14E Debt (INR Million)
Less: Minority Interest (INR Million)
Add: FY14E Cash (INR Million)
Target Market Cap (INR Million)
No of Shares (Million)
Target Price Per Share (INR)
67.1
Exhibit: Value based on FY14E EV/EBITDA
Source: SKP Research
148.0
34.5
5,099.8
295.8
8,371.9
13,243.0
2,648.6
One Year Forward EV/EBITDA Band
Exhibit: One Year Forward EV/EBITDA Band
Source: Company, SKP Research
3
5
7
9
11
13
15
17
19
21
Mar-
09
Jul-09
Oct-
09
Jan-1
0
Apr-
10
Jul-10
Oct-
10
Jan-1
1
Apr-
11
Jul-11
Oct-
11
Jan-1
2
Apr-
12
Jul-12
Oct-
12
Jan-1
3
Fig
s. In
IN
R B
illio
n
7x 6x 5x 4x 3x

Phillips Carbon Black Ltd.
SKP Securities Ltd www.skpmoneywise.com Page 12 of 14
At CMP, PCBL is trading at 0.54x
and 0.48x its FY13E and FY14E
book value, respectively
At CMP, the stock is trading at 4.3x
and 3.3x its FY13E and FY14E
earnings, respectively
The company is likely to fund most of
its expansion through internal
accruals
One Year Forward P/Bv Band
Exhibit: One Year Forward P/BV Band
Source: Company, SKP Research
0
50
100
150
200
250
300
Mar-
09
Jul-
09
Oct-
09
Jan-1
0
Apr-
10
Jul-
10
Oct-
10
Jan-1
1
Apr-
11
Jul-
11
Oct-
11
Jan-1
2
Apr-
12
Jul-
12
Oct-
12
Jan-1
3
1.2x 1x 0.8x 0.6x 0.4x
One Year Forward P/E Band
Exhibit: One Year Forward P/E Band
Source: Company, SKP Research
0
50
100
150
200
250
300
Mar-
09
Jul-09
Oct-
09
Jan-1
0
Apr-
10
Jul-10
Oct-
10
Jan-1
1
Apr-
11
Jul-11
Oct-
11
Jan-1
2
Apr-
12
Jul-12
Oct-
12
Jan-1
3
6x 5x 4x 3x 2x
Financial Outlook
To fund most of its expansion through internal accruals
Exhibit: CFO & D/E Ratio
Source: Company, SKP Research
0.30.40.50.60.70.80.91.01.11.2
-2.0
-1.0
0.0
1.0
2.0
3.0
FY
11
FY
12
FY
13E
FY
14E
Fig
s. in
IN
R B
illio
n
Cash Flow from Operations (CFO) D/E (x)

Phillips Carbon Black Ltd.
SKP Securities Ltd www.skpmoneywise.com Page 13 of 14
Exhibit: Balance Sheet
Particulars FY11 FY12 FY13E FY14E Particulars FY11 FY12 FY13E FY14E
Net Sales 16,957.2 21,867.8 23,861.1 27,418.2 Share Capital 332.2 344.7 344.7 344.7
Growth (%) 37.6% 29.0% 9.1% 14.9% Reserve & Surplus 4,760.8 5,727.8 6,418.3 7,315.0
Expenditure 14,744.0 19,796.3 21,613.4 24,769.6 Share Warrants 61.25 - - -
Material Consumed 12,281.7 17,018.0 18,241.8 20,725.4 Shareholders Funds 5,154.2 6,072.4 6,763.0 7,659.7
Power & Fuel Cost 131.1 175.6 179.0 205.6 Secured Loan 3,936.4 4,913.9 5,646.9 6,731.9
Employee Cost 478.2 528.5 596.5 712.9 Unsecured Loan 508.8 1,640.0 1,640.0 1,640.0
Freight Cost 331.1 352.3 400.9 479.8 Total Debt 4,445.2 6,553.9 7,286.9 8,371.9
Admin & Other Exp. 1,521.9 1,721.8 2,195.2 2,645.9 Minority Interest 55.00 67.13 67.13 67.13
EBITDA 2,213.2 2,071.6 2,247.7 2,648.6 Deferred Tax Liability 569.0 728.7 728.7 728.7
EBITDA Margin (%) 13.1% 9.5% 9.4% 9.7% Total Liabilities 10,223.3 13,422.1 14,845.6 16,827.3
Depreciation 385.8 492.5 549.4 586.6
EBIT 1,827.4 1,579.0 1,698.3 2,062.0 Net Block inc Capital WIP 7,847.0 8,444.1 9,675.7 10,181.1
Other Income 209.5 112.1 122.0 131.7 Investments 385.0 376.5 406.6 439.1
Interest Expense 437.5 676.3 692.0 743.8 Current Assets 8,989.2 12,114.4 12,758.6 14,941.6
Profit Before Tax (PBT) 1,599.4 1,014.9 1,128.2 1,449.9 Inventories 2,553.3 3,603.4 3,852.1 4,535.9
Income Tax 480.7 163.1 276.4 351.6 Sundry Debtors 3,625.5 5,473.4 5,542.0 6,477.0
Minority Interest 8.3 4.3 0.0 0.0 Cash & Bank Balance 657.2 152.2 202.9 295.8
Profit After Tax (PAT) 1,127.0 856.1 851.8 1,098.3 Other Current Assets 294.9 188.4 238.6 274.2
Growth (%) -7.8% -24.0% -0.5% 28.9% Loans & Advances 1,858.3 2,697.0 2,923.0 3,358.7
PAT Margins (%) 6.6% 3.9% 3.6% 4.0% Current Liabilities & Prov 6,997.8 7,512.9 7,995.2 8,734.4
Diluted EPS 34.3 25.4 24.7 31.9 Total Assets 10,223.3 13,422.1 14,845.6 16,827.3
Particulars FY11 FY12 FY13E FY14E Particulars FY11 FY12 FY13E FY14E
PBT 1,599.4 1,014.9 1,128.2 1,449.9 Earning Ratios (%)
Depreciation 385.8 492.5 549.4 586.6 EBITDA Margin (%) 13.1% 9.5% 9.4% 9.7%
Interest Provided 356.6 582.8 692.0 743.8 PAT Margins (%) 6.6% 3.9% 3.6% 4.0%
Chg. in Working Capital (213.9) (2,781.8) (111.1) (1,350.8) ROCE (%) 19.1% 13.4% 12.0% 13.0%
Direct Taxes Paid (243.3) (199.8) (276.4) (351.6) ROE (%) 26.9% 15.3% 13.3% 15.2%
Other Non Cash Charges (14.9) (21.6) - - Per Share Data (INR)
Operating Cash Flows 1,869.7 (913.0) 1,982.2 1,077.9 Diluted EPS 34.3 25.4 24.7 31.9
Capital Expenditure (1,546.8) (938.5) (1,781.0) (1,092.0) Cash EPS (CEPS) 45.3 39.0 40.7 48.9
Investments 0.4 - (30.1) (32.5) BVPS 155.2 176.2 196.2 222.2
Others 61.6 60.8 - - Valuation Ratios (x)
Investing Cash Flows (1,484.9) (877.7) (1,811.1) (1,124.5) P/E 4.3 4.4 4.3 3.3
Inc / (Dec) in Debt (782.8) 1,044.9 733.0 1,085.0 Price/BVPS 0.9 0.6 0.5 0.5
Dividend Paid (inc tax) (192.3) (192.1) (161.3) (201.6) EV/Sales 0.5 0.5 0.5 0.4
Interest Paid (443.3) (596.7) (692.0) (743.8) EV/EBITDA 3.9 5.0 4.8 4.5
Others 1,360.6 1,029.2 - - Dividend Yield (%) 3.4% 3.6% 3.8% 4.7%
Financing Cash Flows (57.9) 1,285.4 (120.3) 139.6 Balance Sheet Ratios
Chg. in Cash & Cash Eqv 326.9 (505.4) 50.7 93.0 Debt - Equity 0.9 1.1 1.1 1.1
Opening Cash Balance 330.3 657.2 152.2 202.9 Current Ratio 1.3 1.7 1.6 1.8
Closing Cash Balance 657.2 151.8 202.9 295.8 Fixed Asset Turn. Ratios 2.8 3.2 3.1 3.3
Source: Company Data, SKP Research
Exhibit: Income Statement Figures in INR Million Figures in INR Million
Exhibit: Cash Flow Statement Figures in INR Million Exhibit: Ratio Analysis

Phillips Carbon Black Ltd.
SKP Securities Ltd www.skpmoneywise.com Page 14 of 14
The above analysis and data are based on last available prices and not official closing rates. SKP Research is also available on Bloomberg, Thomson
First Call & Investext Myiris, Moneycontrol, Ticker plant and ISI Securities.
DISCLAIMER: This document has been issued by SKP Securities Ltd (SKP), a stock broker registered with and regulated by Securities & Exchange Board of
India, for the information of its clients/potential clients and business associates/affiliates only and is for private circulation only, disseminated and available
electronically and in printed form. Additional information on recommended securities may be made available on request. This document is supplied to you solely
for your information and no matter contained herein may be reproduced, reprinted, sold, copied in whole or in part, redistributed or passed on, directly or
indirectly, to any other person for any purpose, in India or into any other country without prior written consent of SKP. The distribution of this document in other
jurisdictions may be strictly restricted and/ or prohibited by law, and persons into whose possession this document comes should inform themselves about such restriction and/ or prohibition, and observe any such restrictions and/ or prohibition. If you are dissatisfied with the contents of this complimentary document or
with the terms of this Disclaimer, your sole and exclusive remedy is to stop using the document and SKP shall not be responsible and/ or liable in any manner.
Neither this document nor the information or any opinion expressed therein should be construed as an investment advice or offer to anybody to acquire, subscribe, purchase, sell, dispose of, retain any securities or derivatives related to such securities or an offer to sell or the solicitation of an offer to purchase or subscribe for
any investment or as an official endorsement of any investment. Any recommendation or view or opinion expressed on investments in this document is not intended to constitute investment advice and should not be intended or treated as a substitute for necessary review or validation or any professional advice. The
views expressed in this document are those of the analyst which are subject to change and do not represent to be an authority on the subject. SKP may or may not
subscribe to any and/ or all the views expressed herein. It is the endeavor of SKP to ensure that the analyst(s) use current, reliable, comprehensive information and obtain such information from sources, which the analyst(s) believes to be reliable. However, such information may not have been independently verified by SKP
or the analyst(s). The information, opinions and views contained within this document are based upon publicly available information, considered reliable at the
time of publication, which are subject to change from time to time without any prior notice. The Document may be updated anytime without any prior notice to anybody. SKP makes no guarantee, representation or warranty, express or implied; and accepts no responsibility or liability as to the accuracy or completeness or
correctness of the information in this Report. SKP, its Directors, affiliates and employees do not accept any liability whatsoever, direct or indirect, that may arise
from the use of the information or recommendations herein. Please note that past performance is not necessarily a guide to evaluate future performance. SKP or its
affiliates, may, from time to time render advisory and other services to companies being referred to in this document and receive compensation for the same. SKP
and/or its affiliates, directors and employees may trade for their own account or may also perform or seek to perform investment banking or underwriting services
for or relating to those companies and may also be represented in the supervisory board or on any other committee of those companies or may sell or buy any
securities or make any investment, which may be contrary to or inconsistent with this document. This document should be read and relied upon at the sole
discretion and risk of the reader. The value of any investment made at your discretion based on this document or income there from may be affected by changes in
economic, financial and/ or political factors and may go down as well as up and you may not get back the full or the expected amount invested. Some securities and/ or investments involve substantial risk and are not suitable for all investors. Neither SKP nor its affiliates or their directors, employees, agents or
representatives/associates, shall be responsible or liable in any manner, directly or indirectly, for information, views or opinions expressed in this document or the
contents or any errors or discrepancies herein or for any decisions or actions taken in reliance on the document or inability to use or access our service or this document or for any loss or damages whether direct or indirect, incidental, special or consequential including without limitation loss of revenue or profits or any
loss or damage that may arise from or in connection with the use of or reliance on this document or inability to use or access our service or this document.
SKP Securities Ltd
Contacts Research Sales
Mumbai Kolkata Mumbai Kolkata
Phone 022 2281 9012 033 4007 7000 022 2281 1015 033 4007 7400
Fax 022 2283 0932 033 4007 7007 022 2283 0932 033 4007 7007
E-mail [email protected] [email protected] [email protected]
Member: NSE BSE NSDL CDSL NCDEX* MCX* MCX-SX FPSB *Group Entities
INB/INF: 230707532, BSE INB: 010707538, CDSL IN-DP-CDSL-132-2000, DPID: 021800, NSDL IN-DP-NSDL: 222-2001, DP ID: IN302646, ARN: 0006, NCDEX: 00715, MCX: 31705, MCX-SX: INE 260707532
![Florida Star. (Titusville, Florida) 1902-04-04 [p 8].ufdcimages.uflib.ufl.edu/UF/00/07/59/01/00620/00204.pdfPhillips position MELBOURNE directions enjoyed reason con-tributed enjoyed](https://static.fdocuments.us/doc/165x107/5fbb3dead70908426903e60e/florida-star-titusville-florida-1902-04-04-p-8-phillips-position-melbourne.jpg)