Philips Quarterly Report 20102 Quarterly report Philips Group Net income in millions of euros unless...
26
Quarterly report Q3 2010, Royal Philips Electronics Philips reports third-quarter net income of EUR 524 million, EBITA of EUR 648 million and sales of EUR 6.2 billion • Net income of EUR 524 million, including a gain of EUR 154 million on the sale of NXP shares • EBITA of EUR 648 million, or 10.5% of sales, up from 6.1% last year • Sales up 10% nominally and 1% comparably year-on-year • Emerging markets sales up 19% nominally and 7% comparably year-on-year • Healthcare order intake growth of 7%, including 20% growth in emerging markets • Growth at Lighting and Healthcare tempered by Consumer Lifestyle “The third quarter was another solid quarter for Philips, resulting in net income of EUR 524 million and adjusted EBITA of 10.6%. This has led to an adjusted EBITA in the first nine months of 2010 of 10.1%, exceeding our target for the year and putting us in an excellent position to deliver on one of the main targets of our Vision 2010 strategic plan. In a still fragile economic environment, with weak consumer markets in the developed economies, we posted sales growth of 10% nominal and 1% on a comparable basis. Looking at the performance of our three sectors, both Healthcare and Lighting delivered a good quarter in terms of profitability as well as growth. Consumer Lifestyle improved profitability despite weak demand in some of its markets, with strong sales at Health & Wellness, Personal Care and Domestic Appliances weighed down by lower sales in the rest of the sector. We also continued on our growth path in emerging markets, with 19% nominal and 7% comparable sales growth. This means that we now generate more than one-third of our sales in these markets. Our continued progress in the third quarter confirmed that we are on the right track to become a leading company in health and well-being as outlined in our strategic plan, Vision 2015.” Gerard Kleisterlee, President and CEO of Royal Philips Electronics Forward-looking statements This document contains certain forward-looking statements with respect to the financial condition, results of operations and business of Philips and certain of the plans and objectives of Philips with respect to these items, in particular the sections “Looking ahead” and “Outlook”. Examples of forward-looking statements include statements made about our strategy, estimates of sales growth, future EBITA and future developments in our organic business. By their nature, these statements involve risk and uncertainty because they relate to future events and circumstances and there are many factors that could cause actual results and developments to differ materially from those expressed or implied by these statements. These factors include but are not limited to domestic and global economic and business conditions, the successful implementation of our strategy and our ability to realize the benefits of this strategy, our ability to develop and market new products, changes in legislation, legal claims, changes in exchange and interest rates, changes in tax rates, pension costs and actuarial assumptions, raw materials and employee costs, our ability to identify and complete successful acquisitions and to integrate those acquisitions into our business, our ability to successfully exit certain businesses or restructure our operations, the rate of technological changes, political, economic and other developments in countries where Philips operates, industry consolidation and competition. As a result, Philips’ actual future results may differ materially from the plans, goals and expectations set forth in such forward-looking statements. For a discussion of factors that could cause future results to differ from such forward-looking statements, see the Risk management chapter included in our Annual Report 2009 and the “Risk and uncertainties” section in our semi-annual financial report for the six months ended July 4, 2010. Third-party market share data Statements regarding market share, including those regarding Philips’ competitive position, contained in this document are based on outside sources such as research institutes, industry and dealer panels in combination with management estimates. Where information is not yet available to Philips, those statements may also be based on estimates and projections prepared by outside sources or management. Rankings are based on sales unless otherwise stated. Use of non-GAAP information In presenting and discussing the Philips Group’s financial position, operating results and cash flows, management uses certain non- GAAP financial measures. These non-GAAP financial measures should not be viewed in isolation as alternatives to the equivalent IFRS measures and should be used in conjunction with the most directly comparable IFRS measures. A reconciliation of such measures to the most directly comparable IFRS measures is contained in this document. Further information on non-GAAP measures can be found in our Annual Report 2009. Use of fair-value measurements In presenting the Philips Group’s financial position, fair values are used for the measurement of various items in accordance with the applicable accounting standards. These fair values are based on market prices, where available, and are obtained from sources that are deemed to be reliable. Readers are cautioned that these values are subject to changes over time and are only valid at the balance sheet date. When quoted prices or observable market data do not exist, we estimated the fair values using appropriate valuation models and unobservable inputs. They require management to make significant assumptions with respect to future developments, which are inherently uncertain and may therefore deviate from actual developments. Critical assumptions used are disclosed in our 2009 financial statements. Independent valuations may have been obtained to support management’s determination of fair values. All amounts in millions of euros unless otherwise stated; data included are unaudited. Financial reporting is in accordance with IFRS, unless otherwise stated. This document comprises regulated information within the meaning of the Dutch Financial Markets Supervision Act ‘Wet op het Financieel Toezicht’.
Transcript of Philips Quarterly Report 20102 Quarterly report Philips Group Net income in millions of euros unless...

Quarterly reportQ3 2010, Royal Philips Electronics
Philips reports third-quarter netincome of EUR 524 million, EBITA ofEUR 648 million and sales of EUR 6.2billion
• Net income of EUR 524 million, including a gain of EUR 154million on the sale of NXP shares
• EBITA of EUR 648 million, or 10.5% of sales, up from 6.1% lastyear
• Sales up 10% nominally and 1% comparably year-on-year• Emerging markets sales up 19% nominally and 7% comparably
year-on-year• Healthcare order intake growth of 7%, including 20% growth
in emerging markets• Growth at Lighting and Healthcare tempered by Consumer
Lifestyle
“The third quarter was another solid quarter for Philips, resulting in net incomeof EUR 524 million and adjusted EBITA of 10.6%. This has led to an adjustedEBITA in the first nine months of 2010 of 10.1%, exceeding our target for theyear and putting us in an excellent position to deliver on one of the main targetsof our Vision 2010 strategic plan.
In a still fragile economic environment, with weak consumer markets in thedeveloped economies, we posted sales growth of 10% nominal and 1% on acomparable basis.
Looking at the performance of our three sectors, both Healthcare and Lightingdelivered a good quarter in terms of profitability as well as growth. ConsumerLifestyle improved profitability despite weak demand in some of its markets,with strong sales at Health & Wellness, Personal Care and Domestic Appliancesweighed down by lower sales in the rest of the sector.
We also continued on our growth path in emerging markets, with 19% nominaland 7% comparable sales growth. This means that we now generate more thanone-third of our sales in these markets.
Our continued progress in the third quarter confirmed that we are on the righttrack to become a leading company in health and well-being as outlined in ourstrategic plan, Vision 2015.”
Gerard Kleisterlee, President and CEO of Royal Philips Electronics
Forward-looking statementsThis document contains certain forward-looking statements withrespect to the financial condition, results of operations andbusiness of Philips and certain of the plans and objectives ofPhilips with respect to these items, in particular the sections“Looking ahead” and “Outlook”. Examples of forward-lookingstatements include statements made about our strategy,estimates of sales growth, future EBITA and future developmentsin our organic business. By their nature, these statements involverisk and uncertainty because they relate to future events andcircumstances and there are many factors that could cause actualresults and developments to differ materially from thoseexpressed or implied by these statements.These factors include but are not limited to domestic and globaleconomic and business conditions, the successful implementationof our strategy and our ability to realize the benefits of thisstrategy, our ability to develop and market new products,changes in legislation, legal claims, changes in exchange andinterest rates, changes in tax rates, pension costs and actuarialassumptions, raw materials and employee costs, our ability toidentify and complete successful acquisitions and to integratethose acquisitions into our business, our ability to successfullyexit certain businesses or restructure our operations, the rate oftechnological changes, political, economic and otherdevelopments in countries where Philips operates, industryconsolidation and competition. As a result, Philips’ actual futureresults may differ materially from the plans, goals andexpectations set forth in such forward-looking statements. For adiscussion of factors that could cause future results to differ fromsuch forward-looking statements, see the Risk managementchapter included in our Annual Report 2009 and the “Risk anduncertainties” section in our semi-annual financial report for thesix months ended July 4, 2010.
Third-party market share dataStatements regarding market share, including those regardingPhilips’ competitive position, contained in this document arebased on outside sources such as research institutes, industry anddealer panels in combination with management estimates. Whereinformation is not yet available to Philips, those statements mayalso be based on estimates and projections prepared by outsidesources or management. Rankings are based on sales unlessotherwise stated.
Use of non-GAAP informationIn presenting and discussing the Philips Group’s financial position,operating results and cash flows, management uses certain non-GAAP financial measures. These non-GAAP financial measuresshould not be viewed in isolation as alternatives to the equivalentIFRS measures and should be used in conjunction with the mostdirectly comparable IFRS measures. A reconciliation of suchmeasures to the most directly comparable IFRS measures iscontained in this document. Further information on non-GAAPmeasures can be found in our Annual Report 2009.
Use of fair-value measurementsIn presenting the Philips Group’s financial position, fair values areused for the measurement of various items in accordance withthe applicable accounting standards. These fair values are basedon market prices, where available, and are obtained from sourcesthat are deemed to be reliable. Readers are cautioned that thesevalues are subject to changes over time and are only valid at thebalance sheet date. When quoted prices or observable marketdata do not exist, we estimated the fair values using appropriatevaluation models and unobservable inputs. They requiremanagement to make significant assumptions with respect tofuture developments, which are inherently uncertain and maytherefore deviate from actual developments. Criticalassumptions used are disclosed in our 2009 financial statements.Independent valuations may have been obtained to supportmanagement’s determination of fair values.
All amounts in millions of euros unless otherwise stated; dataincluded are unaudited. Financial reporting is in accordance withIFRS, unless otherwise stated. This document comprisesregulated information within the meaning of the Dutch FinancialMarkets Supervision Act ‘Wet op het Financieel Toezicht’.

2 Quarterly report
Philips GroupNet incomein millions of euros unless otherwise stated
Q3 Q3
2009 2010
Sales 5,621 6,159
EBITA 344 648 as a % of sales 6.1 10.5
EBIT 237 517 as a % of sales 4.2 8.4
Financial income andexpenses (44) 81
Income taxes (56) (77)
Results investments inassociates 39 3
Net income 176 524
Net income -shareholders per commonshare (in euros) - basic 0.19 0.55
Sales by sectorin millions of euros unless otherwise stated
Q3 Q3 % change
2009 2010 nominal comparable
Healthcare 1,821 2,070 14 4
ConsumerLifestyle 2,073 2,094 1 (5)
Lighting 1,646 1,908 16 7
GM&S 81 87 7 2 Philips Group 5,621 6,159 10 1
Sales per market clusterin millions of euros unless otherwise stated
Q31) Q3 % change
2009 2010 nominal comparable
Western Europe 1,962 1,918 (2) (4)
North America 1,587 1,764 11 −
Other mature markets 305 375 23 4
Total mature markets 3,854 4,057 5 (1)
Emerging markets 1,767 2,102 19 7 Philips Group 5,621 6,159 10 1
1) Revised to reflect an adjusted market cluster allocation
Net income• Net income was EUR 348 million higher than in Q3
2009, driven by substantially higher earnings in theoperating sectors, notably Lighting and Healthcare, aswell as higher financial income compared to last year.
• Financial income and expenses were mainly impacted bythe EUR 154 million gain on the sale of the remainingstake in NXP to the Philips UK pension fund.
• The decline in results relating to investments inassociates was largely attributable to last year’s EUR 30million gain on the partial reversal of the TPVimpairment loss recognized in December 2008.
• Despite higher earnings, income tax expenses werelargely at par with Q3 2009, mainly due to higher non-taxable income, reflecting this year's EUR 154 milliongain on the sale of NXP shares, and the release of taxprovisions.
Sales per sector• Sales amounted to EUR 6,159 million, an increase of
10% on a nominal basis and 1% comparably. Currencyeffects had a 8% favorable impact on sales. ExcludingTelevision, Group comparable sales growth was 4%.
• Healthcare sales grew by 14% on a nominal basis. On acomparable basis, sales grew 4%, driven by high single-digit growth in all businesses, except for a modest year-on-year decline at Imaging Systems.
• Consumer Lifestyle nominal sales grew by 1%.Comparable sales declined by 5% year-on-year, as solidgrowth at Health & Wellness, Personal Care andDomestic Appliances was more than offset by salesdeclines in the other businesses. Excluding Television,Consumer Lifestyle comparable sales declined by 1%.
• Lighting nominal sales growth was 16%. On acomparable basis, sales grew by 7%, driven by growth inall businesses, notably double-digit growth at LightingElectronics and 47% growth at Lumileds.
Sales per market cluster• Comparable sales in the mature markets declined by 1%
compared to Q3 2009, mainly due to a sales decline atConsumer Lifestyle. Healthcare mature markets grewby 3%, largely driven by Western Europe.
• Led by China, India, Russia and the ASEAN countries,the emerging markets showed high single-digit growth,predominantly driven by Lighting and Healthcare.
Quarterly report 3
EBITAin millions of euros
Q3 Q3
2009 2010
Healthcare 175 282
Consumer Lifestyle 129 149
Lighting 79 216
Group Management &Services (39) 1 Philips Group 344 648
EBITAas a % of sales
Q3 Q3
2009 2010
Healthcare 9.6 13.6
Consumer Lifestyle 6.2 7.1
Lighting 4.8 11.3
Group Management &Services (48.1) 1.1 Philips Group 6.1 10.5
Restructuring and acquisition-related chargesin millions of euros
Q3 Q3
2009 2010
Healthcare (40) (6)
Consumer Lifestyle (29) (23)
Lighting (42) (17)
Group Management &Services (14) 6 Philips Group (125) (40)
EBITin millions of euros unless otherwise stated
Q3 Q3
2009 2010
Healthcare 110 212
Consumer Lifestyle 126 137
Lighting 40 169
Group Management &Services (39) (1)
Philips Group 237 517 as a % of sales 4.2 8.4
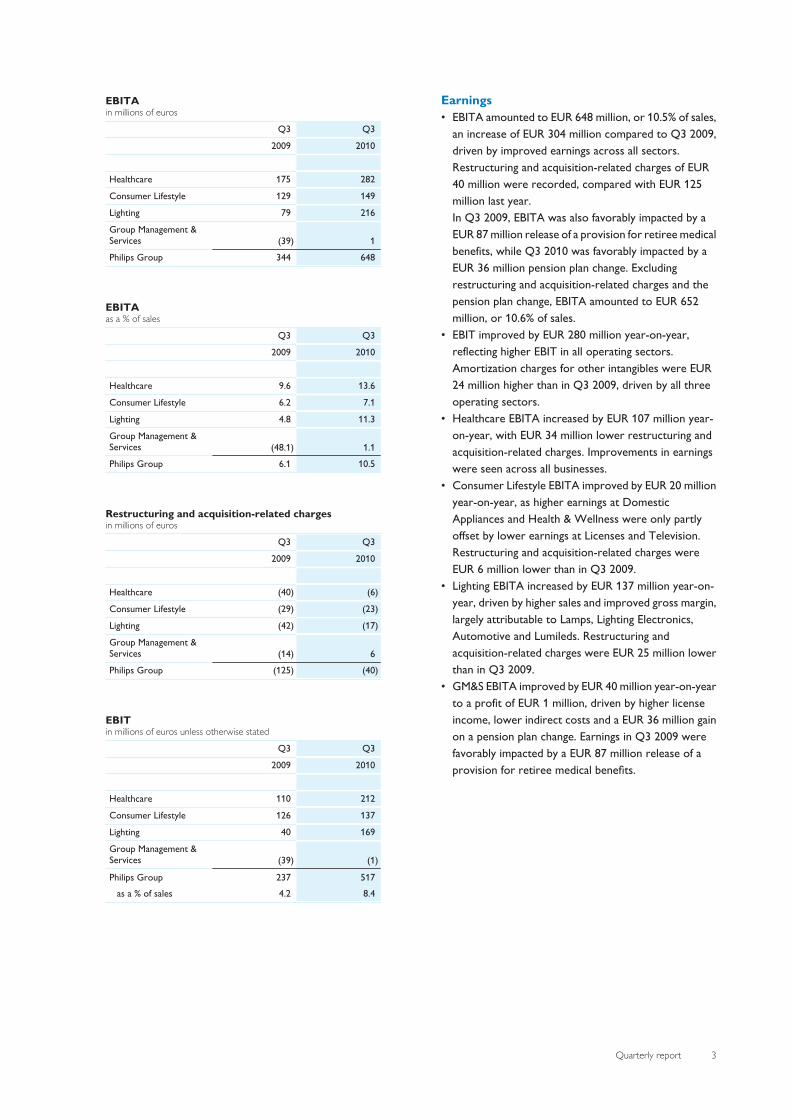
Earnings• EBITA amounted to EUR 648 million, or 10.5% of sales,
an increase of EUR 304 million compared to Q3 2009,driven by improved earnings across all sectors.Restructuring and acquisition-related charges of EUR40 million were recorded, compared with EUR 125million last year. In Q3 2009, EBITA was also favorably impacted by aEUR 87 million release of a provision for retiree medicalbenefits, while Q3 2010 was favorably impacted by aEUR 36 million pension plan change. Excludingrestructuring and acquisition-related charges and thepension plan change, EBITA amounted to EUR 652million, or 10.6% of sales.
• EBIT improved by EUR 280 million year-on-year,reflecting higher EBIT in all operating sectors.Amortization charges for other intangibles were EUR24 million higher than in Q3 2009, driven by all threeoperating sectors.
• Healthcare EBITA increased by EUR 107 million year-on-year, with EUR 34 million lower restructuring andacquisition-related charges. Improvements in earningswere seen across all businesses.
• Consumer Lifestyle EBITA improved by EUR 20 millionyear-on-year, as higher earnings at DomesticAppliances and Health & Wellness were only partlyoffset by lower earnings at Licenses and Television.Restructuring and acquisition-related charges wereEUR 6 million lower than in Q3 2009.
• Lighting EBITA increased by EUR 137 million year-on-year, driven by higher sales and improved gross margin,largely attributable to Lamps, Lighting Electronics,Automotive and Lumileds. Restructuring andacquisition-related charges were EUR 25 million lowerthan in Q3 2009.
• GM&S EBITA improved by EUR 40 million year-on-yearto a profit of EUR 1 million, driven by higher licenseincome, lower indirect costs and a EUR 36 million gainon a pension plan change. Earnings in Q3 2009 werefavorably impacted by a EUR 87 million release of aprovision for retiree medical benefits.
4 Quarterly report
Financial income and expensesin millions of euros
Q3 Q3
2009 2010
Net interest expenses (61) (54)
Sale of NXP shares − 154
TPV option fair valueadjustment 18 (7)
Other (1) (12)
(44) 81
Results relating to investments in associatesin millions of euros
Q3 Q3
2009 2010
TPV value adjustment 30 −
Other 9 3
39 3
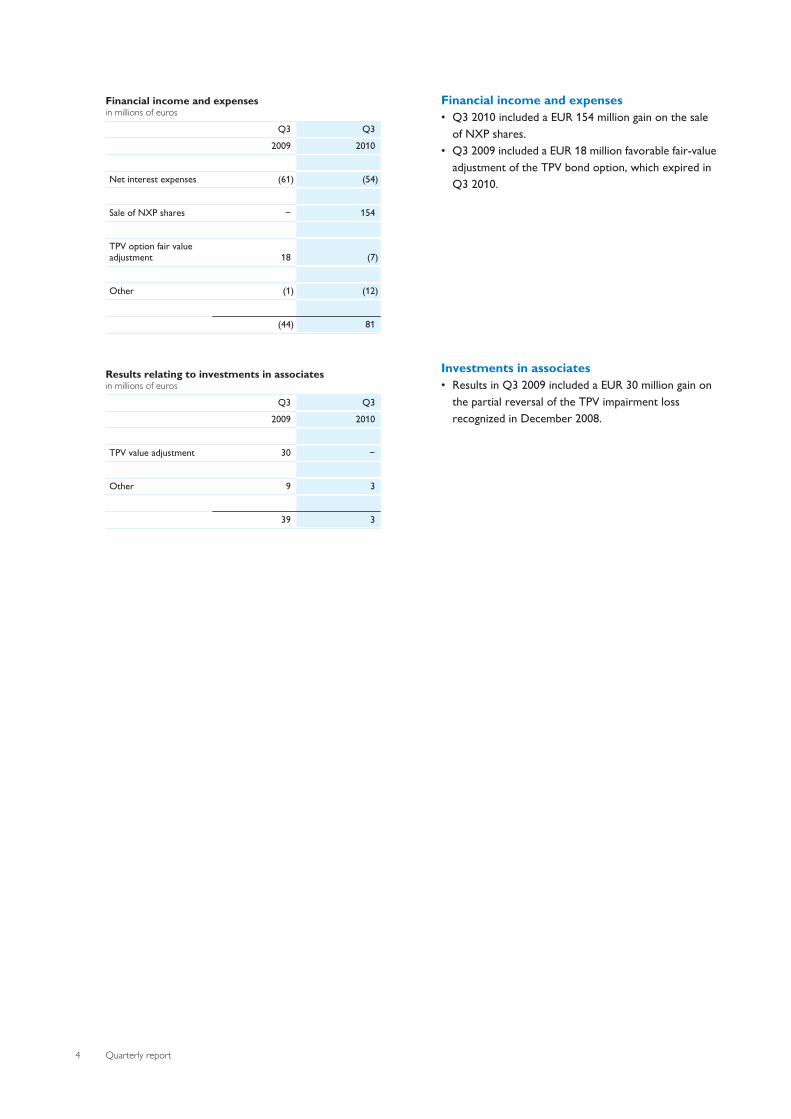
Financial income and expenses• Q3 2010 included a EUR 154 million gain on the sale
of NXP shares.• Q3 2009 included a EUR 18 million favorable fair-value
adjustment of the TPV bond option, which expired inQ3 2010.
Investments in associates• Results in Q3 2009 included a EUR 30 million gain on
the partial reversal of the TPV impairment lossrecognized in December 2008.

Quarterly report 5
Cash balancein millions of euros
Q3 Q3
2009 2010
Beginning cash balance 3,589 4,493
Free cash flow 353 (200)
Net cash flow fromoperating activities 470 8 Net capital expenditures (117) (208)
Acquisitions of businesses (172) (25)
Other cash flow frominvesting activities (36) 172
Treasury sharestransactions 6 13
Changes in debt/other (6) (68)Ending cash balance 3,734 4,385
Cash flows from operating activitiesin millions of euros
600
500
400
300
200
100
0
470
Q3 2009
562
Q2 2010
8
Q3 2010
Gross capital expenditures1)
in millions of euros
200
150
100
50
0
121
Q3 2009
167
Q2 2010
172
Q3 20101) Capital expenditures on property, plant and equipment only
Cash balance• In Q3 2010, the Group cash balance declined by EUR
108 million to EUR 4.4 billion, mainly due to EUR 200million free cash outflow, partly offset by EUR 165million of proceeds from redemption of the TPVconvertible bond.
• In Q3 2009, the cash balance increased by EUR 145million to EUR 3.7 billion, driven by free cash inflow ofEUR 353 million, partly offset by EUR 172 million inpayments for acquisitions, mainly Saeco.
• The transaction related to the transfer of the remainingNXP equity stake to the Philips UK pension fund wascash-neutral.
Cash flows from operating activities• Operating activities led to a cash inflow of EUR 8
million, compared to an inflow of EUR 470 million in Q32009. The year-on-year decline was attributable tohigher working capital requirements, mainlyinventories, partly offset by higher cash earnings.
Gross capital expenditure• Gross capital expenditures on property, plant and
equipment were EUR 51 million higher than in Q3 2009,mainly due to higher investment in equipment atLighting.
6 Quarterly report
Inventoriesas a % of moving annual total sales
20
15
10
5
0
14.5
Q3 2009
15.9
Q2 2010
16.4
Q3 2010
Net debt and group equityin billions of euros
■-group equity--■-net debt20
15
10
5
0
13.4
0.6
4 : 96
Q3 2009
15.8
0.3
2 : 98
Q2 2010
15.8
0.1
1 : 99
Q3 2010
ratio:
Number of employeesin FTEs
120,000
115,000
110,000
105,000
100,000
118,225
Q3 2009
116,590
Q2 2010
117,624
Q3 2010
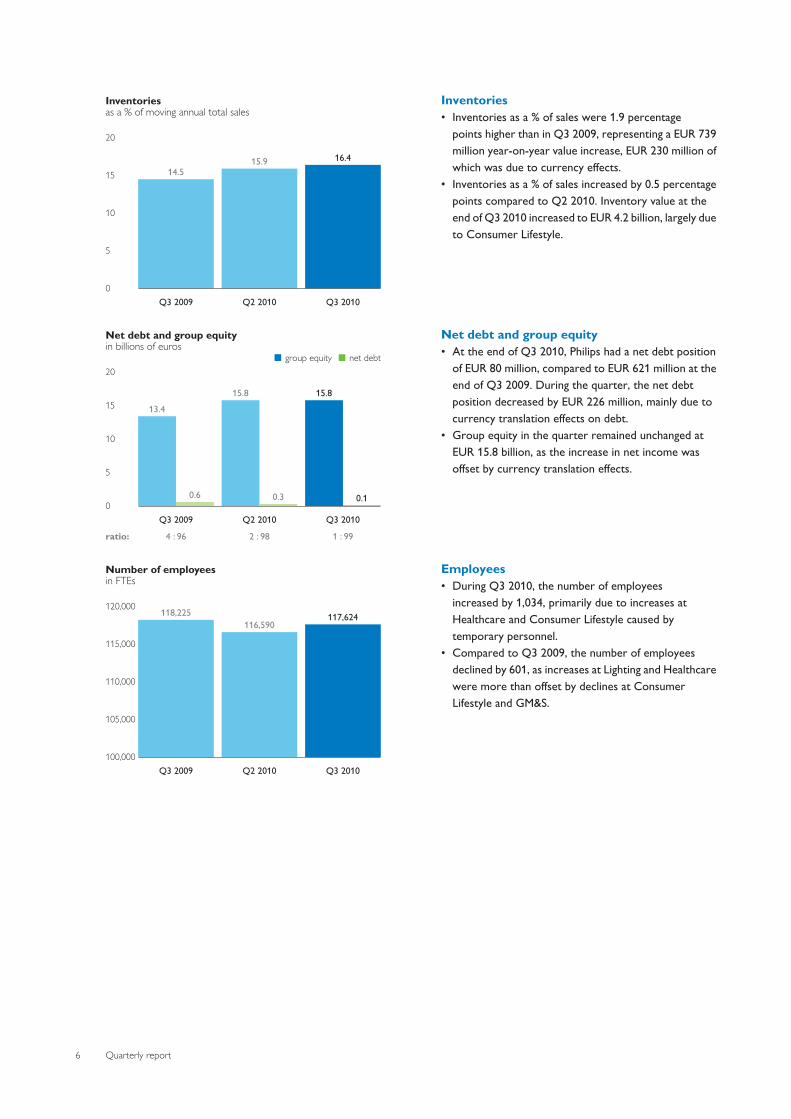
Inventories• Inventories as a % of sales were 1.9 percentage
points higher than in Q3 2009, representing a EUR 739million year-on-year value increase, EUR 230 million ofwhich was due to currency effects.
• Inventories as a % of sales increased by 0.5 percentagepoints compared to Q2 2010. Inventory value at theend of Q3 2010 increased to EUR 4.2 billion, largely dueto Consumer Lifestyle.
Net debt and group equity• At the end of Q3 2010, Philips had a net debt position
of EUR 80 million, compared to EUR 621 million at theend of Q3 2009. During the quarter, the net debtposition decreased by EUR 226 million, mainly due tocurrency translation effects on debt.
• Group equity in the quarter remained unchanged atEUR 15.8 billion, as the increase in net income wasoffset by currency translation effects.
Employees• During Q3 2010, the number of employees
increased by 1,034, primarily due to increases atHealthcare and Consumer Lifestyle caused bytemporary personnel.
• Compared to Q3 2009, the number of employeesdeclined by 601, as increases at Lighting and Healthcarewere more than offset by declines at ConsumerLifestyle and GM&S.

Quarterly report 7
HealthcareKey datain millions of euros unless otherwise stated
Q3 Q3
2009 2010
Sales 1,821 2,070
Sales growth
% nominal 1 14 % comparable (4) 4
EBITA 175 282 as a % of sales 9.6 13.6
EBIT 110 212 as a % of sales 6.0 10.2
Net operating capital (NOC) 8,413 8,771
Number of employees (FTEs) 34,750 34,816
Salesin millions of euros
3,000
2,250
1,500
750
0
1,821
Q3 2009
2,405
Q4 2009
1,821
Q1 2010
2,068
Q2 2010
2,070
Q3 2010
EBITA
■-EBITA in millions of euros----EBITA as a % of sales500
375
250
125
0
40%
30%
20%
10%
0
9.6175
Q3 2009
18.8452
Q4 2009
9.1166
Q1 2010
10.4216
Q2 2010
13.6282
Q3 2010
Business highlights• Philips strengthened its clinical informatics portfolio
with the acquisitions of Wheb Sistemas, a leadingBrazilian provider of clinical information systems, andCDP Medical Ltd, an Israel-based provider of PictureArchiving and Communication Systems (PACS).
• In July, Philips acquired Shanghai Apex Electronics, aleading Chinese manufacturer of ultrasoundtransducers. The acquisition strengthens Philips’portfolio of high-quality transducers specifically aimedat the value segment in emerging markets.
• Philips introduced the IntelliVue MX800 patientmonitoring system, a new dimension in patient care thatprovides immediate access to comprehensive patientinformation directly at the monitor.
• Philips joined Gilde Healthcare III, a new venture capitalfund focused on innovative growth-stage healthcaretechnology companies in Europe and the USA that aredeveloping patient-centric medical technologies andtherapeutics.
Financial performance• Currency-comparable equipment order intake
increased by 7% year-on-year, with notableimprovements at Imaging Systems. Equipment orders inNorth American markets grew by 11%, while orderintake in markets outside North America was 2%higher, including 20% year-on-year growth ofequipment orders in emerging markets.
• Comparable sales increased by 4% year-on-year, withhigher sales in most businesses, notably HomeHealthcare Solutions and Patient Care & ClinicalInformatics. From a regional perspective, comparablesales in North America were broadly in line with Q32009, while in markets outside North America salesgrew by 7%, with key emerging market sales showingdouble-digit growth.
• EBITA increased by EUR 107 million year-on-year toEUR 282 million, or 13.6% of sales. Excludingrestructuring and acquisition-related charges of EUR 6million, EBITA amounted to EUR 288 million, or 13.9%of sales, compared to EUR 215 million, or 11.8% ofsales, in Q3 2009. The improvement was driven by allbusinesses as a result of higher margins from improvedsales and cost management.
• Net operating capital increased by EUR 358 million toEUR 8,771 million, largely due to currency impact.

8 Quarterly report
Looking ahead• At RSNA 2010, Philips will showcase new radiology
solutions, including advances in hybrid imaging, patientsafety and radiology informatics, to improve diagnosisand facilitate collaboration between radiologists andreferring physicians.
• Restructuring and acquisition-related charges in Q42010 are expected to total around EUR 10 million.

Quarterly report 9
Consumer LifestyleKey datain millions of euros unless otherwise stated
Q3 Q3
2009 2010
Sales 2,073 2,094 of which Television 767 703
Sales growth
% nominal (20) 1 % comparable (15) (5)
Sales growth excl. Television
% nominal (10) 7 % comparable (12) (1)
EBITA 129 149
of which Television (26) (31)as a % of sales 6.2 7.1
EBIT 126 137
of which Television (26) (32)as a % of sales 6.1 6.5
Net operating capital (NOC) 1,041 1,298 of which Television (390) (126)
Number of employees (FTEs) 19,569 18,853 of which Television 5,001 4,277
Salesin millions of euros
3,750
3,000
2,250
1,500
750
0
2,073
Q3 2009
2,903
Q4 2009
1,942
Q1 2010
2,183
Q2 2010
2,094
Q3 2010
EBITA
■-EBITA in millions of euros----EBITA as a % of sales300
200
100
0
30%
20%
10%
0
6.2129
Q3 2009
9.2266
Q4 2009
8.5166
Q1 2010
7.9173
Q2 2010
7.1149
Q3 2010
Business highlights• Philips announced the acquisition of Discus Holdings
Inc., the leading manufacturer of professional toothwhitening products. The acquisition broadens Philips'oral healthcare portfolio and provides a strongfoundation for growth in cosmetic dentistry.
• Philips unveiled its most advanced premium electricshaver to date, the SensoTouch 3D, and was identifiedas the most recommended shaving brand in China in asurvey of almost 10,000 Chinese consumers.
• Philips launched the Airfryer, which uses patentedRapid Air technology to circulate hot air around a grillcomponent, creating meals with up to 80% less fat.
• Philips won four European Imaging & Sound Association(EISA) awards this year, including ‘European Green TV2010-2011’ for the Econova for its significantly lowerenergy consumption and body largely made fromrecycled material.
Financial performance• Sales were EUR 21 million higher than in Q3 2009,
though 5% lower on a currency-comparable basis.Double-digit growth was visible at both Health &Wellness and Personal Care, while DomesticAppliances achieved mid-single-digit growth. This wasmore than offset by lower sales in other businesses.Consumer Lifestyle excluding Television grew by 7%nominally.
• Comparable sales at Television were 12% below Q32009, due to different seasonality in 2010 and higherstock in trade following soccer's World Cup.
• EBITA amounted to EUR 149 million, or 7.1% of sales,which was EUR 20 million higher than in Q3 2009,largely driven by sales growth in higher-marginbusinesses and lower restructuring charges.
• Excluding restructuring and acquisition-related charges,EBITA improved from EUR 158 million (or 7.6% ofsales) in Q3 2009 to EUR 172 million (or 8.2% of sales).
• Net operating capital increased by EUR 257 million toEUR 1,298 million, mainly resulting from higherinventory levels partially offset by lower accountsreceivable.
10 Quarterly report
Looking ahead• Philips expects to complete the implementation of its
brand license agreement with display solution providerTPV to license Philips’ TV activities in China in Q4 2010.The agreement will strengthen the presence of thePhilips brand in the Chinese TV market.
• Following a different seasonality in 2010, with a strongyear-on-year increase of license revenues in the firsthalf of the year, license revenue in Q4 is expected to berelatively low.
• Consumer Lifestyle expects to incur restructuring andacquisition-related charges of around EUR 20 million inQ4 2010.

Quarterly report 11
LightingKey datain millions of euros unless otherwise stated
Q3 Q3
2009 2010
Sales 1,646 1,908
Sales growth
% nominal (11) 16 % comparable (13) 7
EBITA 79 216 as a % of sales 4.8 11.3
EBIT 40 169 as a % of sales 2.4 8.9
Net operating capital (NOC) 5,382 5,610
Number of employees (FTEs) 51,636 52,057
Salesin millions of euros
2,250
1,500
750
0
1,646
Q3 2009
1,846
Q4 2009
1,810
Q1 2010
1,859
Q2 2010
1,908
Q3 2010
EBITA
■-EBITA in millions of euros----EBITA as a % of sales300
200
100
0
30%
20%
10%
0
4.879
Q3 2009
4.482
Q4 2009
13.5245
Q1 2010
11.3210
Q2 2010
11.3216
Q3 2010
Business highlights• Philips will supply approximately 60,000 LED luminaires
for London’s 2012 Olympic Village, providing up to 80%energy saving on the electricity consumption for the2,818 homes which will be built as a lasting legacy forEast London after the Games.
• Philips celebrated the production of the one millionthCosmoPolis system, a highly energy-efficient outdoorlighting solution. CosmoPolis systems produce a warmwhite light that provides a superior experience ofperceived residential safety and security.
• Ahead of EU legislation stipulating that all new carmodels must be equipped with daytime running lights,Philips has introduced its LED-based DayLight car lamprange that could reduce the number of fatalitiesresulting from traffic accidents by enhancing cars’visibility to pedestrians and other motorists.
• The city of Madrid has chosen Philips outdoor solutionsto manage more than 200,000 street light-pointsthrough 1,400 cabinets all around the city, thanks to theintelligent controls solutions acquired from Amplex.
Financial performance• Comparable sales were 7% higher year-on-year, driven
by growth across all businesses, mainly Lumileds,Lighting Electronics and Automotive. From ageographic perspective, significant growth was seen inemerging markets, led by China.
• LED sales grew 68% compared to Q3 2009,representing 14% of total Lighting sales. Sales atLumileds grew by 47% year-on-year.
• EBITA, excluding restructuring and acquisition-relatedcharges of EUR 17 million (Q3 2009: EUR 42 million),amounted to EUR 233 million, or 12.2% of sales. Thesubstantial year-on-year EBITA improvement waslargely driven by strong sales growth, a favorableproduct mix and ongoing cost management.
• Net operating capital increased by EUR 228 million toEUR 5,610 million. Excluding currency impact, netoperating capital decreased compared to Q3 2009.
Looking ahead• Restructuring and acquisition-related charges in Q4
2010 are expected to total around EUR 50 million.

12 Quarterly report
Group Management & ServicesKey datain millions of euros unless otherwise stated
Q3 Q3
2009 2010
Sales 81 87
Sales growth
% nominal (22) 7 % comparable (24) 2
EBITA Corporate Technologies (45) (5)
EBITA Corporate & Regional Costs (44) (32)
EBITA Pensions 76 24
EBITA Service Units and Other (26) 14
EBITA (39) 1
EBIT (39) (1)
Net operating capital (NOC) (3,277) (1,348)
Number of employees (FTEs) 12,270 11,898
Salesin millions of euros
150
100
50
0
81
Q3 2009
109
Q4 2009
104
Q1 2010
81
Q2 2010
87
Q3 2010
EBITAin millions of euros
50
0
(50)
(100)
(150)
(39)
Q3 2009(138)
Q4 2009
(73)
Q1 2010
(72)
Q2 2010
1
Q3 2010
Business highlights• Philips increased its brand value by 7% to an estimated
USD 8.7 billion in the annual top-100 global brandsranking by Interbrand; this represents a doubling of thebrand value since the launch of the “sense andsimplicity” brand promise in 2004.
• Philips achieved “supersector leader” ranking in the2010 review of the Dow Jones Sustainability Indexes,reflecting the company’s ongoing commitment tosustainability.
• Philips won eight awards at the iF design awards inChina for its LED lighting and consumer lifestylesolutions, in addition to four awards at ‘2010 China’sMost Successful Design Awards’, also for its consumerlifestyle products.
Financial performance• Sales increased from EUR 81 million in Q3 2009 to
EUR 87 million, largely driven by increased licenserevenues.
• EBITA amounted to EUR 1 million, a EUR 40 millionimprovement year-on-year.
• EBITA was favorably impacted by a EUR 36 millionpension plan change and a EUR 6 million provisionrelease. In Q3 2009, EBITA included a EUR 87 millionfavorable impact of a release of a provision for retireemedical benefits, partially offset by EUR 14 millionrestructuring and acquisition-related charges.
• Excluding the above items, the EBITA improvement wasdriven by higher license income, improved performanceat Assembléon and lower overhead and R&D projectcosts.

Quarterly report 13
OutlookGiven the uncertain economic climate and fragileconsumer confidence in some of our markets, we take acautious view on revenue development in Q4 2010. Weexpect it to be a seasonally strong quarter as our growthbusinesses and growth geographies continue to deliver,albeit counterbalanced by year-end channel inventorymanagement and the continued soft construction market.
We will continue to drive growth initiatives andoperational improvements to further exceed the targetedEBITA, adjusted for restructuring and acquisition-relatedcharges, of 10% for the full-year 2010.
Amsterdam, October 18, 2010 Board of Management

14 Quarterly report
Highlights in the 1st nine monthsThe 1st nine months of 2010
• Comparable sales were 8% higher than in thecorresponding period of 2009, driven by higher salesacross all operating sectors, notably Lighting.
• Compared to the first nine months of 2009, Group EBITAimproved by EUR 1,291 million to 9.3% of sales, largelydriven by higher sales in the operating sectors.
• Financial expenses included a EUR 154 million gain on thesale of NXP shares.
• Net income was EUR 823 million higher than in the firstnine months of 2009, mainly as a result of higher sectorearnings, partly offset by higher income tax expenses.
Net incomein millions of euros unless otherwise stated
January-September 2009 2010
Sales 15,926 18,027
Sales growth
% nominal (15) 13 % comparable (16) 8
EBITA 388 1,679 as a % of sales 2.4 9.3
EBIT 59 1,310 as a % of sales 0.4 7.3
Financial income andexpenses (88) (59)
Income taxes 130 (285)
Results investments inassociates 63 21
Net income (loss) 164 987
Net income (loss) -shareholders per commonshare (in euros) - basic 0.17 1.05
Performance of the Group• Group sales for the first nine months totaled EUR 18
billion, 8% higher than in the corresponding period of2009 on a comparable basis. Improvements were drivenby higher sales across all operating sectors, notablyLighting. Comparable sales growth in emerging marketswas 18%. Order intake at Healthcare increased 12%compared to the first nine months of 2009. Sales atHealthcare showed a comparable increase of 5% year-on-year, while comparable sales at Consumer Lifestyleincreased by 7%. Lighting showed a 12% comparableincrease year-on-year, largely attributable to emergingmarkets.
• Compared to the first nine months of 2009, GroupEBITA improved by EUR 1,291 million to 9.3% of sales,largely driven by higher sales in the operating sectors.Restructuring and acquisition-related charges to dateamounted to EUR 183 million, whereas the same periodlast year included EUR 320 million restructuring andacquisition-related charges. EBITA included a EUR 36million gain on a pension plan change, compared to aEUR 87 million release of a provision for retiree medicalbenefits in the same period last year.
• Financial expenses included a EUR 154 million gain onthe sale of NXP shares, whereas last year included again of EUR 69 million on the sale of LG Display shares,EUR 12 million dividend income from LG Display, aEUR 48 millon gain on the sale of a 17% stake in Pace,and NXP impairment of EUR 48 million.
• Net income was EUR 823 million higher than in the firstnine months of 2009, mainly driven by higher sectorearnings, partly offset by higher income tax expenses.Last year’s income taxes included the recognition of adeferred tax asset for Lumileds and a number of taxsettlements.
• Cash flows from operating activities amounted to EUR598 million, EUR 12 million lower than in the first ninemonths of 2009. Higher earnings were partially offset byhigher working capital outflow, in particular frominventories.
• Net operating capital increased by EUR 2.8 billioncompared to the level at the end of Q3 2009, mainly dueto higher working capital requirements (EUR 1.7billion).

Quarterly report 15
Consolidated statements of incomeall amounts in millions of euros unless otherwise stated
3rd quarter January to September 2009 2010 2009 2010
Sales 5,621 6,159 15,926 18,027
Cost of sales (3,655) (3,824) (10,555) (11,233)
Gross margin 1,966 2,335 5,371 6,794
Selling expenses (1,250) (1,288) (3,664) (3,776)
General and administrative expenses (110) (164) (534) (589)
Research and development expenses (373) (392) (1,163) (1,165)
Other business income 9 29 73 56
Other business expenses (5) (3) (24) (10)
Income from operations 237 517 59 1,310
Financial income 35 173 208 201
Financial expenses (79) (92) (296) (260)
Income (loss) before taxes 193 598 (29) 1,251
Income taxes (56) (77) 130 (285)
Income after taxes 137 521 101 966
Results relating to investments in associates 39 3 63 21
Net income 176 524 164 987
Attribution of net income
Net income attributable to shareholders 174 524 159 983
Net income attributable to non-controlling interests 2 − 5 4
Weighted average number of common shares outstanding (after deduction of treasury shares) during the period (in thousands):
- basic 926,461 945,734 925,001 937,720
- diluted 930,512 954,206 927,889 946,952
Net income (loss) attributable to shareholders
per common share in euros:
- basic 0.19 0.55 0.17 1.05
- diluted 0.19 0.55 0.17 1.04
Ratios
Gross margin as a % of sales 35.0 37.9 33.7 37.7
Selling expenses as a % of sales (22.2) (20.9) (23.0) (20.9)
G&A expenses as a % of sales (2.0) (2.7) (3.4) (3.3)
R&D expenses as a % of sales (6.6) (6.4) (7.3) (6.5)
EBIT 237 517 59 1,310 as a % of sales 4.2 8.4 0.4 7.3
EBITA 344 648 388 1,679 as a % of sales 6.1 10.5 2.4 9.3

16 Quarterly report
Consolidated balance sheetsin millions of euros unless otherwise stated
September 27, December 31, October 3,
2009 2009 2010
Non-current assets:
Property, plant and equipment 3,326 3,252 3,269
Goodwill 7,242 7,362 7,830
Intangible assets excluding goodwill 4,165 4,161 4,135
Non-current receivables 84 85 96
Investments in associates 270 281 181
Other non-current financial assets 850 691 485
Deferred tax assets 1,368 1,243 1,310 Other non-current assets 137 1,543 1,790
Total non-current assets 17,442 18,618 19,096
Current assets:
Inventories 3,417 2,913 4,156
Other current financial assets 122 191 87
Other current assets 567 436 536
Receivables 4,214 3,983 4,191 Cash and cash equivalents 3,734 4,386 4,385
Total current assets 12,054 11,909 13,355
Total assets 29,496 30,527 32,451
Shareholders’ equity 13,345 14,595 15,777 Non-controlling interests 53 49 56
Group equity 13,398 14,644 15,833
Non-current liabilities:
Long-term debt 3,598 3,640 2,778
Long-term provisions 1,747 1,734 1,725
Deferred tax liabilities 150 530 481 Other non-current liabilities 1,796 1,929 1,700
Total non-current liabilities 7,291 7,833 6,684
Current liabilities:
Short-term debt 757 627 1,687
Accounts and notes payable 3,044 2,870 3,317
Accrued liabilities 3,070 3,134 3,577
Short-term provisions 1,187 716 620 Other current liabilities 749 703 733
Total current liabilities 8,807 8,050 9,934
Total liabilities and group equity 29,496 30,527 32,451
Number of common shares outstanding (after deduction of treasury shares) at the endof period (in thousands) 926,687 927,457 946,014
Ratios
Shareholders’ equity per common share in euros 14.40 15.74 16.68
Inventories as a % of sales 14.5 12.6 16.4
Net debt : group equity 4:96 (1):101 1:99
Net operating capital 11,559 12,649 14,331 Employees at end of period 118,225 115,924 117,624

Quarterly report 17
Consolidated statements of cash flowsall amounts in millions of euros
3rd quarter January to September 2009 2010 2009 2010
Cash flows from operating activities:
Net income 176 524 164 987
Adjustments to reconcile net income to net cash provided by (used for) operating activities:
Depreciation and amortization 362 354 1,040 1,041
Impairment of other non-current financial assets and (reversal of) impairment of investments in associates (28) 2 (4) 6
Net gain on sale of assets (3) (169) (127) (187)
Income from investments in associates (10) (5) (11) (21)
Dividends received from investments in associates − 1 34 14
Decrease (increase) in working capital: 194 (435) 98 (655)
Decrease (increase) in receivables and other current assets (490) (72) 131 (107)
Decrease (increase) in inventories (85) (479) 147 (1,072)
Increase (decrease) in accounts payable, accrued and other liabilities 769 116 (180) 524
Increase in non-current receivables/other assets/other liabilities (111) (174) (513) (318)
Decrease in provisions (124) (102) (99) (173)Other items 14 12 28 (96)
Net cash (used for) provided by operating activities 470 8 610 598
Cash flows from investing activities:
Purchase of intangible assets (21) (18) (66) (44)
Expenditures on development assets (43) (48) (129) (157)
Capital expenditures on property, plant and equipment (121) (172) (373) (477)
Proceeds from disposals of property, plant and equipment 68 30 95 77
Cash from (to) derivatives and securities (28) 8 (38) (34)
Purchase of other non-current financial assets − (4) (6) (16)
Proceeds from (disposal of) other non-current financial assets (8) 168 698 182
Purchase of businesses, net of cash acquired (191) (29) (281) (53)Proceeds from sale of interests in businesses 19 4 19 102
Net cash used for investing activities (325) (61) (81) (420)
Cash flows from financing activities:
Decrease (increase) in short-term debt 45 1 (53) 24
Principal payments on long-term debt (11) (21) (35) (58)
Proceeds from issuance of long-term debt 11 16 300 45
Treasury shares transactions 6 13 21 56 Dividend paid − − (634) (296)
Net cash provided by (used for) financing activities 51 9 (401) (229)
Net increase (decrease) in cash and cash equivalents 196 (44) 128 (51)
Effect of change in exchange rates on cash positions (51) (64) (14) 50
Cash and cash equivalents at beginning of period 3,589 4,493 3,620 4,386
Cash and cash equivalents at end of period 3,734 4,385 3,734 4,385
Ratio
Cash flows before financing activities 145 (53) 529 178
Net cash paid during the period for
Pensions (111) (122) (315) (342)
Interest (76) (78) (212) (216)Income taxes (64) (85) (172) (193)
For a number of reasons, principally the effects of translation differences, certain items in the statements of cash flows do not correspond to the differences between the balance sheet amounts for therespective items.

18 Quarterly report
Consolidated statements of changes in equityin millions of euros
January to September 2010
other reserves
com-mon
shares
capitalin ex-
cess ofpar val-
ue
re-tainedearn-
ings
revalu-ation
re-serve
curren-cy trans-
lationdifferen-
ces
unrealizedgain (loss)on availa-
ble-for-sale finan-cial assets
changesin fair
value ofcashflow
hedges total
treas-ury
sharesat cost
totalshare-hold-
ers’equity
non-con-
trollinginter-
ests total
equity
Balance as of December 31, 2009 194 − 15,947 102 (591) 120 10 (461) (1,187) 14,595 49 14,644
Net income 983 983 4 987
Net current period change 18 (12) 397 177 (26) 548 554 554
Reclassifications into income (2) (159) − (161) (161) (161)
Total comprehensive income 1,001 (12) 395 18 (26) 387 1,376 4 1,380
Dividend distributed 3 343 (650) (304) (304)
Movement non-controlling interests 3 3
Re-issuance of treasury shares (49) 10 100 61 61
Share-based compensation plans 42 42 42
Income tax share-basedcompensation plans 7 7 7
3 343 (640) 100 (194) 3 (191)
Balance as of October 3, 2010 197 343 16,308 90 (196) 138 (16) (74) (1,087) 15,777 56 15,833

Quarterly report 19
Sectorsall amounts in millions of euros unless otherwise stated
Sales and income (loss) from operations3rd quarter
2009 2010
sales income from operations sales income from operations
amount as a % of sales amount as a % of sales
Healthcare 1,821 110 6.0 2,070 212 10.2
Consumer Lifestyle* 2,073 126 6.1 2,094 137 6.5
Lighting 1,646 40 2.4 1,908 169 8.9
Group Management & Services 81 (39) (48.1) 87 (1) (1.1)
Inter-sector eliminations 5,621 237 4.2 6,159 517 8.4
* of which Television 767 (26) (3.4) 703 (32) (4.6)
Sales and income (loss) from operationsJanuary to September
2009 2010
sales income from operations sales income from operations
amount as a % of sales amount as a % of sales
Healthcare 5,434 199 3.7 5,959 463 7.8
Consumer Lifestyle* 5,564 61 1.1 6,219 458 7.4
Lighting 4,700 (57) (1.2) 5,577 539 9.7
Group Management & Services 228 (144) (63.2) 272 (150) (55.1)
Inter-sector eliminations 15,926 59 0.4 18,027 1,310 7.3
* of which Television 2,037 (208) (10.2) 2,249 (61) (2.7)

20 Quarterly report
Sectors and main countriesin millions of euros
Sales and total assetssales total assets
January to September September 27, October 3,
2009 2010 2009 2010
Healthcare 5,434 5,959 10,947 11,607
Consumer Lifestyle* 5,564 6,219 3,823 4,043
Lighting 4,700 5,577 6,874 7,330
Group Management & Services 228 272 7,852 9,471 15,926 18,027 29,496 32,451
* of which Television 2,037 2,249 861 1,031
Sales and long-lived assetssales long-lived assets1)
January to September September 27, October 3,
20092) 2010 20092) 2010
Netherlands 597 585 1,215 1,286
United States 4,474 4,666 9,539 9,779
China 1,226 1,453 336 414
Germany 1,311 1,424 292 282
France 978 1,013 125 109
Brazil 590 813 126 144
Japan 445 623 484 578
Other countries 6,305 7,450 2,616 2,642 15,926 18,027 14,733 15,234
1) Includes property, plant and equipment, intangible assets excluding goodwill, and goodwill2) Revised to reflect an adjusted country allocation

Quarterly report 21
Pension costsin millions of euros
Specification of pension costs3rd quarter
2009 2010
Netherlands other total Netherlands other total
Costs of defined-benefit plans (pensions)
Service cost 26 17 43 23 20 43
Interest cost on the defined-benefit obligation 133 95 228 130 102 232
Expected return on plan assets (190) (83) (273) (185) (82) (267)
Prior service cost − 1 1 − (35) (35)
Net periodic cost (income) (31) 30 (1) (32) 5 (27)
Costs of defined-contribution plans
Costs 3 24 27 2 27 29
Total 3 24 27 2 27 29
Costs of defined-benefit plans (retireemedical)
Service cost − − − − − −
Interest cost on the defined-benefit obligation − 9 9 − 4 4
Prior service cost − − − − − −
Curtailment − (87) (87) − − − Net periodic cost − (78) (78) − 4 4
Specification of pension costsJanuary to September
2009 2010
Netherlands other total Netherlands other total
Costs of defined-benefit plans (pensions)
Service cost 80 61 141 69 59 128
Interest cost on the defined-benefit obligation 399 296 695 391 313 704
Expected return on plan assets (569) (256) (825) (557) (258) (815)
Prior service cost − 3 3 − (36) (36)
Net periodic cost (income) (90) 104 14 (97) 78 (19)
Costs of defined-contribution plans
Costs 6 77 83 6 85 91
Total 6 77 83 6 85 91
Costs of defined-benefit plans (retireemedical)
Service cost − 1 1 − 1 1
Interest cost on the defined-benefit obligation − 27 27 − 15 15
Prior service cost − − − − (2) (2)
Curtailment − (87) (87) − − − Net periodic cost − (59) (59) − 14 14

22 Quarterly report
Reconciliation of non-GAAP performance measuresall amounts in millions of euros unless otherwise stated.
Certain non-GAAP financial measures are presented when discussing the Philips Group’s performance. In the following tables, areconciliation to the most directly comparable IFRS performance measure is made.
Sales growth composition (in %)3rd quarter January to September
comparablegrowth
currencyeffects
consolid-ation
changes nominalgrowth
comparablegrowth
currencyeffects
consolid-ation
changes nominalgrowth
2010 versus 2009
Healthcare 4.0 9.8 (0.1) 13.7 4.9 4.9 (0.1) 9.7
Consumer Lifestyle (5.1) 6.4 (0.3) 1.0 7.3 5.0 (0.5) 11.8
Lighting 6.7 8.9 0.3 15.9 12.3 5.6 0.8 18.7
GM&S 2.2 5.2 0.0 7.4 19.5 4.0 (4.2) 19.3 Philips Group 1.5 8.2 (0.1) 9.6 8.1 5.1 0.0 13.2
EBITA (or Adjusted income from operations) to Income from operations (or EBIT)
Philips Group Healthcare Consumer
Lifestyle Lighting GM&S
January to September 2010
EBITA (or Adjusted income from operations) 1,679 664 488 671 (144)
Amortization of intangibles1) (369) (201) (30) (132) (6)
Income from operations (or EBIT) 1,310 463 458 539 (150)
January to September 2009
EBITA (or Adjusted income from operations) 388 396 73 63 (144)
Amortization of intangibles1) (329) (197) (12) (120) − Income from operations (or EBIT) 59 199 61 (57) (144)
1) Excluding amortization of software and product development
Composition of net debt to group equitySeptember 27, December 31, October 3,
2009 2009 2010
Long-term debt 3,598 3,640 2,778
Short-term debt 757 627 1,687
Total debt 4,355 4,267 4,465
Cash and cash equivalents 3,734 4,386 4,385
Net debt (cash) (total debt less cash and cash equivalents) 621 (119) 80
Shareholders’ equity 13,345 14,595 15,777
Non-controlling interests 53 49 56
Group equity 13,398 14,644 15,833
Net debt and group equity 14,019 14,525 15,913
Net debt divided by net debt and group equity (in %) 4 (1) 1
Group equity divided by net debt and group equity (in %) 96 101 99

Quarterly report 23
Reconciliation of non-GAAP performance measures (continued)all amounts in millions of euros
Net operating capital to total assets
Philips Group Healthcare Consumer
Lifestyle Lighting GM&S
October 3, 2010
Net operating capital (NOC) 14,331 8,771 1,298 5,610 (1,348)
Exclude liabilities comprised in NOC:
- payables/liabilities 9,327 2,379 2,295 1,377 3,276
- intercompany accounts − 47 82 71 (200)- provisions 2,345 333 367 250 1,395
Include assets not comprised in NOC:
- investments in associates 181 77 1 22 81
- other current financial assets 87 − − − 87
- other non-current financial assets 485 − − − 485
- deferred tax assets 1,310 − − − 1,310 - cash and cash equivalents 4,385 − − − 4,385
Total assets 32,451 11,607 4,043 7,330 9,471
December 31, 2009
Net operating capital (NOC) 12,649 8,434 625 5,104 (1,514)
Exclude liabilities comprised in NOC:
- payables/liabilities 8,636 2,115 2,155 1,247 3,119
- intercompany accounts − 32 85 62 (179)- provisions 2,450 317 420 324 1,389
Include assets not comprised in NOC:
- investments in associates 281 71 1 11 198
- other current financial assets 191 − − − 191
- other non-current financial assets 691 − − − 691
- deferred tax assets 1,243 − − − 1,243 - cash and cash equivalents 4,386 − − − 4,386
Total assets 30,527 10,969 3,286 6,748 9,524
September 27, 2009
Net operating capital (NOC) 11,559 8,413 1,041 5,382 (3,277)
Exclude liabilities comprised in NOC:
- payables/liabilities 8,659 2,116 2,347 1,130 3,066
- intercompany accounts − 33 78 48 (159)- provisions 2,934 312 356 301 1,965
Include assets not comprised in NOC:
- investments in associates 270 73 1 13 183
- other current financial assets 122 − − − 122
- other non-current financial assets 850 − − − 850
- deferred tax assets 1,368 − − − 1,368 - cash and cash equivalents 3,734 − − − 3,734 Total assets 29,496 10,947 3,823 6,874 7,852

24 Quarterly report
Reconciliation of non-GAAP performance measures (continued)all amounts in millions of euros
Composition of cash flows3rd quarter January to September
2009 2010 2009 2010
Cash flows provided by operating activities 470 8 610 598
Cash flows used for investing activities (325) (61) (81) (420)
Cash flows before financing activities 145 (53) 529 178
Cash flows provided by operating activities 470 8 610 598
Purchase of intangible assets (21) (18) (66) (44)
Expenditures on development assets (43) (48) (129) (157)
Capital expenditures on property, plant and equipment (121) (172) (373) (477)
Proceeds from property, plant and equipment 68 30 95 77
Net capital expenditures (117) (208) (473) (601)
Free cash flows 353 (200) 137 (3)

Quarterly report 25
Philips quarterly statisticsall amounts in millions of euros unless otherwise stated
2009 2010 1st
quarter 2nd
quarter 3rd
quarter 4th
quarter 1st
quarter 2nd
quarter 3rd
quarter 4th
quarter
Sales 5,075 5,230 5,621 7,263 5,677 6,191 6,159 % increase (15) (19) (11) (5) 12 18 10
EBITA (74) 118 344 662 504 527 648 as a % of sales (1.5) 2.3 6.1 9.1 8.9 8.5 10.5
EBIT (186) 8 237 555 389 404 517 as a % of sales (3.7) 0.2 4.2 7.6 6.9 6.5 8.4
Net income (loss) - shareholders (59) 44 174 251 200 259 524 per common share in euros - basic (0.06) 0.05 0.19 0.27 0.22 0.28 0.55
January- March
January- June
January- September
January- December
January- March
January- June
January- September
January- December
Sales 5,075 10,305 15,926 23,189 5,677 11,868 18,027 % increase (15) (17) (15) (12) 12 15 13
EBITA (74) 44 388 1,050 504 1,031 1,679 as a % of sales (1.5) 0.4 2.4 4.5 8.9 8.7 9.3
EBIT (186) (178) 59 614 389 793 1,310 as a % of sales (3.7) (1.7) 0.4 2.6 6.9 6.7 7.3
Net income (loss) - shareholders (59) (15) 159 410 200 459 983 per common share in euros - basic (0.06) (0.02) 0.17 0.44 0.22 0.49 1.05
Net income (loss) from continuingoperations as a % of shareholders’ equity (1.6) (0.2) 1.5 2.7 5.9 6.7 9.3
period ended 2009 period ended 2010
Inventories as a % of sales 13.6 13.7 14.5 12.6 13.9 15.9 16.4
Net debt : group equity ratio 3:97 6:94 4:96 (1):101 1:99 2:98 1:99
Total employees (in thousands) 116 116 118 116 116 117 118
Information also available on Internet, address:www.philips.com/investorrelations

© 2010 Koninklijke Philips Electronics N.V.All rights reserved.
http://www.philips.com/investorrelations