
The Global Wind Atlas: The New Worldwide Microscale Wind ...

Philippines Wind EnergyResource Atlas Development
November 2000 � NREL/CP-500-28903
Dennis Elliott
Presented at the Business and Investment Forum forRenewable Energy and Energy Efficiency in Asia andthe Pacific RegionKuala Lumpur, MalaysiaSeptember 4�7, 2000
National Renewable Energy Laboratory1617 Cole BoulevardGolden, Colorado 80401-3393NREL is a U.S. Department of Energy LaboratoryOperated by Midwest Research Institute •••• Battelle •••• Bechtel
Contract No. DE-AC36-99-GO10337

NOTICEThe submitted manuscript has been offered by an employee of the Midwest Research Institute (MRI), acontractor of the US Government under Contract No. DE-AC36-99GO10337. Accordingly, the USGovernment and MRI retain a nonexclusive royalty-free license to publish or reproduce the publishedform of this contribution, or allow others to do so, for US Government purposes.
This report was prepared as an account of work sponsored by an agency of the United Statesgovernment. Neither the United States government nor any agency thereof, nor any of their employees,makes any warranty, express or implied, or assumes any legal liability or responsibility for the accuracy,completeness, or usefulness of any information, apparatus, product, or process disclosed, or representsthat its use would not infringe privately owned rights. Reference herein to any specific commercialproduct, process, or service by trade name, trademark, manufacturer, or otherwise does not necessarilyconstitute or imply its endorsement, recommendation, or favoring by the United States government or anyagency thereof. The views and opinions of authors expressed herein do not necessarily state or reflectthose of the United States government or any agency thereof.
Available electronically at http://www.doe.gov/bridge
Available for a processing fee to U.S. Department of Energyand its contractors, in paper, from:
U.S. Department of EnergyOffice of Scientific and Technical InformationP.O. Box 62Oak Ridge, TN 37831-0062phone: 865.576.8401fax: 865.576.5728email: [email protected]
Available for sale to the public, in paper, from:U.S. Department of CommerceNational Technical Information Service5285 Port Royal RoadSpringfield, VA 22161phone: 800.553.6847fax: 703.605.6900email: [email protected] ordering: http://www.ntis.gov/ordering.htm
Printed on paper containing at least 50% wastepaper, including 20% postconsumer waste

1
Philippines Wind Energy Resource Atlas Development
Dennis L. ElliottNational Renewable Energy Laboratory
1617 Cole Boulevard, Golden, COUSA
Abstract
This paper describes the creation of a comprehensivewind energy resource atlas for the Philippines. Theatlas was created to facilitate the rapid identificationof good wind resource areas and understanding of thesalient wind characteristics. Detailed wind resourcemaps were generated for the entire country using anadvanced wind mapping technique and innovativeassessment methods recently developed at theNational Renewable Energy Laboratory. Thetechnique uses Geographic Information Systems toproduce high-resolution (1 square kilometer) annualaverage wind resource maps. In addition to theannual average wind resource distribution, theseasonal and diurnal variability and other salientwind characteristics were analyzed. The windmapping results show many areas of good toexcellent wind resource throughout much of thePhilippines, particularly in the northern and centralregions. The total wind electric potential from areaswith good to excellent wind resource isconservatively estimated to be 76,000 megawatts ofinstalled capacity or approximately 195 billionkilowatt hours per year. Even if only a small fractionof this potential can be readily developed, this stillrepresents a substantial wind potential that is muchgreater than estimated in previous studies. Westrongly recommend that wind measurementprograms be conducted to validate the resourceestimates and to refine the wind maps and assessmentmethods where necessary.
Introduction
The Philippines wind mapping and assessmentproject was initiated to define the wind resourceavailability and to facilitate and accelerate the use ofwind energy technologies�both for utility-scalegeneration and off-grid wind energy applications�inthe Philippines. This major project was the first of itskind undertaken for the Philippines. The key to thesuccessful completion of the project was acomputerized wind resource mapping techniquerecently developed at the National Renewable EnergyLaboratory (NREL), a U. S. Department of Energy(DOE) laboratory. The technique uses Geographic
Information Systems (GIS) software to produce high-resolution (1 square kilometer [km2]) wind resourcemaps.
This project evolved through the cooperation andassistance of Winrock International and severalPhilippine agencies. Upon learning of NREL�sadvanced wind mapping capability, the WinrockInternational Philippines Renewable Energy ProjectSupport Office (REPSO) and Preferred Energy, Inc.,worked with other interested parties in thePhilippines to propose and fund the development of anational Wind Energy Resource Atlas. The PhilippineCouncil for Industry and Energy Research andDevelopment, of the Department of Science andTechnology, and the Philippines National OilCompany each provided funding for the studythrough Winrock International. DOE also providedsignificant funding for the development of the windenergy resource atlas, and the U.S. Agency forInternational Development supported the overallcoordination and data gathering for the wind atlasdevelopment effort. The Philippines National PowerCorporation (NPC) supported the project bycontributing wind-monitoring data collected at 14prospective wind energy sites and by providing othertechnical assistance.
Winrock International and REPSO had the leadresponsibility in administering this project and incollaborating with the Philippine organizations andNREL on project activities. NREL had the technicallead for the wind resource analysis and mappingactivities. The primary goal was to develop detailedwind resource maps for all regions of the Philippinesand to produce a comprehensive wind resource atlasdocumenting the mapping results.
The document Wind Energy Resource Atlas of thePhilippines (Elliott et al. 1999) presents the windresource analysis and mapping results for thePhilippines project. The wind resource maps werecreated at NREL using its recently developed, GIS-based wind resource assessment system. In additionto the Philippines, NREL has applied its new windmapping system to produce wind resourceassessments of the Dominican Republic (Elliott

2
1999) and Mongolia (Elliott et al. 1998), and specificregions of Chile, China, Indonesia, Mexico, and theUnited States (Schwartz 1999).
Mapping System and Methodology
NREL has been developing its GIS-based windresource mapping technique since 1996. Thistechnique replaces the manual analysis techniquesemployed in previous mapping efforts, such as theWind Energy Resource Atlas of the United States(Elliott et al. 1987). It produces wind maps thatreflect a more consistent and detailed analysis of thewind resource distribution throughout a region.
At present, the wind mapping system takes a strictlyempirical, analytical approach to determine the levelof wind resource as a particular location. It does notuse explicit atmospheric boundary layer equations orgeostrophic adjustment equations as other wind-flowmodels do. The mapping system is designed todisplay regional (rather than local or micrositing)distributions of the wind resource to a spatialresolution of 1 km2. The detailed maps are intendedto facilitate the rapid identification of the mostfavorable wind resource areas within a region.
The meteorological assumption that there areempirical relationships in many parts of the worldamong the free-air (higher than 100-200 metersabove ground) speed, the wind speed over the ocean(where applicable), and the distribution of the windresource over land areas is the basis of NREL�stechnique. NREL uses a �top down� method toadjust much of the available wind data. That is tosay, NREL takes the free-air wind speed profile forheights up to 3000 meters above the surface andadjusts these data to produce a wind power profile forthe lowest few hundred meters above the surface.The prime advantage of this method is that NRELcan produce a useful wind resource map withouthaving high quality surface wind data for the studyregion. Years of work at NREL have found manyproblems with the available land-based surface winddata collected at meteorological stations around theworld. Examples of these problems are described inprevious publications (Schwartz and Elliott 1995).Problems include a lack of information aboutobservation procedures and anemometer hardware,height, exposure, and maintenance history. Ingeneral, available surface wind data in much of theworld are not reliable or abundant enough to usedirectly as input in the wind mapping system.
NREL�s �top down� approach requires a criticalanalysis of the available climatic data sets in the
study area. Graphical and tabular wind characteristicproducts generated from the raw data need to becross-referenced to understand the prevalent wind-flow patterns in the study area and salient windcharacteristics, including the seasonal and diurnalvariability. The ultimate goal of the analysis is tocreate a conceptual model of the physicalmechanism(s) that cause the wind to blow in aparticular region. The conceptual model guides thedevelopment of the empirical relationships that arethe basis of the wind power calculation algorithmsand enables meteorological input into the model to beas precise as possible. The accuracy of the final windmap is highly dependent on the precision of the inputdata. A description of the meteorological data sets,details on the digital elevation data used by themapping system, and formats of the meteorologicalinput can be found in previous publications (Elliottand Schwartz 1997, 1998; Schwartz and Elliott1997).
The final meteorological inputs to the mappingsystem are vertical profiles of wind power density,wind power roses (the percentage of wind power bydirection sector), and the ocean wind power density(where appropriate). The GIS model determines anyrequired adjustments to these composite distributionsfor each 1-km2 grid cell. The factors that have thegreatest influence on the adjustment for a particulargrid cell are the topography in the vicinity of the gridcell and a combination of the absolute and relativeelevation of the grid cell. The primary output of themapping system is a color-coded map containing theestimated wind power density, and equivalent windspeed, for each individual grid cell.
Philippines Application
Surface, satellite, and upper-air data were assembled,processed, and analyzed for the Philippines. Thesedata sets included information provided by thePhilippine Atmospheric, Geophysical, andAstronomical Services Administration, NPC, datasets from the U.S. National Climatic Data Center,U.S. National Center for Atmospheric Research, andother U.S. sources. The satellite data sets of derived10-meter (m) wind speeds over ocean areas wereextremely useful in this analysis because of the largeexpanse of ocean surrounding the archipelago and thelimited number and value of land-based observations.We applied NREL�s mapping system to generate thewind resource estimates throughout the Philippines.To portray the mapping results, the Philippinearchipelago was divided into 13 regions (see Figure1). Each region covered an area approximately 300km by 300 km. The regional divisions were

3

4
determined principally on the geography of thearchipelago and the desire to maintain the same mapscale for each region.
A combination of wind characteristics helpsdetermine the suitability of the wind energy resourcein a particular area. Factors such as the annual andmonthly average wind speeds and the seasonal anddiurnal wind patterns affect the suitability of an areafor development. In general, locations in thePhilippines with an annual average wind speed of 6.5to 7 meters per second (m/s) or greater at turbine hubheight are the most suitable for utility grid-connectedwind energy systems. Rural power applications areusually viable at lower wind speeds (5 to 6 m/s), andin some cases, at wind speeds as low as 4.5 m/s.
The average wind speed is not the best indicator ofthe resource. Instead, the level of the wind resourceis often defined in terms of the wind-power-densityvalue, expressed in watts per square meter (W/m2).This value incorporates the combined effects of thewind speed frequency distribution and thedependence of the wind power on air density and thecube of the wind speed. Thus, six wind powerclassifications, based on ranges of wind-power-density values, were established in each of twocategories�one for utility-scale applications, rangingfrom marginal to excellent, and one for rural powerapplications, ranging from moderate to excellent.This classification scheme for the Philippines ispresented in Table 1.
For the Philippines, we chose the 30-m height aboveground as a compromise hub height between largeutility-scale wind turbines (which may range between30 m to 60 m or higher) and small wind turbines(which may range between 15 m and 30 m) for ruralpower applications. Wind power is calculated onlyfor those grid cells that meet certain exposure andslope requirements. As a result, only the most
favorable wind resource areas are highlighted. Forexample, a grid cell is excluded if there is majorblocking of the ambient wind flow by local terrainfeatures. A grid cell must be exposed to at least 70%of the ambient wind flow to be included in the windpower calculations. A grid cell can also be excludedif the slope of the terrain is too steep. To beincluded, the slope in the grid cell must not exceed20%. The wind resource values are estimates for lowsurface roughness (e.g., grassland with no majorobstructions, such as trees or buildings).
Wind Mapping Results and Salient WindCharacteristics
The wind resource in the Philippines is stronglydependent on latitude, elevation, and proximity to thecoastline. In general, the best wind resource, on anannual average basis, is in the northern and centralregions of the country and primarily on hilltops, ridgecrests, and coastal locations that have excellentexposure to the prevailing winds.
The wind mapping results show many areas of good-to-excellent wind resource for utility-scaleapplications and excellent wind resource for villagepower applications, particularly in the northern andcentral regions of the Philippines. The best windresources are found in six regions: (1) the Batanesand Babuyan Islands north of Luzon; (2) thenorthwest tip of Luzon (Ilocos Norte); (3) the higherinterior terrain of Luzon, Mindoro, Samar, Leyte,Panay, Negros, Cebu, Palawan, eastern Mindanao,and adjacent islands; (4) well-exposed east-facingcoastal locations from northern Luzon southward toSamar; (5) the wind corridors between Luzon andMindoro (including Lubang Island); and (6) betweenMindoro and Panay (including the Semirara Islandsand extending to the Cuyo Islands.
Table 1. Wind Power Classification for the Philippines Atlas
Class Resource PotentialUtility Rural
Wind PowerDensity (W/m2)@ 30 m
Wind Speed (a)
(m/s) @ 30 m
1 Marginal Moderate 100-200 4.4 � 5.62 Moderate Good 200-300 5.6 � 6.43 Good Excellent 300-400 6.4 � 7.04 Excellent Excellent 400-600 7.0 � 8.05 Excellent Excellent 600-800 8.0 � 8.86 Excellent Excellent 800-1200 8.8 � 10.1
(a) Mean wind speed is estimated assuming a Weibull distribution of wind speeds with a shape factor (k) of 2.0 and standard sea-level airdensity. The actual mean wind speed may differ from these estimated values by as much as 20 percent, depending on the actual wind speeddistribution (or Weibull k value) and elevation above sea level.

5
Figure 2 shows the annual average wind resourcemap for the northern part of Luzon. In this region,the best wind resource areas are dispersed throughoutmuch of the region and primarily found on exposedhilltops and ridge crests and some of the coastalareas. High-quality wind measurement data useful invalidation of the modeled estimates are quite sparsein this region and also throughout the Philippines.However, wind data were available from NPC forseveral sites where 30-m towers were installed inIlocos Norte in the northwestern part of northernLuzon and one ridge-crest site in the MountainProvince. Data from these sites verified the existenceof the good-to-excellent wind resource predicted byNREL�s model. The model confirms the generallylow to marginal wind resource in areas where dataare available from meteorological stations. Althougha few meteorological stations are located in areas ofgood wind resource, they are mostly located in areasof low wind resource.
In the atlas, all the wind resource maps are in color tofacilitate identification of areas and resource values.Also, a political base map and an elevation map, doneon the same scale as the wind resource map, areincluded in the atlas to allow the user to relate thewind resource features to the political andtopographic features.
A CD-ROM version of the atlas was also produced,which provides the added feature of allowing the userto zoom-in and enlarge the map features for anyselected area. For example, Figure 3 shows anenlargement for the northern portion of Ilocos Nortein the northwestern part of northern Luzon. The 1-km2 grid cells are easily discernible in this map.Also of interest is the large spatial variability in thewind resource estimates. We believe this degree ofspatial detail is most useful in identifying prospectiveareas for wind measurement and potential windenergy developments. However, the terrain and windresource can vary significantly within a 1-km2 area,especially in complex terrain. The wind powerestimate for a particular grid cell may not apply to allareas within a grid. Therefore, the maps are notintended for micrositing purposes.
The seasonal variability of the wind resource dependson several factors, including proximity to coastlineand exposure to ocean winds, elevation above sealevel and surrounding terrain, and geographiclocation. Throughout much of the Philippines, thehighest wind resource at exposed locations with goodwind resource occurs from November throughFebruary. This period is often referred to as thenortheast monsoon season, because the prevailing
direction of the strongest winds are typically fromnortheast. The lowest wind resource generally occursfrom April to September, and prevailing winds fromthe southwest are more frequent during this period(particularly from June to August). However, thenortheast winds are substantially stronger than thesouthwest winds throughout most of the Philippines,so, good exposure to the northeast winds is mostimportant. There are some regional differences in theseasonal variability. For example, in the northernPhilippines, the months with the highest windresource are October through February. In much ofthe central and southern Philippines, Novemberthrough March are the months with the highest windresource. Two areas of the Philippines (thesoutheastern Mindanao coast and the western coast ofPalawan) have a relatively high wind resource fromJune through September, largely because of strongersouthwest winds in these areas.
The diurnal (time-of-day) variation of the windresource is influenced mostly by site elevation andproximity to the ocean. The wind resource atrelatively low-elevation inland areas (with respect tosurrounding areas) is typically highest during latemorning and afternoon and is lowest from late nightto early morning. In most coastal areas, where land-sea breeze effects and other land-based influences areprominent, the seasonal and diurnal variations of thewind resource are usually similar to those for inlandareas. Coastal points on capes and peninsulas orsmall islands that are well exposed to the oceanwinds usually exhibit only small diurnal variations inthe wind resource, as these areas are not significantlyinfluenced by land-sea breeze flows and other typesof land-based effects on the wind flow. Exposedridge crests typically have the highest speeds duringthe night and early morning hours and lowest duringmidday. This diurnal characteristic was verified bydata from a ridge-crest site in the Mountain Provinceof northern Luzon, where NPC had installed a windmeasurement system.
Wind Electric Potential
The assumptions and methods for converting thewind resource to wind energy potential were basedon those in the report Renewable Energy TechnologyCharacterizations (DeMeo and Galdo 1997) and arelisted at the bottom of Table 2. Each grid cellincluded in the wind power calculations has anannual average wind power density, in watts persquare meter (W/m2) at a 30-m height. We developedan equation to compute the total net annual energydelivery for grid cells with an annual average windpower density of 300 W/m2 or greater (good to

6

7
8
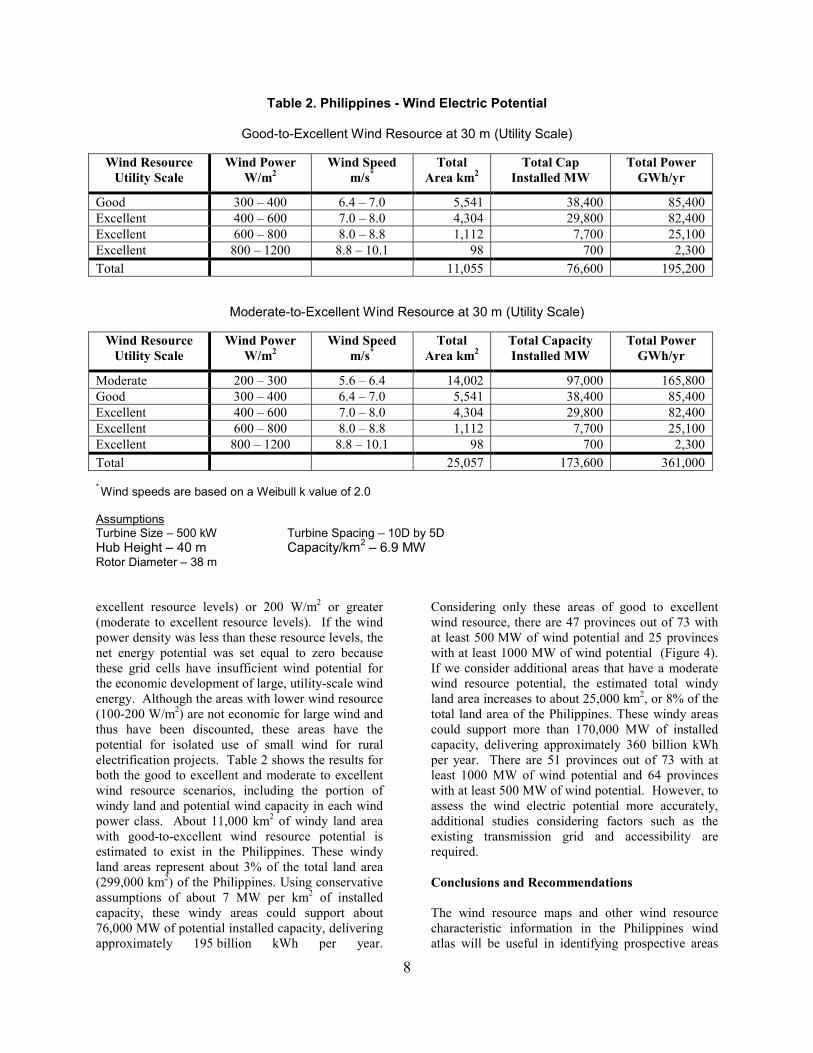
Table 2. Philippines - Wind Electric Potential
Good-to-Excellent Wind Resource at 30 m (Utility Scale)
Wind ResourceUtility Scale
Wind PowerW/m2
Wind Speedm/s*
TotalArea km2
Total CapInstalled MW
Total PowerGWh/yr
Good 300 � 400 6.4 � 7.0 5,541 38,400 85,400Excellent 400 � 600 7.0 � 8.0 4,304 29,800 82,400Excellent 600 � 800 8.0 � 8.8 1,112 7,700 25,100Excellent 800 � 1200 8.8 � 10.1 98 700 2,300Total 11,055 76,600 195,200
Moderate-to-Excellent Wind Resource at 30 m (Utility Scale)
Wind ResourceUtility Scale
Wind PowerW/m2
Wind Speedm/s*
TotalArea km2
Total CapacityInstalled MW
Total PowerGWh/yr
Moderate 200 � 300 5.6 � 6.4 14,002 97,000 165,800Good 300 � 400 6.4 � 7.0 5,541 38,400 85,400Excellent 400 � 600 7.0 � 8.0 4,304 29,800 82,400Excellent 600 � 800 8.0 � 8.8 1,112 7,700 25,100Excellent 800 � 1200 8.8 � 10.1 98 700 2,300Total 25,057 173,600 361,000
* Wind speeds are based on a Weibull k value of 2.0
AssumptionsTurbine Size � 500 kW Turbine Spacing � 10D by 5DHub Height � 40 m Capacity/km2 � 6.9 MWRotor Diameter � 38 m
excellent resource levels) or 200 W/m2 or greater(moderate to excellent resource levels). If the windpower density was less than these resource levels, thenet energy potential was set equal to zero becausethese grid cells have insufficient wind potential forthe economic development of large, utility-scale windenergy. Although the areas with lower wind resource(100-200 W/m2) are not economic for large wind andthus have been discounted, these areas have thepotential for isolated use of small wind for ruralelectrification projects. Table 2 shows the results forboth the good to excellent and moderate to excellentwind resource scenarios, including the portion ofwindy land and potential wind capacity in each windpower class. About 11,000 km2 of windy land areawith good-to-excellent wind resource potential isestimated to exist in the Philippines. These windyland areas represent about 3% of the total land area(299,000 km2) of the Philippines. Using conservativeassumptions of about 7 MW per km2 of installedcapacity, these windy areas could support about76,000 MW of potential installed capacity, deliveringapproximately 195 billion kWh per year.
Considering only these areas of good to excellentwind resource, there are 47 provinces out of 73 withat least 500 MW of wind potential and 25 provinceswith at least 1000 MW of wind potential (Figure 4).If we consider additional areas that have a moderatewind resource potential, the estimated total windyland area increases to about 25,000 km2, or 8% of thetotal land area of the Philippines. These windy areascould support more than 170,000 MW of installedcapacity, delivering approximately 360 billion kWhper year. There are 51 provinces out of 73 with atleast 1000 MW of wind potential and 64 provinceswith at least 500 MW of wind potential. However, toassess the wind electric potential more accurately,additional studies considering factors such as theexisting transmission grid and accessibility arerequired.
Conclusions and Recommendations
The wind resource maps and other wind resourcecharacteristic information in the Philippines windatlas will be useful in identifying prospective areas

9
10
for wind-energy applications. However, very limiteddata of sufficient quality were available to validatethe wind resource estimates. Therefore, we stronglyrecommended that wind measurement programs beconducted to validate the resource estimates and torefine the wind maps and assessment methods wherenecessary. An expanded wind measurement activityis underway by NPC, in collaboration with NREL, tocollect wind data and monitor the wind resource inareas where wind energy projects are beingconsidered. The Philippines wind atlas has beenvaluable in identifying these areas, and 14 new siteshave been identified where wind measurementsystems were recently installed. We hope that thisactivity and many others that benefit from thePhilippines atlas maps and information will lead tomany successful wind energy projects in thePhilippines. We also hope that other countries willpursue the development of these types of windresource maps and atlases to facilitate thedevelopment of wind energy projects in theircountries.
Acknowledgements
I would like to thank Marc Schwartz, Ray George,Steve Haymes, Donna Heimiller, and George Scott ofNREL�s wind resource assessment group, and EdMcCarthy of Wind Economics and Technology, Inc.,for their contributions to software development, dataprocessing and analysis, GIS mapping applications,and preparation of the Philippines atlas. This paperwas written at the National Renewable EnergyLaboratory in support of the U.S. Department ofEnergy under contract number DE-AC36-98GO10337.
References
DeMeo, E.A., Galdo, J.F. Renewable EnergyTechnology Characterizations, Office of UtilityTechnologies, Energy Efficiency and RenewableEnergy, U.S. Department of Energy, WashingtonD.C., 1997.
Elliott, D.L. �Dominican Republic Wind EnergyResource Atlas Development�, NREL/CP-500-27032, National Renewable Energy Laboratory,Golden, Colorado, 1999.
Elliott, D.L.; Chadraa, B.; Natsagdorj, L. �MongoliaWind Resource Assessment Project�, NREL/CP-500-25148, National Renewable Energy Laboratory,Golden, Colorado, 1998.
Elliott, D.L.; Holladay, C.G.; Barchet, W.R.; Foote,H.P.; and Sandusky, W.F.; Wind Energy ResourceAtlas of the United States, Solar Energy ResearchInstitute, Golden, Colorado, 1987.
Elliott, D.L; Schwartz, M.N. �Recent WindResource Characterization Activities at the NationalRenewable Energy Laboratory,� Windpower�97Proceedings, Washington, D.C., American WindEnergy Association, pp. 417-423, 1997.
Elliott, D.L.; Schwartz, M.N. �Validation ofRegional Wind Resource Predictions in the NorthernGreat Plains,� Windpower�98 Proceedings,Washington, D.C., American Wind EnergyAssociation, pp. 333-341, 1998.
Elliott, D. L.; Schwartz, M.N.; George, R.; Haymes,S.; Heimiller, D.; Scott, G.; McCarthy, E. WindEnergy Resource Atlas of the Philippines, NationalRenewable Energy Laboratory, Golden, Colorado,1999 (draft).
Schwartz, M.N. �Wind Resource Estimation andMapping at the National Renewable EnergyLaboratory�, NREL/CP-500-26245, NationalRenewable Energy Laboratory, Golden, Colorado,1999.
Schwartz, M.N.; Elliott, D.L. �The Integration ofClimatic Data Sets for Wind Resource Assessment�,Preprints, 10th Conference on Applied Climatology,Reno, Nevada, pp. 368-372. 1997.
Schwartz, M.N.; Elliott, D.L. �Mexico WindResource Assessment Project�, NREL/TP-441-7809,National Renewable Energy Laboratory, Golden,Colorado, 1995


