Philippines Trarisport Sector Review - World Bank€¦ · Philippines Trarisport Sector Review...
74
Report No. 7098-PH Philippines Trarisport Sector Review March 31,1988 Intrastructure Division Country Department II Asia Region FOR OFFICiAL USEONLY Document of the World Bank This document hasa restricted distribution and may be usedby recipients only in the performance of their official duties. Its contents rnay not otherwise be disclosedwith out World Bankauthorization. Public Disclosure Authorized Public Disclosure Authorized Public Disclosure Authorized Public Disclosure Authorized Public Disclosure Authorized Public Disclosure Authorized Public Disclosure Authorized Public Disclosure Authorized
-
Upload
vuonghuong -
Category
Documents
-
view
215 -
download
0
Transcript of Philippines Trarisport Sector Review - World Bank€¦ · Philippines Trarisport Sector Review...
Report No. 7098-PH
PhilippinesTrarisport Sector Review
March 31,1988
Intrastructure DivisionCountry Department IIAsia Region
FOR OFFICiAL USE ONLY
Document of the World Bank
This document has a restricted distribution and may be used by recipientsonly in the performance of their official duties. Its contents rnay not otherwisebe disclosed with out World Bank authorization.
Pub
lic D
iscl
osur
e A
utho
rized
Pub
lic D
iscl
osur
e A
utho
rized
Pub
lic D
iscl
osur
e A
utho
rized
Pub
lic D
iscl
osur
e A
utho
rized
Pub
lic D
iscl
osur
e A
utho
rized
Pub
lic D
iscl
osur
e A
utho
rized
Pub
lic D
iscl
osur
e A
utho
rized
Pub
lic D
iscl
osur
e A
utho
rized
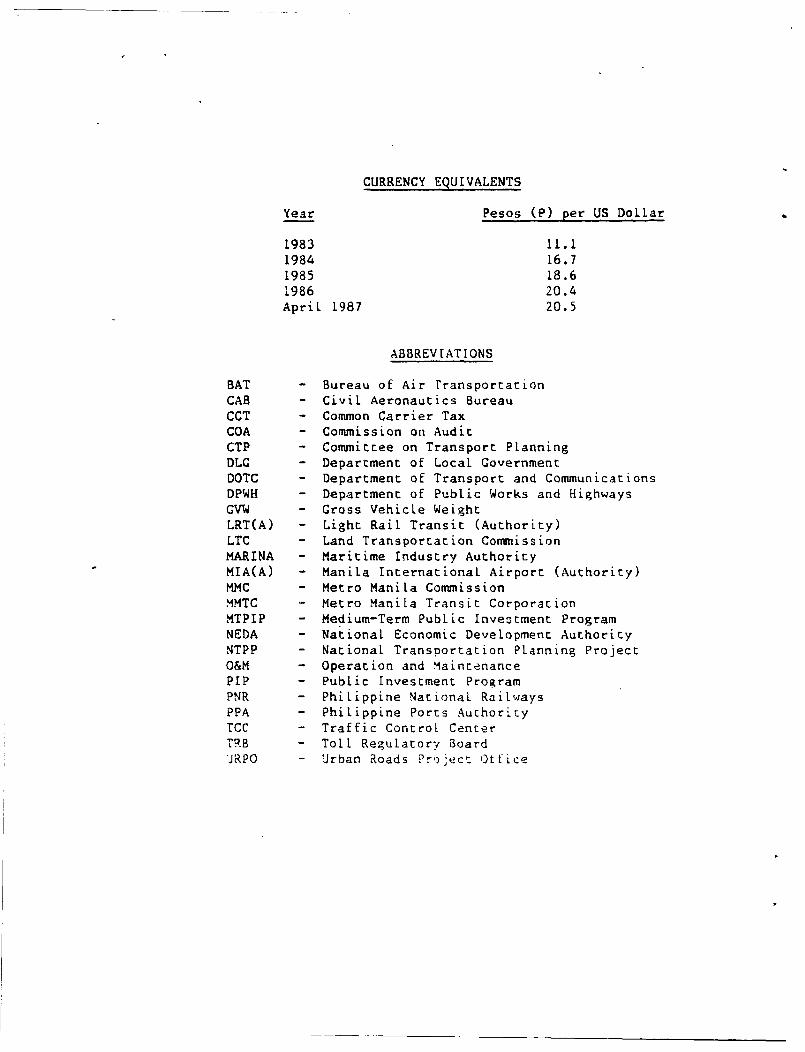
CURRENCY EQUIVALENTS
Year Pesos (P) per US DolLar
1983 11.1
1984 16.7
1985 18.6
1986 20.4
ApriL 1987 20.5
ABBREVIAT IONS
BAT - Bureau of Air rransportation
CAB - Civil Aeronautics Bureau
CCT - Common Carrier Tax
COA - Commission on Audit
CTP - Commitcee on Transport Planning
DLG - Department of Local Government
DOTC - Department of Transport and Communications
DPWH - Department of Public Works and Highways
GVW - Gross Vehicle Weight
LRT(A) - Light Rail Transit (Authority)
LTC - Land Transportation Commission
MARINA - Maritime Industry Authority
MIA(A) - Manila International Airport (Authority)
MMC - Metro Manila Commission
MMTC - Metro Manila Transit Corporacion
MTPIP - Medium-Term Public Investment Program
NEDA - National Economic DeveLopment Authority
NTPP - National Transportation PLanning Project
O&M - Operation and Maintenance
PIP - Public Investment Program
PNR - Philippine National Railways
PPA - Philippine Ports Auchority
ICC - Traffic ControL Center
TRB - ToLl ReguLatory Board
'JRPO - Urban Roads PrK,ect Otfice

JR OMCILu USE ONLY
PHILIPPINES
TRANSPORT SECTOR REVIEW
Table of Contents
Page No.
EXECUTIVE SUMMARYIntroduction .... .... ... ........ ..*. i
Sector Issues and PoLicy Choices ...........................i
Institutional Aspects and Issues . . iv
Public Expenditure Programs in the Transport Sector ......... v
Recomnendations ............................. . vii
I. INTRODUCTION . . . 1
A. Role of the Transport Sector . ............. 1.............. I
B. Previous Bank Sector Work .............................. 2
C. Objectives of the Present Sector Review . . 2
II. SECTOR ISSUES AND POLICY CHOICES . ................... 3
A. Introduction ....... .............................. ....... 3
B. Road Transport .. 3
Optimum Road Transport Technology . . 3
Regulatory Policies ................................... 4
Road User Charges . ................................ 7
Cost Recovery from Road Users ......................... 11
C. Transport in Metro Manila . . .o ........................ 14
Traffic Congestion ... 14
Public Transport ... . ........... 15
D. Interisland Shipping ..... ............. .................. 16
Market Structure . . . 16
Cost and Price of Shipping Services . . . 1 ' 7
Fleet Modernization and Quality of Service ... 19
Maritime Safety . . . 19
Public Policy Recommendations ..... ................... 20
E. Other Modes . ............................................ 21
This report is based on the findings of a transport sector mission thac
visited the Philippines in May/June 1987 consisting of Lars Nordin (Mission
Leader), Clell Harral (Economist), Cerhard Menckhoff (Urban Transport
Specialist), Asif Faiz (Economist) and Mohua Mukherjee (YP Economist).
Contribution has also been made by Lily Uy (Researcher). The report has been
edited by Patricia Brereton-MilLer.
This document has a restricted distribution and may be used by recipients only in the performance
of their official duties. Its contents may not otherwise be disclosed without World Bank authorization.

- ii -
Page No.
III. INSTITUTIONAL A SPECTS AND ISSUES ......... .......... 21
A. Organizational Setup ................. ....... .... ............. . 21
B. Major Sectorwide Issues ... .. ........ .......... . 23
C. Institutional Issues in the Subsectors .................... 25
Roads ......................... ................... * .......... 25
Urban . ......... , 25
Ports . ... 0.. ... 28
Railways ............... .... . .............................. 28
Aviation . ............ 29
IV. PUBLIC EXPENDITURE PROGRAMS IN fHE TRANSPORT SECTCR ........ .29
A. General ...... .... ..... ... ...... ............... 29
Investments . ................................... . 29
Operation and Maintenance..... ....................... 32
B. Roads ..... 33
Investments .............................. so. 33
Operation and Maintenance ................................ ................ 34
C. Ports ..... ....... o...... o ........ .............................. 34
Investments ........ -.............. ............ % ............ 34
Operation and Mainteadnc e ..................... ..... . 34
D. Railways .. .............. .. 35
E. Aviation ... 35
F. Urban .. ..................................... .......... 35
V. FUTURE ROLE OF THE BANK IN THE SECTOR . ... 35
ANNEXES
1. Sumnaries of Selected Transport Policy Studies
2. Public Investment Program
EXECUTIVE SUMMARY
Introduction
1. The purpose of this review is broadly to assess the impact of recent
economic and public policy developments on the role of the transport sector
in
the Philippine economy. The report particularly focuses on policy,
institu-
tional, and public expenditure developments in the sector that have occurred
since the previous Bank transport sector review in 1983.
2. In its consideration of sectoral policy issues, the report also
reviews key planning and policy studies which have been recently undertaken
by
the Government but which have not always been acted upon. The report
then
identifies those recommendations which are stilL worthwhile in the
current
climate of decentralization and privatization. It is hoped that these
recommendations will form the basis for a short- to medium-term action
plan
still to be developed. On the institutional side, the report identifies
institutional constraints and inadequacies which have arisen over the past
few
years and which prevent the system from functioning as it should.
Finally,
the report reviews the 1987-92 Public Investment Program. Such a review
is
particularly well-timed, given the change in government and the consequent
shift in priorities for public expenditures. The Philippine economy, despite
its scarce resources, appears ;o be poised for a recovery after the
difficult
phase since 1983. Certain public expenditure questions, such as the
balance
between investment and maintenance in the various subsectors, merit
atten-
tion. These issues are tackled in the third section of the report.
Sector Issues and Policy Choices
3. The objectives of public policy in the transport sector should be to
promote a diversity of transport services, responsive to market demands
and
technoLogical innovations in the industry, at as low a cost and price
as
possible. An additional objective is the reduction in economic disparities
across regions and income classes by proper pricing of transport services.
In
accordance with the Government's stated intentions, these objectives
should be
achieved through maximum reliance on the free market, with governmental
intervention limited to the establishment of a policy environment which
encourages the market to work mos; efficiently and to the provision
of
essential infrastructure which the private sector is not well placed
to
provide.
4. The existing policy environment comprises a mixture of diverse and
sometimes ill-conceived laws, regulations and practices accumulated from the
past, which, if rigorously enforced, would undermine the objectives stated
above. From an economic perspective it is fortunate that the existing
policies are often evaded. However, significant distortions exist and
there
is a danger that vested interests will seek enforcement of present
policies to
limit competition.
5. Despite a surprising dearth of quantitative information, a number
of
good sectoral policy studies have recently been completed. Their
recommenda-
tions, if implemented, should substantially improve the functioning of
transportation markets and lead to more efficient and less costly transporta-
tion services.
6. Road Transportation. The National Transportation Planning Project's
(NTPP's) "Study of Road Transportation Regulation" (December 1986) recommends
economic deregulation (i.e., elimination of present restrictions on r-arket
entry and regulation of prices) and emphasizes safety aspects. The present
regulatory restrictions not only pose an enforcement problem, but are also
economically inefficient. Furthermore, there is a clear risk that existing
vested interests in the industry will seek to enforce the regulations in order
to restrict entry and control as much of the market as possible. The Govern-
ment would best protect the public interest by moving gradually but decisively
to dismantle the existing franchise system.
7. Economies of scale in truck size and pavement construction warrant
the development of strong pavements and bridges instead of building weaker
infrastructure and legally restricting the size and axle loads of vehicles.
In addition, enforcement of such restrictions is difficult in almost all
countries. Fortunately in the Philippines, the majority of the primary roads
have been constructed with rigid concrete pavements of high bearing
strength. The proposal in the Department of Public Works and Highways'
(DPWH's) "Pavement and Axle Load Study" (July 1986) to raise legal, limits from
8 to 13 tons therefore appears reasonable.
8. With respect to road user taxation and financing, the conclusions
and recommendations of the NTPP "Road User Charges - National Policy Study"
(January 1984) and an updating report in February 1987 are well founded. The
methodology employed is consistent with the current state-of-the-art and
commonly accepted economic principles of cost recovery in the roads sector.
In the Philippines, it appears that two types of road users are paying less
than the marginal costs they occasion by their use of the roads: (a) 2- and
3-axle trucks, and (b) all vehicles under congested conditions. The proposals
of the study to increase the taxes (on ownership and usage) for 2- and 3-axle
trucks are sound. In addition to cost recovery objectives, these measures
would also contribute to improving efficiency of transport services by
encouraging selection and usage of appropriate vehicles.
9. Congestion pricing is widely endorsed in principle by transport
planners, but rarely applied due partly to practical administrative difficul-
ties and partly to political opposition. The principal exception is road
tolling, which is often implemented for financial reasons but also may serve
the economic purpose of charging for scarce road space. Private automobiles,
due to their numbers and low occupancy ratios, are major causes of conges-
tion. If more specific congestion pricing schemes are not feasible, and
because private automobiles may be viewed as "luxury goods," the current high
taxes on private automobiles should be maintained.
10. Maritime Transportation. The principal concerns in the maritime
sector, so important to economic integration of the country, are the high cost
of interisland shipping and the poor safety record. There appear to be two
principal causes for high shipping costs: (a) existing arrangements for
- iii -
freight handling at ports, and (b) the presence of a cartel in the liner
services indirectLy supported by governmental regulatory policies. The
present policy of the Philippine Ports Authority's (PPA's) acting as Landlord
and procuring stevedoring and Longshore ("arrastre") services by contract is
sound. However, the manner in which this policy has been implemented, in
effect granting quasi-monopolies, could be improved. PPA shouLd create a more
competitive market with alternative suppliers of such services in each port.
PPA port charges to non-PPA ports should also be related more closely to the
services rendered by PPA. As PPA's cost accounting system is improved,
consideration should also be given to gradually abandoning the uniform PPA
charges in all ports in favor of more cost-related port tariffs.
11. The other major factor tending to inflate the costs of inter-island
transport is the pricing practices of the Liner cartel. These are indirectly
supported by the Government's regulatory policies, which limit competition by
restricting market entry and price flexibility. In contrast to the
recommendations of NTPP's "Interisland Shipping Regulation Study" (December
1986), which recommends a form of "seLf-regulation" by the shipping cartel in
collaboration with the Maritime Industry Authority (MARINA) to restrict entry,
it appears that gradual deregulation of the industry, with essentially free
entry (subject only to safety requirements for vessels) and free market
pricing would best serve the interests of the Philippine economy. Reduction
in the various taxes imposed on the import of vessels would also serve to
stimulate innovation and reduce costs of interisland shipping.
12. Safety concerns may be less related to the age and type of vessel
thar to the size and the capabilities of the crews. Maritime safety is one of
the few areas which may need further study to identify the fundamental
determinants and appropriate governmental response.
13. RaiLways. The fundamental question of the financial viability of
the PhiLippine National Railways (PNR) continues to be of concern,
particularly in light of the extremely low volumes of traffic. At minimum, a
radical restructuring of PNR to address those few sectors where it might
possibly render a socially useful service at reasonably competitive costs
appears indicated. The opportunity costs of assets not needed for such
services should also be considered.
14. Urban Transport. The Government's general decentralization poLicy
will transfer many func~.ions from national agencies to the local level. While
the details of the new policy have yet to be worked out, local decision-making
on urban roads and transport regulations deserves support as it is likeLy to
be more responsive to the needs of the peopLe. In Metro Manila, the sheer
size of the population (equivalent to the next 30 largest cities in the
nation) has raised a different set of complex issues.
15. Manila's traffic congestion seems to have improved in recent
years. This is probabLy due to three major factors: (a) traffic engineering
schemes implemented by DPWH's Traffic Control Center, (b) economic recession
and a slight decline in private car ownership, and (c) the introduction of the
Light Rail Transit (LRT), a 16-km long elevated rail line which began opera-
tions in 1984-85. -With an economic recovery, the tra.fic situation could
- iv -
worsen if the pent up demand for cars results in a rapid increase of new car
registration. Moreover, while Metro Manila continues to grow, no major
capacity expansion of the transport system can be expected for at least the
next five years because of the lead time required for such works.
16. Another cause for concern is the weak financial situation of the
Government-owned transport services. It would appear that public transport
services could deteriorate substantially in the coming years if (a) the Metro
Manila Transit Corporation (MMTC) is unable to modernize its aging fleet due
to scarcity of funds; (b) private bus consortia continue to go out of
business, and (c) the moratorium on issuing jeepney licenses is maintained.
17. To avert possible public transport shortages in Manila, a three-
pronged approach should be considered. First, the current policy of bus and
jeepney franchising should be revised to permit new services where the passen-
ger market calls for them. The Department of Transport and Communications
(DOTC) has requested NTPP to prepare a report on this subject by December
1987. Second, the restructuring of bus services to make them commercially
more viable should be considered. Third, planning to substantially upgrade
public transport in at least one high-volume corridor requires urgent
attention. Since a study is currently envisaged for a second LRT line, this
might provide an opportunity to also look at lower-cost alternatives, such as
reserved bus/jeepney roads and, especially, separate busways which might
include short elevated sections to avoid bottlenecks in the street system.
SupporLt shuu'Ld aLso Ue given to the traffic engineering program and the
construction of new road links as envisaged under a proposed Manila Urban
Transport Project to be financed by the Japanese Government.
18. Effective coordination is required to implement a coherent transport
improvement program. At present, most policy and investment decisions are
taken independently by the individual urban agencies. Institutional coordina-
tion will therefore be one of the key issues that must be resolved with regard
to traffic and transport in Metro Manila.
Institutional Aspects and Issues
19. A multitude of institutions collectively provide transportation
services in the Philippines. It has become clear in recent years that a less-
than-efficiently functioning transport system can often be traced to institu-
tional constraints. These have been examined and are observed to fall broadly
into three categories: coordination problems, delays in the processing of
work, and inadequate staffing.
20. Coordination. Responsibility for construction and maintenance of
transport infrastructure is vested in agencies which are not directly
concerned with transport policy, regulation and administration. While there
are merits to such a division of responsibilities, it is important noc to lose
sight of the overall need for coherent planning. Although the National
Economic Development Authority (NEDA) is the key agency carrying out inter-
modal coordination between ports, railways, airports, highways and rural
roads, projects are initiated and evaluated at the agency level, without
regard to their impact on the development of other transport modes. At the
agency level, there is neither an incentive to coordinate activities nor a
built-in mechanism to ensure coordination during the project preparation
period. NEDA's function is, in effect, one of allocating resources for
already prepared projects in all sectors.
21. Delays. Project implementation is often impeded by delays in the
processing of contracts. This problem has be,:ome acute in recent years, when
contract prices have had to be adjusted and price escalations recalculated due
to currency devaluation and inflation. Approvals may take as long as two
years to pass through the government bureaucracy. Part of this problem is due
to a duplication of work by various agencies. The Commission on Audit (COA),
for example, has mandated a review of all feasibility studies for contracts
signed after March 1984, although the review is now done on a selective
basis. Delays are also caused by the sometimes weak quality and competence of
staff involved in the whole decision process. Some of the delays occur simpLy
due to lack of technical expertise at certain management levels to make an
appropriate decision within a reasonable length of time. Thus, the tendency
is to retain documents for longer than required while clarifications are being
sought.
22. Staffing. Staffing and management of the sector agencies is
uneven. While low government salaries make it difficult to recruit and retain
competent staff, this problem has been somewhat alleviated by the general
economic slowdown, which has reduced the "brain drain" toward the private
sector. As a result, working level staff have in large measure remained in
many agencies. On the other hand, and potentially more serious, the number of
managerial positions that have changed incumbents after the change in govern-
ment in February 1986 appears to threaten the proper functioning and conti-
nuity of some of the sector institutions. There is consequently a need for
the Government to strike a proper barance between political and professionaL
career appointments to remedy this situation.
23. Centralization of government authority has added to the inefficien-
cies in project implementation caused by slow contracting processing. While
this problem has been widely recognized, and Government has recently been
moving toward decentralization, success so far has been limiced, owing to a
number of factors. One important issue is the readiness of regional offices
to take over some of the delegated responsibilities and authority.
Decentralization will be successful only if local offices are adequately
staffed with qualified officials. A technical training program for local
staff should therefore be established at the regional/provincial Level. The
quality of local officials also varies greatLy, and many regionaL offices of
both the agencies and COA are reluctant co take on extra responsibiLities.
Public Expenditure Programs in the Transport Sector
24. The October 1986 Medium-Term Public Investment Program (MTPIP) for
1987-92 represents a massive build-up to support economic recovery and agro-
industrial development (82% in real terms) compared to the 1985-90 program,
which was evaluated by the Bank two years ago. The highway subsector would
receive the largest share of MTPIP funding, about 70%, followed by the ports
subsector with about 15%.
- vi -
25. While it is unlikely that MTPIP .will be carried out in its entirety
since there are doubts about both the level of financing available and the
implementation capacity of the respective agencies, the Plan is valuable in
setting implementation objectives. Many of the projects included have
feasibility studies completed, showing economic rates of return sometimes
substantially above the 15% level customarily used in the Philippines for
transport projects. The projects that have not yet uee-i evaluared have been
included in MTPIP based on prima facie viability which will be confirmed in
due course.
26. Operation and Maintenance. Actual operation and maintenance (O&M)
expenditures recorded by the Department of Budget for the period 1.982-86 and
estimated for 1987 show relatively stagnant O&M expenditures up to 1985
(declining in real terms) followed by a substantial 53% increase in 1986. The
Government's O&M expenditures in the transport sector account for about 35% of
total expenditures in 1986 and 1987 co.?ared to about 28% in previous years.
While this percentage increase in itself does not constitute a sufficient
indication that O&M expeneitures are adequate, it does show the increased
relative importance the Government attaches to maintenance. Since O&M expen-
ditures are also increasing in absolute amounts and assuming that the
increased levels can be maintained during the 1987-92 period, this would help
reduce the backlog of deferred maintenance in the sector.
27. Subsectoral Issues. The majority of investments proposed for the
road subsector seem justified. The only component to be watched is the
program for "various locally funded feeder/secondary and national roads,"
which would require 38% of the P 44,590.2 million requested for the road
program and is the principal reason for the large increase of MTPIP over the
1985-90 program. While the objectives are worthwhile, the concern is that
substantial funds may be spent without corresponding physical assets being
created due to capacity constraints in selecting, evaluating, designing and
implementing the huge number of small projects involved. The Covernment
intends to use reliable non-governmental organizations such as religious
groups and the Red Cross to augment its own implementation and monitoring
capabilities for this important program. If these efforts fail to produce the
intended results, the program should be reduced to more manageable levels, say
10-20% of the total road program.
28. The MTPIP port program includes three new projects with a total cost
representing 56% of the P 9,657.8 million port program. All three projects
should be reduced in scope. the projects at issue are (a) the Port Cargo
Handling Expansion Project, (b) the Manila South Harbor RehabiLitation
Project, and (c) the Tertiary Ports Project.
29. The PPA share of the MTPIP ports program also exceeds PPA*s present
investment projections and should be reduced accordingly. The port of San
Vicente (Port Irene) remains questionable and should be postponed until ics
justification has been established.
- vii -
30. PNR has embarked on a revitalization program to regain its opera-
tional levels of the middle 1970s. While the financial viability of the
railway is doubtful, the type of railway investments proposed under MTPIP,
i.e., rehabilitation of motive power, rolling stock and the permanent way,
seem appropriate if PNR's assets are to remain in operational condition.
Expenditures on the northern line should be limited to that part of the line
which is used for passengers commuting in and out of Manila. The rest of the
northern line should be closed. The investment amounts needed depend on how
much equipment can be saved as a result of general operational improvements
being carried out by PNR's new management. Care should be taken against
overinvesting in what has been and will likely continue to be a Loss-making
enterprise, but the risk of underinvesting is not negligible and should be
considered if the railways are indeed to remain in business. The alternative
use of the railways' real estate assets for busways and industrial development
should be an integral part of any discussion regarding the railways' future.
31. In the aviation subsector, the increase in investment is accounted
for by the new Cebu International Airport Development Project which wculd
provide better services for Cebu-bound traffic and would relieve Manila
International Airport of unnecessary transit traffic. While there is no
reason to question the project at this stage, its economic justification
should be established before implementation.
32. The proposed gubstantial. increase in urban investment is caused by
the inclusion in MTrIP of new investr.Lnts in the light rail transport (LRT)
system in Manila. Improvements to line I and design/construction of line 2
are understood to be included, subject to confirmation of their economic
viability. Any study of this matter should also consider the option of
providing lower-cost alternatives to upgrade public transport, such as
dedicated busways.
Recommendations
33. The main recommendations made in the report can be summarized as
follows:
Sectorwide
- Develop a short- to medium-term action plan for the sector
(para. 1.7)- Use explicit subsidies for essential, socially-justified services
racher than implicit subsidies provided by hidden taxes on other
services (para. 2.44)- Review the new sector organizational structure, which is currently
being changed, in early 1988 (para. 3.1)
- Institutionalize a capacity for transport planning and research
(para. 3.2)- Improve coordination among sector agencies (para. 3.4)
- Streamline procedures for approving contracts in order to eliminate
duplicate reviews (para. 3.7)- Improve staff capabilities by carrying out a technical training
program aimed particularly at the regional/provincial levels
(para. 3.9)

- viii -
- Balance political and professional career appointments (para. 3.Q)
The Roads Subsector
- Relate vehicLe taxation to the amount of road damage caused by a
vehicle (paras. 1.5, 2.6)- Increase legal axle load limits (paras. 2.5, 2.13(g))- Make adjustments in the road user tax structure (paras. 2.15, 2.18)
- Clarify responsibility for rural roads development and involve local
staff in maintenance activities (para. 3.11)- Reduce various road investment programs to manageable levels
(para. 4.6)
Road Transport Industry
- Discourage controlled supply of road transport passenger services
(para. 2.11)- Free entry into the road transport industry (para. 2.12)
- Abolish the distinction between own-account (T Licenses) and for-
hire (TH licenses) trucks (para. 2.12)- Decontrol prices of road transport services (para. 2.12)
- Formulate and pursue a program to deregulate the industry
(para. 2.13)- Encourage interisland road/ferry transport (paras. 1.4, 2.12)
- Abolish the Common Carrier Tax which also affects maritime
transport (paras. 2.15(e) and 2.43)
Ports and Maritime Transport
- Carry out a study of maritime safety (para. 2.3)
- Continue efforts to privatize PPA activities (para. 2.32)
- Consider abandoning uniform PPA charges in favor of cost-related
port tariffs (paras. 2.32, 2.42)} - Move gradually but decisively toward free entry into the shipping
industry and deregulation of prices (para. 2.42)- Introduce stricter inspection ot vessel sea worthiness (para. 2.39)
- Remove the Bureau of Customs from involvement in domestic shipping
(para. 2.42)- Review maritime freight rates and port charges (para. 3.22)
- Reduce three proposed port projects (para. 4.9)
The Railway
- Restructure PNR (para. 2.45)- Maintain separace accounts for railway and non-railway operations
(para. 3.24)- Restrict investments on PNR's north line (para. 4.12)
- ix -
Aviation
- Limit the responsibilities of the Manila International Airport
Authority to operation of the Manila Airport (para. 3.27)
- Establish the economic justification for the Cebu International
Airport Development Project (para. 4.13)
Urban Transport
- Carry out studies of congestion pricing for road traffic in urban
areas and of public transport in Manila (para. 2.3)- Expand the traffic engineering program for Metro Manila (para. 2.21)
- Introduce a pricing mechanism for vehicle use in congested areas of
Metro Manila (para. 2.21)- Maintain high cost of car ownership (para. 2.21)
- Coordinate the activities of the agencies responsible for traffic
management in Manila (para. 2.23)- Ease regulatory controls on bus and jeepney franchising and entry
into Manila's passenger transport market (para. 2.24)
- Restructure bus services to improve their financial viability
(para. 2.24)- Plan to upgrade public passenger services in at least one high-
volume traffic corridor in Manila (para. 2.24)- Clarify responsibilities for urban road construction and maintenance
among DPWH, the cities and barangays (para. 3.12)
- Strengthen traffic law enforcement in urban areas (para. 3.15)
- Revive TRANSEC, a recently dissolved transport coordination agency
for Metro Manila (para. 3.18)- Review the policy of giving public support to various bus companies
operating in Metro Manila (para. 3.19)- Review the organizational set up for Manila's Light Rail Transit
Authority and the Metro Manila Transit Corporation (para. 3.19)
- Study the use of dedicated busways to improve mass transit
(para. 4.14)
14. The task at hand is to establish priorities among the many possible
actions that could be taken. While setting of priorities is clearLy the
primary responsibility of the Government, the Bank would view the foLLowing as
major concerns. On economic grounds, the priority policy actions would be
expected to include the gradual deregulation of the trucking and interisland
shipping industries and the restructuring of road user charges. Deregulation
of trucking and shipping would lead to more efficient transport services which
would yield economic benefits to the overall economy. During the impLementa-
tion and adjustment phase, however, it would be necessary to protect both the
industries and their customers from violent swings in the pricing of transport
services.
35. As to priority institutional issues, measures are needed to:
(a) institutionalize a capacity for transport planning and research;
(b) clarify responsibilities for rural roads development;
(c) protect professional career appointments; and
(d) streamline administrative procedures.
Other policy and institutitional recommendations made in the report can be
dealt with simultaneously with or subsequently to the above, depending on the
relative difficulty of achieving the necessary national consensus and legis-
lative agenda.
36. During the next five years, efforts should be made to gradually
shift Bank assistance in the sector away from direct project loans and towards
annual transport sector loans to the Government, with an emphasis on policy
and institutional reform. Such annual sector loans would aLlow maximum
flexibility to include project components for financing as they are developed,
without having to wait for preparation of the next project loan cycle. The
Government and the Bank, in embarking on the proposed new approach to sector
cooperation, will use this report as a source document to catalyze and channel
the sector dialogue and sector development. The extent and timing of the
implementation of the report's recommendations would however, be subject to
the economic, social and political realities in the Philippines.
I. INTRODUCTION
A. Role of the Transport Sector
1.1 The Philippines transport system is composed of about 740 km of
railways, over 161,000 km of roads, 131 national ports, 256 private ports, and
some 400 toading points and 219 airports, of which 82 are national and 137
private. The system is basicaLLy bimodal. Road transport handles about 65X
of freight movement and 90% of passenger movement, while maritime transport
handles about 35% of freight and 7% of passengers. Air transport is very
limited and almost entirely passenger traffic, while railways traffic, both
passenger and freight, is negligible. Road and sea transport generally
complement rather than compete with each other.
1.2 During the 1970s, the transport sector grew at about 9% p.a., faster
than the GDP growth of about 6% p.a. As a result of the country's economic
recession, the GDP growth rate for the 1980s has been negative (-0.3% r..a.),
while the transport sector has been growing at only 1.0% p.a. Government
transport outlays have been about P 4.0 billion p.a.
1.3 The transportation sector plays a significant role in the
Government's macroeconomic goal of national economic integration. This is
refLected in the statement of objectives included in the Medium-Term
Philippine Development Plan (1986):
The transport sector shall support nationwide efforts to stimulate
agricultural production and increase rural incomes by orienting
transport infrastructure towards rural areas. It aims to reduce
interregional socioeconomic gaps and to strengthen interregional
linkages by providing for the more efficient movement of products
from excess production areas to deficit/market areas. A cransport
system that achieves a desired hierarchicaL pattern of growth
centers across the country shall be developed. Greater efficiency
in the use and safety of existing transport facilities shaH. -a.so oe
promoted. This includes a firmer commitment to maintenance activi-
ties and the adoption of low-cost schemes that will enabie the most
effective use of these facilities.
This is a sensible statement of public objectives in the transport sector.
How best to achieve these goals is the issue to be addressed.
1.4 As the Government Plan points out, a better functioning interisland
transportation system is needed for an economy dispersed over 7,000 isLands,
and a smoother movement of goods between farm and market is crucial for
regional development. Due to the development patterns of towns along road
corridors and the Government's poLicy of extending feeder roads to C>.e hinter-
lands, road transport is likely to continue as the dominant mode in the
foreseeable future. However, facilitating inter-island road and ferry trans-
port could make a major contribution to closer economic integration, and would
generate competitive pressures to weaken cartelization tendencies in the
maritime sector.
-2
B. Previous Bank Sector Work
1.5 The Bank's last review of the Philippine transport sector was issued
in September 1983, and the Government has, on its own initiative, implemented
several measures similar to those suggested in that review. In particular, in
the roads subsector, the Department of Public Works and Highways (DPWH) has
increased its maintenance budget from 25Z to 30% of its total expenditures.
In the railway subsector, the Philippine National Railway (PNR) has recently
appointed a strong management team, improved morale, and is making an orga-
nized marketing effort to attract passenger and freight traffic. Regarding
ports, recommendations in the earlier sector review on the rehabilitation and
development of secondary and tertiary ports will be implemented under the
Bank-financed Provincial Ports Project (Loan 2823-PH, 1987). Problems at the
Port of Manila will be addressed under an ADB-financed Second Manila Port
Project. Other areas highlighted under the previous report but still to be
corrected include Government's vehicle taxation system which fails to relate
taxation levels to the amount of damage vehicles inflict on the roads, govern-
ment regulation of the trucking industry which reduces the productivity of the
fleet, and the questionable financial viability of the railway's northern
line.
C. Objectives of the Present Sector Review
1.6 The purpose of the present review is broadly to assess the impact of
recent economic and public policy developments on the role of the transport
sector in the Philippine economy. The report focuses on transport sector
developments on three fronts--policy, institutional, and public expenditures--
that have occurred since the 1983 review.
1.7 In its three-part analysis, the report reviews the major transport
planning and policy studies which have been undertaken recently by the
Government but which have not always been acted upon. It then identifies the
recommendations of those reports which are relevant to the Government's
overall goals of decentralization and privatization. It is hoped that these
recommendations will form the basis for a short- to medium-term action plan
still to be deveLoped. On the institutional side, the report identifies the
key insticutional constraints and inadequacies which prevent the transport
system from functioning as foreseen. Finally, the report reviews the
Government's Public Investment Program in the light of recently emerging
priorities for public expenditures.
-3-
II. SECTOR ISSUES AND POLICY CHOICES
A. Introduction
2.1 As stated in the Medium-Term Philippine Development Plan, Govern-
ment's objectives in the transport sector are to promote a diversity of
transport services, responsive to market demands and technological innovations
in the industry, ac as low a cost and price as possible. An additional
objective is the reduction in income disparities across regions and income
classes. In accordance with the Government's stated intentions, these objec-
tives should be achieved through maximum reLiance on the free market, with
governmental intervention limited to the establishment of a policy environment
which encourages the market to work most efficiently and to the provision
of
essential infrastructure which the private sector is not weLl pLaced to
provide.
2.2 Government's current policies for the sector reflect a mixture of
diverse and sometimes ill-conceived laws, regulations and practices accumu-
lated from the past, which, if rigorously enforced, would undermine the
objectives stated above. From an economic perspective, it is fortunate that
the existing policies are often evaded. However, significant distortions
exist and there is a danger that vested interests will seek enforcement of
present policies to suppress competition wherever possible.
2.3 Despite a surprising dearth of quantitative information, a number of
good sectoral policy studies have recently been completed. Their recommenda-
tions, if implemented, should substantially improve the functioning of trans-
portation markets and lead to more efficient and less costly transportation
services. An annotated bibliography of the major policy studies carried
ouc
since 1982 is provided in Annex 1. Most of the nationwide studies have been
produced by the National Transportation Planning Project (NTPP), the
Government's chief organization for sectoral planning, and DPWH, which over-
sees the technical aspects of all sectoral projects. The studies focused on
Manila were generally prepared by Australian and Japanese consultants and by
the Department of Transportation and Communications (DOTC). In addition,
the
Philippine Chamber of Commerce and Industry has issued important commentaries
on the functioning of the transport system-which provide a valuable perspec-
tive independent of, and often at variance with, official government views.
While the studies provide a solid basis for prompt, decisive action in most
areas, further studies are still needed on: (a) maritime safety; (b) road use
pricing to reduce congestion; and (c) public transport pLanning in
Manila.
B. Road Transport
Optimum Road Transport Technology
2.4 Like studies in other countries (e.g., Sweden, the United States,
Australia and Indonesia), the DPWH "Pavement and Axle Load Study" (July 1986)
has found that, from the perspective of total costs to the society, it is
optimal to employ a range of vehicles, including very large, heavy trucks
operating over strong infrastructure. This is essentially due to economies
of
scale both in truck size and in the design and construction of pavements
and
-4-
bridges. Unlike many other countries, however, much of the existing infra-structure in the Philippines has already been dimensioned to a level which cansustain such heavy loadings. The DPWH estimates that, while the legal axle-load Limit is 8 tons, over 80% of inter-city freight in ton-km moves overinfrastructure which could accommodate axle loads of 13 tons.
2.5 The practice in the Philippines of building many roads with rigidconcrete pavements, to make use of the plentiful suppLy of local cement ratherthan importing asphalt, places the country in a good position to exploit theeconomies of large trucks without the necessity of large capital outlaysrequired for pavement strengthening. NevertheLess, some existing asphalticroads which carry high traffic volumes will need to be strengthened. Moderateoutlays for bridge deck replacement will also be needed, although the extracost necessary to accommodate very heavy vehicles is quite small. Conse-quently, support should be given to DPWH's proposal to increase legal axleload Limits from 8 to 13 tons for single axles, from 14.5 to 23 tons for dualtandem axles and to 30 tons for tridems, at least for high traffic densitycorridors (para. 2.13 (g)).
2.6 To some degree, this proposal merely legitimizes the existingsituation, since economic forces long ago overwhelmed nominal legal restric-tions on axle loads. To go beyond this and capture further benefits of truckfleet modernization, road vehicle taxes should be structured so as to providethe transport industry with the correct relative prices for road use bydifferent vehicLes (see paras. 2.14-2.17). With a change in taxation, themarket can be trusted to determine the optimum vehicle types, sizes and fleetconfiguration.
Regulatory Policies
2.7 Road Transportation. The NTPP's "Study of Road TransportationRegulation" (December 1986) recommends economic deregulation (i.e., elimina-tion of present restrictions on market entry and prices) and emphasizes safetyaspects. The present regulatory restrictions not only pose an enforcementproblem, but are also economically unsound. The market segments most affectedare pubLic passenger transport, petroleum distribution and interisland truck-ing using ferries. Since existing vested interests in the industry are orga-nizing to enforce the regulations in order to restrict entry and control asmuch of the market as possible, Government would best protect the publicinterest by moving gradually but decisively to dismantle the existing fran-chise system. At the same time, however, it should strengthen its safety andpollution regulations.
2.8 Road Freight Services. About 95,000 trucks were registered in thePhilippines in 1986, but less than lOZ held public utility (TH) licensesLegally entitling them to operate for hire. While most trucks haveT-licenses, which are officially valid only for own-account haulage, manyoperate illegal ('colorum') for-hire services. The NTPP "Road Industry Study"estimates that possibly 75Z of trucking services (including own-account) arecarried out by T license holders and 25% by TH licenses; the illegal 'colorum'operators are thought to provide perhaps half the public carrier services.This situation largely results from the distortionary effect of the CommonCarrier Tax, as discussed further in para. 2.15(e) below.
-5-
2.9 The official trucking tariff is currently fixed at P 2.20 per ton-
km, but rates are normally (though illegally) discounted substantially, with
actual rates on the main Luzon routes currently in the range of P 0.60-1.10,
i.e., half or Less of the official rates. Rates on the other islands are said
to be mostly higher, but usually well below the official rate. The official
rate is, however, applied for distribution of petroleum products, thus inflat-
ing fuel costs to all users. Overall average kilometers traveled per truck
are Low, about 40,000-50,000 km per year, reflecting in part the excessive
size of the own-account fleet.
2.10 Road Passenger Services. Passenger transport is provided by
(a) large buses (long-distance or urban services in Manila), (b) minibuses
(medium and Long distance), (c) jeepneys (omnipresent and used not only for
short hauls but also to connect with buses for Longer trips); and (d) motor-
tricycles. The total number of public utility buses and minibuses is esti-
mated at 11,000-12,000, predominantly large vehicles, of which about 7,000-
9,000 are in interurban service. The interurban bus services are operated by
some 1,500 provincial bus operators, of which more than 75% field three or
fewer units, although the 3% of bus operators who manage more than 20 units
account for about 45% of the fleet. Legally licensed for-hire jeepneys (PUJ)
outnumber buses by about 6:1, with PUJ licenses standing at about 66,000.
Moreover, an unknown but highly significant proportion of the privately regis-
tered jeepneys operate either 'colorum' or 'kabit' (by sharing a franchise)
for-hire services. About 130,000 tricycles are also registered to provide
for-hire services. They generally operate along fixed routes in small towns,
rural areas and selected zones in Large cities; they serve short-distance
trips and are commonly overloaded, with up to 10 passengers per vehicle.
2.11 The official tariff, which is tapered by distance, is the same for
buses, minibuses and jeepneys, although each clearly offers a different stan-
dard of service. rn reality, interurban fares charged are normally discounted
(the minibuses more than Large buses, and jeepneys the most discounted). On
some routes where large bus operators are able to agree with each other on
tariffs, there is less discounting. Few routes are cartelized, although fran-
chising practices (such as Route Measured Capacity) of the Government's Land
Transportation Commission (recently spLit into the Land Transportation Office
and the Land Transportation Franchising and Regualatory Board) have activeLv
encouraged such developments, e.g., the route 'rationalization' in East
Mindanao. This type of controlled supply should be discouraged in the future,
as it is contrary to the public interest and leads to sustained high fares.
2.12 Recommendation. The NTPP reports provide a convincing case tor
complete economic deregulation of the road transport industries (with the
possible exception of urban passenger transport which is now also being
studied by NTPP). By freeing market entry, abolishing the nominal distinction
between T and TH licenses, and completely decontrolling prices, substanciaL
gains to the Philippine economy should be realized from improvements in util-
ization of the road transport fleet and reductions in the cost and price of
-6-
transport. By also permitting nationwide operation and eliminating unwarran-
ted stevedoring and warehouse-related "arrastre" charges at ferry crossings,
it is likely that new interisland road services would emerge which could
promote economic and political integration, as well as provide needed competi-
tion in the area of interisland transport.
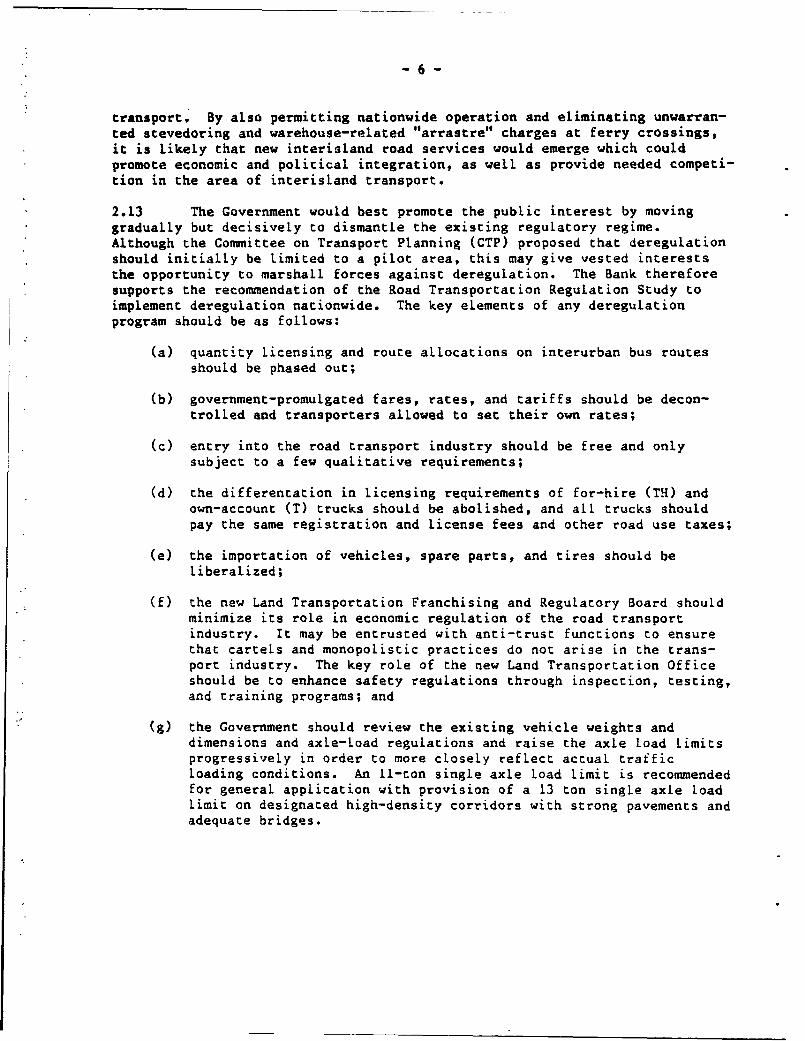
2.13 The Government would best promote the public interest by moving
gradually but decisively to dismantle the existing regulatory regime.
Although the Committee on Transport Planning (CTP) proposed that deregulation
should initially be Limited to a pilot area, this may give vested interests
the opportunity to marshall forces against deregulation. The Bank therefore
supports the recommendation of the Road Transportation Regulation Study to
implement deregulation nationwide. The key elements of any deregulation
program should be as follows:
(a) quantity licensing and route allocations on interurban bus routes
should be phased out;
(b) government-promulgated fares, rates, and tariffs should be decon-
trolLed and transporters allowed to set their own rates;
(c) entry into the road transport industry should be free and only
subject to a few qualitative requirements;
(d) the differentation in licensing requirements of for-hire (TH) and
own-account (T) trucks should be abolished, and all trucks should
pay the same registration and license fees and other road use taxes;
(e) the importation of vehicles, spare parts, and tires should be
liberalized;
(f) the new Land Transportation Franchising and Regulatory Board should
minimize its role in economic regulation of the road transport
industry. It may be entrusted with anti-trust functions to ensure
that cartels and monopolistic practices do not arise in the trans-
port industry. The key role of the new Land Transportation Office
should be to enhance safety regulations through inspection, testing,
and training programs; and
(g) the Government should review the existing vehicle weights and
dimensions and axle-Load regulations and raise the axle load Limits
progressively in order to more closely reflect actual traffic
Loading conditions. An 11-ton single axle load limit is recommended
for general application with provision of a 13 ton single axle load
Limit on designated high-density corridors with strong pavements and
adequate bridges.
Road User Charges
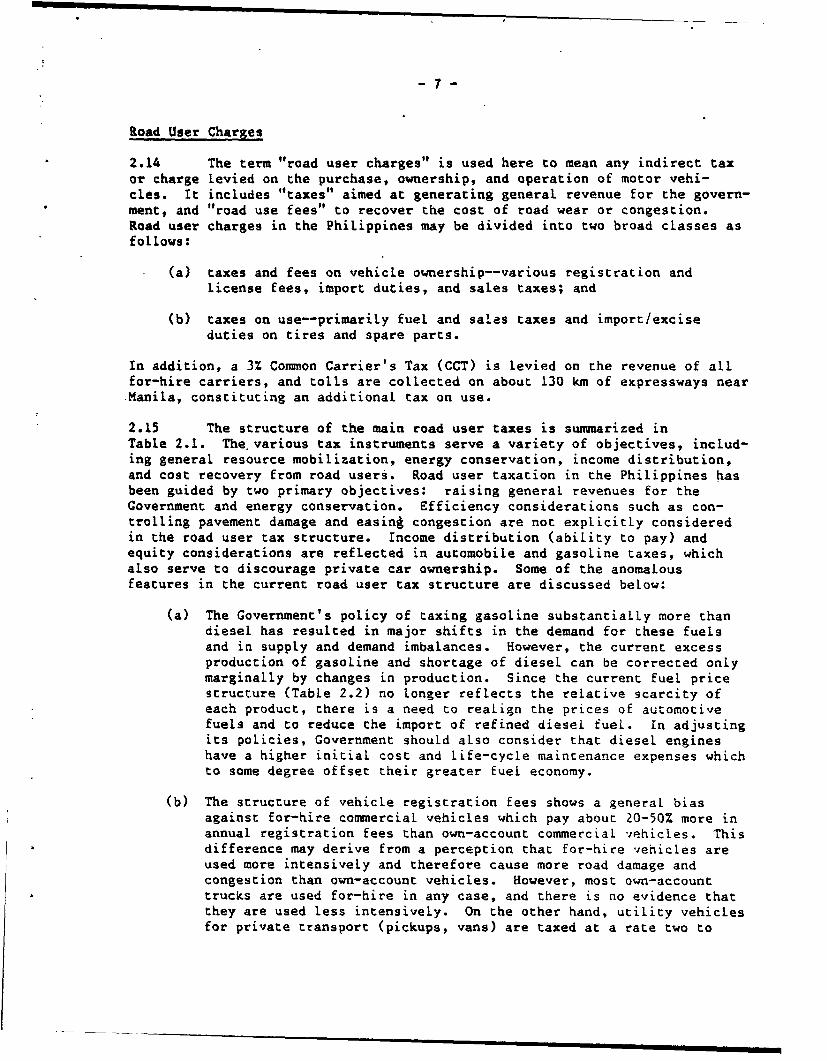
2.14 The term "road user charges" is used here to mean any indirect tax
or charge levied on the purchase, ownership, and operation of motor
vehi-
cles. It includes "taxes" aimed at generating general revenue for the
govern-
ment, and "road use fees" to recover the cost of road wear or congestion.
Road user charges in the Philippines may be divided into two broad classes
as
follows:
(a) taxes and fees on vehicle ownership--various registration and
license fees, import duties, and sales taxes; and
(b) taxes on use--primarily fuel and sales taxes and import/excise
duties on tires and spare parts.
In addition, a 3% Common Carrier's Tax (CCT) is levied on the revenue
of all
for-hire carriers, and tolls are collected on about 130 km of expressways near
Manila, constituting an additional tax on use.
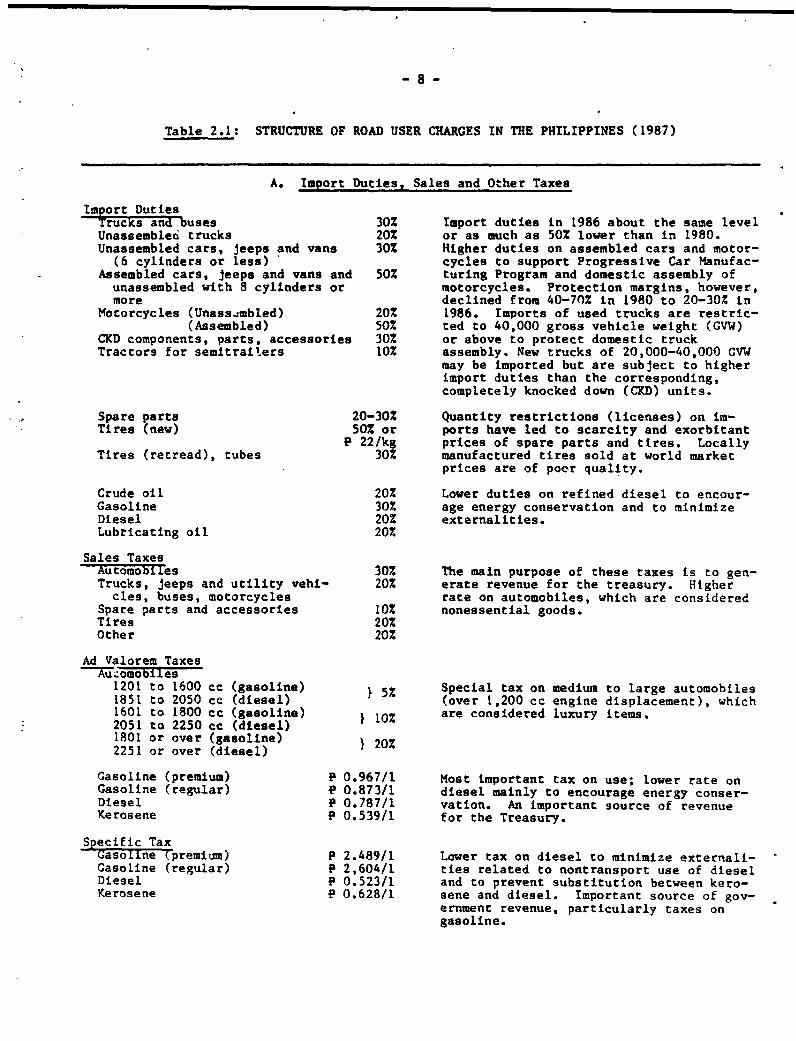
2.15 The structure of the main road user taxes is summarized in
Table 2.1. The various tax instruments serve a variety of objectives, includ-
ing general resource mobilization, energy conservation, income distribution,
and cost recovery from road users. Road user taxation in the Philippines
has
been guided by two primary objectives: raising general revenues for the
Covernment and energy conservation. Efficiency considerations such as
con-
trolling pavement damage and easing congestion are not explicitly considered
in the road user tax structure. Income distribution (ability to pay) and
equity considerations are reflected in automobile and gasoLine taxes,
which
also serve to discourage private car ownership. Some of the anomalous
features in the current road user tax structure are discussed beLow:
(a) The Government's policy of taxing gasoline substantiaLly more than
diesel has resulted in major shifts in the demand for these fuels
and in supply and demand imbalances. However, the current excess
production of gasoline and shortage of diesel can be corrected only
marginally by changes in production. Since the current fuel price
structure (Table 2.2) no longer reflects the relative scarcity of
each product, there is a need to reaLign the prices of automotive
fuels and to reduce the import of refined diesel fuel. In adjusting
its policies, Government should also consider that dieseL engines
have a higher initial cost and Life-cycle maintenance expenses which
to some degree offset their greater fuel economy.
(b) The structure of vehicle registration fees shows a generaL bias
against for-hire commercial vehicles which pay abouc 20-50% more in
annual registration fees than own-account commercial vehicles. This
difference may derive from a perception that for-hire vehicles are
used more intensively and therefore cause more road damage and
congestion than own-account vehicles. However, most own-account
trucks are used for-hire in any case, and there is no evidence that
they are used less intensively. On the other hand, utility vehicles
for private transport (pickups, vans) are taxed at a rate two to
-8-
Table 2.1: STRUCTURE OF ROAD USER CHARGES IN THE PHILIPPINES (1987)
A. Import Duties, Sales and Other Taxes
Import DutiesTrucks and ouses 30% Import duties in 1986 about the same levelUnassemble6 trucks 20% or as much as 50% lower than in 1980.Unassembled cars, jeeps and vans 30% Higher duties on assembled cars and motor-(6 cylinders or less) cycles to support Progressive Car Manufac-
Assembled cars, jeeps and vans and 50% turing Program and domestic assembly ofunassembled with 8 cylinders or motorcycles. Protection margins, however,more declined from 40-70% in 1980 to 20-30Z in
Motorcycles (Unassjmbled) 20% 1986. Imports of used trucks are restric-(Assembled) 50% ted to 40,000 gross vehicle weight (GVW)
CKD components, parts, accessories 30% or above to protect domestic truckTractors for semitrailers 10% assembly. New trucks of 20,000-40,000 GVW
may be imported but are subject to higherimport duties than the corresponding,completely knocked down (CKD) units.
Spare parts 20-30% Quantity restrictions (licenses) on im-Tires (new) 50% or ports have led to scarcity and exorbitant
P 22/kg prices of spare parts and tires. LocallyTires (retread), tubes 30% manufactured tires sold at world market
prices are of pocr quality.
Crude oil 20% Lower duties on refined diesel to encour-Gasoline 30% age energy conservation and to minimizeDiesel 20% externalities.Lubricating oil 20%
Sales TaxesAutomobiles 30% The main purpose of these taxes is to gen-Trucks, jeeps and utility vehi- 20% erate revenue for the treasury. Highercles, buses, motorcycles rate on automobiles, which are considered
Spare parts and accessories 10% nonessential goods.Tires 20%Other 20%
Ad Valorem TaxesAu omobiles1201 to 1600 cc (gasoline) } 5% Special tax on medium to large automobiles1851 to 2050 cc (diesel) (over 1,200 cc engine displacement), which1601 to 1800 cc (gasoline) } 10% are considered luxury items.2051 to 2250 cc (diesel)1801 or over (gasoline) 20%2251 or over (diesel)
Gasoline (premium) P 0.967/1 Most important tax on use; lower rate onGasoline (regular) P 0.873/1 diesel mainly to encourage energy conser-Diesel f 0.787/1 vation. An important source of revenueKerosene P 0.539/1 for the Treasury.
Specific TaxGasoline (premlum) P 2.489/1 Lower tax on diesel to minimize externali-Casoline (regular) P 2,604/1 ties related to nontransport use of dieselDiesel P 0.523/1 and to prevent substitution between kero-Kerosene P 0.628/1 sene and diesel. Important source of gov-
ernment revenue, particularly taxes ongasoline.
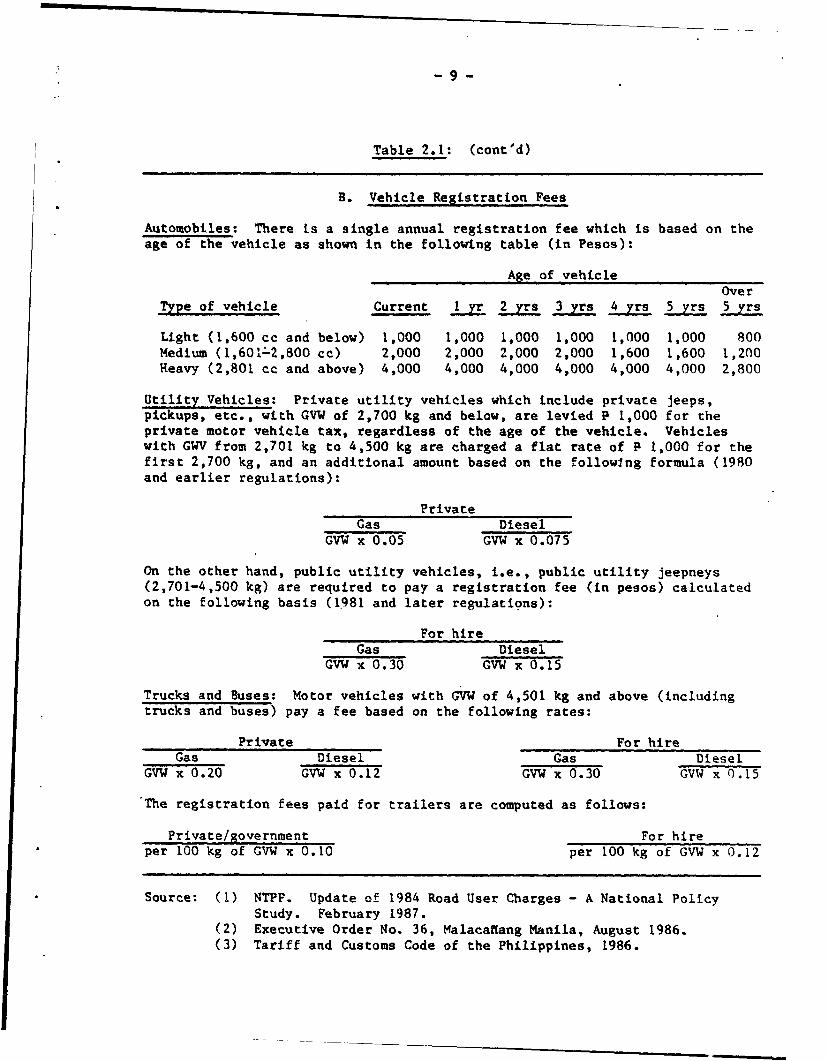
Table 2.1: (cont'd)
B. Vehicle Registration Fees
Automobiles: There is a single annual registration fee which
is based on the
age of the vehicle as shown in the following table (in Pesos):
Age of vehicleOver
Type of vehicle Current I yr 2 yrs 3 yrs 4 yrs 5 yrs 5 yrs
Light (1,600 cc and below) 1,000 1,000 1,000 1,000 1,000
1,000 800
Medium (1,601-2,800 cc) 2,000 2,000 2,000 2,000 1,600
1,600 1,200
Heavy (2,801 cc and above) 4,000 4,000 4,000 4,000 4,000
4,000 2,800
Utility Vehicles: Private utility vehicles which include private
jeeps,
pickups, etc., with GVW of 2,700 kg and below, are levied
P 1,000 for the
private motor vehicle tax, regardless of the age of the
vehicle. Vehicles
with GWV from 2,701 kg to 4,500 kg are charged a flat rate of
P 1,000 for the
first 2,700 kg, and an additional amount based on the following
formula (1980
and earlier regulations):
PrivateGas Diesel
GVW x 0.05 GVW x 0.075
On the other hand, public utility vehicles, i.e., public utility
jeepneys
(2,701-4,500 kg) are required to pay a registration fee (in
pesos) calculated
on the following basis (1981 and later regulations):
For hireGas Diesel
GVW x 0.30 GVW x 0.15
Trucks and Buses: Motor vehicles with GVW of 4,501 kg and above
(including
trucks and buses) pay a fee based on the following rates:
Private For hire
Gas Diesel Gas Diesel
GVW x 0.20 GVW x 0.12 GVW x 0.30 GVW x 0.15
The registration fees paid for trailers are computed as
follows:
Private/government For hire
per 100 kg of GVW x 0.10 per 100 kg of GVW x 0.12
Source: (1) NTPP. Update of 1984 Road User Charges -
A National Policy
Study. February 1987.
(2) Executive Order No. 36, Malacaffang Manila, August 1986.
(3) Tariff and Customs Code of the Philippines, 1986.

- 10 -
Table 2.2: PRICE BUILDUP FOR PETROLEUM PRODUCTS (FOR METRO MANILA)EFFECTIVE MARCH 1, 1987
(Pesos per liter)
Direct Ad Oil price Wholesalecompany Specific valorem stabiliza- posted Hauling Dealer's Pumprecovery tax tax tion fund price charge markup prices
Premium gas 3.8688 2.489 0.967 (0.709) 6.6158 0.0463 0.2343 6.90
Regular gas 3.4928 2.604 0.873 (0.714) 6.2558 0.0463 0.2249 6.53
AVTURBO 3.8968 2.567 0.974 (0.844) 6.5938
Kerosene 3.8498 0.628 0.539 (0.465) 4.5518 0.0463 0.2102 4.81
Diesel 3.5778 0.523 0.787 (0.404) 4.4838 0.0463 0.2299 4.76
Fuel oil 2.8895 0.511 0.202 (1.098) 2.5045
LP gas 2.5214 0.697 0.353 (0.005) 3.5664
Asphalts 3.3488 0.581 r.469 (0.752) 3.6468
Solvents 3.8118 2.472 0.953 (0.777) 6.4;94
Feedstock 2.8895 0.511 0.202 (1.098) 2.5045
Source: Board if Energy.
- 11 -
three times higher than jeepneys, although the latter contribute as
much or more to traffic congestion than private utility vehicles.
There is also a discrimination in favor of diesel-powered units--
registration fees are 15-20Z lower for light vehicles and 40-50%
lower for trucks and buses than for comparable gasoline-powered
vehicles. The only exception is in the case of diesel-powered
private utility vehicles which have higher registration fees than do
gasoline vehicLes. The structure of registration fees is also
unduly complex and needs simplification for ease of administration.
(c) Taxes on automobiles are also discriminatory since, for the same
engine size, diesel-powered cars are taxed at a Lower rate than
gasoline-powered cars. If automobiles are considered a Luxury item
then they should be subject to a progressive tax based on the vaLue
of the vehicle rather than its engine displacement or the type of
fuel powering it.
(d) Import duties and sales taxes on tires and spare parts are dispro-
portionately high and, combined with import restrictions, have Led
to either the very high cost or scarcity of these items essential to
maintaining the nation's vehicle fleet. This may be one of the
factors contributing to the country's low vehicle utilization rates
of 40,000-50,000 km per year for trucks, perhaps onLy half the
achievable level.
(e) From a legal standpoint, the CCT has the structure and administra-
tion of a business tax rather than a road user charge. It is
collected quarterly on all for-hire vehicles, on the basis of a pre-
determined estimate of gross receipts, differentiated by type of
vehicle and by area of operation--urban vs. suburban and ruraL. The
CCT is discriminatory and, for example, favors jeepney )wners who
can evade the tax more easiLy than bus operators. Licensed for-r.ire
trucks subject to CCT account for less than 25% of commercial
trucking services; the rest comprises own-account vehicles. The CCT
distorts the transport market by encouraging the uneconomic use ot
own-account trucks as for-hire vehicles. It shouLd therefore be
abolished or repLaced with a tax instrument that applies equalyv to
all for-hire passenger transport and alL types of trucking.
Cost Recovery from Road Users
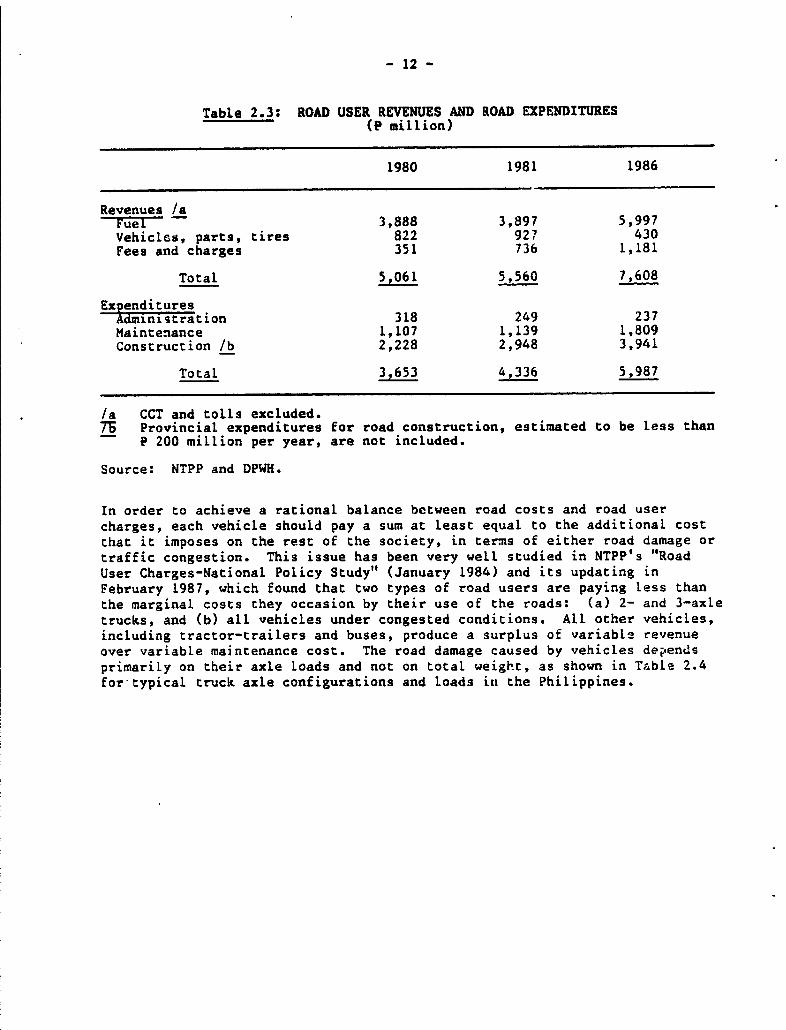
2.16 As shown in Table 2.3, taxes paid by the road sector have exceeded
Government's total capital and recurrent expenditures on roads.
- 12 -
Table 2.3: ROAD USER REVENUES AND ROAD EXPENDITURES(P million)
1980 1981 1986
Revenues /aFu-el 3,888 3,897 5,997Vehicles, parts, tires 822 927 430Fees and charges 351 736 1,181
Total 5,061 5,560 7,608
Ex endituresAdministration 318 249 237Maintenance 1,107 1,139 1,809Construction /b 2,228 2,948 3,941
Total 3,653 4,336 5,987
/a CCT and tolls excluded.7b Provincial expenditures for road construction, estimated to be less than
P 200 million per year, are not included.
Source: NTPP and DPWH.
In order to achieve a rational balance between road costs and road user
charges, each vehicle should pay a sum at least equal to the additional cost
that it imposes on the rest of the society, in terms of either road damage or
traffic congestion. This issue has been very well studied in NTPP's "Road
User Charges-National Policy Study" (January 1984) and its updating inFebruary 1987, which found that two types of road users are paying less than
the marginal costs they occasion by their use of the roads: (a) 2- and 3-axletrucks, and (b) all vehicles under congested conditions. All other vehicles,
including tractor-trailers and buses, produce a surplus of variable revenue
over variable maintenance cost. The road damage caused by vehicles dep'ends
primarily on their axle loads and not on total weight, as shown in Table 2.4
for typical truck axle configurations and loads in the Philippines.
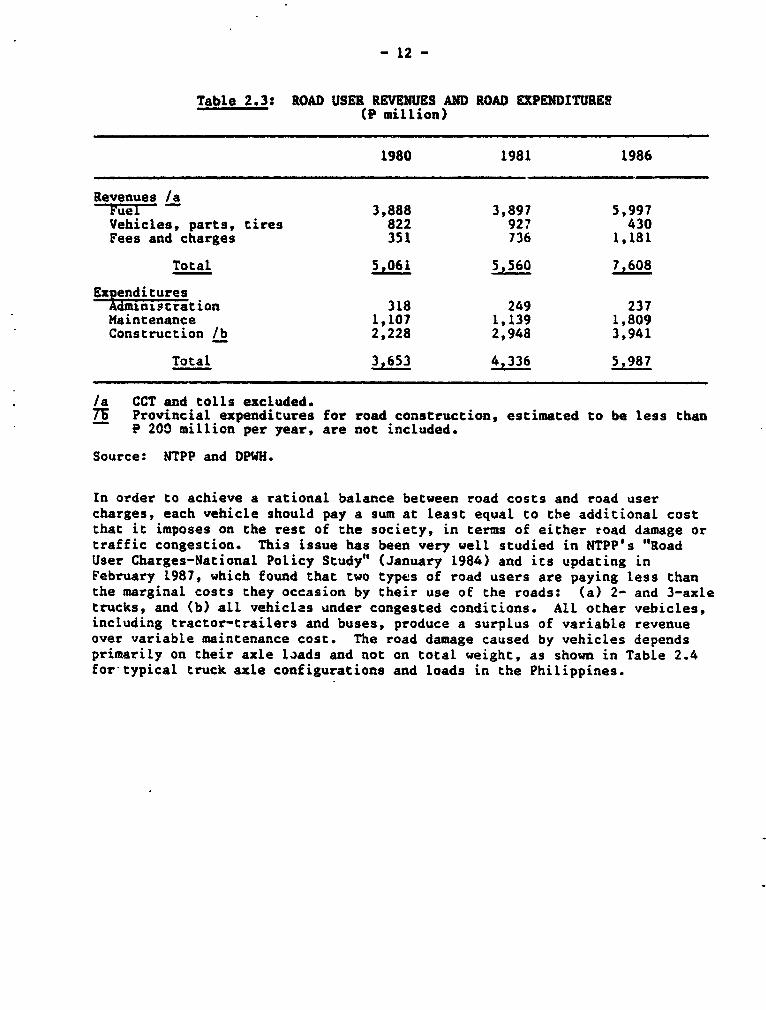
- 12 -
Table 2.3: ROAD USER REVENUES AND ROAD EXPENDITURES(P million)
1980 1981 1986
Revenues /aFu-elr- 3,888 3,897 5,997Vehicles, parts, tires 822 927 430Fees and charges 351 736 1,181
Total 5.061 5,560 7,608
ExtendituresAdministration 318 249 237Maintenance 1,107 1,139 1,809Construction lb 2,228 2,948 3,941
Total 3,653 4,336 5,987
/a CCT and tolls excluded.7T Provincial expenditures for road construction, estimated to be less than
e 200 million per year, are not included.
Source: NTPP and DPWH.
In order to achieve a rational balance between road costs and road usercharges, each vehicle should pay a sum at least equal to tbe additional costthat it imposes on the rest of the society, in terms of either road damage ortraffic congestion. This issue has been very well studied in NTPP's "RoadUser Charges-National Policy Study" (January 1984) and its updating inFebruary 1987, which found that two types of road users are paying less thanthe marginal costs they occasion by their use of the roads: (a) 2- and 3-axletrucks, and (b) all vehiclas under congested conditions. All other vehicles,including tractor-trailers and buses, produce a surplus of variable revenueover variable maintenance cost. The road damage caused by vehicles dependsprimarily on their axle loads and not on total weight, as shown in Table 2.4for typical truck axle configurations and loads in the Philippines.
- 14 -
(b) the current structure of license fees based on GVW should be recali-
brated to an equivalent axle load (EAL) per ton scale, in line with
NTPP recommendations. The schedule of import duties and taxes
should also be modified to promote the use of multi-axle, articu-
lated trucks. Vehicle registration and license fees (road tax)
should be adjusted periodicaLly for inflation and price changes as
well as changes in the structure of the vehicle fleet. The tax rate
should be the same for both for-hire and private trucks;
(c) the structure of road tolls should be reviewed to ensure that toll
administration costs are reasonable and that tolls are contributing
to efficient use of road space;
(d) imports of spare parts and tires should be Liberalized (by removal
of quantity restrictions and Lowering of duties) to avoid distortion
of vehicle replacement choices and increases in vehicLe operation
and maintenance costs; and
(e) the rates of import duties and sales taxes on diesel-powered automo-
biles, pickups, and jeeps should be set higher than those for
comparable gasoline-powered units to minimize the switch from
gasoline to diesel-powered vehicles.
C. Transport in Metro Manila
2.19 The Government's general decentralization policy will transfer many
functions from national agencies to the local Level. While the details of the
new policy have yet to be worked out, local decision-making for urban roads
and transport regulations deserves support as it is LikeLy to be more respon-
sive to the needs of the people. In Metro Manila, the sheer size of the
population (7.3 million or 13Z of the national population and equivalent co
the next 30 largest cities) has raised some particularly complex issues.
Traffic Congestion
2.20 While regulations and institutional responsibilities Eor transport
in Metro Manila are similar to the national pattern, the sheer concentration
of people and activities poses unique problems such as severe traffic conges-
tion, and requires special solutions such as computerized craffic signals or
exclusive-use transitways like the recently compLeted Light Rail Transit
(LRT), a 16-km Long elevated rail line. Traffic congestion in Manila does
seem to have improved in recent years, due to (a) traffic engineering schemes
implemented by DPWH's Traffic Control Center, as well as the rehabilitation
and widening of some urban highways, W4) economic recession and a sLight
decline in private car registrations,- and (c) the introduction of LRT in
1984/85. However, with an economic recovery, traffic couLd easiLv worsen in
the coming years if the pent-up demand for cars results in a rapid increase of
new car registrations. Moreover, while Metro Manila continues to grow by
1/ From 36 cars per 1,000 inhabitants in 1983 to 32 in 1986.
- 15 ̂
about 200,000 persons per year, no major capacity expansion of the transport
system can be expected for at least the next five years because of the lead
* time required for such works.
2.21 To address the probable worsening of traffic conditions, support
should be given to expanding the successful traffic engineering program and
the construction of new road links as envisaged under a proposed Manila Urban
Transport Project to be financed by the Japanese Government. It would also be
timely to consider a pricing mechanism such as tolls or licensing schemes for
driving in congested times and areas, which would charge vehicle users for the
congestion they cause. Unfortunately, experience elsewhere has shown that it
is extremely difficult to gain public acceptance for congestion pricing on
urban streets and, although well-conceived s Pemes have been designed for
several major cities, only two such schemes - have actually been introduced
while the others have been shelved for the time being. Thus, while the con-
cept of pricing vehicle use should be actively pursued at the technical and
political levels (because of its enormous economic benefits), it is suggested
that, because private automobiles are the major causes of congestion due to
their numbers and low occupancy ratios and may be viewed as luxury goods,
traffic growth should be restrained through high pricing of car ownership, at
least until a major congestion pricing scheme is introduced in ManiLa.
Public Transport
2.22 Prospects for public transport in Manila are, under prevailing
conditions, not good. In 1986, LRT had a deficit of P 240 million, of which
about 75Z was interest charges, and the Metro Manila Transit Corporation
(MMTC), which operates the city's largest bus fleet, had an estimated operat-
ing loss of P 39 million (if bus depreciation is revalued to account for
exchange rate shifts since 1980 when the present fleet was acquired). In
addition, three of the ten private bus consortia operating at the beginning of
1987 have since gone out of business and others are expected to follow. It
thus appears that public transport services could deteriorate substantially in
the coming years if (a) MMTC is unable to modernize its aging fleet due to
scarcity of funds, (b) private bus consortia continue to withdraw services,
and (c) a current moratorium on issuing jeepney licenses is maintained and
enforced.
2.23 Transport in Manila is also constrained by the policy of jeepney
franchising which aims to balance supply with estimated passenger demand along
any given route. While the economic rationale for this regulation is unclear,
a restrictive franchising policy can be justified on the grounds that an
oversupply of relatively space-consuming jeepneys (compared to buses) should
be avoided to reduce traffic congestion. This would imply that franchising
should depend on the spare traffic capacity along any given thoroughfare--a
criterion that, surprisingly, is not currently considered in jeepney franchis-
. 2/ Operating since 1)75, the Singapore Area Licensing Scheme is widely
regarded as a major success. More recently, the city of Bergen, Norway,
has implemented a congestion pricing scheme.
- 16 -
ing regulations in Manila. At present, the emphasis is on the commercial
aspects of jeepney operation rather than jeepney-caused congestion. This is
due to a division in institutional responsibilities. DOTC regulates jeepneys,
as other vehicles, to achieve global objectives and is thus not well equipped
to investigate traffic congestion at the local level. DPWH is responsible for
providing an adequate road infrastructure and has therefore created its
Traffic Control Center which has been successful in checking Manila's traffic
congestion. An effective public transport policy requires close integration
of route franchising and traffic engineering, and thus a close coordination
(if not merging) of the agencies responsible for those functions.
2.24 To avert possible public transport shortages in Manila, a three-
pronged approach might be considered. First, revise the current policy of bus
and jeepney franchising, probably by easing the regulatory controls to perm;t
new services where the passenger market calls for them; DOTC has already
requested NTPP to prepare a report on this subject by December 1987. Second,
restructure the organizational and financial framework of bus services to make
them commercially more viable and reverse their current decline. Third, begin
pLanning for a substantial upgrading of public transport in at least one high-
volume corridor or preferably in a metropolitan system of such corridors. A
study currently envisaged for a second LRT line should be expanded to also
consider lower-cost alternatives, such as reserved bus/jeepney roads and, even
better, separate busways which might include short elevated sections to avoid
bottlenecks in the street system. Support should also be given to the traffic
engineering program and the construction of new road links as envisaged under
the proposed Manila Urban Transport Project.
D. Interisland Shipping
Market Structure
2.25 While data on interisland shipping are somewhat inadequate with
respect to the induscry's structure, scope and functioning, the key features
seem to be as follows. Scheduled liner services seem to account for about
half of total domestic freight movements by water. The remainder are carried
by the largely unreguLated, unscheduled contract carriers (trampers) and
private (own-account) bottoms. Large shippers can use the competitive
services, but smaller shippers must normally rely on the liners. The regu-
lated liner services also provide substantial passenger services, which in
1984 accounted for 36Z of their reported gross revenues, and for which there
appear to be no other competing sea services, although some competition is
provided by bus-cum-ferry services and air services.
2.26 The liner services are dominated by five Large companies although
data on the degree of concentration are not available. These and several
other companies are organized into a shipping conference, CISO (Conference of
- 17 -
Interisland Shipowners) 3" which functions as a cartel with varying degrees of
control. The industry is connonly said to be subject to chronic excess
capacity, which was one factor responsible for the introduction of govern-
mental route licensing in 1972. There has undoubtedly been some excess
capacity in recent years due both to the introduction in 1976 of container
technology which left much of the fleet redundant and to the economic downturn
of 1983-86. The liner industry would probably have been more seriously
weakened during this period had it not been for the simultaneous decline in
the barge industry. As it was, three liner companies left the industry, and
others coped by deferring vessel replacement, mothballing a substantial
portion of the fleet and stretching out route schedules. More recently, with
the apparent economic upturn in 1987, an expansion of shipping services and an
initiation of fleet renewal have begun.
2.27 Two NTPP reports have been prepared on the maritime subsector and
its critical importance to the economic integration of the country: the
"Interisland Shipping Regulation Study" and "A Ship Replacement Program" (both
dated December 1986). The principal issues highlighted in the reports are the
high cost of interisland shipping and the poor safety record.
Cost and Price of Shipping Services
2.28 At present, both the costs of interisland shipping to the shipping
industry and the prices charged to the industry's clients are higher than tney
should be. The major factors driving up costs are as follows:
(a) The cost of port stevedoring and longshore "arrastre" services
(which rarely comprise less than 20% of total shipping costs and
sometimes as much as 60% on short hauls) tend to be inflated. These
charges are incurred even where the shipping company provides the
port handling equipment and labor. This appears to be due LargeLy
to the manner in which the Philippine Ports Authority (PPA) adminis-
ters stevedoring and arrastre services, in effect granting quasi-
monopolies. These practices, which apparently stem from poLitical
favoritism under the previous regime, are well recognized and are
likely to be modified in the near future.
(b) PPA has been able to enforce charges on private ports equal to about
one half the charges for use of PPA facilities. Aside from inflat-
ing the costs of private shipping, these practices also tend to dis-
courage investments in and use of private facilities which wouLd
compete with PPA.
(c) The Bureau of Customs is unnecessarily involved in pureLy domestic
movements, which not only causes unnecessary costs and deLays, but
also may encourage corrupt practices.
3/ There also exists a broader association, PISA (Philippine Interisland
Shipping Association), which includes barge and tramp operators as well.
- 20 -
2.38 One of the few facts which can be ascertained, however, is thatPhilippine maritime accidents have not been positively correlated with vesselage. Indeed, 621 of the accidents in 1984 (among vessels over 50 CRT)invoLved vessels 15 years old or less while only 30X involved vessels of 21
years or more.
2.39 In July 1986, MARINA implemented mandatory classification of allnewly acquired imported liner and ferry vessels. The full effect of thisaction, however, will not be felt for five years, since it was introduced as arequirement for the Certificate of Public Convenience License renewal, andoutstanding licenses have a validity of up to five years. At Least threerecognized classification societies are now operative in the Philippines sothat it should be possible to expedite this process. The rigorous scrutinyexercised by the classification societies is a much less costly and probabLysurer process to maintain vessel safety than is forcing the pace of fleetrenewal.
2.40 As in road accidents, however, human error is more to blame thanfailures in equipment, and there is apparently a need to strengthen the educa-tion of merchant marine staff as well as the surveillance thereof, a functionexercised by the Philippine Coast Guard.
Public Policy Recommendations
2.41 The objective of public policy in the sector should be to promote adiversity of shipping services, responsive to market demands and technologicalinnovation in the industry, at as low a cost (and price) as possible. Otherthan for ordinary cyclical factors, there is a tendency to excess capacityonly because prices for ship services are held above suppliers' costs.
2.42 The appropriate policy prescription is gradual economic deregulationand a refocusing of the Government's limited regulatory powers on to safetyconsiderations. Prices should be set free and new entrants should be welcomedin order to break the price-fixing powers of the cartel (at present pricelevels, no artificial encouragement should be required). Attention also needsto be given to revision of the PPA port handling and charging practices aswell as to removal of Bureau of Customs involvement in domestic shipping.
2.43 With respect to fleet modernization, government intervention, otherthan to promote safety, is not needed. While the NTPP "Ship ReplacementProgram" suggested that government intervention would also promote fuelsavings, chis factor would ordinarily be incorporated in the shipowners' ownfinancial calculations to determine replacement timing. The Government, how-ever, may wish to consider whether taxes, particularly those on the import ofvessels, spare parts and supplies, as well as the CCT, might be reduced oreliminated; this obviously would need to be considered in the context ofoverall public finance and taxation policies.
2.44 The pricing practices currently followed result in cross-subsidization of both the nine essential foodstuffs and low valued commodi-ties, as well as low-volume routes serving the less developed islands. TheGovernment may wish to subsidize such services as a matter of social policy,

- 21 -
and, in the case of the outlying islands, also for purposes of economic
integration, which could be defended partly on "infant industry" grounds.
Free competition in the shipping industry would undermine current practices,
since new entrants would be attracted to those services where tariffs were
held high, and, by thus "skimming the cream," would eliminate the revenue base
for subsidizing other traffic. However, free competition would create greater
efficiency in the whole industry and reduce the costs of all services, which
could result in a lower cost even for those goods and routes which are
presently being cross-subsidized. This would possibly include greater techno-
logical adaptation to cope with the nature and scope of the secondary
routes. Finally, to the extent that subsidy of these services was still
desired, an explicit subsidy from the general treasury, in lieu of an implicit
subsidy based on hidden taxes on the users of other transport services, may be
preferred, so that social decisions could be explicitly determined.
E. Other Modes
2.45 Domestic aviation is an essential transport mode in an archipeLago
country like the Philippines, especially for passenger traffic and perishable
and high-value cargo traffic. Nevertheless, this report does not cover the
aviation sector in detail since there are no outstanding issues and few policy
reports. Concerning the railway, the issue is the financial viability of the
Philippine National Railways (PNR), particularly in light of the extremely low
volumes of traffic, which, excluding some 3 million commuters, dropped from
416 million pass-km and 43.5 million ton-km in 1980 to 173 million pass-km and
19.4 million ton-km in 1986. At minimum, a radical restructuring of PNR to
address those few sectors where it might possibly render a socially useful
service at reasonably co.npetitive costs appears indicated. The opportunicy
costs of assets not needed for such services should also be considered.
III. INSTITUTIONAL ASPECTS AND ISSUES
A. Organizational Setup
3.1 A multitude of agencies are engaged in the direct or indirect provi-
sion of transport services in the Philippines. The organization of the sector
may be divided into two broad categories, one dealing with infrastructure
construction and maintenance, and the other with policies governing transport
operation. Table 3.1 gives an overview of the transport agencies, their area
of responsibility, size and annual budget.
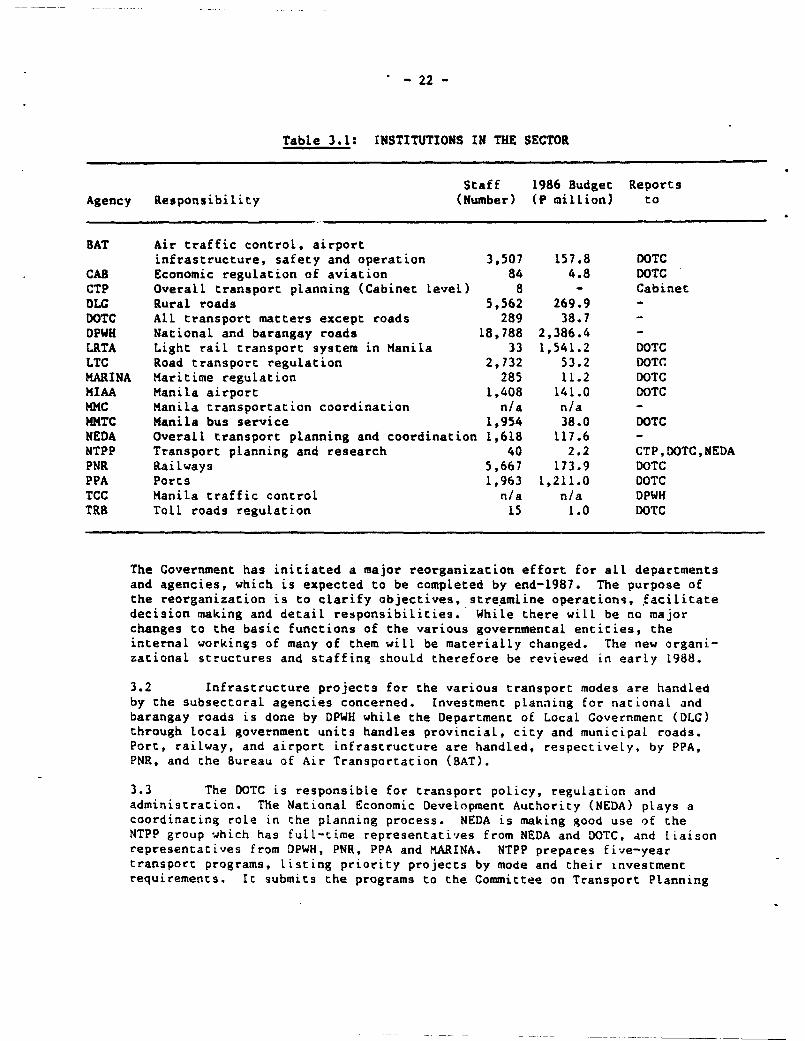
-22-
Table 3.1: INSTITUTIONS IN THE SECTOR
Staff 1986 Budget Reports
Agency Responsibility (Number) (P million) to
BAT Air traffic control, airportinfrastructure, safety and operation 3,507 157.8 DOTC
CAB Economic regulation of aviation 84 4.8 DOTC
CTP Overall transport planning (Cabinet level) 8 - Cabinet
DLG Rural roads 5,562 269.9
DOTC All transport matters except roads 289 38.7
DPWH National and barangay roads 18,788 2,386.4
LRTA Light rail transport system in Manila 33 1,541.2 DOTC
LTC Road transport regulation 2,732 53.2 DOTC
MARINA Maritime regulation 285 11.2 DOTC
MIAA Manila airport 1,408 141.0 DOTC
MMC Manila transportation coordination n/a n/a
HHTC Manila bus service 1,954 38.0 DOTC
NEDA Overall transport planning and coordination 1,618 117.6
NTPP Transport planning and research 40 2.2 CTP,DOTC,NEDA
PNR Railways 5,667 173.9 DOTC
PPA Ports 1,963 1,211.0 DOTC
TCC Manila traffic control n/a n/a DPWH
TRB Toll roads regulation 15 1.0 DOTC
The Government has initiated a major reorganization effort for all departments
and agencies, which is expected to be completed by end-1987. The purpose of
the reorganization is to clarify objectives, streamline operations, facilitate
decision making and detail responsibilities. While there will be no major
changes to the basic functions of the various governmental entities, the
internal workings of many of them will be materially changed. The new organi-
zational structures and staffing should therefore be reviewed in earLy 1988.
3.2 Infrastructure projects for the various transport modes are handled
by the subsectoral agencies concerned. Investment planning for national and
barangay roads is done by DPWH while the Department of Local Government (DLG)
through local government units handles provincial, city and municipal roads.
Port, railway, and airport infrastructure are handled, respectively, by PPA,
PNR, and the Bureau of Air Transportation (BAT).
3.3 The DOTC is responsible for transport policy, regulation and
administration. The National Economic Development Authority (NEDA) plays a
coordinating role in the planning process. NEDA is making good use of the
NTPP group which has full-time representatives from NEDA and DOTC, and liaison
representacives from DPWH, PNR, PPA and KARINA. NTPP prepares five-year
transport programs, listing priority projects by mode and their Investment
requirements. It submits the programs to the Committee on Transport Planning
- 23 -
and NEDA for consideration and inclusion in the Public Investment Program
(PIP). Optimally, the transport program should be updated annually to accom-
modate interim changes. The benefits to be derived from NTPP participation
in
planning have sometimes been limited due to NTPP's late invoLvement in
projects and the occasional commitment of project financing before NTPP's
review of the project. NTPP's links with the modal agencies should aLso
be
strengthened to facilitate intermodal and interagency coordination. NTPP will
terminate as a project in December 1987 and, unless urgent measures are taken,
its staff may be scattered and its capacity for medium- and Long-range
planning and research lost. It is therefore recommended that the functions of
NTPP be institutionalized within DOTC, or possibly NEDA, and that as Large
a
group as possible of NTPP's trained staff be kept together. This will, lessen
the risk that the valuable expertise built up over the last ten years may
be
lost or diluted to the point of becoming ineffective.
B. Major Sectorwide Issues
Planning Coordination
3.4 Intermodal coordination in the transport planning process is weak.
At present, project planning starts with the individual subsectoral agencies
which are not required to consult or coordinate with agencies in other
modes. Project development is based solely on past trends and the current
economic situation, without regard to the impact of other transport deveLop-
ments. As a result, highways have been built parallel to railway upgrading
projects, and ports investments have been undertaken without considering
that
traffic would be diverted to highways. The lack of coordination arises,
first, because the individual agencies function in isolation from one another,
each with a mandate to provide transport services to the economy, though not
necessarily the most economic and efficient services. Second, there is no
coordination mechanism at the subsectoral agency Level; all coordination is
done by NEDA and NTPP. NEDA is more involved in allocating resources to
projects than in prioritizing them, while NTPP evaluates individual project
proposals but has no authority over decisions affecting intermodal coordina-
tion. As long as resources are available, alL projects are funded. This
poses the risk of overinvestment in some projects which, when evaLuated
individually, show good economic return, but, when considered in the context
of other modes, may not be justified. Coordination shouLd instead be done
at
the planning stage when projects have been identified but are stilL tLexi-
ble. In this case, if duplicate projects are discovered, uneconomic invest-
ments may be avoided more easily than when the project is presented to NEDA.
Better coordination among agencies couLd aLso heLp in the formuiation of a
more realistic overall investment pLan.
Contract Approval Procedures
3.5 The cumbersome procedures for reLease of payments reLated to
contracts have aroused compLaints from various contractors and agencies.
The
bottleneck occurs both within and outside the agencies. Within an agency, the
approval of contracts has to pass through the management hierarchy. Since no
fixed time is prescribed for each LeveL of approvaL, the process is often
unduly time consuming. Outside the agency, other management procedures
- 24 -
exacerbate the process. For PPA and PNR, for example, additional approvalfrom DOTC is needed for contracts above P 50 million (P 5 million for nego-tiated contracts) and Presidential approval is needed for all contracts aboveP 100 million (P 10 million for negotiated contracts). Further review ofcontracts by the Commission on Audit (COA) and NEDA creates additional delaysoutside the agencies. Starting in April 1986, COA mandated a review of allfeasibility studies for which contracts were signed after March 1984. Some ofthese projects had already started, but had to stop until COA approved thefeasibility study. The seriousness of the problem prompted a meeting withCOA, at which COA agreed to review feasibility studies on a selective basis.COA will, however, continue to pre-audit and post-audit contractors'billings. Thus, approvals that could be undertaken in two weeks may requiremonths and sometimes years to obtain.
3.6 Delays in contract processing became particuLarLy long during thepast few years when contract prices have had to be adjusted and price escala-tions recalculated due to currency devaluation and inflation. To demonstratethe seriousness of the problem, both DPWH and DLG have prepared estimates ofthe extra costs incurred due to unnecessary procedures and Lengthy processingtime. To cite a few examples:
(a) In DPWH, 21 months were wasted over a period of four years due towork stoppage by contractors not able to secure funding. The delaywas caused by a lengthy process for approving contract price adjust-ment and price escalations. Extra costs amounted to P 276 millionfor price escalations.
(b) A project at Lahug was delayed for 13 months because the contractwas not approved in time. Extra costs were estimated P 7 millionEor price escalation.
(c) A project at Dumangas was delayed for 10 months, leading to addi-tional costs of P 6.2 million in price escalations.
3.7 Another cause of delays is the sometimes weak quality and competenceof staff invoLved in the whole decision process. Some of the delays occursimply due to Lack of technical expertise at certain management Levels to makean appropriate decision within a reasonable length of time. The tendency isto retain documents for longer than required while clarifications are beingsought. It is therefore recommended that the procedures for contractapprovals should be streamlined in order to eliminate duplicate reviews.
Staffing and Management
3.8 Staffing and management of the sector agencies is uneven. WhiLe Lowgovernment salaries make it difficuLt to recruit and retain competent staff,this problem has been somewhat alLeviated by the general economic sLowdown,which has reduced the "brain drain" toward the private sector. As a result,working Level staff have in large measure remained in many agencies. On theother hand, and potentially a more serious problem, the number of managerialpositions that have changed incumbents after the change in government inFebruary 1986 appears to threaten the proper functioning and continuity of
- 25 -
some of the sectoral institutions. For example, DLG appears to have suffered
so many changes that its ability to carry out well-conceived provincial roads
projects in the short run is uncertain. There is a need for the Government to
strike a proper balance between political and professional career appointments
to remedy this situation.
3.9 Centralization of government authority has added to the ineffici-
encies in project implementation caused by slow contract processing. While
this problem has been widely recognized, and Government has recently been
moving toward decentralization, success so far has been limited. One impor-
tant issue is the readiness of regional offices to take over some of the
delegated responsibilicies and authority. A technical training nrogram for
local staff should therefore be established at the regional/provincial
level. The quality of local officials also varies greatLy, and many regionai
offices of both the agencies and COA are reluctant to take on extra responsi-
bilities. COA's i.egional offices, for exampLe, would not approve anything
that has not first been reviewed by COA headquarters, thus making their review
redundant.
C. Institutional Issues in the Subsectors
Roads
3.10 DPWH is responsible for national and rural (barangay) roads, while
provincial, city and municipal roads are under DLC. The secretaries of DPWH
and DLG submit their highway and rural road projects directly to NEDA for
inclusion in the Public Investment Program. A separate process is initiated
simultaneously for budget approval by the implementing agencies.
3.11 The principal institutional issue affecting the subsector invoLves
the responsibility for construction and maintenance of rural roads, which has
been shifted between the former Ministry of Public Works and the Ministry of
Local Government a number of times and is presently with DPWH. Despite the
official emphasis placed on rural roads, the frequent shift in responsibiLity
for the roads has resulted in unclear direction and the lack of a coherent
rural roads program. This issue deserves priority attention since ruraL r'oads
are the most important factor in lowering costs for farm-to-market transporta-
tion. As a first step in improving rural road maintenance, it is recommended
that local staff be involved in this work not only to simplify work fo-ce
arrangements, but also to boost local awareness of the importance of .oad
maintenance.
Urban
3.12 FunctionaL Responsibilities. At present, there is a substantial
amounc of jurisdicational overlap and corresponding uncertainty of -esponsi-
bility in almost all critical urban transport functions. At tne nationaL
level, national policy development, assiscance to local units of Government
for transport planning and traffic management, and traffic enforcement need
particular attention. At the Local Level, road construction and maintenance
responsibilities among DPWH, the cities, and the barangays need to be clari-
fied. The main agencies involved in urban transport services are discussed
below.
- 26 -
3.13 DOTC oversees virtually all aspects of urban passenger transport,including the licensing of private cars and other motorized vehicles, theissuing of route franchises for buses and jeepneys, and overall public trans-port planning. In addition, it is responsible for three government agenciesproviding passenger services in Metro Manila: the Light Rail TransitAuthority (LRTA), MMTC, and PNR which in 1986 carried about 171 millionsuburban cormnuter trips.
3.14 DPWH is responsible for the planning, design, construction andmaincenance of practically all urban thoroughfares, since they usually formpart of the national road system. In Manila, two special DPWH agencies playan importanc role in managing and improving the road system.
(a) The Traffic Control Center (TCC) was created in the Late 1970s toimplement the Traffic Engineering and Management (TEAM) project inMetro Manila. Under the ongoing reorganization of DPWH, it isproposed to establish this office on a permanent basis. Renamed theTraffic Engineering Center, it would continue to be responsible fortraffic planning, design and engineering, including installation,operation and maintenance of traffic signals and other trafficcontrol devices. While the focus of its activities would remain inMetro Manila where it now plays a key role, it would also providespecialized services to secondary cities such as Davao, Bacolod andIloilo.
(b) Created in 1972, the Urban Roads Project Office (URPO) has beenresponsible for the planning, design and construction supervision ofnew roads, bridges, flyovers and road widening projects. It is alsoinvolved in supervising civil works executed under the TEAM project,and generally works in close coordination with TCC. While most ofURPO's activities are concentrated in Metro Manila, it is alsoresponsible for extending the North and South Luzon expressways andfor civil engineering aspects of the Metro Cebu improvement project.
3.15 Several other agencies are also involved in important aspects ofurban transport. Traffic law enforcement for aLl cities is carried out by theIntegrated National Police, supported by the Constabulary Highway Patrol Groupfor major thoroughfares, and by craffic aides employed by cities and munici-palities. Traffic Law enforcement is widely regarded as one of the weakesclinks in the urban transport chain due to: (a) the unclear definition ofinstitutional responsibilities, (b) severe undermanning, and (c) widespreadcorruption.
3.16 Cities and municipalities are responsible for the planning, con-struction and maintenance of secondary streets under their jurisdiction(primary traffic arteries are under DPWH). The cities may also be consultedby DOTC on regulatory aspects of uE7an transport, and by the police on trafficenforcement aspects. Some cities _ in Metro Manila have established Traffic
4/ Metro Manila consists of 4 cities and 13 municipalities.
- 27
Coordination Councils which meet about three times a year and include repre-
sentatives of the City Engineer's offices, DOTC, DPWH, TCC, the police and
civic organizations. In addition, the municipal and city engineers of Metro
Manila confer about once a month, primarily to review issues concerning the
roads and drainage system.
3.17 The Metro ManiLa Commission (MMC) was created in the early 1980s to
coordinate, on a metropolitan-wide basis, the planning for such urban develop-
ment aspects as hou.ing, environmental management and transport. Besides its
overall, planning role, MMC has also been involved in some operational func-
tions (including solid waste management and, in the transport field, the
collection of curb parking charges and the deployment of traffic aides). rt
is generally expecced that MMC's importance may decline somewhat under the on-
going reorganization of government agencies.
3.18 As the plethora of agencies and their intermingling responsibilities
would indicate, the magnitude and complexity of Manila's transport issues
require special Government attention--and in general this attention is being
given. However, regulations and such aspects as jeepney licensing (done by
DOTC) are usually treated separately from the management (police) of street
space, even though all are functionally interrelated. While it is, for
example, recognized'that jeepneys contribute substantially to traffic conges-
tion in certain corridors, the current licensing rules (applied by DOTC) do
noc take into account the traffic capacities (determined by DPWH) of those
corridors. Bus lanes delineated in the 1970s by DPWH were poorly enforcea (by
the police) and were not coordinated with (DOTC's) public transport licensing
policy. In the past, these and other problems of interagency coordination
would have been dealt with by TRANSEC, a transport coordination mechanism
established for Metro Manila. Recently, however, TRANSEC became inactive, and
iC is strongly recommended that TRANSEC be revived (or some other, similar
organization created) and be given high-level support to improve mobility and
transport efficiency in Metro Manila.
3.19 Agency-Specific Issues. DOTC's two urban operating agencies, i.e.,
LRTA and MMTC, are heavily subsidized, and their organizational set-tit shoiK
be reviewed. With regard co LRTA, the Authority owns and establishes potLcies
for the rail line but actual train operations are run under contract by
METRORAIL, a subsidiary of the private electrical utility company, MERALCO.
This type of operating arrangement is unusual, and the high electricity costs
of the LRT make it appear likely that the current arrangement primarily bene-
fits the contractor at the expense of the Government-owned LRTA. LRT services
are complemented by the bus system run by MMTC, which in 1986 carried 75
million passengers compared to the LRT's 93 million. MMTC also manages a
lease-purchase arrangement for about 700 buses that are currently operated by
seven qrivate bus consortia. In view of MMTC's worsening financial posi-
tion,5 Government should review its policy of providing bus services both
5/ The estimated net Loss per bus-km has increased steadily from P 0.39 in
1983 to P 1.65 in 1986, or from a total of P 11.8 million (1983) to
P 38.7 million (1986).
- 28 -
through a government company and through the artificially stimulated consortia
of private bus operators.
Ports
3.20 PPA is responsible for planning and implementing ports projects.
After establishing a list of suitable projects on the basis of economic
criteria, PPA goes through an internal approval process, rhen submits the
approved projects to DOTC for review and coordination. Thereafter, the plans
are forwarded to NEDA to be included in the Public In-estment Program.
3.21 Institutional problems in the subsector have led to coordination
problems between the users and providers of port- and port-related services.
According to some users, refrigerated storage facilities at ports are misallo-
cated or nonexistent. Disincentives to building storage facilities at loading
and unloading points arise from (a) the requirement of a license to construct
and operate a private port facility; and (b) the requirement to pay the
Government a certain percentage of throughput value. Partially as a result,
refrigerated trucks are in effect "converted" to storage facilities, thereby
lengthening their turnaround time and adding to costs.
3.22 Another problem between users and providers comes from an archaic
law which specifies that interisland maritime cargo with a value over
P i,000/ton may be classified under ad valorem races. This contributes to the
chronic problems of high cost for farm-to-market transportation. Nowadays,
most cargo is worth over P 1,000/ton, and the law results in identical
shipping costs between Manila and Cebu and Manila and Davao, for exampLe. The
Cebu Chamber of Commerce has prepared a position paper containing suggested
legislation to remove the P 1,000 cutoff point. The level of port charges are
also being questioned by the users. MARINA, which has the power to set and
approve freight tariffs, and PPA, which determines port charges, clearly have
a roLe to play in this regard.
Railways
3.23 PNR has recently been experiencing many changes. A strong manage-
ment team was put in place in early 1987, and the new General Manager has been
given the difficult task of turning the company around. His presence at PNR
has made discussion of previous institutional issues obsolete, since, with the
help of PNR staff, he is attempting to correct the major problems which
formerly threacened PNR's viability.
3.24 A fundamental cleanup of PNR's books is also taking place. Since
PNR is unfairly burdened by heavy debt service obligations on loans which
brought no real assets for the company, attempts will be made to exclude these
obligations from PNR's financial statements. Separate accounts should also be
kept for railway and non-railway operations. Tariffs will be computed to
cover only those costs which can be fully accounted for by PNR.
- 29 -
Aviation
3.25 The Bureau of Air Transportation (BAT) is the national regulatory
body responsible for safety and operations in the aviaLion sector. Routes and
fares are regulated by the Civil Aeronautics Board (CAB). However, under
current institutional arrangements, BAT can take no direct action on safety
problems at the Manila International Airport (MIA) but must work through the
Manila International Airport Authority (MIAA) which concroLs all expenditures
for the airport. MIAA, however, has been very slow in reacting to BAT
complaints, citing Lack of funds.
3.26 Airline operators and charter and piLots associations have presented
position papers favoring the return of MIA to the controL of BAT. At present,
responsibiLities for the airport are split between the two agencies. Naviga-
tional aids at MIA are manned and maintained by BAT personnel, but the pro-
curement of instruments is done by MIAA. BAT pays for the training and
salaries of air traffic controllers, but is not reimbursed for these services
by MIAA. MIAA also receives alL iicome from MIA Landing fees and concess-
ioners, and about 35% of airport income; the remaining 65% is passed on to the
National Treasury. MIAM claims that 35% of income is sufficient to cover only
personnel expenditures, and therefore continues to receive a subsidy from the
Treasury.
3.27 BAT's own source of revenue is the Landing fee charged in outlying
airports around the country. If BAT were to absorb MIAA, the current subsidy
received by BAT from the Treasury could be cut by an estimated 50%. MIAA
requested a widening of its authority to cover the four international airports
at Cebu, Davao, Zamboanga and Laoag, but this request was not granted and
should not be entertained in the future.
IV. PUBLIC EXPENDITURE PROCRAMS IN THE TRANSPORT SECTOR
A. General
Investments
4.1 The transport sector investment plan prepared by the Government in
1984 for the period 1985-90 represented a considerable effort at reducing
and/or delaying transport investments commensurate with the Likely funding
available under the then-prevaiLing economic situation in the PhiLippines.
Every transport project estimated to cost more than P 300 milLion (about
USS15 million) was individually reviewed and possibiLities for further cut-
backs and rescheduling were openly explored. The pLan represented high
priority investments with high estimated rates of return and often consider-
able social benefits. The 1983 Level of investments was not expected to be
attained during the plan period.
4.2 The October 1986 Medium-Term Public Investment Program (MTPIP) for
1987-92 (Annex 2) represents a massive build-up to support economic recovery
and agro-industrial deveLopment compared to the 1985-90 program, which was

- 30 -
evaluated by the Bank two years ago. A comparison of the two programs is
shown in Table 4.1, based on adjusted inflation assumptions for MTPIP and the
recalculation of both programs in January 1987 prices (Table 4.2). The
highway subsector would receive the largest share of MTPIP funding, about 70%,
followed by the ports subsector with about 15Z.
Table 4.1: COMPARISON OF MTPIP (1987-92) ANDINVESTMENT PROGRAM FOR 1985-90
1985-90 program MTPIP 1987-92 Increase… (Million Pesos) - --- …()
Roads 21,041 36,853 75
Ports 3,607 8,063 123
Railways 1,418 2,604 84
Airports 1,177 2,049 74
Urbe.n 1,653 3,045 84
Total 28,896 52,614 82
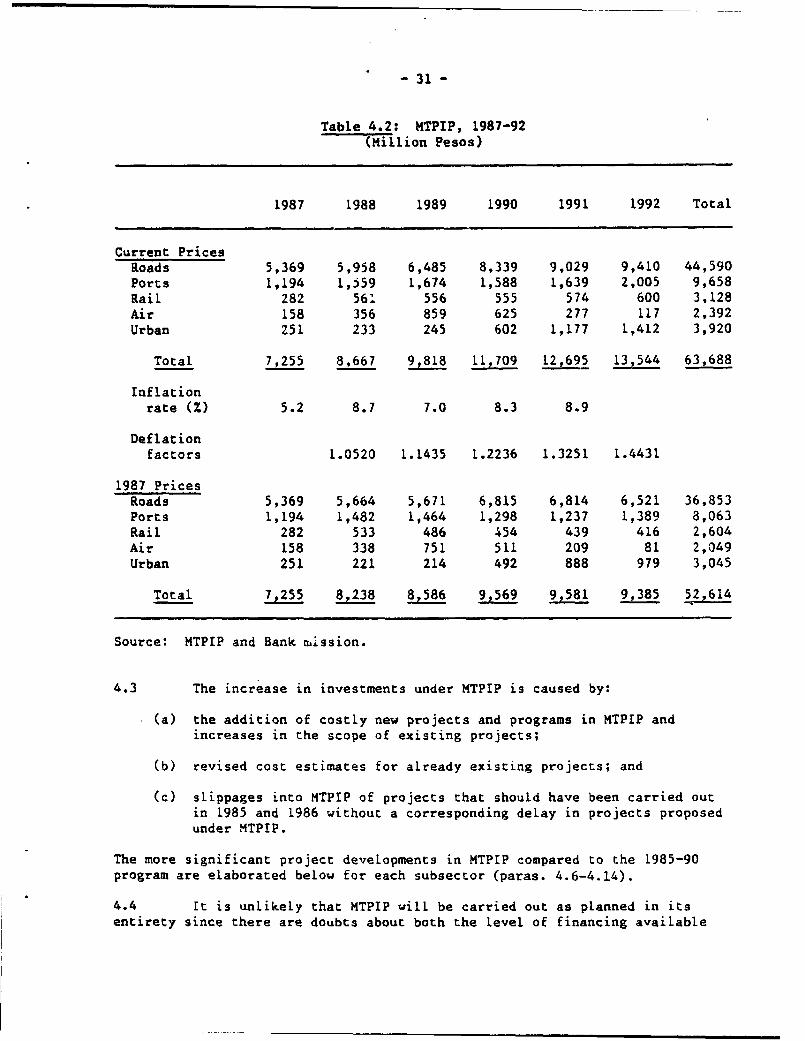
- 31 -
Table 4.2: MTPIP, 1987-92(Million Pesos)
1987 1988 1989 1990 1991 1992 Total
Current PricesRoads 5,369 5,958 6,485 8,339 9,029 9,410 44,590
Ports 1,194 1,j59 1,674 1,588 1,639 2,005 9,658
Rail 282 56. 556 555 574 600 3,128
Air 158 356 859 625 277 117 2.392
Urban 251 233 245 602 1,177 1,412 3,920
Total 7,255 8,667 9,818 11,709 12,695 13,544 63,688
Inflationrate (X) 5.2 8.7 7.0 8.3 8.9
Deflationfactors 1.0520 1.1435 1.2236 1.3251 1.4431
1987 PricesRoads 5,369 5,664 5,671 6,815 6,814 6,521 36,853
Ports 1,194 1,482 1,464 1,298 1,237 1,389 8,063
Rail 282 533 486 454 439 416 2,604
Air 158 338 751 511 209 81 2,049
Urban 251 221 214 492 888 979 3,045
Total 7,255 8,238 8,586 9,569 9,581 9,385 52,614
Source: MTPIP and Bank mission.
4.3 The increase in investments under MTPIP is caused by:
(a) the addition of costly new projects and programs in MTPIP and
increases in the scope of existing projects;
(b) revised cost estimates for already existing projects; and
(c) slippages into MTPIP of projects that should have been carried out
in 1985 and 1986 without a corresponding delay in projects proposed
under MTPIP.
The more significant project developments in MTPIP compared to the 1985-90
program are elaborated below for each subsector (paras. 4.6-4.14).
4.4 It is unlikely that MTPIP will be carried out as planned in its
entirety since there are doubts about both the level of financing available
- 32 -
and the implementation capacity of the respective agencies. Nevertheless, it
is a useful document to set objectives. Many of the projects included have
feasibility studies completed, showing economic rates of return sometimes
substantially above the 15% level customarily used in the Philippines for
transport projects. The projects that have not yet been evaluated have been
included in MTPIP based on prima facie viability which will be confirmed in
due course.
Operation and Maintenance
4.5 Actual operation and maintenance (O&M) expenditures recorded by the
Department af Budget and Management for the period 1982-86 and estimated for
1987 (Table 4.3) show relatively stagnant O&M expenditures up to 1985 (declin-
ing in real terms) followed by a substantial 53% increase in 1986. The
Government's O&M expenditures in the transport sector account for about 35% of
total seccor expenditures in 1986 and 1987 compared to about 28% in previous
years. While this percentage increase in itself does not constitute a suffi-
cient indication that O&M expenditures are adequate, it does show the
increased relative importance the Government attaches to maintenance. Since
O&M expenditdures are also increasing in absoLute amounts and assuming that the
increased Levels can be maintained during the 1987-92 period, this would help
reduce the backlog of deferred maintenance in the sector.

- 33 -
Table 4.3: O&M EXPENDITURES 1982-87
(Million Pesos)
1982 1983 1984 1985 1986 1987
Roads 1,211 1,176 1,4/0 1,229 2,207 2,321
DPWH 695 668 942 797 1,358 1,547
DOTC 56 56 75 66 60 107
DLG 460 452 454 365 789 668
Ports 240 244 305 307 400 585
PPA 225 228 284 288 371 553
DPWH 10 10 14 12 20 22
MARINA 5 6 7 7 9 10
Urban n/a 147 223 422 463 n/a
LRTA n/a n7a 8 ]74 278 n/a
MMTC n/a 147 215 248 185 n/a
Aviation 71 79 90 77 105 151
CAB 2 3 2 2 3 4
BAT 69 76 88 75 102 147
Rail 145 129 169 165 188 n/a
PNR 145 129 169 165 188 n/a
Total 1,667 1,775 2,257 2,200 3,363
Source: Department of Budget and Management, sector agencies.
B. Roads
Investments
4.6 The majority of investments proposed for the subsector seem justi-
fied. The only component to be watched is the program for "various LocaLLv
funded feeder/secondary and national roads," which, at P 17,036.5 miLLion in
current prices, would require 38% of the P 44,590.2 million requesced for the
program and is the principal reason for the Large increase of MTPIP over the
1985-90 program. The "various roads" program aims at benefiting the Less
developed areas of the country and contributes toward the Commuiiity Employment
Development Program. Iet also includes projects of the RegionaL Development
Councils which are stiLl subject to further review by NEDA. WhiLe the objec-
tives are worthwhile, the concern is that substantial funds may be spent
without corresponding physical assets being created due to capacity
constraints in selecting, evaluating, designing and implementing the huge
number of smail projects involved. The Government intends to use reliable

- 34 -
non-governmental organizations such as religious groups and the Red Cross to
augment its own implementation and monitoring capabilities for this important
program. If these efforts fail to produce the intended results, the program
should be reduced to more manageable levels, say 10-20% af the total road
program.
4.7 The only other comment is to reiterate the findings of the Bank's
1985 investment review that the Dugo-San Vicente road providing access to the
Port of San Vicente (Port Irene) should not be improved unless the port itself
is found to be julstified (see para. 4.10).
Operation and Maintenance
4.8 The relative emphasis given to road maintenance as opposed to
construction has changed significantly over the years. In 1980-81, about 671
of total expenditures was used for construction, with the remainder allocated
between maintenance (25Z) and administration (8%). By 1986, maintenance
expenditures had increased to about 30% of total expenditures.
C. Ports
Investments
4.9 The MTPIP port program includes three new projects with a total cost
of P 5,428.3 million in current prices, representing 56% of the P 9,657.8 mil-
lion port program. All three projects should be reduced as follows: (a) the
Port Cargo Handling Expansion Project costing P2,055.2 million appears to be
based on an outdated estimate in Japanese yen which should be recalculated
using current exchange rates. The project itself should be drastically
reduced to take into account equipment provided by the shipping lines them-
selves; (b) the Manila South Harbor Rehabilitation Project for P 1,059.5 mil-
lion should be delayed by a year in accordance with PPA's most recent projec-
tions, and the cost under MTPIP should be reduced to P 401.8 million; and
(c) the Tertiary Ports Project for P 2,313.7 million under DPWH represents a
huge increase over the 1985-90 program of P 118.3 million. If the efforts to
improve selection, implementation and monitoring capabilities fail, this
project is subject to the same reservations as given for the "various roads"
program above, and should be reduced to more manageable levels, say 10-20% of
the total port program.
4.10 The PPA share of the MTPIP ports program exceeds PPA's present
investment projections and should be reduced accordingly. The port of San
Vicence (Port Irene) remains questionable and should be postponed until its
justification has been established.
Operation and Maintenance
4.11 Since the early 1980s, PPA has received inadequate government
budgetary allocations for both investment and O&M purposes, with a consequent
effect on the condition of existing infrastructure. The allocations have been
less than PPA's generated revenue. However, on April 13, 1987, an Executive
Order was signed which allows PPA to operate as an independent corporation
- 35 -
with control over its financial resources. This permits PPA to use its
adequate revenues to make the expenditures necessary to properly maintain its
infrastructure and equipment and to make those capital investments deemed
essential by its Board of Directors.
D. Railways
4.12 PNR has embarked on a revitalization program to regain its
operations levels of the middle 1970s. While the financial viability of the
railway is doubtful, the type of railway investments proposed under MTPIP,
i.e., rehabilitation rather than new acquisition of motive power, rolling
stock and the permanent way, seem appropriate if PNR's assets are to remain in
operational condition. Expenditures on the northern line should be limited to
that part of the line which is used for passengers commuting in and out of
Manila. The rest of the northern line should be closed. The investment
amounts needed depend on how much equipment can be saved as a resuLt of
general operational improvements being carried out by PNR's new management.
Care should be taken against overinvesting in what has been and will Likely
continue to be a loss-making enterprise, the risk of underinvesting is not
negligible and should be considered if the railways are indeed to remain in
business. The alternative use of the railways' real estate assets for busways
and industrial deveLopment should be an integral part of any discussion
regarding the railways' future.
E. Aviation
4.13 The increase in investment in this subsector is accounted for by the
new Cebu International Airport Development Project at P 789.9 miLlion in
current prices. This project would provide better services for Cebu-bound
traffic and would relieve Manila International Airport of unnecessary transit
traffic. While there is no reason to question the project at this stage, its
economic justification should be established before implementation.
F. Urban
4.14 The substantial increase in urban investment is caused by the inclu-
sion-in MTPIP of new investments in the LRT system in Manila. Improvements to
line l and design/construction of Line 2 account for P 1,903.9 milLion .n
current prices. It is understood that these investments are incLuded subject
to confirmation of their economic viability. Any study of this question
should also consider the option of providing lower-cost alternatives to
upgrade public transport such as dedicated busways.
V. FUTURE ROLE OF THE BANK IN THE SECTOR
5.1 The Bank has been involved in the Philippine transport sector since
1961 when che first port loan was made. Since then, an additional 11 projects
for highways, rural roads, ports and shipping have been financed for a total
of USS549 million. The Bank has thus had a long association with the sector
and has built up a very productive collaborative association with the
Government. The continuation of this joint effort seems particularly impor-
tant at this juncture as the emphasis of the sector's development gradually
changes from provision of new infrastructure to maintenance of already exist-
ing assets.
- 36 -
5.2 In addition to continuing its support for the improvement of thecountry's transport infrastructure, the Bank should also continue to supportthe strengthening of sector institutions and the establishment of an appro-priate framework for planning and policy development. Assistance in attainingthese objectives is needed, given the country's constrained economic condi-tions. This report has highlighted several recommendations for policy reformand institutional improvements which, if implemented, would further strengthenthe performance of the sector. These recommendations are summarized below.The need now is to develop a suitable framework for their implementation andfor continued Bank support to the sector.
Needed Policy and Institution_ Changes
5.3 Sectorwide. Following the organizational restructuring of thesector (expected to be completed in early 1988), the key follow-up actionsshould include development of a short- to medium-term action plan for thesector, improving staff capabilities through training programs at theregional/provincial levels, preserving the institutional capacity fortransport planning and research developed over the last decade with Bankassistance, and streamlining institutional procedures, particularly forcontract awards and the professional career growth of civil servants.
5.4 Roads and Road Transport. The Government would best serve thepublic interest by adjusting its policies on vehicle and road user taxation,based on efficiency considerations and equity. Legal axle-load limits shouldalso be raised to reflect the network's generally high design standard. Themain institutional need is clarification of responsibility for rural roadsdevelopment and the involvement of local staff in maintenance activities.Planned investments in the sector are generally sound, although some programsshould be reduced due to strained implementation capabilities. With respectto road transport, both the freight and passenger carrier industries should bederegulated by allowing free entry into the industries, decontrolling prices,abolishing licensing distinctions between own-account and for-hire vehicles,reducing controlled supply of passenger services, and abolishing the CommonCarrier Tax. Interisland road-ferry transport should be encouraged.
5.5 Ports and Maritime Transport. rn order to promote a variety ofshipping services that are responsive to market demands, technologically up-to-date, and cost-effective, the Government should gradually deregulate themaritime transport industry and concentrate its efforts on safetyconsiderations. Specifically, this would entail gradual reforms to allow freeentry into the industry, deregulation of prices and the adoption of cost-related freight rates and port charges, privatization of certain activities ofPPA, and termination of the Bureau of Customs' involvement in domesticshipping. Regarding maritime safety, Government should undertake a study ofthe current situation and needs and, based on study recommendations, introducestricter criteria for inspetion of vessel seaworthiness. Investments proposedin MTPIP appear justified except for the port of San Vicente. However,proposed projects to expand cargo handling capacity, rehabilitate Manila'sharbor, and improve tertiary ports should be reduced to correspond toimplementation capabilities and actual needs.
5.6 The Railways. In view of extremely low traffic levels on therailway, PNR should be restructured to address the few sectors where rail
- 37 -
service is socially useful and cost-competitive. Railway accounts could be
adjusted to distinguish between railway and non-railway expenditures, and
investment on the north line should be limited to that part of the line
serving commuters in the Manila area. The rest of the line should be closed.
5.7 Aviation. Policies in the sector are largely satisfactory, although
the attempt of the Manila International Airport Authority to expand its
jurisdiction should continue to be checked. The proposed investment in a new
Cebu International Airport seems sound, but its economic justification should
be established prior to implementation.
5.8 Urban Transport. Severe traffic congestion in Manila should be
addressed by studying the adequacy of public transport planning for the city,
the feasibility of using dedicated busways for mass transit, and the
possibility of introducing road-use pricing to reduce congestion. Measures
should also be introduced to expand the traffic engineering program throughout
the city, restrain car imports, ease controLs on bus and jeepney entry into
the passenger transport market, upgrade public passenger services in high-
volume traffic corridors, restructure the organizational and financial
framework of bus services to make them commercially viable, and strengthen
traffic law enforcement. On the institutional side, TRANSEC, Manila's
recently-dissolved trans, et coordinating agency, should be revived to
coordinate the activities of the various agencies responsible for traffic
management in the city, and responsibilities of the Light Rail Transport
Authority and the Metro Transit Corporation, a bus company, should be reviewed
and, if necessary, rationalized, including MMTC's provision of public support
to seven private bus companies in Manila. For all cities, responsibilities
for urban road construction and maintenance should be clarified among DPWH,
the cities and barangays.
Proposed Bank Strategy
5.9 Included in the Government's Medium Term (1987-92) Investment
Program (Annex 2) are a number of projects that are suitable for Bank support
and would constitute a direct continuation of the Bank's past successful
involvement in highway programs with DPWH, rural roads with DLG and ports with
PPA. These possibilities should be pursued with the implementing agencies
concerned. In addition, the following factors suggest that the Government and
the Bank could now move towards a more general sectoral approach to transport
lending, in that:
(a) sector agencies have developed adequate experience in dealing with
planning, evaluation and implementation of complex projects within
their areas of responsibility;
(b) there is now a greater need to focus on the implementation of poLicy
reforms and adequate maintenance procedures than on specific invest-
ment proposals; and
(c) the resource transfer with sector lending could be faster and
respond more flexibly to changing country needs than with project
lending alone.

8~~~~~~~~~~~~~~3 - 38 -
5.10 It is therefore proposed that, in addition to pursuing follow-up
lending operations with DPWH, DLO, and PPA, the Bank and the Government should
develop a vehicle whereby funds could be released annually for use within the
sector against progress on a jointly-agreed policy agenda for the sector.Such annual sector loans would allow maximum flexibility to include project
components for financing as they are developed, without having to wait for
preparation of the next project loan cycle.
5.11 The policy agenda to be established would take into considerationnot only the technical, financial and economic benefits to the country but
also the socioeconomic and political aspects of any policy changes. This
report provides ample material to develop such a policy agenda. The task at
hand is to establish priorities among the many possible actions that could be
taken. While setting of pricrities is clearly the primary responsibility of
the Government, the Bank would view the following as major concerns.
5.12 On economic grounds, the priority policy actions would be expected
to include the gradual deregulation of the trucking and interisland shipping
industries and the restructuring of road user charges. Deregulation of
trucking and shipping would lead to more efficient transport services which
would yield economic benefits to the overall economy. During the implementa-
tion and adjustment phase, however, it would be necessary to protect both the
industries and their customers from violent swings in the pricing of transport
services.
5.13 The fiscal impact of restructuring road user charges would be
positive. The international parity price on automotive fuels should be
maintained to ensure that road users are not subsidized. Any upward adjust-
ment of diesel and gasoline taxes, which now comprise 79% of all road user
revenues, would result in additional revenues since demand for automotive fuel
is relatively inelastic. The restructuring of vehicle registration and
licensing fees and vehicle import duties is also needed to achieve a more
efficient distribution of the tax burden among road users while maintainingthe same overall level of revenue generation.
5.14 As to priority institutional issues, measures are needed to:
(a) institutionalize a capacity for transport planning and research;
(b) clarify responsibilities for rural roads development;
(c) protect professional career appointments; and
(d) streamline administrative procedures.
Other policy and institutional recommendations made in the report can be dealtwith simultaneously with or subsequently to the above, depending on the
relative difficulty of achieving the necessary national consensus and legis-
lative agenda.
5.15 During the next five years, efforts should be made to gradually
shift Bank assistance in the sector away from direct project loans and towards
annual transport sector loans to the Government, with an emphasis on policy
and institutional reform. The Government and the Bank, in embarking on the
- 39 -
proposed new approach to sector cooperation, will use this report as a source
document to catalyze and channel the sector dialogue and sector development
over this period. The extent and timing of the implementation of the report's
recommendations would, however, be subject to the economic, social and
political realities in the Philippines.
ANNE 1-40 - Page 1
PHILIPPINES
TRANSPORT SECTOR REVTEW
Summaries of Selected Transport Policy Studies
Title of Study: National Transportation Planning Project, Final Report
Date of Study: December 1982 Subsector: All ModesPrepared by: NTPP I
Study Objectives
(a) Comprehensive review of the transport sector;
(b) Prioritized list of transport investment projects for the period1983 to 1987, and indications of investments requirements for thefollowing ten years, covering all modes;
(c) Development of recommendations for the regulatory framework withinwhich the transport sector should operate; and
(d) Consolidation of a trained group capable of continuing this type ofwork.
Principal Findings and Recommendations
The Final Report of NTPP Phase I comprises an integrated descriptionof the transport situation, systematically built up through an area-by-areaanalysis (Central/North Luzon, South Luzon, Mindanao and Visayas), ideneifyingthe needs versus supply for transportation infrastructure. A prioritizedinvestment matrix of the four modes of transport (road, sea, air and rail) forche period 1983-87 was formulated. An indicative program was also drawn upfor 1988-92. Aside from the investment matrix, important recommendations ontransportation policies, regulations and pricing were made. Further, thelong-term viability of the Philippine National Railways (PNR) was questionedbecause of its continuing financial losses and operational inefficiencies.
Action Taken
The ten-volume report, particularly the transportation infrastruc-ture investment program for the period 1983-87, was noted and endorsed by theCabinet and the Office of the President. Since projects were included in theinvestment program based on pre-feasibility studies and NTPP's poLicy is notto be involved in detailed feasibility studies of specific projects, theimplementing agencies were encouraged to undertake such detailed feasibilitystudies, the results of which would be the basis for project impLementation.The 1983-87 investment program has largely been followed in determining whattransportation infrastructure projects are to be funded and implemented duringthe period. The five-year period is nearing its end but it is expected thatnot all recommended projects will be implemented or completed. A spillover of
-41 - ANNEX 1Page 2
projects to the next planning period 1987-92 is inevitable. This has been
taken into account in the formuiation of the Philippine Development Plan for
1987-92 and in the Medium-Term Public Investment Program covering the same
period. The fate of PNR was twice elevated to the Cabinet (in 1983 and 1984)
but no clear decision was made.
Follow-Up
On the basis of the NTPP Final Report, various modal studies,
feasibility studies and policy studies were identified. These were undertaken
in the second and third phases of NTPP. Because the studies evolved from a
comprehensive macro study to specific modal studies, a new title was attached,
i.e., Programs and Projects Formulation Study for Transportation (PPFST).
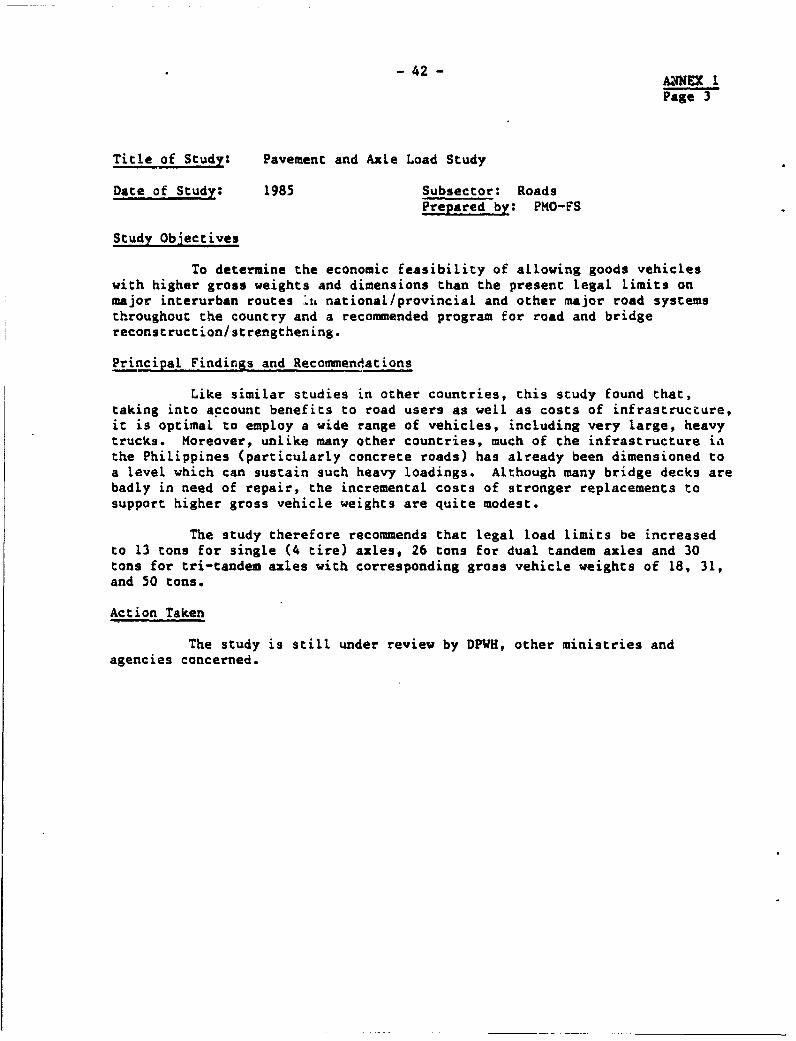
-42- A6NNEX 1
Page 3
Title of Study: Pavement and Axle Load Study
Date of Study: 1985 Subsector: RoadsPrepared by: PMO-FS
Study Objectives
To determine the economic feasibility of allowing goods vehicleswith higher gross weights and dimensions than the present Legal limits onmajor interurban routes t.tl national/provincial and other major road systemsthroughout the country and a recommended program for road and bridgereconstruction/ strengthening.
Principal Findings and Recommendations
Like similar studies in other countries, this study found that,taking into account benefits to road users as well as costs of infrastrucLure,ic is optimal to employ a wide range of vehicles, including very large, heavytrucks. Moreover, unlike many other countries, much of the infrastructure in1the Philippines (particularly concrete roads) has already been dimensioned toa level which can sustain such heavy loadings. Although many bridge decks are
badly in need of repair, the incremental costs of stronger repLacements tosupport higher gross vehicle weights are quite modest.
The study therefore recommends that legal load limits be increasedto 13 tons for single (4 tire) axles, 26 tons for dual tandem axles and 30tons for tri-tandem axles with corresponding gross vehicle weights of 18, 31,
and 50 tons.
Action Taken
The study is still under review by DPWH, other ministries andagencies concerned.
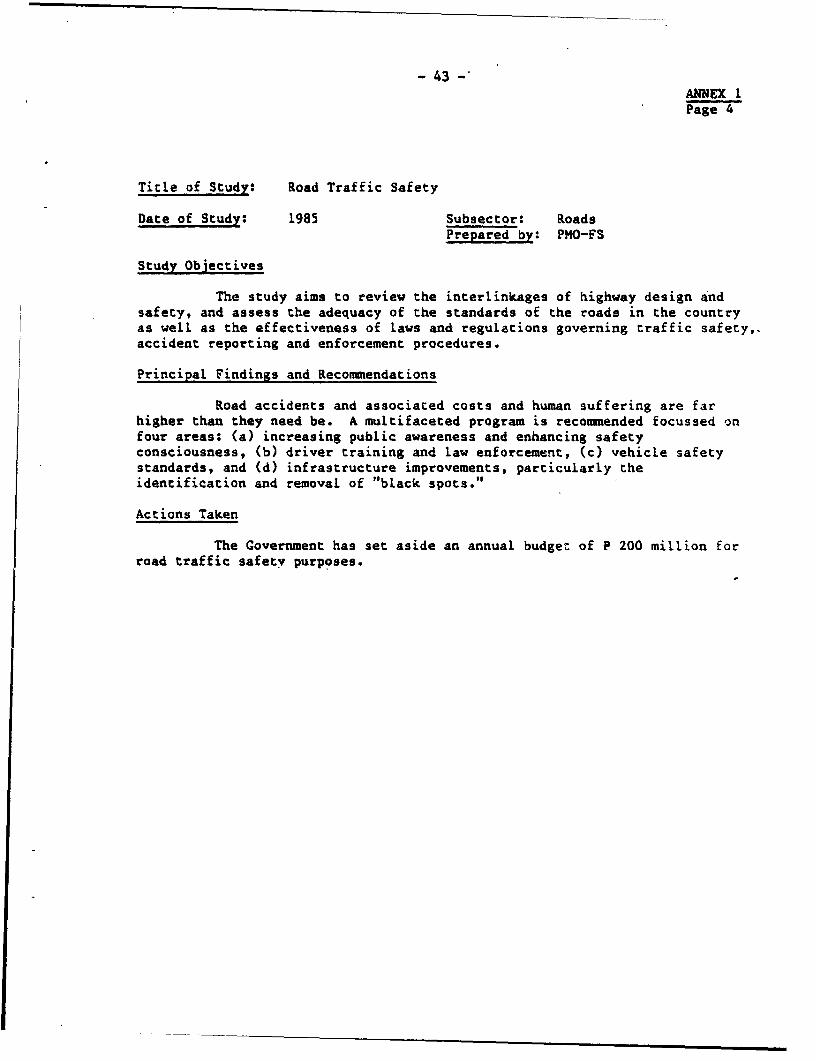
- 43 -ANNEX IPage 4
Title of Study: Road Traffic Safety
Date of Study: 1985 Subsector: RoadsPrepared by: PMO-FS
Study Objectives
The study aims to review the interlinkages of highway design and
safety, and assess the adequacy of the standards of the roads in the country
as well as the effectiveness of laws and regulations governing traffic safety,.
accident reporting and enforcement procedures.
Principal Findings and Recommendations
Road accidents and associated costs and human suffering are far
higher than they need be. A multifaceted program is recommended focussed on
four areas: (a) increasing public awareness and enhancing safety
consciousness, (b) driver training and law enforcement, (c) vehicle safety
standards, and (d) infrastructure improvements, particularly the
identification and removal of "black spots."
Actions Taken
The Government has set aside an annual budget of P 200 million for
road traffic safety purposes.
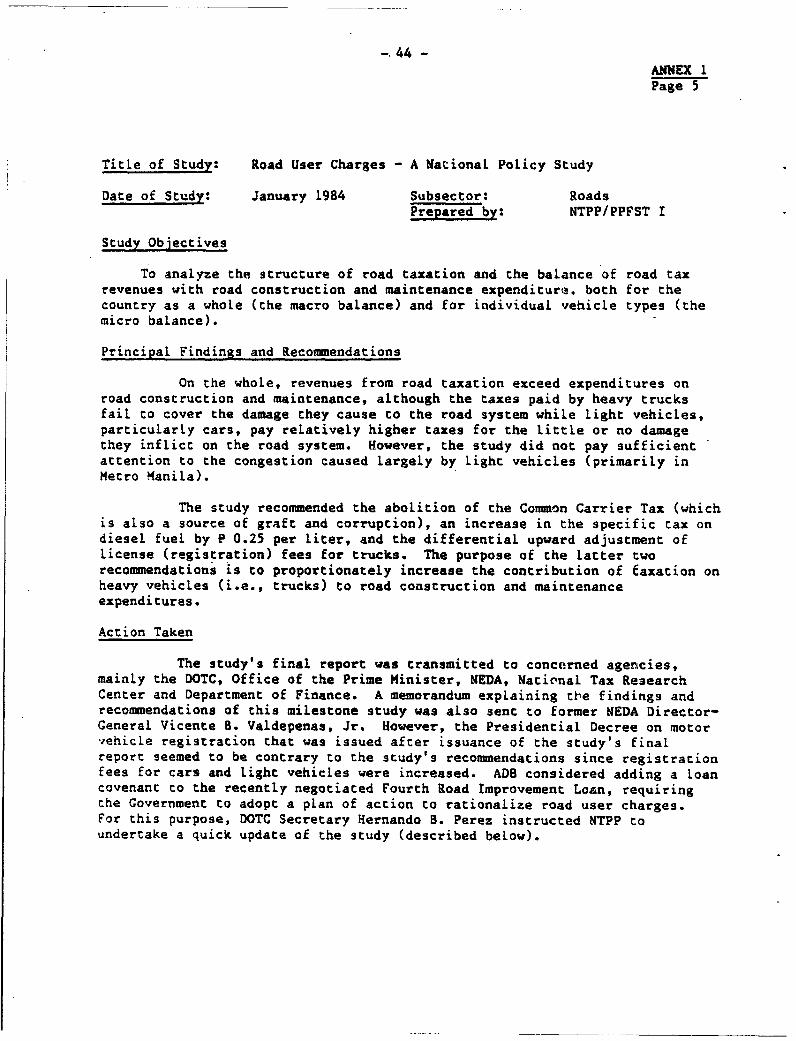
- 44 -ANNEX 1Page 5
Title of Study: Road User Charges - A National Policy Study
Date of Study: January 1984 Subsector: RoadsPrepared by: NTPP/PPFST I
Study Objectives
To analyze the structure of road taxation and the balance of road taxrevenues with road construction and maintenance expenditure. both for the
country as a whole (the macro balance) and for individual vehicle types (themicro balance).
Principal Findings and Recommendations
On the whole, revenues from road taxation exceed expenditures on
road construction and maintenance, although the taxes paid by heavy trucksfail to cover the damage they cause to the road system while light vehicles,particularly cars, pay relatively higher taxes for the little or no damagethey inflict on the road system. However, the study did not pay sufficientattention to the congestion caused largely by light vehicles (primarily in
Metro Manila).
The study recommended the abolition of the Common Carrier Tax (whichis also a source of graft and corruption), an increase in the specific tax ondiesel fuel by P 0.25 per liter, and the differential upward adjustment of
license (registration) fees for trucks. The purpose of the latter tworecommendations is to proportionately increase the contribution of caxation on
heavy vehicles (i.e., trucks) to road construction and maintenanceexpenditures.
Action Taken
The study's final report was transmitted to concerned agencies,mainly the DOTC, Office of the Prime Minister, NEDA, Nacienal Tax ResearchCenter and Department of Finance. A memorandum explaining tile findings andrecommendations of this milestone study was also sent to former NEDA Director-General Vicente B. Valdepenas, Jr. However, the Presidential Decree on motorvehicle registration that was issued after issuance of the study's finalreport seemed to be contrary to the study's recommendations since registrationfees for cars and light vehicles were increased. ADB considered adding a loancovenant to the recently negotiated Fourth Road Improvement Loan, requiringthe Government to adopt a pLan of action to rationalize road user charges.For this purpose, DOTC Secretary Hernando B. Perez instructed NTPP toundertake a quick update of the study (described beLow).

- 45 - ANNEX 1Page 6
Title of Study: Update of the 1984 Road User Charges - A National Policy
Study
Date of Study: February 1987 Subsector: Roads
Prepared by: NTPP/PPFST I
Study Objectives:
The report is an update of the 1984 report. The same approach and
methodology were used but fuel prices were adjusted to 1986 levels and an
inflation factor of 1.9 was appLied to other cost inputs. Once again
insufficient attention was paid to congestion costs reLated primarily
to light
vehicles.
Principal Findings and Recommendations
Basically, the recommendations remained the same, only the figures
changed:
- Remove the common carrier tax from both buses and trucks;
- Increase differentially the license fees for both for-hire and
private trucks to: P 1.20/kg for 2-axle and 3-axle trucks and
P 0.40/kg for all tractor-trailer unics;
- Increase the diesel fuel tax by P 1.00;
- Consider reducing sales taxes/import duties on vehicles and spare
parte, with the biggest reductions applied to buses.
The fourth recommendation was based on other NTPP studies, i.e.,
Study of Road Transportation Regulation and Road Transportation Industry
Study.
Action Taken
The report has been transmitted to all concerned government
agencies. It was presented at a meeting of the Committee on Transport
Planning for deliberation and was referred to DOF and the National Tax
Research Center for comments, which are still to be received.
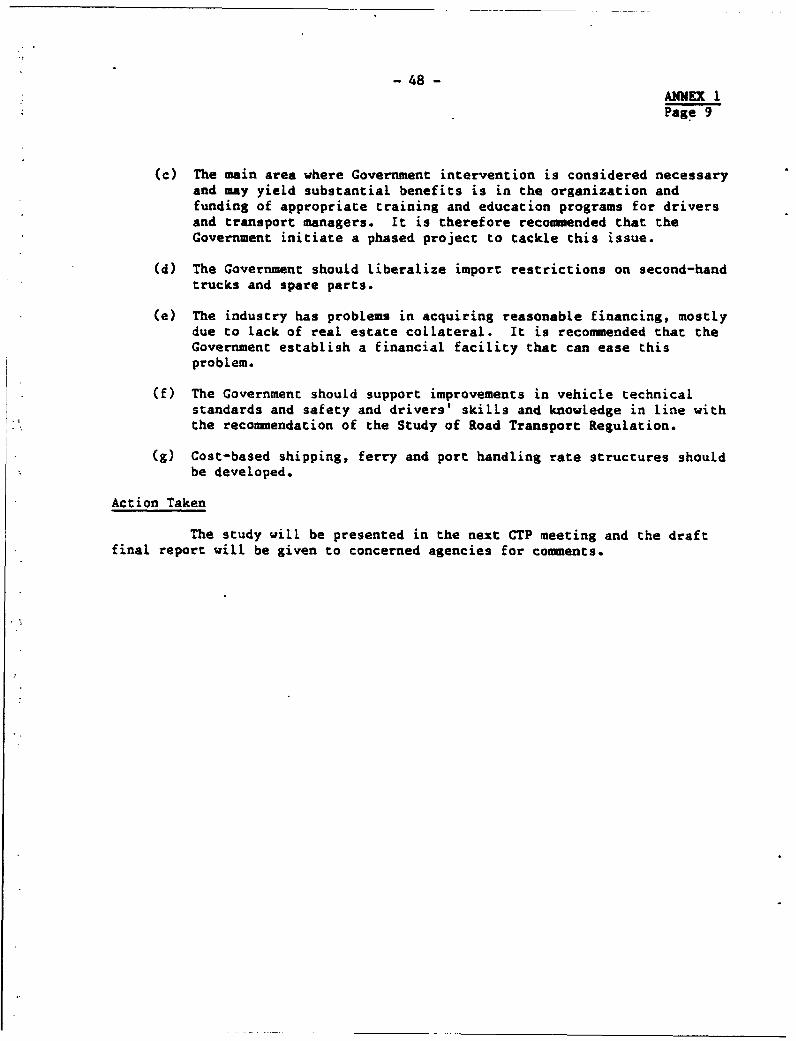
- 48 -ANNEX 1Page 9
(c) The main area where Government intervention is considered necessary
and may yield substantial benefits is in the organization andfunding of appropriate training and education programs for drivers
and transport managers. It is therefore recommended that the
Government initiate a phased project to tackle this issue.
(d) The Government should Liberalize import restrictions on second-hand
trucks and spare parts.
(e) The industry has problems in acquiring reasonable financing, mostly
due co lack of real estate collateral. It is recommended that the
Government establish a financial facility that can ease thisproblem.
(f) The Government should support improvements in vehicle technicalstandards and safety and drivers' skills and knowledge in line with
the recommendation of the Study of Road Transport Regulation.
(g) Cost-based shipping, ferry and port handling rate structures should
be developed.
Action Taken
The study will be presented in the next CTP meeting and the draft
final report will be given to concerned agencies for comments.
- 49 -ANNEX 1Page 10
Title of Study: Study of the Provision of Statistics on Road Freight Flows
and Trucking Industry
Date of Study: March 1987 Subsector: TruckingPrepared by: NTPP/PPFST I
Study Objectives
The study's objectives were to develop within DOTC a strong
management information system to process road freight and trucking industry
statistics. The country's road system carries about 65% of total nationwide
freight movements.
Principal Findings and Recommendations
Since there is as yet no regular collection and reporting of
reliable statistics on the freight and trucking industry, the study approach
adopted was to design a hypothetical "application" on the assumption that data
on freight and trucking will ultimately be available to be integrated and
manipulated as part of a future coordinated data base that encompasses the
whole area of national statistics on transportation. Hence, the study by
defining the first "application" to the prospective (integrated) data base
attempted to make an early, modest contribution towards promoting what is
needed.
This study was, in retrospect, premature. Two essential steps
should have been completed first: (a) definition of the objectives and
specific contents of the data base required for national transport pLanning
and management; and (b) delineation of a scheme for implementation of data
collection by the various agencies concerned.
Future works will preferably be under an inter-agency approach,
particularly under the aegis of the Inter-Agency Committee on Transportation
and Communications Statistics (IACTCS). The DOTC presence, however, should be
reinforced by more inputs from the Department's Planning Service which has
been active in measuring performance in the transport system and has thereby
more experience and expertise to offer the Committee than has DOTC/MIS.
- 50 -ANNEX 1Page 11
Title of Study: Interisland Shipping Regulation Study
Date of Study: June 1986 Subsector: ShippingPrepared by: NTPP/PPFST I
Study Objectives
The objectives of this study were to assess pricing and entry
regulations in the domestic shipping industry with the objective of
encouraging investment in new equipment and promoting better service and
competition.
Principal Findings and Recommendations
The study issued two reports, namely, A Study of Incer-Island
Shipping Regulations and a Ship Replacement Program Study. The former's main
recommendation is that government regulation be replaced with so-called "self-
regulation" by the shipping lines, but that Marina should retain powers to
encourage high load factors and to monitor the "fairness" of tariffs. In
respect to shipping safety, the study suggested that ideally vessel
inspections and responsibility for ship stability tests be transferred (from
the Philippine Coast Guard) to recognized classification societies. If the
inspection of all ships by recognized classification societies seems too
onerous, it is recommended that a limited program of inspection be set up for
the most dangerous age brackets--say, all ships over 25 years old.
The Ship Replacement Program Study recommended that such a program
be pursued, and that the best way to ensure ship replacement would be a
combination of "stick and carrot." The main stick would be compulsory
classification and stability checks for all ships aged 25 years or more, i.e.,
about 94 ships, 48 of which were liner ships in 1986. Without such a concrete
measure, it seems unlikely that shipping Lines will initiate replacement of
old ships which tend to be on low-revenue routes, even with the availability
of low-cost finance, which would be the main carrot.
Action Taken
The report has been finalized and presented to the Committee on
Transport Planning. However, no decisions have yet been made to adopt and
implement the recommendations of the study.
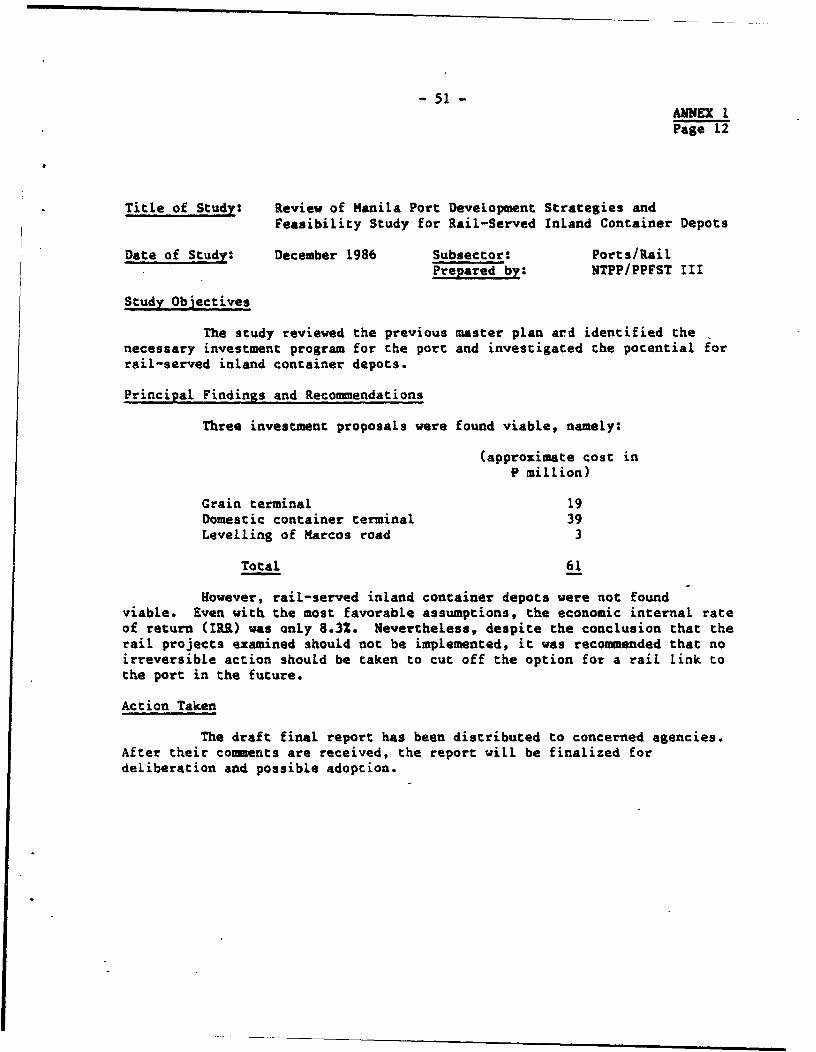
-51-
ANNX 1Page 12
Title of Study: Review of Manila Port DeveLopment Strategies and
Feasibility Study for Rail-Served Inland Container Depots
Date of Study: December 1986 Subsector: Ports/RailPrepared by: NTPP/PPFST III
Study Objectives
The study reviewed the previous master plan ard identified the
necessary investment program for the port and investigated the potential for
rail-served inland container depots.
Principal Findings and Recommendations
Three investment proposals were found viable, namely:
(approximate cost inP million)
Grain terminal 19
Domestic container terminal 39
Levelling of Marcos road 3
Total 61
However, rail-served inland container depots were not found
viable. Even with the most favorable assumptions, the economic internal rate
of return (IRR) was only 8.32. Nevertheless, despite the conclusion that the
rail projects examined should not be implemented, it was recommended that no
irreversible action should be taken to cut off the option for a rail link to
the port in the future.
Action Taken
The draft final report has been distributed to concerned agencies.
After their comments are received, the report will be finalized for
deliberation and possible adoption.
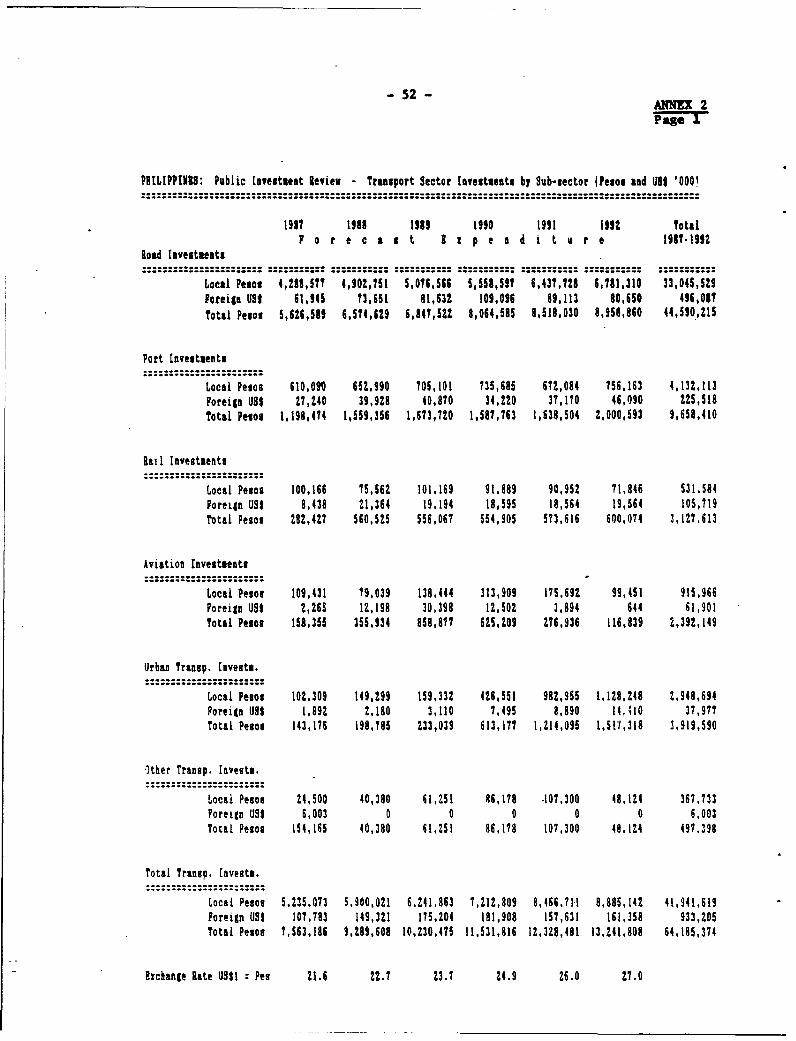
- 52 - 52~~~~~~~~~~~ ANNEX 2Page 1
PRILIPPINIS: Public lnvesteent Reviev - Transport Sector tnvestuents by Sub-sector (Pesos and USI '000!
19187 1988 1989 1990 1991 1992 TotalF o r e c a s t I I p e a d i t I r e 198111992
load Investments
Local Pesos 4,288,5?? 4,902,751 5,016,566 5,558,591 6,437,728 6,781,310 33,045,529foreign USI 61,945 73,651 81,632 109,096 89,113 80,650 496,08O
Total Pesos 5,626,589 6,574,629 6,847,521 8,064,585 8,518,030 8,958,860 44,590,215
Port Investments
Local Pesos 610,0" 652,990 705,101 735,685 672,084 756,163 4,132,113Foreign US$ 27,240 39,928 40,870 34,220 37,170 46,090 225,518
Total Pesos 1,198,414 1,559,356 1,673,720 1,587,763 1,638,504 2,000,593 9,658,410
Rail Investments
Local Pesos 100,166 75,562 101,169 91,889 90,952 71,846 531,584Foreign USS 8,438 21,364 19,194 18,595 18,564 19,564 105,719
Total Pesos 28t,Z4? 560,525 556,06? 554,905 573,616 600,074 3,127,613
Aviation Investments
Local Pesos 109,431 79,039 138,444 313,909 175,692 99,451 915,966Foreign US$ 2,265 12,198 30,398 12,502 3,894 644 61,901Total Pesos 158,355 355,934 858,81? 625,209 Z76,936 116,839 2,392,149
Urban tranap. Invests.
Local Pesos 102,309 149,299 159,332 426,551 982,965 1,128,248 2,948,694Foreign U99 1,892 2,180 3,110 7,495 8,890 14,410 37,977Total Pesos 143,176 198,185 233,039 613,177 1,214,095 1,511,318 3,919,590
Other Transp. Invests.
Local Pesos 24,500 40,380 61,251 86,178 107.300 48,124 367.733Forelin U11 6,003 0 0 0 0 0 6,003Total Pesos 154,165 40,380 61,251 86,178 107,300 48,124 497.398
Total Transo. Invests.
Local Pesos 5,235,073 5,900,021 6,241,863 7,!12,809 8,466.711 8,885,142 41,941,619Foreign US9 107,783 149,321 175,204 181,908 157,631 161,358 933,205Total Pesos 7,563,186 9,289,608 10,230,475 11.531,816 12,328,481 13,241,808 64,185,374
Exchange Rate US91: Pes 21.6 22.7 23.7 24.9 26.0 27.0
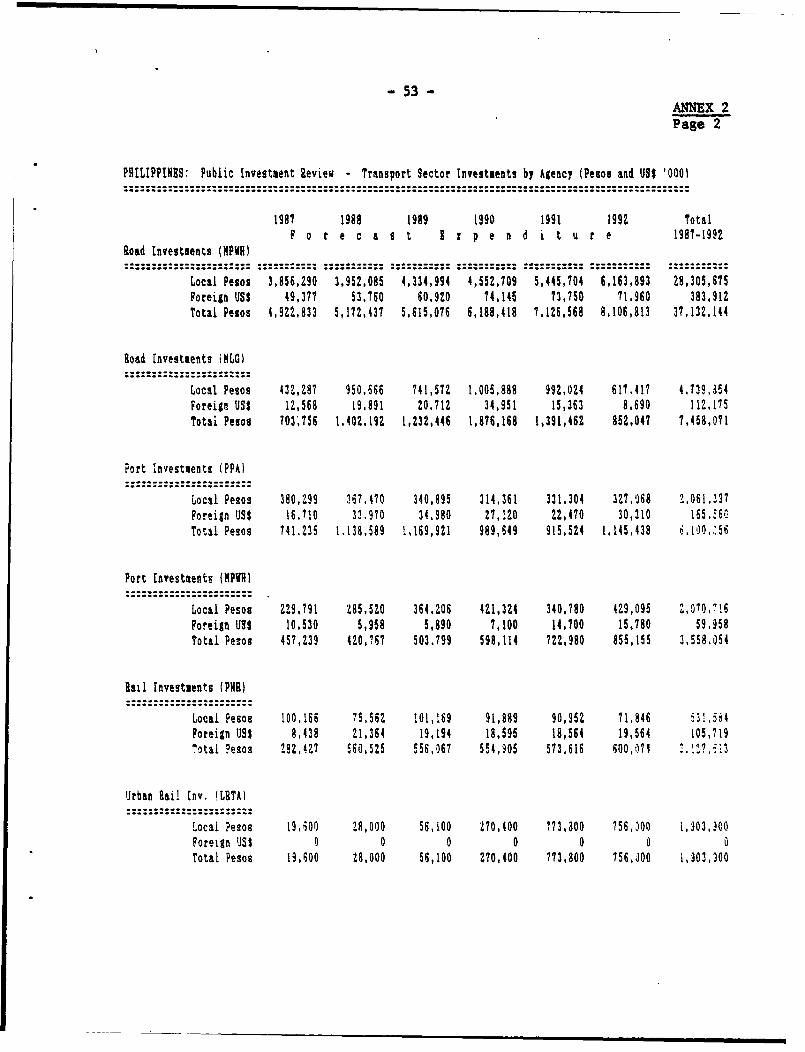
- 53 -ANNEX 2Page 2
PHILIPPINES: Public Investment Reviei - Transport Sector Investaents by Agency (Pesos and US$ '0001
1987 1988 1989 1990 1991 1992 Total
F o t e c a s t 8 x p e n d i t u r e 1987-1992
Road Investsents (HPVH)
Local Pesos 3,856,290 3,952,085 4,334,994 4,552,709 5,445,704 6,163,893 28,305,675
Foreign USS 49,377 53,760 60,920 74,145 73,750 71.960 383,912
Total Pesos 4,922,833 5,172,437 5,615,076 6,188,418 7,126,568 8,106,813 37,132,144
Road Investaents HNLG)
Local Pesos 432,287 950,666 741,572 1.005,888 992,024 617.417 4,739,354
Foreign US3 12,568 19,891 20.712 34,951 15,363 8,690 112,175
Totai Pesos 703,756 1,402,192 1,232,446 1,876,168 1,391,462 852,047 71,458,071
Port investjents (PPA)
Local Pesos 3e0,299 W67,470 340,895 314,361 331,304 327,0J68 2,061,337
Foreign USS 16.710 33.970 34,980 27,120 22,470 30,310 165.'60
Total Pesos 741.235 1.138,589 !,169,921 989,649 915,524 1.145,438 6,100,^56
Port tnvestaents (NPVR)
Local Pesos 229,1791 285,520 364,206 421,324 340,780 429,095 8,070.1?6
Foreign USS 10,530 5,958 5,890 7,100 14,700 15,780 59,958
Total Pesos 457,239 420,767 503.799 598,114 722,980 855,155 3,558,054
Rail Investments (PNR)
Local Pesos 100,166 75,562 101,169 91,889 90,952 71,846 531,584
Foreign US$ 8,438 21,364 19,194 18,595 18,564 19,564 105,719
^otal Pesos 282,M27 S60,525 556,067 554,905 573616 500,0174 3.-.5 ;3
Urban Rail Inv. (LRTAI
Local ?esos 19.o00 88,000 56,100 270,400 773,300 756,300 1,303,300
Foreign US3 0 0 0 0 0 0 0
Total Pesos 13,500 28,000 56,100 270,400 713,800 756,000 1,303,300

- 54L -
54 ANNEX 2Page 3
Aviation Invests. ({BATI
Local Pesos 109,431 79,039 138,444 313,909 175.692 99,451 915,966Foreign US$ 2,265 12,198 30,398 12,502 3,894 644 61,901Total Pesos 158,355 355,934 858,877 625,209 2176,936 116,839 2,392,149
Urban Road Investments
Local Pesos 82,709 121.299 103,232 156,151 209,155 372,248 1.044,794Foreign US3 1,892 2,180 3,110 7,495 8,890 14,410 37,977Total Pesos I23,576 1TO,785 176,939 342,777 440,295 761,318 Z,0151690
Other Trp. Investments
Local Pesos 24,500 40,380 61,251 86,178 107,300 48,124 367,733Foreign US3 6,003 0 0 0 0 0 6,003Total Pesos 154,165 40,380 61,251 86,178 107,300 48,124 497,398
Total Trp. lnvestments..........
Local Pesos 5,235,073 5,900.021 6,241,863 7,212,809 8,466,711 8,885,142 41,941.619Foreign US3 107,783 149,321 175,204 181,908 157,631 161,358 933,205Total Pesos 7,563,186 9,289,608 10,230,475 11,531,816 12,328.481 13,241,808 64,185,374
3Schange Rate US31:Pesos 21.6 22.7 23.7 24.9 26.0 27.0
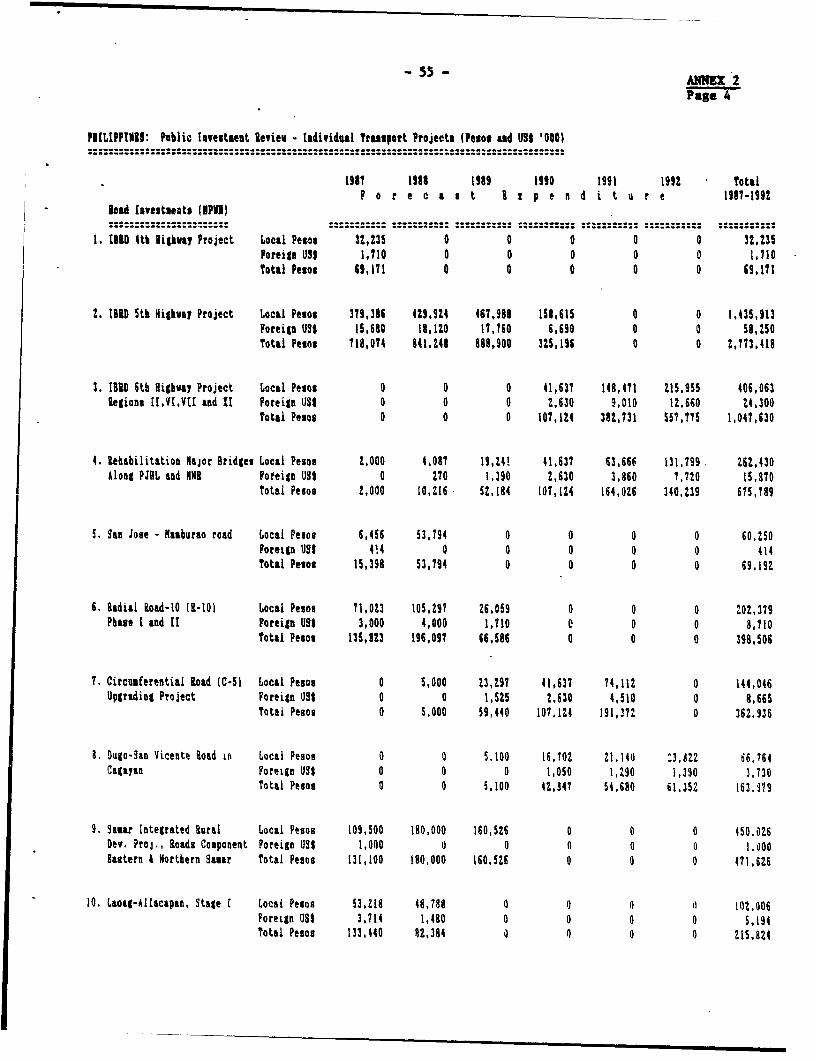
- S5ANNX 2
PIILIPPINIS: hPblic laweateeat Review - Individual Truasport Projects (Pesos ad U91 '000)
I917 1981 1989 1990 1991 1992 Total
P o r e c a s t Ii p e n d i t u r e 1981-199t
load ltaestiests 10P8)
1. tInD 4th 3glhua Project Local Pesos 32,235 0 0 0 0 0 32,235
Foreign US1$ 1,710 0 0 0 0 0 1,710
Total Pesos 69,171 0 0 0 0 0 69,171
2. Ifu Sth 8igLhva Project Local Pesos 379,386 421,921 467,988 158,615 0 0 1,435,913
Foreign U3$ 15,680 18,120 17,760 6,1690 0 0 58,250
Total Pesos 718,074 841,248 888,900 325,19S 0 0 2,773.418
3. IBID 6th 8ighway Project Local Pesos 0 0 0 41,637 148,471 215,955 406,063
Regions [I,YE,VEI and I Foreign US$ 0 0 0 2,630 9,010 12,660 Z4,300
total Pesos 0 0 0 107,124 382,731 557,775 1,047,630
4. Rehabilitation Major Bridges Local Pesos Z,OOO 4,087 19,14' 41,637 63,666 131.799 262,430
Along PJHL and N8 Foteign US 0 2170 1,390 2,630 3,860 7,720 15,370
total Pesos 2,000 10,t16 52,184 101,124 164,0Z6 340,Z39 615,789
5. San Jose - Ramburao road Local Pesos 6,456 53,794 0 0 0 0 60.250
Foreign Ut 4!4 0 0 0 0 0 414
Total Pesos 15,398 53,794 0 0 0 0 69,192
6. Radial Road-10 (R-10 Local Pesos 71,O3 105,297 26,059 0 0 0 202,1379
Phase I and 11 foreignr U9t 3,000 4,000 1,710 C 0 0 8,710
Total Pesos 135,823 196,097 66,586 0 0 0 398,506
T. Circumferential load (C-51 Local Pesos 0 5,000 t3,297 41,637 74,112 0 144,046
Upgrading Project Foreign US9 0 0 1,525 2,630 4,510 0 8,665
Total Pesos 0 5,000 59,440 107,124 191,372 0 362.936
8. Dugo-San iicente Road in Local Pesos 0 0 5.100 16,702 21,140 Z3,d22 66,764
Cagayan Foreign U9S 0 0 0 1,050 1,290 1,390 3,730
Total Pesos 0 0 5,100 42,847 5i.680 61,352 163.979
9. Samar Integrated Rural Local Pesos 109,500 180,000 160,526 0 0 0 450.026
Dev. Proj., Roads Cosponent Foreign US, 1,000 0 0 I 0 0 1,000
Eastern & Northern Samar Total Pesos 131,100 180,000 160.526 0 0 0 471,626
10. Laosg-Allacapan, Stage I Local Pesos 53,218 48,788 0 0 0 O 102,006
Foreign US, 3,714 1,480 0 0 0 0 5,194
Total Pesos 133.440 82,384 0 n 0 0 215,824
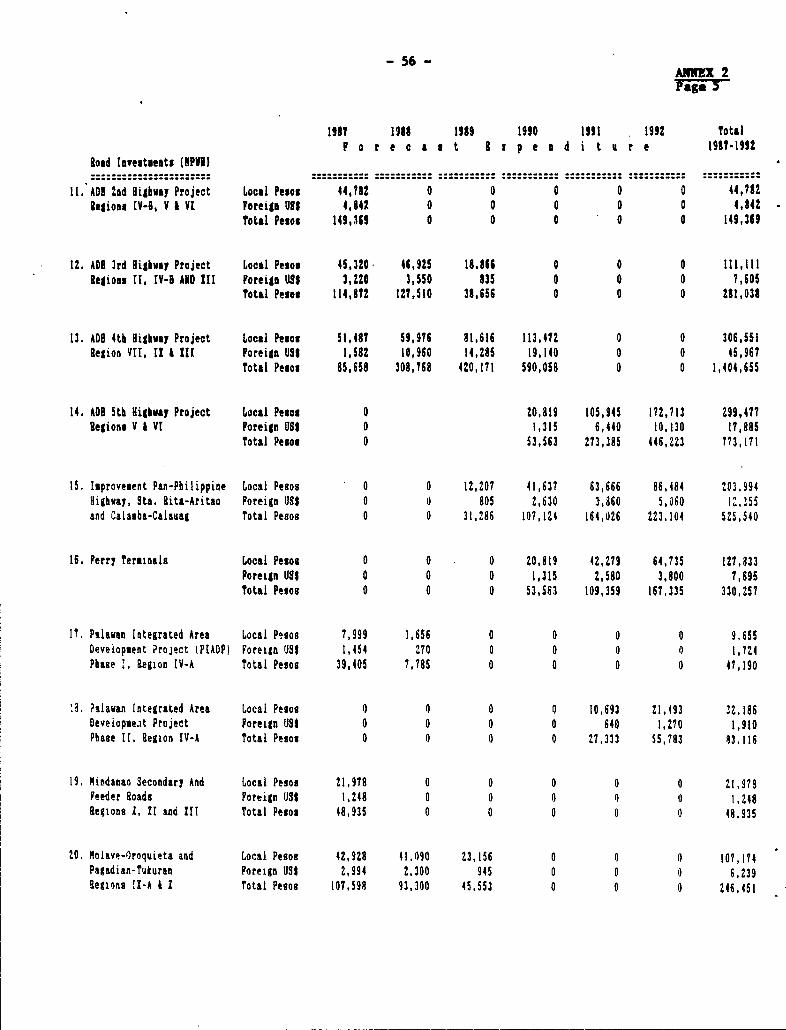
- 56 -ARNMX 2
1917 1918 1989 1990 1991 1992 TotalF o r e ca s t 3 h p e n d i t a r e 1981-1992
Roakd Investments (NFVE)
11. ADD :Ad Highnay Project Local Pesos 44,781 0 0 0 0 0 44,782Regions tV-B, V I VI Foreign US$ 4,842 0 0 0 0 0 4,842 -
Total Pesos 149,369 0 0 0 0 0 149,369
12. ADD 3rd Highway Project Local Pesos 45,320 46,925 18,866 0 0 0 111,111legions 11, [V-B AND III Foreigt U5 3,220 3,550 835 0 0 0 7,605
total Pesos 114,182 127,510 38,656 0 0 0 281,038
13. ADD 4th Bighway Project Local Pesos 51,487 59,976 81,616 113,472 0 0 306,551Region VII, 11 b III Foreign U9t 1,582 10,960 14,285 19,140 0 0 45,96?
Total Pesos 85,658 308,768 420,171 590,058 0 0 1,404,655
14. AD8 5th Higlway Project Local Pesos 0 20,819 105,945 172,713 299,477legions V I VI Foreign 185 0 1,315 6,440 10,130 17,885
Total Pesos 0 53,563 273,385 446,223 773,171
15. Isprovesent Pan-Philippine Local Pesos 0 0 12,207 41,637 63,666 86,484 203,994Highway, Sta. Rita-Aritao Foreign US5 0 O 805 2,630 3,860 5,060 !,155and Calasba-Calauag total Pesos 0 0 31,286 107,124 164,026 223,104 525,540
16. Ferry tersinals Local Pesos 0 0 - 0 20,819 42,279 64,735 127,833Foreign US5 0 0 0 1,315 2,580 3,800 7,695total Pesos 0 0 0 53,563 109,359 167.335 330,257
17. Palawan Integrated Area Local Pesos 7,999 1,656 0 0 0 0 9,655Developaent Project (PIADP) Foreign U$ 1,1454 2170 0 0 0 0 1,71214Phase ,, Region IV-A total Pesos 39,405 7,785 0 0 0 0 47,190
13. Palawan Integrated Area Local Pesos 0 0 0 0 10,693 21,493 32,186Deveiopseat Project Foreign US5 0 0 0 0 640 1,1270 1,910Phase 1., Region [V-A total Pesos 0 0 0 0 27,333 55,783 83,116
19. Nindanao Secondary And Local Pesos 21,978 0 0 0 0 0 21,979Feeder Roads Foreign U1S 1.248 0 0 0 0 0) 1,248Regions 1, 1[ and 111 total Pesos 48,935 0 0 0 0 0 48,935
20. Molave-Oroquieta and Local Pesos 42,928 41.090 23,156 0 0 0 107,174Pagadian-Tukuran Foreign USt 2,994 2.300 945 0 0 0 6,239Regions 1X-A i I Total Pesos 107,598 93,300 45,553 0 0 0 246,451
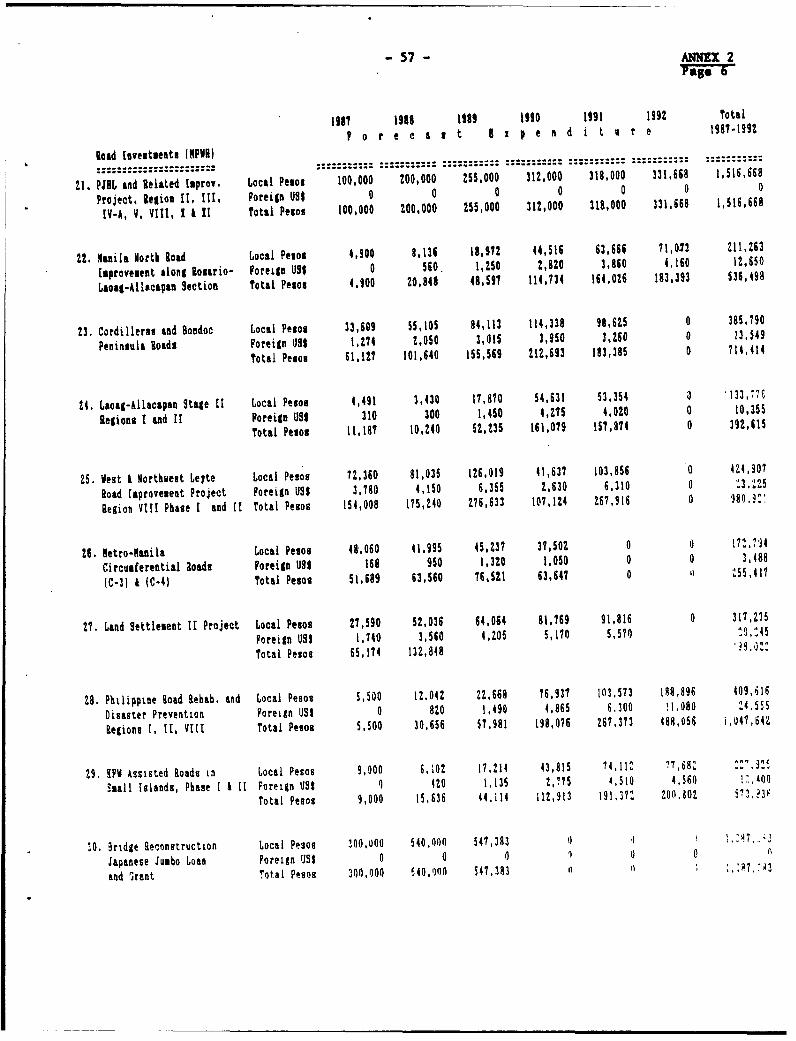
_ 57 _ ANNEX 2
19? 1983 1989 1990 1991 1992 Total
I o r e c a s t x p e n d i t u r e 1981-1992
Road Ilvestments lNPURI
21. PJRL and Related lmprov. Local Pesos 100,000 200,000 255,000 312,000 318,000 331,668 1,516,668
Project, legion 11, III, Foreign US9 0 0 0 0 0 0 0
1V-A, V, Vill, I t 11 Total Pesos 100,000 200,000 255,000 312,000 318,000 331,668 1,516,668
22. 1anila lortk load Local Pesos 4,900 8,136 18,972 44,516 63,666 71,0.73 211,263
Isprovesenit along Rosario- Foreign USI 0 560. l,250 2,820 3,1860 4,160 12,650
Laoag-Allcapan Section Total Pesos 4,900 20,848 48,591 114,734 164,026 183,393 536,498
23. Cordilleras and Bondoc Local Pesos 33,609 55,105 84,113 114,338 98,625 0 385,790
Peninsula Roads Foreign US$ 1,274 2,050 3,01 31,950 1,260 0 13,549
Total Pesos 61,121 101,640 155,569 212,693 183,385 0 714,414
l4. Lsoal-Allacapan Stage 11 Local Pesos 4,491 3,430 17,870 54,631 53,354 a 133,776
Regions I and 11 Foreign US$ 310 300 1,450 4,275 4,020 0 10,355
Total Pesos 11,18? 10,240 52,235 161,079 157,874 0 392,615
25. Vest & Morthvest Leyte Local PeBoB 72,360 81,035 126,019 41,637 103,856 0 424,307
Road [sprovesent Project Foreign US1 3,180 4,150 6,355 2,630 6,310 0 :3.,25
Region VIII Phase I and II Total PesoS 154,008 175,240 276,633 107,124 267,916 0 18O.3^
26. Metro-Manila Local Pesos 48,060 41,995 45,237 31,502 0 0 1721,74
Circunferential Zoads Foreign US$ 168 950 1,1320 1,050 0 0 3,488
(C 3) * (C-l) Total Pesos 51,689 63,560 76,521 63,64? 0 :.55,411
217. Land Settlement II Project Local Pesos 27,590 52,036 64,064 81,769 91,816 0 317,275
Foreign US$ 1,740 3,560 4,205 5,110 5,570 0,.145
Total Pesos 65,174 132,848 3s,o1^
28. Philippine Road Rehab. and Local Pesos 5,500 12.042 22,668 76,937 103,573 148,896 409,M16
Disaster Prevention Foreign U9S 0 820 1.490 4,865 6.300 !1,080 4.,555
Regions 1, [1, VIII Total Pesos 5,500 30,656 57,981 198,076 267,373 488,056 i,047,642
29. [FV Assisted Roads in Local Pesos 9,000 6,.02 17,214 43,815 14,112 "7,682 :2e.3
Small Islands, Phase I & 1I Foreign Ugt Q 4Z0 1,135 2,775 4,510 4,560 l> h00
Total Pesos 9,000 15,636 44,14 112,913 191,321 200.802 511'?39
30. 3ridge ReconStruction Local Pesos H0O0O,0 540,000 547,383 0 1 1
Japanese Jumbo Loan Foreign U09 0 0 0 1 0 0 I
and grant !otai Pesos 300 000 54,1)(0 547,383 0 1) : i1 0
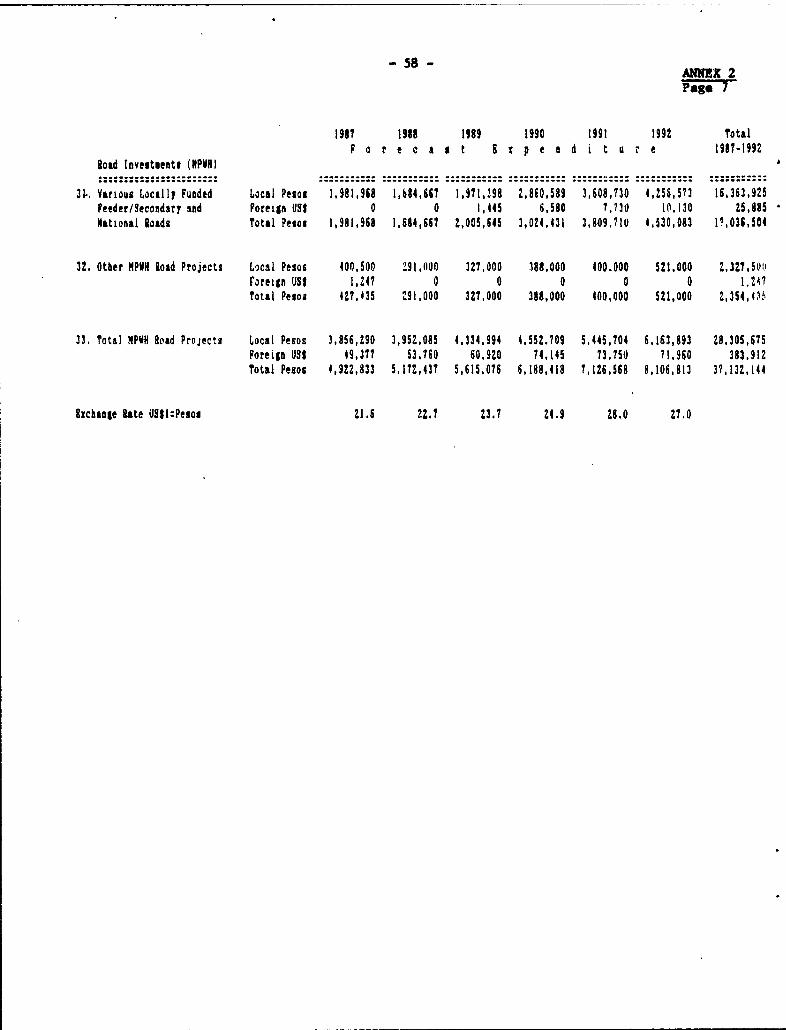
- 5saANNEX 2
1987 1988 1989 1990 1991 1992 TotalF o r e ca as t 8 x p e n d i t ure 197-1992
Road Investments (INPRI
31. Varioug Locally Funded Local Pesos 1,981,968 1,684,667 1,971,398 2,860,589 3,608,730 4,256,573 16,363,925Peeder/Secondary and Foreign US$ 0 0 1,445 6,580 7,1730 10,130 25,885National load& Total Pesos 1,981,968 1,684,667 2,005,645 3,024,431 3,809,710 4,530,083 1?,036,5O4
32. Other NPWR Road Projects Local Pesos 400,500 S91,1000 327.000 386,000 400.000 521,000 2,327,50ororeign US$ 1,247 0 0 0 0 0 1,2147Total Pebo3 427.435 ;91,000 327,000 388,000 400,000 521,000 Z,35,435
33. Total MPvH aoad Projects Local Pesos 3,856,290 3,952,085 4,334,994 4,552,709 5,445,704 6,163,893 28,305,675Foreign US$ 49,377 53,760 60.9ZO 74,145 731,50 71,960 383,912Total Pesos 4,922,833 5,172,437 5,615,076 6,188,418 7,126,568 8,106,813 37,132,144
Exchange late US1I:Pesos 21.6 2Z.? 23.7 24.9 26.0 27.0
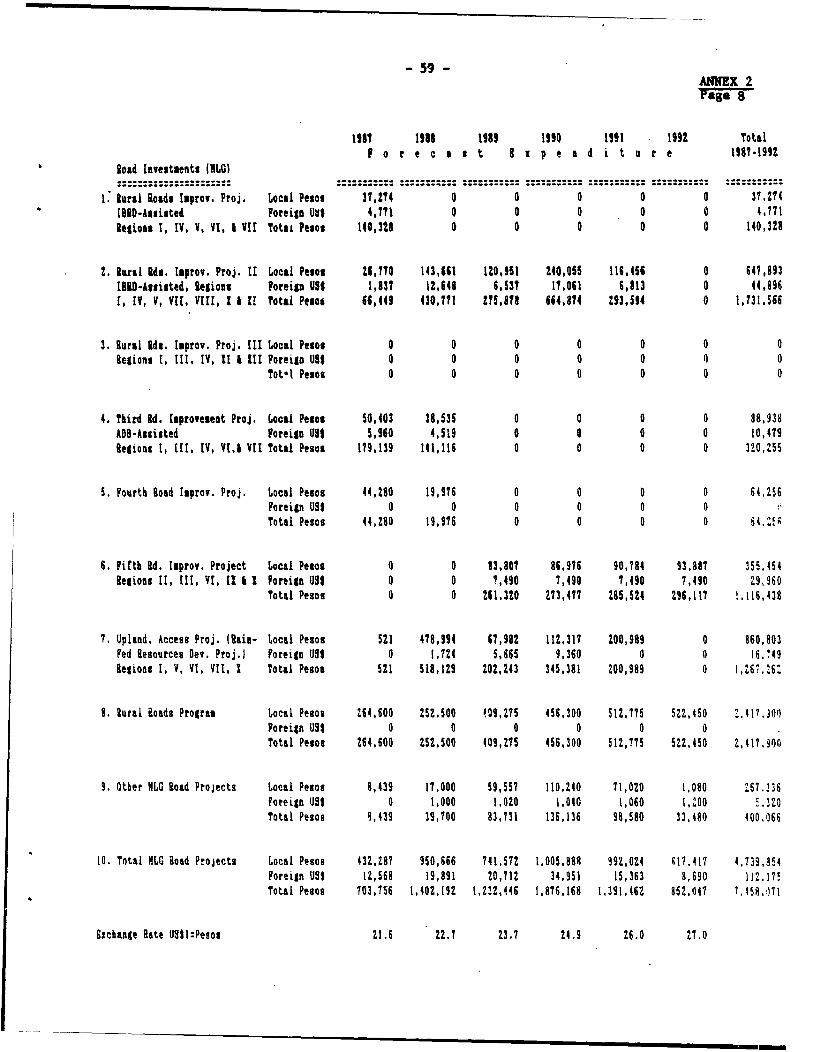
- 59 - ANNEX 2P age 8
19i1 1IM8 19189 1990 1191 1992 Total
F o r e c a s t3 p e d i t a r e 1987-1992
load lnvestsents (NLG)
1: Rural Qoads Isprow. Proj. Local Pesos 31,214 0 0 0 0 0 31,2174
tBlD-Assisted foreign UUS 4,771 0 0 0 0 0 4,771
legions 1, IV, V, VI, & VII TotaL Pesos 140,328 0 0 0 0 0 140,328
2. Rural Rds. laprov. Proj. tl Local Pesos t6,170 143,661 IZ10,951 2140,055 116,456 0 641,893
IBID-Assisted, legions Foreign U91 1,837 12,648 6,53? 17,061 6,813 0 44,896
t, IV, V, VIE, Vill, I & 2! Total Pesos 66,449 430,711 275,818 664,874 293,594 0 1,731,566
3. Rural Rds. laprov. Proj. III Local Pesos 0 0 0 0 0 0 0
Regions 1, III, IV,11 & III Foreitg UhS 0 0 0 0 0 0 0
Tot'l Pesos 0 0 0 0 0 0 0
4. Third Rd. Improvement Proj. Local Pesos 50,403 38,535 0 0 0 0 88,938
ADS-Assisted Foreign VII 5,960 4,519 0 0 0 0 10,479
Regions I, III, IV, VIJ, VII Total Pesos 179,139 141,116 0 0 0 0 320,255
S. Fourth Road Isprov. Proj. Local Pesos 44,280 19,976 0 0 0 0 64.256
Foreign U9 0 0 0 0 0 0
Total Pesos 44,280 19,976 0 0 0 0 64,Z
6. Fifth Rd. Isprov. Project Local Pesos 0 0 83,80? 86,976 90,784 93,88? 355,454
legions II, III, VI, It & I Foreign US, 0 0 7,490 7,490 7,490 7,490 29,960
Total Pesos 0 0 261,320 273,4?7 285.524 296,117 1.116,438
7. Upland. Access Proj. (lain- Local Pesos 521 478,994 67,982 112,317 200,989 0 860,803
Fed Resources Oev. Proj.1 Foreign US, 0 1.724 5,665 9,360 0 0 16.749
Regions 1, V, VI, VII, I Total Pesos 5ZI 518,129 202,243 345,381 200,989 0 I,267.26
8. Rural Roads Progras Local Pesos 264,600 ZSZ.500 '09,ZIS 456,300 512,775 522,450 Z.41J.30')
Foreign US$ 0 0 0 0 0 0
Total Pesos 264,600 Z52,500 409,215 456,300 512,775 5Z2,450 Z,4171.900
9. Other NLG Road Projects Local Pesos 8,439 17,000 59,557 110,240 71,020 1,080 ^67.336
Foreign USI 0 1,000 1.020 1,04C 1,060 1,2OO -.321
Total Pesos 8,439 19,700 83,731 136,136 98,580 33,480 400.066
10. Total MLG Road Projects Local Pesos 43z,287 950,666 741,572 1,005.888 992.024 617.417 4,739,154
Foreign US9 12,568 19,891 Z0,712 34,951 15,363 8,690 112.17!
Total Pesos 703,756 1,402,192 1,2l 2,'46 1,876,168 1.391,462 852.047 1.459,071
Exchange Rate US1:Pesos 21.6 22.7 23.7 24.9 26.0 M7.0
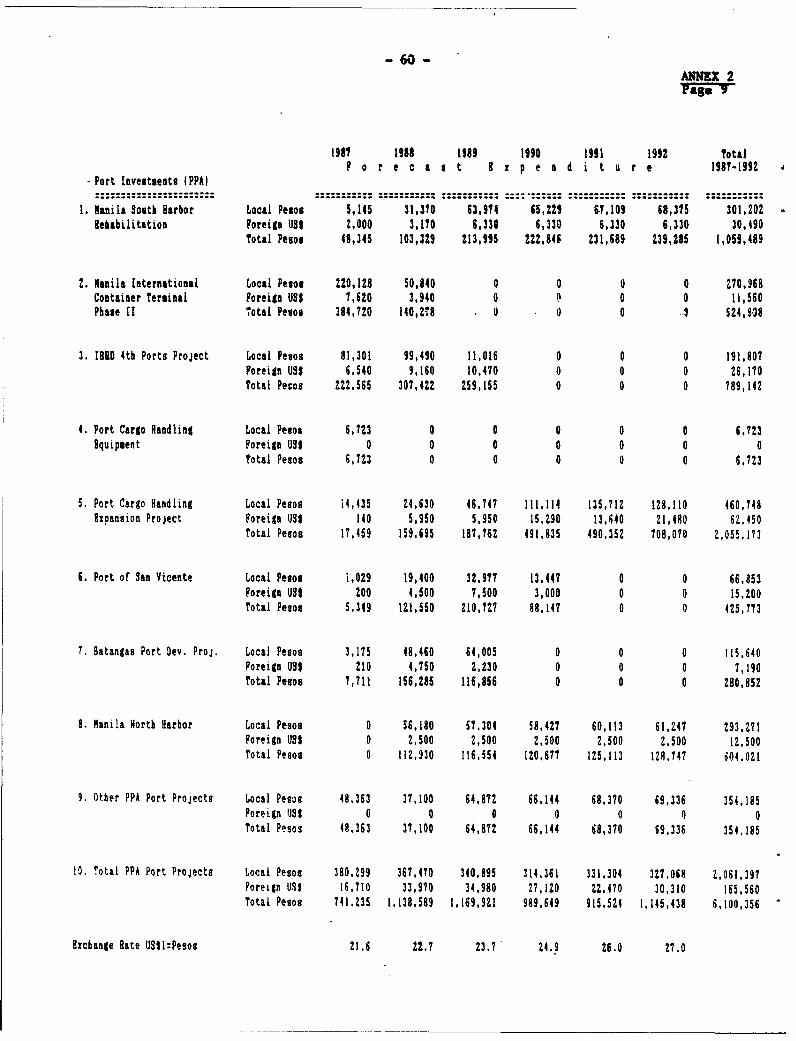
-60-ANNEX 2Page I
198? 1988 1989 1990 1991 1992 totalP o r e c a s t 8 I p e n d i t u r e 1987-1992
Port InveSttents (PPA)
1. Manila South Harbor Local Pesos 5,145 31,370 63,974 65,229 17,109 68,375 301,202Rehabilitation Foreign US$ 2,000 3,1170 6,330 6,330 6,330 6,330 30,490
Total Pesos 48,345 103,329 213,995 222,846 231,689 239,285 1,059,489
2. Nanila International Local Pesos 220,128 50,840 0 0 0 0 270,968Container Terminal Foreign US$ 7,620 3,940 0 0 0 0 11,560Phase [I 'otal Pesos 384,720 140,281 . 0 0 0 '0 524,928
3. lORD 4th Ports Project Local Pesos 81,301 99,490 11,016 0 0 0 191,801Foreign USt 6,540 9,160 10,470 0 0 0 26,170Total Pesos 222,565 307,422 259,155 0 0 0 789,142
4. Port Cargo Handling Local Pesos 6,1723 0 0 0 0 0 6,723Bquipsent Foreign USS 0 0 0 0 0 0 0
Total Pesos 6,723 0 0 0 0 0 6.723
5. Port Cargo Handling Local Pesos i4,435 24,630 46,747 111,114 135,712 128,110 460,748Broansion Project Foreign USM 140 5,950 5,950 15,290 13,640 21,480 62,450
Total Pesos 17,459 159,695 187,762 491,835 490,352 708,070 2,055,173
6. Port of San Vicente Local Pesos i,029 19,400 32,977 13.44? 0 0 66,853Foreign US$ 200 4,500 7,500 3,000 0 0 15,200Total Pesos S,349 121,550 210,727 88,147 0 0 425,773
7. Batangas Port 0ev. Proj. Local Pesos 3,1175 48,460 64,005 0 0 0 115,640Foreign US$ 210 4,750 2,230 0 0 0 7,190Total Pesos 7,711 156,285 116,856 0 0 0 280,852
8. Manila North Harbor Local Pesoo 0 56,180 57,304 58,421 60,113 61,247 293,271Foreign US9 0 2,500 2,500 2,500 2,500 2,500 12,500Total Pesos 0 112,930 116.554 120,677 125,113 128.147 604,021
9. Other PPA Port Projects Local Pesos 48,363 37,100 64,872 66,144 68,370 69,336 354,185Foreignli S 0 0 0 0 0 ° 0Total Pesos 48,363 37,100 64,872 66,144 68,370 69,336 354,185
10. Total PPA Port Projects Local Pesos 380,299 367,470 340,895 314,361 331,304 327,068 2,061,397Foreign US9 16,710 33,970 34,980 27,120 22,470 30,310 165,560Total Pesos 741,235 1.138,589 1,169,921 989,649 915.521 1,145,438 6,100,356
Rrchange Rate U911:Pesos 21.6 22.7 23.7 24.9 26.0 27.0
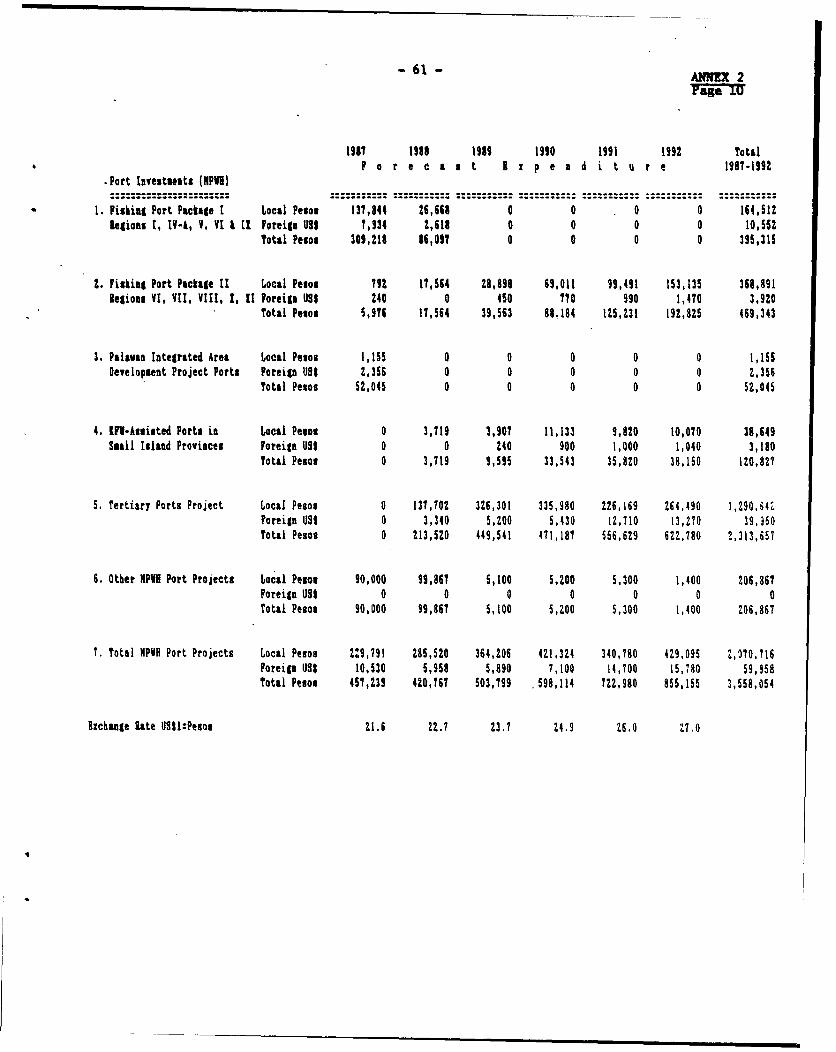
-61- ANNEX 2
1981 1988 1989 1990 1991 1992 Total
F o r e c a s t I 2 p e di t r e 1987-1992
.Port lovestsents lNPU1)
1. Fishing Port Package I Local Pesos 137,844 26,668 0 0 0 0 164,512
k giona t, IV-A, 9, VI & II Foreiln US$ 7,934 2,618 0 0 0 0 10,552
Total Pesos 309,218 86,091 0 0 0 0 395,315
2. Fishing Port Package EI Local Pesos 79t 17,564 28,898 69,011 99,491 153,135 368,891
Regions VI, VII, VIII, 2, 1 Foreign US1 240 0 450 770 990 1,470 3,920
Total Pesos 5,976 17,564 39,563 88,184 125,231 M19,825 469,343
3. Palavan Integrated Area Local Pesos 1,155 0 0 0 0 0 1,155
Development Project Ports Foreign US$ 2,356 0 0 0 0 0 2,356
Total Pesos 52,045 0 0 0 0 0 52,045
4. [Fl-Assisted Ports in Local Pesos 0 3,719 3,907 11,133 9,820 10,070 38,649
Seall Island Provinces Foreign US$ 0 0 240 900 1,000 1,040 3,180
Total Pesos 0 3,719 9,595 33,543 35,820 38,150 120,827
5. Tertiary Ports Project Local Pesos 0 131,702 3I6,301 335,980 226,169 264,490 1,290,642
Foreign US, 0 3,340 5,200 5,430 12,710 13,140 39,350
Total Pesos 0 213,520 449,541 471,187 556,629 622,780 2,313,65?
6. Other NPVH Port Projects Local Pesos 90,000 99,867 5,100 5,200 5,300 1,400 206,867
Foreign USS 0 0 0 0 0 0 0
Total Pesos 90,000 99,867 5,100 5,Z00 5,300 1,1400 206,867
7. Total NPVH Port Projects Local Pesos 29,1791 285,520 364,206 421,324 340,780 429,095 2,370,716
Foreign USI 10,530 5,958 S,890 7,100 14,700 15,180 59,958
Total Pesos 451,239 420,767 503,799 .598,114 722,980 855,155 3,558,054
Erchange ate U331:Pesos 21.6 22.7 23.7 24.9 26.0 27.0
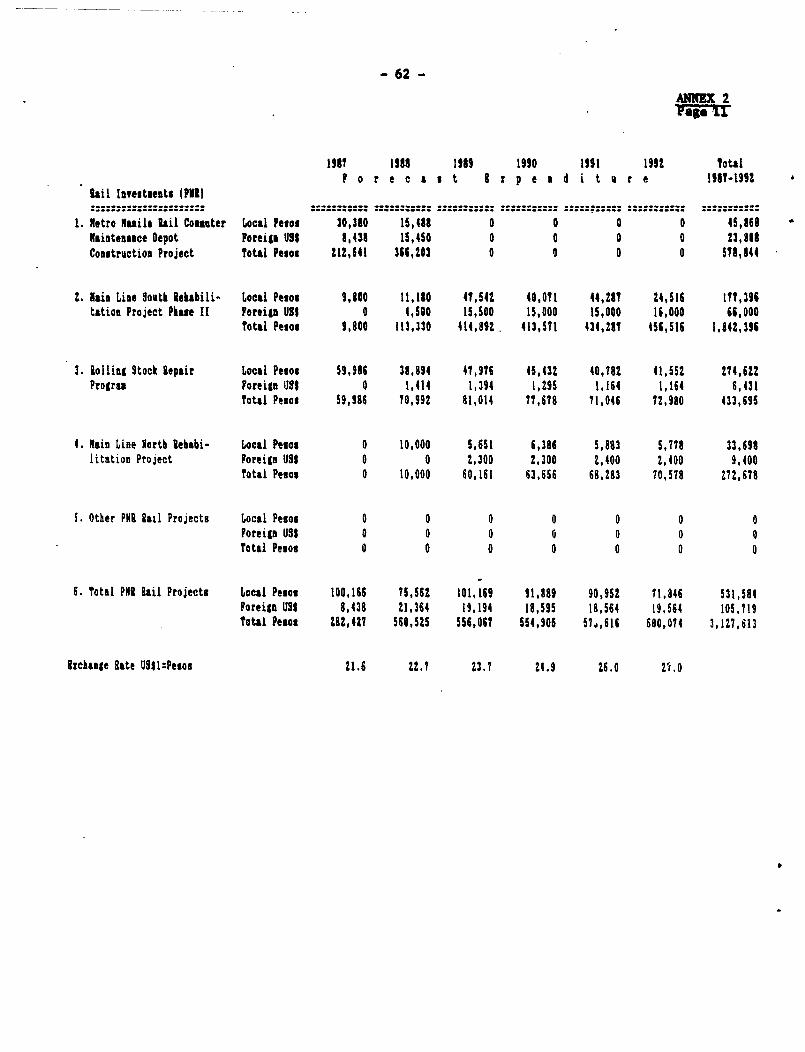
- 62 -
ANNEX 2
1987 1988 1989 1990 1991 1992 Total
F o r e c a s t a I p e a d i t a r e 1981-1992
fail Investments (Pill
1. Netro Inuila liil Commuter Local Pesos 30,310 15,438 0 0 0 0 45,868
Naintenasce Depot Foreign U91 8.438 15,450 0 0 0 0 23,811
Construction Project Totol Pesos 212,641 366,203 0 0 0 0 578,844
2. lain Line 9outh Pehabili- Local Pesos 9,800 11,1tO 41,542 40,011 44,28? 24,516 1lf,396
tation Project Phase II Foreign U9t 0 4,500 15,500 15,000 15,000 16,000 66,000
Total Peso 91,800 113,330 414,892 413,511 434,281 C56,516 1,842,3196
3. tolling Stock Repair Local Pesos 59,986 38,894 47,9176 45,432 40,782 41,552 274,622
Prograu Foreign U9t 0 1,414 1,394 1,295 1,164 1,164 6,431
Total Pesos 59,986 70,992 81,014 77,678 71,046 72,980 433,695
4. Main Line North lehabi- Local Pesos 0 10,000 5,651 6,386 5,883 5,718 33,698
litation Project Foreign U99 0 0 2,300 2,300 2,400 2,400 9,400
total Pesos 0 10,000 60,161 63,656 68,283 70,578 272,678
5. Other PoI Rall Projects Local Pesos 0 0 0 0 0 0 0
ForeignUS9 0 0 0 0 0 0 0
Total Pesos 0 0 0 0 0 0 0
6. Total PHI Rail Projects Local Pesos 100,166 75,562 101,169 91,889 90,952 71,846 531,584
Foreign U51 8,438 21,364 19,194 18,595 18,564 19,564 105.719
Total Pesos 282,427 560,525 556,067 554,905 57d,616 600,074 3,1Z7,613
lichange aate U9SI:Pesos 21.6 22.7 23.7 24.9 26.0 27.0
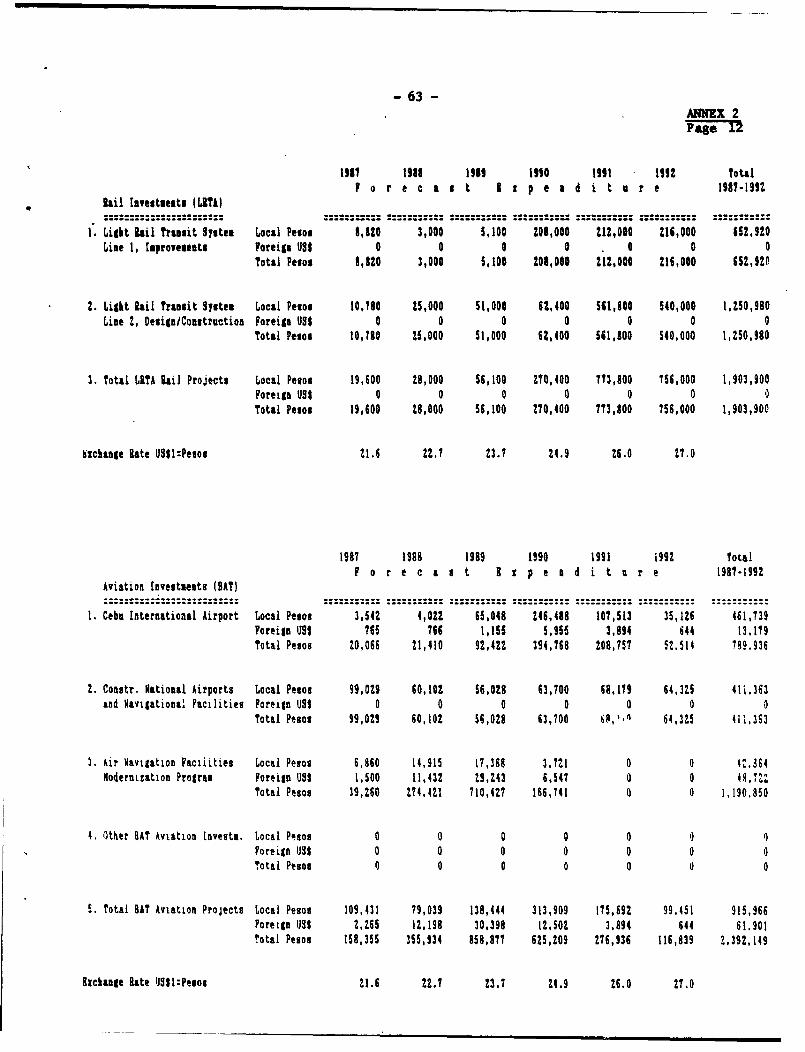
- 63 -ANNEX 2Page 1
1l9t 1933 1959 1990 1991 1992 Total
I o r e c a I t 1 x p e a d i t u r e 1987-1992
isil livsctlents (WlS&
1 Ligkt hil Trnesit System Local Pesos 8,520 3,000 5,100 20l,000 12,O000 216,000 652,920
Lise 1, tsprovesests Poreigs US$ 0 0 0 0 0 0 0
Total Pesos I,820 3,000 5,100 208,000 212,000 216,000 652,92P
2. Light Rail Transit System Local Pesos 10,780 25,000 51,000 62,400 561,100 540,000 1,250,980
Line 2, Design/Construction Foreign US$ 0 0 0 0 0 0 0
total Pesos 10,780 t5,000 51,000 62,400 561,100 540,000 1,250,980
3. Total LRTA Rail Projects Local Pesos 19,600 28,000 56,100 270,400 713,800 756,000 1,903,900
Foreiga US$ 0 0 0 0 0 0 0
Total Pesos 19,600 28,000 56,100 270,400 773,800 756,000 1,903,900
hichange Rate UJ1I:Pe4os 21.6 22.7 23.? 24.9 26.0 27.0
1987 1968 1989 1990 1991 1992 Total
7 o r e c a s t I x p e n d i t u r e 1981-1992
Aviation lnvestments (BAT)
1. Cebu International Airport Local Pesos 3,542 4,022 65,048 246,488 101,513 35,126 461,739
Foreign USS 765 766 1,155 5,955 3,894 644 13,119
Total Pesos 20,066 21,410 92,422 394,768 208,757 52.514 799.936
2. Constr. National Airports Local Pesos 99,029 60,102 56,028 63,700 68,179 64,325 41i.363
and Navigational Facilities Foreign US$ 0 0 0 0 0 0 0
Total Pesos 99,029 60,102 56,028 63,700 60,$o 64,325 4;1,3S3
3. Air Navigation Facilities Local Pesos 6,860 14,915 17,368 3,721 0 0 4t.364
Moderntnation Program Foreign U31 1500 11,432 29,243 6,547 0 0 48,722
Total Pesos 39,260 274,421 710,427 166,741 0 0 1.190.850
4. Other BAt Aviation Invests. Local Pesos 0 0 0 0 0 0 O
Foreign US$ 0 0 0 0 0 0 0
Total Pesos 0 0 0 0 0 0 0
S. Total BAT Aviation Projects Local Pesos 109,431 79,039 138,444 313,909 175,692 99.451 915,966
Foreign U9S 2,265 12,198 30,398 1t,SO2 3,894 644 61.901
Total Pesos 158,355 355,934 858,877 625,Z09 276,936 116,839 2,392,149
Exchange Rate IJSSI:Pesoo 21.6 22.7 23.7 24.9 26.0 27.0
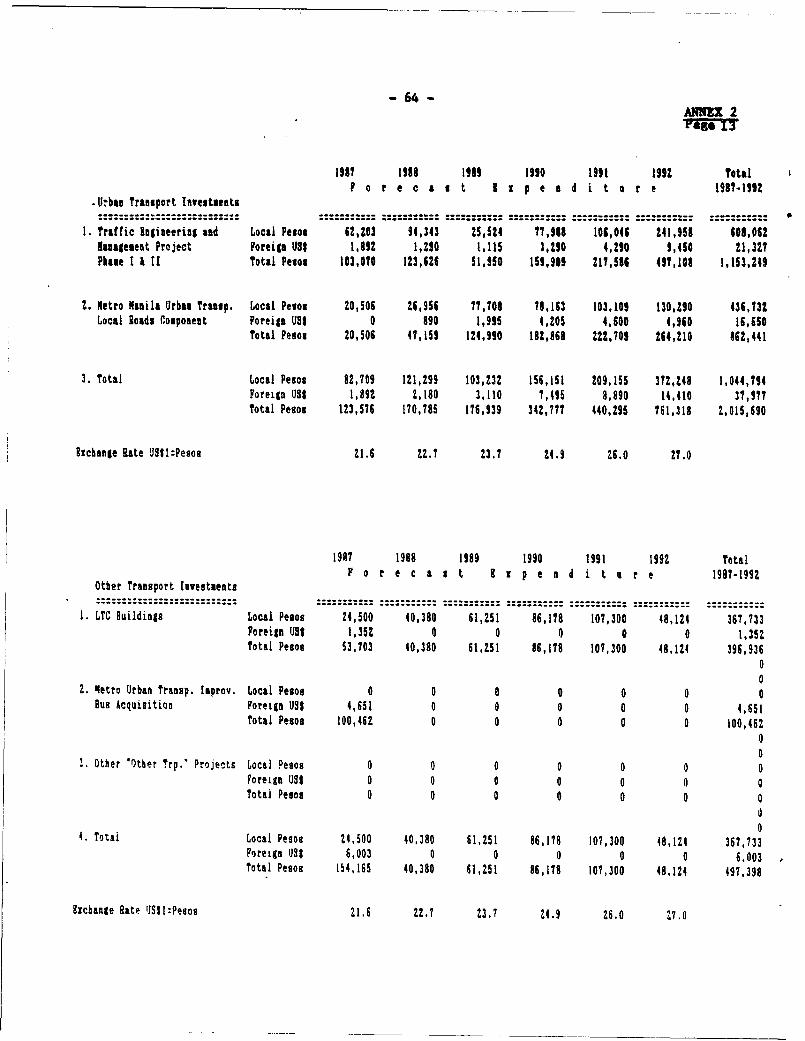
- 64 -ANNEX 2
198? 19188 1919 1990 1991 1992 TotalF o r e c a s t I s p e ad i t r e 1981-199t
U:baa TraDSPort Investments
1. traffic lngineering and Local Pesos 62,203 94,343 25,524 17,988 106,046 241,958 608,062
hanagegeet Project Foreiga USI 11892 ? 1,U0 I,11S 3,290 4,290 9,140 21,327
Pasue I I 1I Total Pesos 103,070 123,626 6l,950 159,909 217,516 491,108 1,153,249
2. Netro Nanila Urban Trausp. Local Pesos 20,506 26,956 t7,708 18,163 103,109 130,290 436,131
Local Roads Component Foreign USI 0 890 1,995 4,205 4,600 4,960 16,650
total Pesos 20,506 47,159 124,990 1812,868 222,709 264,210 862,441
3. Total Local Pesos 82,709 121,299 103,232 156,151 209,155 372,248 1,044,794
Foreign US$ 1,892 2,180 3,110 7,495 8,890 14,410 37,977
Total Pesos 123,576 170,785 176,939 342,7?? 440,295 761,318 2,015,690
Exchange Rate US1I:Pesos 21.6 22.1 23.? 24.9 26.0 2t.0
1987 1988 1989 1990 1991 1992 TotalFo r e c a s t E s p e n d i t a r e 1987-1992
Other Transport Investments
1. LTC Buildings Local Pesos 24,500 40,380 61,251 86,178 107,300 48,124 367,733
Foreign USS 1,35t 0 0 0 0 0 1,352
total Pesos 53,703 40,380 61,251 86,178 107,300 48,124 396,93600
2. qetrn Urban Transp. Improv. Local Pesos 0 0 0 0 0 0 0
Bus Acquisition Foreign US$ 4,651 0 0 0 0 0 4,651
total Pesos 100,462 0 0 0 0 0 100,46200
2. Other 'Other trp.' Projects Local Pesos 0 0 0 0 0 0 0
Foreign US$ 0 0 0 0 0 0 0
Total Pesos 0 0 0 0 0 0 000
4. Totali Local Pesos 24,500 40.380 61,251 86,178 107,300 48,124 367,733
Foreign UJSS 6,003 0 0 0 0 0 6,003Total Pesos 154,165 40,380 61,251 86,178 107,300 48,124 497,398
Orciante Rate ')Sll:Pesos 21.6 t2.7 23.7 24.9 26.0 27.0