PHILIPPINES QUARTERLY UPDATE Public Disclosure …€¦ · · 2016-07-19Its coverage ranges from...
40
PHILIPPINES QUARTERLY UPDATE Solid Macroeconomic Fundamentals Cushion External Turmoil September 2011 Public Disclosure Authorized Public Disclosure Authorized Public Disclosure Authorized Public Disclosure Authorized Public Disclosure Authorized Public Disclosure Authorized Public Disclosure Authorized Public Disclosure Authorized
-
Upload
duongnguyet -
Category
Documents
-
view
214 -
download
1
Transcript of PHILIPPINES QUARTERLY UPDATE Public Disclosure …€¦ · · 2016-07-19Its coverage ranges from...
PHILIPPINES QUARTERLY UPDATESolid Macroeconomic
Fundamentals Cushion External Turmoil
September 2011Pub
lic D
iscl
osur
e A
utho
rized
Pub
lic D
iscl
osur
e A
utho
rized
Pub
lic D
iscl
osur
e A
utho
rized
Pub
lic D
iscl
osur
e A
utho
rized
Pub
lic D
iscl
osur
e A
utho
rized
Pub
lic D
iscl
osur
e A
utho
rized
Pub
lic D
iscl
osur
e A
utho
rized
Pub
lic D
iscl
osur
e A
utho
rized
wb406484
Typewritten Text
92901

PHILIPPINES QUARTERLY UPDATE - September 2011
B
QUARTERLY ECONOMIC UPDATE
Solid Macroeconomic Fundamentals Cushion External Turmoil
September 2011
World Bank Office Manilawww.worldbank.org.ph

i
Solid Macroeconomic Fundamentals Cushion External Turmoil
PREFACEThe Philippines Quarterly Update provides an update on key economic developments and policies over the past three months. It also presents findings from recent World Bank work on the Philippines. It places them in a longer-term and global context, and assesses the implications of these developments and other changes in policy for the outlook for the Philippines. Its coverage ranges from the macro-economy to financial markets to indicators of human welfare and development. It is intended for a wide audience, including policy makers, business leaders, financial market participants, and the community of analysts and professionals engaged in the Philippines.
The Philippines Quarterly Update is a product of the World Bank’s Philippines Poverty Reduction and Economic Management (PREM) team. It was prepared by Soonhwa Yi (Economist and acting task team leader), Marianne Juco and Karl Kendrick Chua, under the general guidance of Ulrich Lächler (Lead Economist). Special Focus contributors include Diana del Rosario for the section on External Spillovers to Philippine Growth and Annalyn Sevilla for the section on the 2012 Proposed National Government Budget. The findings, interpretations, and conclusions expressed in this Update are those of World Bank staff and do not necessarily reflect the views of the Executive Board of The World Bank or the governments they represent.
For information about the World Bank and its activities in the Philippines, please visit www.worldbank.org/ph.
To be included on an email distribution list for this Philippines Quarterly Update series and related publications, please contact Nenette Santero ([email protected]). For questions and comments on the content of this publication, please contact Soonhwa Yi ([email protected]). Questions from the media can be addressed to David Llorito ([email protected]). Cover photo credits:1) Rashiel Velarde, “Shiela wants to be a Nurse”; 2) Philippine Stock Exchange, Inc., “PSE trading floor”; 3) Ines Klughardt, “Highway”; and 4) Dave Llorito, “Foreign trade”.
PHILIPPINES QUARTERLY UPDATE - September 2011
ii
TABLE OF CONTENTS
PREFACE ................................................................................................................................................................................. i
EXECUTIVE SUMMARY .......................................................................................................................................................... iv
RECENT ECONOMIC AND POLICY DEVELOPMENTS .............................................................................................................. 1Output and Demand ....................................................................................................................................................... 1Employment and Poverty ............................................................................................................................................... 2Balance of Payments and External Debt ......................................................................................................................... 4Financial Markets ............................................................................................................................................................ 6Inflation and Monetary Policy ........................................................................................................................................ 8Fiscal Policy ..................................................................................................................................................................... 8
PROSPECTS ........................................................................................................................................................................... 9Output and Demand ....................................................................................................................................................... 9Employment and Poverty ............................................................................................................................................. 10Balance of Payments and External Debt ....................................................................................................................... 11Inflation and Monetary Policy ...................................................................................................................................... 11Fiscal Policy ................................................................................................................................................................... 12
SPECIAL FOCUS ................................................................................................................................................................... 13External Spillovers to Philippine Growth ...................................................................................................................... 13The 2012 Proposed National Government Budget: Boosting Long-term Growth through Higher Spending on Human Capital Accumulation .................................................................................................................................. 17
DATA APPENDIX .................................................................................................................................................................. 22
SELECTED SPECIAL FOCUS FROM PREVIOUS QUARTERLY UPDATES ................................................................................... 24
SELECTED RECENT WORLD BANK PUBLICATIONS ON THE PHILIPPINES ............................................................................. 27
FIGURES Figure 1. Private consumption remains robust as net exports subtracts from growth ........................................................ 2Figure 2. Bottlenecks in government spending pull down GDP growth ............................................................................... 2Figure 3. Services and agriculture drive growth on the supply side… .................................................................................. 2Figure 4. As industry and construction lag ........................................................................................................................... 2Figure 5. The proportion of underemployed Filipinos remains high amid the improvement in formal employment ......... 3Figure 6. Improving labor force participation supported by increased job generation ........................................................ 3Figure 7. Services take the lead in net job creation, as agriculture contracts ...................................................................... 3Figure 8. Poverty and hunger eased in June as social services expand scope ...................................................................... 3Figure 9. Balance of payments remain in large surplus thanks to healthy current account ................................................. 5Figure 10. Exports growth buoyed largely by non-electronics ............................................................................................ 5
iii
Solid Macroeconomic Fundamentals Cushion External Turmoil
Figure 11. Foreign exchange reserves provide ample cover for both short-term debt or imports ..................................... 5Figure 12. Philippines FDI inflow lags significantly behind its Asian neighbors .................................................................... 5Figure 13. Remittance growth in real Peso terms continues to contract.............................................................................. 6Figure 14. Evident shift in the source of remittance growth from the U.S. to Europe ......................................................... 6Figure 15. Asian currencies firm up against the dollar ......................................................................................................... 6Figure 16. Spreads and Peso-dollar exchange rate are stable at historical lows .................................................................. 6Figure 17. Yield curve becomes steeper after flattening in July ........................................................................................... 7Figure 18. PSEi recovers faster than DJIA in the recent US debt ceiling crisis ...................................................................... 7Figure 19. Interest hikes were seen in July to manage increased liquidity… ........................................................................ 7Figure 20. Fueled by heightened bank lending activity in recent months ............................................................................ 7Figure 21. Easing inflation thanks to lower food and utilities prices; transport inflation hikes up ....................................... 8Figure 22. Liquidity growth is back to the pre-crisis level and is posing an upside risk to inflation ..................................... 8Figure 23. Business sentiment remains upbeat for the coming quarters ........................................................................... 10Figure 24. Improving consumer sentiment signals sustained consumption demand ........................................................ 10Figure 25. Labor market indicators are normalizing around rather high levels .................................................................. 10Figure 26. Non-electronics exports prove to be a viable source of merchandise exports growth ..................................... 10Figure 27. Average accumulated response of Philippine GDP, 1997-2011 ........................................................................ 14Figure 28. Spillovers across six VARs .................................................................................................................................. 15Figure 29. Accumulated response of ASEAN-5, 1997-2011 ................................................................................................ 15Figure 30. The Philippines: External spillover channels (1997:Q2-2011:Q2) ..................................................................... 17Figure 31. 2012 budget: higher spending but resting on higher revenue collection ......................................................... 18Figure 32. An upward trend in unprogrammed funds in the total budget (percent), 2003-12 ......................................... 21Figure 33. More money to priority areas –education, social welfare and health ............................................................... 22
TABLESTable 1. Public-private partnership projects in the pipeline ............................................................................................... 12Table 2. The Philippines’ exposure to the US and the Euro zone ....................................................................................... 14Table 3. Average forecast error variance decompositions .................................................................................................. 16Table 4. Summary of unfilled positions and associated budget ......................................................................................... 20Table 5. Philippines: Selected Economic Indicators, 2008-13 ............................................................................................. 22Table 6. Philippines: National Government Cash Accounts (GFS Basis), 2008-11 .............................................................. 23
PHILIPPINES QUARTERLY UPDATE - September 2011
iv
EXECUTIVE SUMMARYDue to sluggish exports and government spending, economic growth was lower than expected. It stood at 3.4 percent (year-on-year) in the second quarter (Q2) of the year, the slowest pace since the fourth quarter of 2009. While private consumption grew at the fastest pace since the fourth quarter of 2007, the other components of aggregate demand have fallen. After expanding briskly in 2010, construction spending declined, pulling down overall investment spending. Public construction contracted by 51.2 percent in Q2 (year-on-year), while exports declined in July for the third-consecutive month, with the continued weaknesses in the economies of the Philippines’ main trading partners, aggravated by the twin disasters in Japan that disrupted manufacturing supply chains. On the supply side, services posted 5 percent growth, outpacing industry, and agriculture expanded for the third-consecutive quarter, favored by good weather conditions. The Philippines’ external position and macroeconomic fundamentals remain strong. The current account surplus increased by 20 percent in Q2 (year-on-year), owing to higher remittances and net services receipts. Net foreign direct investments (FDI) increased in the first half, although lagging behind neighboring countries. Foreign reserves have surged to record highs thanks to strong capital inflows as well as sustained growth of remittances and income from investments abroad. Attracted by relatively higher growth prospects and yield differentials, net foreign portfolio inflows soared through August, at US$3.1billion, more than triple last year’s amount. These inflows have since become more volatile, however, due to higher risk aversion among foreign investors, in light of slowing global growth and continued Euro zone uncertainty. The Peso appreciated modestly against the US dollar during the first half of the year.
Monetary policy remains accommodative, while the fiscal deficit is likely to fall below target. After two consecutive rate hikes, the central bank (Bangko Sentral ng Pilipinas, BSP) left policy rates unchanged in June and July. Instead, the Bank raised the regular reserve requirement twice by 1 percentage point each, bringing it back to the pre-crisis level of 21 percent of gross deposits. Inflation eased to a four-month low in August and remains contained within the BSP target range. The BSP is likely to keep the monetary policy accommodative until the economy shows signs of stronger growth. The fiscal balance has improved sharply, with a deficit of 0.5 percent of GDP during January – July, due largely to government under-spending as revenue collection remained on-track. Although this improves the fiscal balance and may eventually lead to higher quality public spending, it also reduces economic growth and could weaken potential growth as the country’s large deficiencies in infrastructure remain unresolved. Meanwhile, revenue mobilization has recorded promising signs of growth, rising ahead of nominal GDP growth and indicating that the efforts to improve tax compliance are starting to pay off.
After a strong rebound in 2010, economic growth in 2011 is likely to remain around 5 percent with downside risks. In response to the slower growth and the weaker economic outlook in advanced economies, we revise our growth forecast downward from 5.0 percent to 4.5 percent for 2011 and from 5.4 percent to 5.0 percent for 2012. The Philippines is enjoying relative political stability and its fiscal position has improved. Capital inflows are expected to continue, but FDI is projected to moderate as foreign investors have become more cautious in light of the recent financial turmoil. Consumption is expected to be buoyed by falling unemployment, the government’s expansion of the conditional cash transfer program, and sustained remittance inflows. The current account surplus is projected to rise driven by remittances. The trade deficit is likely to expand as imports pick up, but this is partly offset by robust services exports, particularly from business process outsourcing. Increased uncertainty about global demand and a further slowdown in domestic investments pose significant downside risks to our GDP growth forecast.
The challenge for policymakers is to ensure that the Philippines continues to improve its competitiveness, while cushioning the economy from adverse external shocks. To strengthen the country’s resiliency to external shocks, the government needs to accelerate public spending. Raising more revenues through improved tax administration and reforms will enable the government to meet its priority spending targets, especially in infrastructure and human capital investment.
1
Solid Macroeconomic Fundamentals Cushion External Turmoil
RECENT ECONOMIC AND POLICY DEVELOPMENTS
Output and Demand
The Philippine economy continued to decelerate during the first half of 2011 as investment and exports contracted. 1. GDP rose modestly by 3.4 percent (year-on-year) during the second quarter (Q2), slowing from a revised 4.6 percent growth1 in the first quarter (Q1) (Figure 1). This is below the government’s forecast of 4.5 - 5.5 percent for the period and is well below the government’s target of 7-8 percent growth for the full year 2011. Aside from high base effects (growth of 8.9 percent in Q2 2010), sluggish industry activity also played a role in the economy’s slower growth.
Private consumption growth remained robust, rising by 5.4 percent in the first half of 2011 and contributing 2. 3.6 percentage points to GDP growth in Q2 2011 (Figure 1). An increase in food consumption, a key contributor to private consumption, explains 1.8 percentage points of GDP growth in Q2. Government spending started to recover in Q2, after hitting bottom in Q1. The slight increase of 4.5 percent in Q2 came on the back of the release of allotments to government offices to assist program implementation. Investment growth recorded a sharp drop, from a stellar 42.3 percent in Q1 to 0.9 percent in Q2 (an average 21.6 percent for the first half).
A contraction in construction spending slowed down growth of fixed capital formation3. (Figure 4). Private construction spending continued to decelerate since the start of the year. Lower public construction spending, which fell by half in Q2, stood out and subtracted 2.5 percentage points from GDP growth (Figure 2). Net exports subtracted 2.3 percentage points from GDP growth, due to waning demand for Philippine exports, particularly electronic products, in advanced economies and the twin disasters in Japan, which disrupted manufacturing supply chains, especially in the semiconductors and electronics sectors.
On the supply side, the resilient services sector was the main source of growth. 4. Services posted 5 percent growth and contributed 2.8 percentage points to GDP growth in Q2. Financial and government services registered the highest growth at 9.9 and 7.3 percent, respectively, owing to an 18.3 percent growth in non-bank financial intermediation and insurance for the former, and the release of third tranche of the salary increase as mandated by the Salary Standardization Law III for the latter. The agriculture sector expanded by 7.1 percent and contributed to GDP growth for the third consecutive quarter (Figure 3), thanks to good weather conditions that allowed higher yields of corn, sugarcane and palay. The industry sector mirrored the sharp turn-around in investments with a 0.6 percent contraction in Q2, (from 7.3 percent growth in Q1). The decline in industry was largely due to the contraction in construction and utilities (electricity, gas and water sectors), lowering GDP growth by 1.3 percentage points in Q2. Manufacturing grew by 4.8 percent in Q2 (4.0 percentage points lower than Q1), which did not make up for the decline in other industrial sectors.
1 First quarter growth rate was revised down from 4.9 percent.

PHILIPPINES QUARTERLY UPDATE - September 2011
2
Employment and Poverty
The services sector continues to be the key driver of job creation, but structural limitations in the formal sector5. 2 remain. Job creation improved this year: 20 percent more jobs (year-on-year) were added, providing employment to 90 percent of the 968,000 new entrants to the labor force. The service sector, the main source of employment, generated 780,000 new jobs (year-on-year), more than offsetting the loss of 151,000 jobs in agriculture (Figure 7). Industrial job creation was moderate at 241,000. More job creation, however, hardly dent unemployment. The unemployment rate, in fact, increased by 0.1 percentage point to 7.1 percent in July (year-on-year). Formal employment (i.e., wage and salary earners) improved with its share in the total employment increasing by some 3 percentage points, to 56.3 percent in July (year-on-year). Likewise the share of full-time workers increased by 0.4 percentage points, to 64.9
2The formal sector is proxied by workers receiving wages and salaries.
Figure 1. Private consumption remains robust as net exports subtracts from growth
Figure 3. Services and agriculture drive growth on the supply side
Figure 2. Bottlenecks in government spending pull down GDP growth
Figure 4. As industry and construction lag
Source: National Statistical Coordination Board (NSCB). Source: NSCB.
Source: NSCB.Source: NSCB.
3
Solid Macroeconomic Fundamentals Cushion External Turmoil
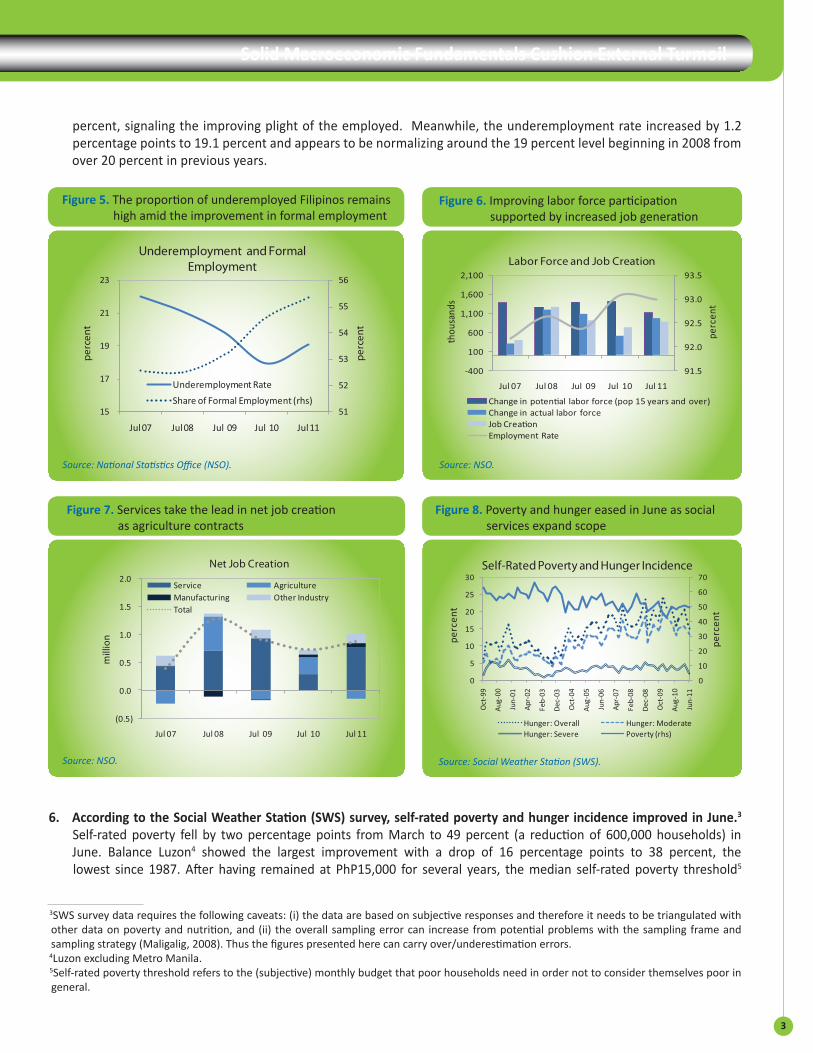
Figure 5. The proportion of underemployed Filipinos remains high amid the improvement in formal employment
Figure 7. Services take the lead in net job creation as agriculture contracts
Figure 6. Improving labor force participation supported by increased job generation
Figure 8. Poverty and hunger eased in June as social services expand scope
percent, signaling the improving plight of the employed. Meanwhile, the underemployment rate increased by 1.2 percentage points to 19.1 percent and appears to be normalizing around the 19 percent level beginning in 2008 from over 20 percent in previous years.
Source: National Statistics Office (NSO). Source: NSO.
Source: NSO. Source: Social Weather Station (SWS).
According to the Social Weather Station (SWS) survey, self-rated poverty and hunger incidence improved in June.6. 3 Self-rated poverty fell by two percentage points from March to 49 percent (a reduction of 600,000 households) in June. Balance Luzon4 showed the largest improvement with a drop of 16 percentage points to 38 percent, the lowest since 1987. After having remained at PhP15,000 for several years, the median self-rated poverty threshold5
3SWS survey data requires the following caveats: (i) the data are based on subjective responses and therefore it needs to be triangulated with other data on poverty and nutrition, and (ii) the overall sampling error can increase from potential problems with the sampling frame and sampling strategy (Maligalig, 2008). Thus the figures presented here can carry over/underestimation errors.
4Luzon excluding Metro Manila.5Self-rated poverty threshold refers to the (subjective) monthly budget that poor households need in order not to consider themselves poor in general.
PHILIPPINES QUARTERLY UPDATE - September 2011
4
decreased by more than 30 percent to PhP11,000 in Metro Manila,6 indicating that poor families have lowered their living standards anew. This implies that the improvement in poverty reduction in Metro Manila is likely to be overestimated. Self-rated hunger incidence7 made a noticeable improvement – a reduction of six percentage points to 15.1 percent (equivalent to three million households). Particularly evident in Metro Manila and Luzon, hunger incidence registered a decline of 7.7 and 15.3 percentage points, respectively, to 13 and 9.7 percent—equivalent to a combined 1.6 million households. In all areas except Mindanao, severe hunger rates fell by 2-4 points.
Balance of Payments and External Debt
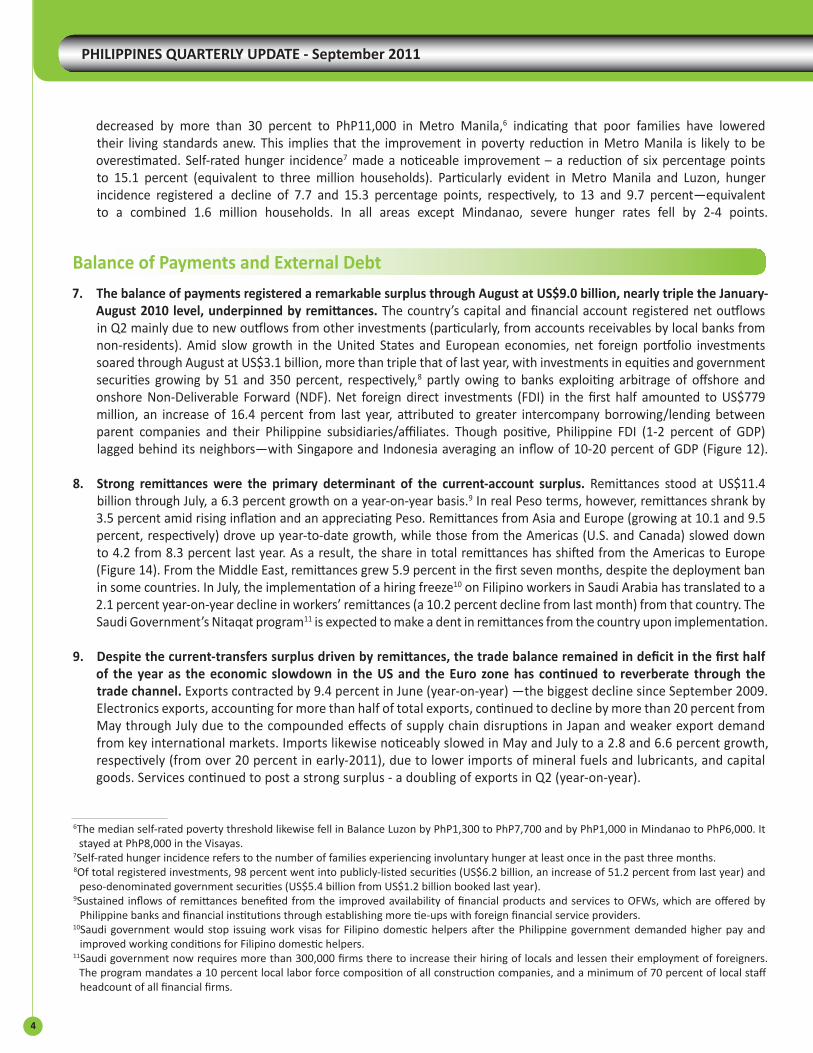
The balance of payments registered a remarkable surplus through August at US$9.0 billion, nearly triple the January-7. August 2010 level, underpinned by remittances. The country’s capital and financial account registered net outflows in Q2 mainly due to new outflows from other investments (particularly, from accounts receivables by local banks from non-residents). Amid slow growth in the United States and European economies, net foreign portfolio investments soared through August at US$3.1 billion, more than triple that of last year, with investments in equities and government securities growing by 51 and 350 percent, respectively,8 partly owing to banks exploiting arbitrage of offshore and onshore Non-Deliverable Forward (NDF). Net foreign direct investments (FDI) in the first half amounted to US$779 million, an increase of 16.4 percent from last year, attributed to greater intercompany borrowing/lending between parent companies and their Philippine subsidiaries/affiliates. Though positive, Philippine FDI (1-2 percent of GDP) lagged behind its neighbors—with Singapore and Indonesia averaging an inflow of 10-20 percent of GDP (Figure 12).
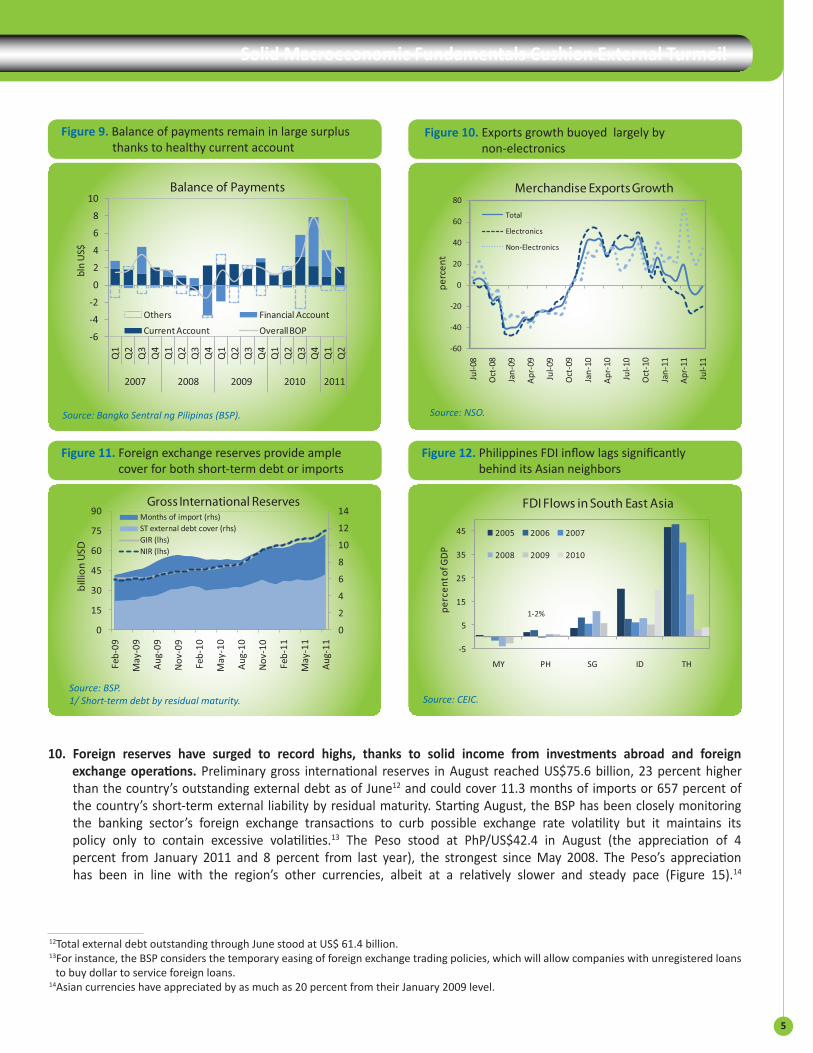
Strong remittances were the primary determinant of the current-account surplus.8. Remittances stood at US$11.4 billion through July, a 6.3 percent growth on a year-on-year basis.9 In real Peso terms, however, remittances shrank by 3.5 percent amid rising inflation and an appreciating Peso. Remittances from Asia and Europe (growing at 10.1 and 9.5 percent, respectively) drove up year-to-date growth, while those from the Americas (U.S. and Canada) slowed down to 4.2 from 8.3 percent last year. As a result, the share in total remittances has shifted from the Americas to Europe (Figure 14). From the Middle East, remittances grew 5.9 percent in the first seven months, despite the deployment ban in some countries. In July, the implementation of a hiring freeze10 on Filipino workers in Saudi Arabia has translated to a 2.1 percent year-on-year decline in workers’ remittances (a 10.2 percent decline from last month) from that country. The Saudi Government’s Nitaqat program11 is expected to make a dent in remittances from the country upon implementation.
Despite the current-transfers surplus driven by remittances, the trade balance remained in deficit in the first half 9. of the year as the economic slowdown in the US and the Euro zone has continued to reverberate through the trade channel. Exports contracted by 9.4 percent in June (year-on-year) —the biggest decline since September 2009. Electronics exports, accounting for more than half of total exports, continued to decline by more than 20 percent from May through July due to the compounded effects of supply chain disruptions in Japan and weaker export demand from key international markets. Imports likewise noticeably slowed in May and July to a 2.8 and 6.6 percent growth, respectively (from over 20 percent in early-2011), due to lower imports of mineral fuels and lubricants, and capital goods. Services continued to post a strong surplus - a doubling of exports in Q2 (year-on-year).
6The median self-rated poverty threshold likewise fell in Balance Luzon by PhP1,300 to PhP7,700 and by PhP1,000 in Mindanao to PhP6,000. It stayed at PhP8,000 in the Visayas.
7Self-rated hunger incidence refers to the number of families experiencing involuntary hunger at least once in the past three months.8Of total registered investments, 98 percent went into publicly-listed securities (US$6.2 billion, an increase of 51.2 percent from last year) and
peso-denominated government securities (US$5.4 billion from US$1.2 billion booked last year).9Sustained inflows of remittances benefited from the improved availability of financial products and services to OFWs, which are offered by
Philippine banks and financial institutions through establishing more tie-ups with foreign financial service providers. 10Saudi government would stop issuing work visas for Filipino domestic helpers after the Philippine government demanded higher pay and
improved working conditions for Filipino domestic helpers.11Saudi government now requires more than 300,000 firms there to increase their hiring of locals and lessen their employment of foreigners.
The program mandates a 10 percent local labor force composition of all construction companies, and a minimum of 70 percent of local staff headcount of all financial firms.
5
Solid Macroeconomic Fundamentals Cushion External Turmoil
Foreign reserves have surged to record highs, thanks to solid income from investments abroad and foreign 10. exchange operations. Preliminary gross international reserves in August reached US$75.6 billion, 23 percent higher than the country’s outstanding external debt as of June12 and could cover 11.3 months of imports or 657 percent of the country’s short-term external liability by residual maturity. Starting August, the BSP has been closely monitoring the banking sector’s foreign exchange transactions to curb possible exchange rate volatility but it maintains its policy only to contain excessive volatilities.13 The Peso stood at PhP/US$42.4 in August (the appreciation of 4 percent from January 2011 and 8 percent from last year), the strongest since May 2008. The Peso’s appreciation has been in line with the region’s other currencies, albeit at a relatively slower and steady pace (Figure 15).14
12Total external debt outstanding through June stood at US$ 61.4 billion.13For instance, the BSP considers the temporary easing of foreign exchange trading policies, which will allow companies with unregistered loans
to buy dollar to service foreign loans. 14Asian currencies have appreciated by as much as 20 percent from their January 2009 level.
Figure 9. Balance of payments remain in large surplus thanks to healthy current account
Figure 11. Foreign exchange reserves provide ample cover for both short-term debt or imports
Figure 10. Exports growth buoyed largely by non-electronics
Figure 12. Philippines FDI inflow lags significantly behind its Asian neighbors
Source: Bangko Sentral ng Pilipinas (BSP).
Source: BSP.1/ Short-term debt by residual maturity.
Source: NSO.
Source: CEIC.
PHILIPPINES QUARTERLY UPDATE - September 2011
6
Financial Markets
The Philippine stock exchange index (PSEi) was rising until recently when fears of a global recession increased risk 11. aversion.15 Despite the high correlation between the U.S. and Philippine equity markets,16 the impact of the U.S. debt ceiling crisis on the PSEi was moderate (Figure 18). The PSEi, however, started to slide in mid-September, an 18 percent decline from the year’s high of 4550.52, fueled by higher risk aversion among foreign investors. Net selling by foreign funds reached PhP6.3 billion in August and September, evidenced by larger withdrawals not only from exchange-traded funds17 but also traditional long-only funds.
15The PSEi has been rising steadily, breaching the 4,500 level at end-July, and normalizing around the 4,300 level in August. 16From an average correlation of 79.2 percent for the years 2004-2010 to a trivial 7.8 percent for year-to-date September 2011.17An exchange-traded fund is a form of mutual fund which is freely traded on a stock exchange.
Figure 14. Evident shift in the source of remittance growth from the U.S. to Europe
Figure 13. Remittance growth in real Peso terms continues to contract
Figure 15. Asian currencies firm up against the dollar Figure 16. Spreads and Peso-dollar exchange rate are stable at historical lows
Source: BSP and staff calculation.Source: BSP.
Source: CEIC and staff calculation. Source: BSP and staff calculation.
7
Solid Macroeconomic Fundamentals Cushion External Turmoil
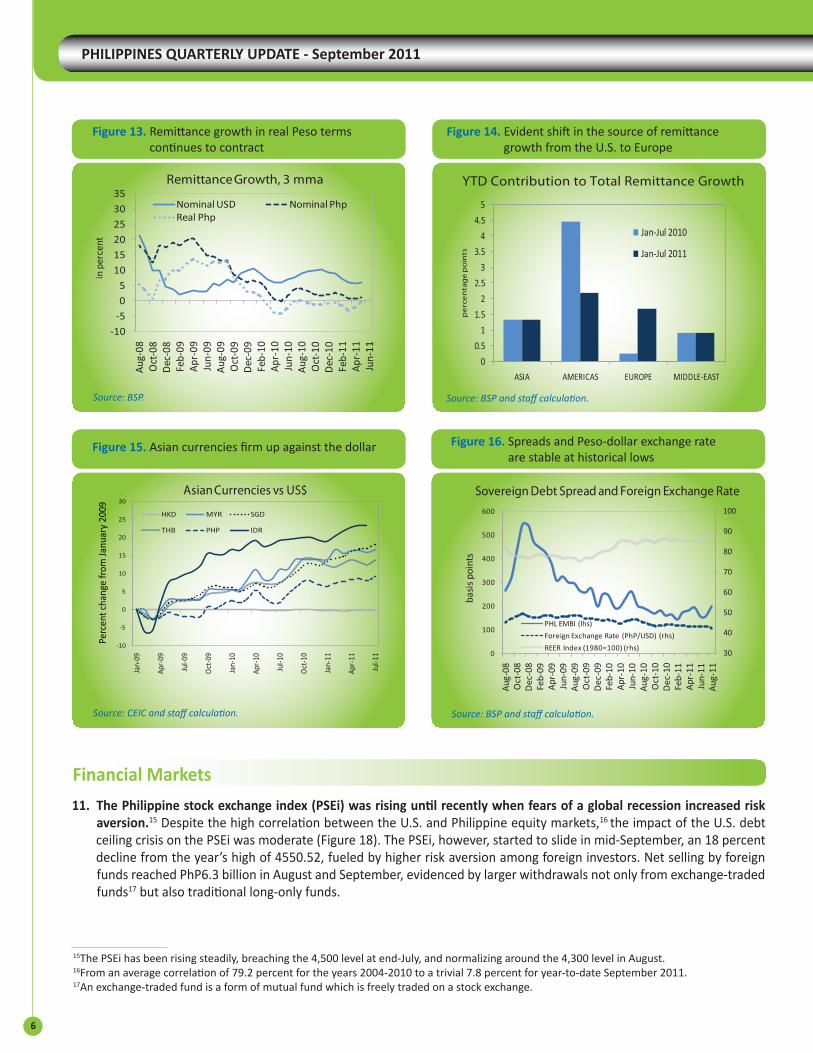
In light of its improved fundamentals and solid recovery, the Philippines has enjoyed credit ratings upgrades in 12. recent months. In July, Fitch Ratings upgraded the country’s long-term foreign currency issuer default rating (IDR) from BB to BB+ (one notch below investment grade) and the country’s long-term local currency IDR and country ceiling to BBB- from BB+. In the same month, Standard & Poor affirmed the country’s BB rating on the foreign currency bonds (two notches from investment grade) and BB+ on the local currency rating.18 Moody’s followed suit, upgrading the Philippines’ ratings to Ba2 from Ba3 (two notches below investment grade), which means the country’s debt papers are no longer considered as high-credit risk. On the back of ratings upgrade, sovereign-bond spreads narrowed in July towards the January 2011 low. In August, however, they started to inch up by 40 basis points (bps) to 199 bps as investor sentiments around the world have become more pessimistic. Meanwhile, the domestic yield curve steepened in August with the short-end tilting downward (at lower rates for all tenors), on account of increased liquidity.
18The ratings agency defines BB as “less vulnerable in the near-term but faces major ongoing uncertainties to adverse business, financial and economic conditions.”
Figure 17. Yield curve becomes steeper after flattening in July
Figure 18. PSEi recovers faster than DJIA in the recent US debt ceiling crisis
Source: Philippine Dealing and Exchange Corp. Source: CEIC and staff calculation.
Source: BSP. Source: BSP.
Figure 19. Interest hikes were seen in July to manage increased liquidity
Figure 20. Fueled by heightened bank lending activity in recent months
PHILIPPINES QUARTERLY UPDATE - September 2011
8
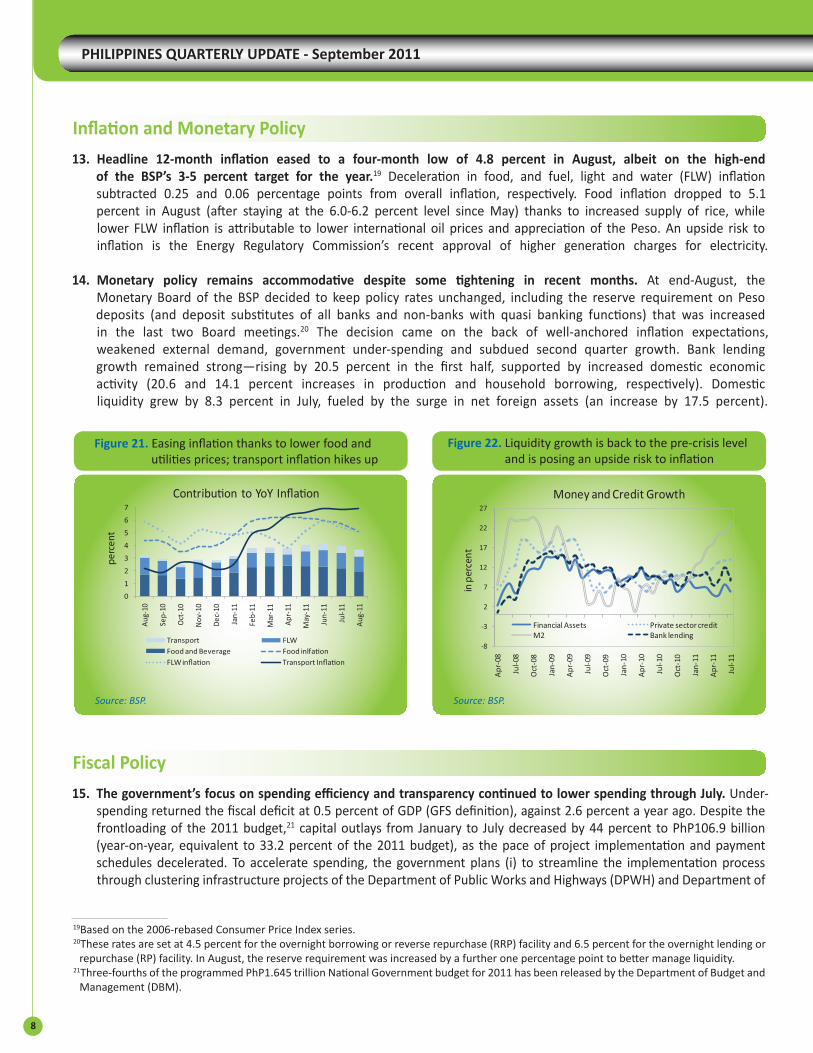
Figure 21. Easing inflation thanks to lower food and utilities prices; transport inflation hikes up
Source: BSP. Source: BSP.
Figure 22. Liquidity growth is back to the pre-crisis level and is posing an upside risk to inflation
Inflation and Monetary Policy
Headline 12-month inflation eased to a four-month low of 4.8 percent in August, albeit on the high-end 13. of the BSP’s 3-5 percent target for the year.19 Deceleration in food, and fuel, light and water (FLW) inflation subtracted 0.25 and 0.06 percentage points from overall inflation, respectively. Food inflation dropped to 5.1 percent in August (after staying at the 6.0-6.2 percent level since May) thanks to increased supply of rice, while lower FLW inflation is attributable to lower international oil prices and appreciation of the Peso. An upside risk to inflation is the Energy Regulatory Commission’s recent approval of higher generation charges for electricity.
Monetary policy remains accommodative despite some tightening in recent months.14. At end-August, the Monetary Board of the BSP decided to keep policy rates unchanged, including the reserve requirement on Peso deposits (and deposit substitutes of all banks and non-banks with quasi banking functions) that was increased in the last two Board meetings.20 The decision came on the back of well-anchored inflation expectations, weakened external demand, government under-spending and subdued second quarter growth. Bank lending growth remained strong—rising by 20.5 percent in the first half, supported by increased domestic economic activity (20.6 and 14.1 percent increases in production and household borrowing, respectively). Domestic liquidity grew by 8.3 percent in July, fueled by the surge in net foreign assets (an increase by 17.5 percent).
Fiscal Policy
The government’s focus on spending efficiency and transparency continued to lower spending through July.15. Under-spending returned the fiscal deficit at 0.5 percent of GDP (GFS definition), against 2.6 percent a year ago. Despite the frontloading of the 2011 budget,21 capital outlays from January to July decreased by 44 percent to PhP106.9 billion (year-on-year, equivalent to 33.2 percent of the 2011 budget), as the pace of project implementation and payment schedules decelerated. To accelerate spending, the government plans (i) to streamline the implementation process through clustering infrastructure projects of the Department of Public Works and Highways (DPWH) and Department of
19Based on the 2006-rebased Consumer Price Index series.20These rates are set at 4.5 percent for the overnight borrowing or reverse repurchase (RRP) facility and 6.5 percent for the overnight lending or
repurchase (RP) facility. In August, the reserve requirement was increased by a further one percentage point to better manage liquidity.21Three-fourths of the programmed PhP1.645 trillion National Government budget for 2011 has been released by the Department of Budget and
Management (DBM).
9
Solid Macroeconomic Fundamentals Cushion External Turmoil
Education (DepEd) and (ii) to frontload PPP-related projects this year that are due for implementation next year. Revenues during January - July increased marginally, by 0.23 percentage points of GDP (GFS basis, equivalent to a 13.4 percent year-on-year growth in government revenue, to PhP787.9 billion). To improve tax collection efforts, the government has proposed reforms in tobacco and alcohol excises and plans to implement VAT on expressway tolls as of October 2011.
The Lower House of Representatives approved the proposed PhP1.816 trillion budget for 2012, 16. 10.4 percent higher than 2011 and equivalent to 16.5 percent of projected GDP (see Special Focus #2). As in the previous year, the 2012 budget employed the zero-based budgeting approach and was anchored on the government’s conservative assumption of 5.5 percent GDP growth for 2011. Key highlights include, among others, (i) a higher budget allocation to social services, an increase by 10.4 percent over this year’s allocation and (ii) a much smaller internal revenue allotment (IRA) to local government units as a result of lower revenue collections in 2009—attributed to the combined impact of the government’s revenue-eroding measures and the global economic slowdown in 2009.22
PROSPECTS
Output and Demand
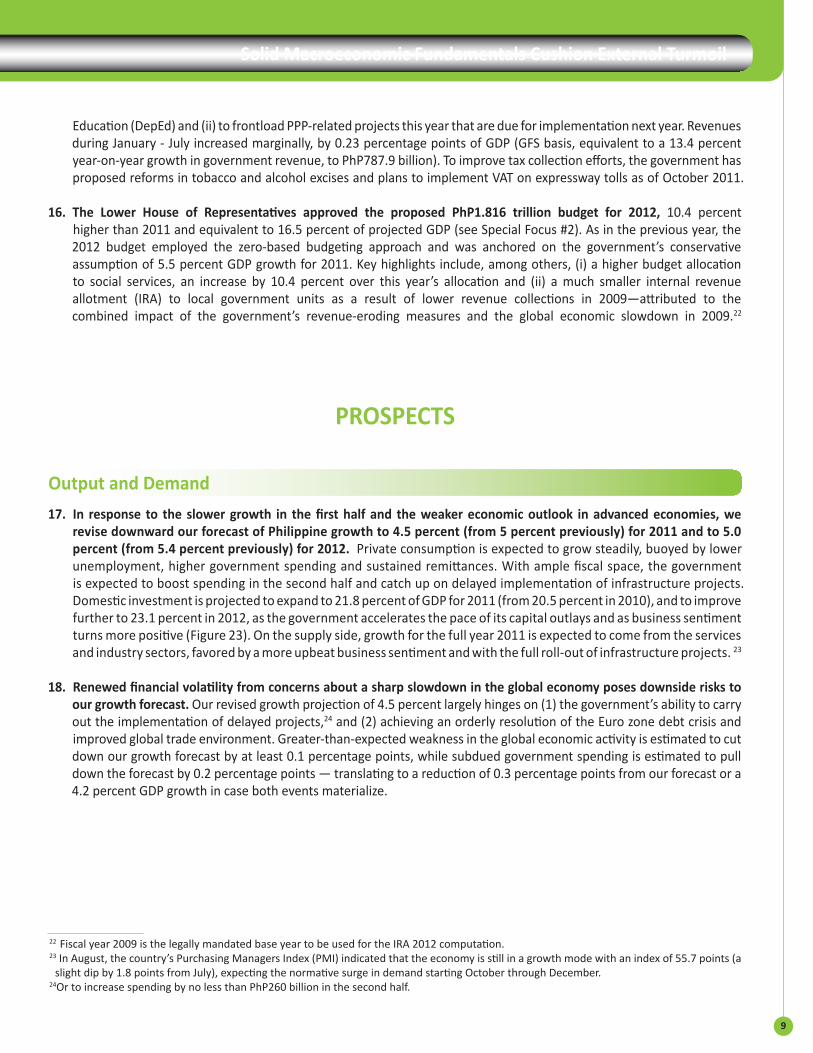
In response to the slower growth in the first half and the weaker economic outlook in advanced economies, we 17. revise downward our forecast of Philippine growth to 4.5 percent (from 5 percent previously) for 2011 and to 5.0 percent (from 5.4 percent previously) for 2012. Private consumption is expected to grow steadily, buoyed by lower unemployment, higher government spending and sustained remittances. With ample fiscal space, the government is expected to boost spending in the second half and catch up on delayed implementation of infrastructure projects. Domestic investment is projected to expand to 21.8 percent of GDP for 2011 (from 20.5 percent in 2010), and to improve further to 23.1 percent in 2012, as the government accelerates the pace of its capital outlays and as business sentiment turns more positive (Figure 23). On the supply side, growth for the full year 2011 is expected to come from the services and industry sectors, favored by a more upbeat business sentiment and with the full roll-out of infrastructure projects. 23
Renewed financial volatility from concerns about a sharp slowdown in the global economy poses downside risks to 18. our growth forecast. Our revised growth projection of 4.5 percent largely hinges on (1) the government’s ability to carry out the implementation of delayed projects,24 and (2) achieving an orderly resolution of the Euro zone debt crisis and improved global trade environment. Greater-than-expected weakness in the global economic activity is estimated to cut down our growth forecast by at least 0.1 percentage points, while subdued government spending is estimated to pull down the forecast by 0.2 percentage points — translating to a reduction of 0.3 percentage points from our forecast or a 4.2 percent GDP growth in case both events materialize.
22 Fiscal year 2009 is the legally mandated base year to be used for the IRA 2012 computation. 23 In August, the country’s Purchasing Managers Index (PMI) indicated that the economy is still in a growth mode with an index of 55.7 points (a
slight dip by 1.8 points from July), expecting the normative surge in demand starting October through December.24Or to increase spending by no less than PhP260 billion in the second half.
PHILIPPINES QUARTERLY UPDATE - September 2011
10
Figure 23. Business sentiment remains upbeat for the coming quarters
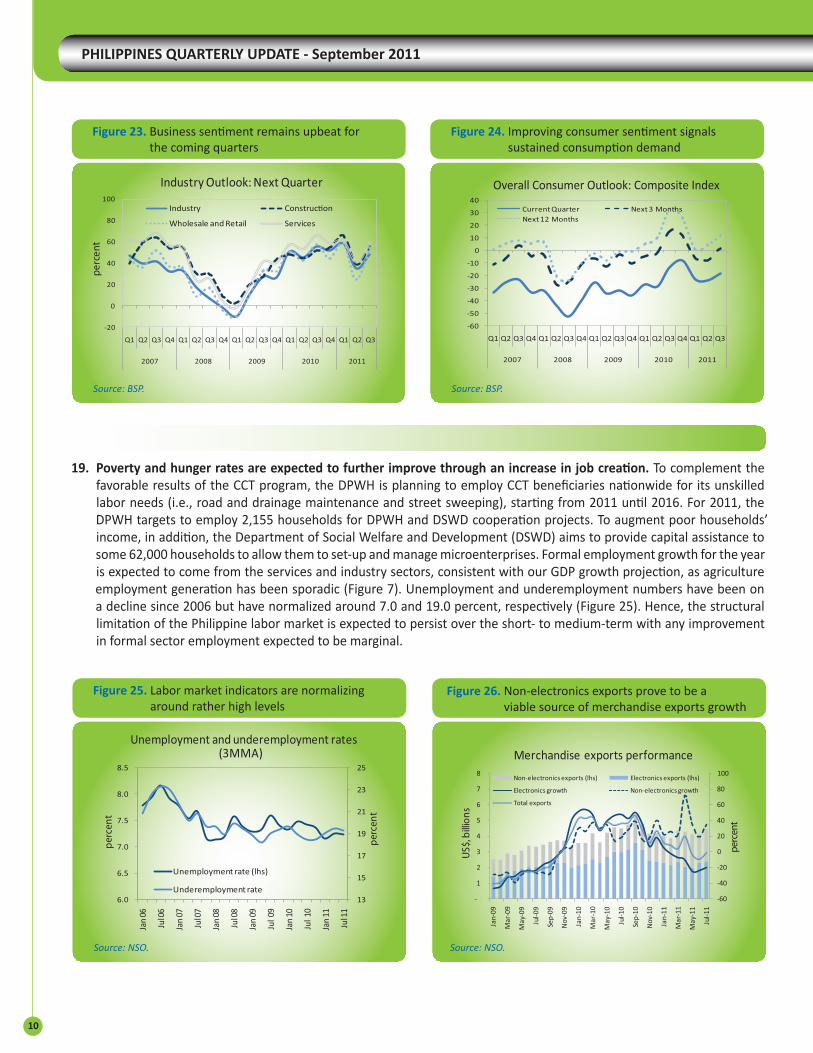
Figure 25. Labor market indicators are normalizing around rather high levels
Figure 24. Improving consumer sentiment signals sustained consumption demand
Source: BSP.
Source: NSO. Source: NSO.
Source: BSP.
Employment and Poverty
Poverty and hunger rates are expected to further improve through an increase in job creation.19. To complement the favorable results of the CCT program, the DPWH is planning to employ CCT beneficiaries nationwide for its unskilled labor needs (i.e., road and drainage maintenance and street sweeping), starting from 2011 until 2016. For 2011, the DPWH targets to employ 2,155 households for DPWH and DSWD cooperation projects. To augment poor households’ income, in addition, the Department of Social Welfare and Development (DSWD) aims to provide capital assistance to some 62,000 households to allow them to set-up and manage microenterprises. Formal employment growth for the year is expected to come from the services and industry sectors, consistent with our GDP growth projection, as agriculture employment generation has been sporadic (Figure 7). Unemployment and underemployment numbers have been on a decline since 2006 but have normalized around 7.0 and 19.0 percent, respectively (Figure 25). Hence, the structural limitation of the Philippine labor market is expected to persist over the short- to medium-term with any improvement in formal sector employment expected to be marginal.
Figure 26. Non-electronics exports prove to be a viable source of merchandise exports growth
11
Solid Macroeconomic Fundamentals Cushion External Turmoil
Balance of Payments and External Debt
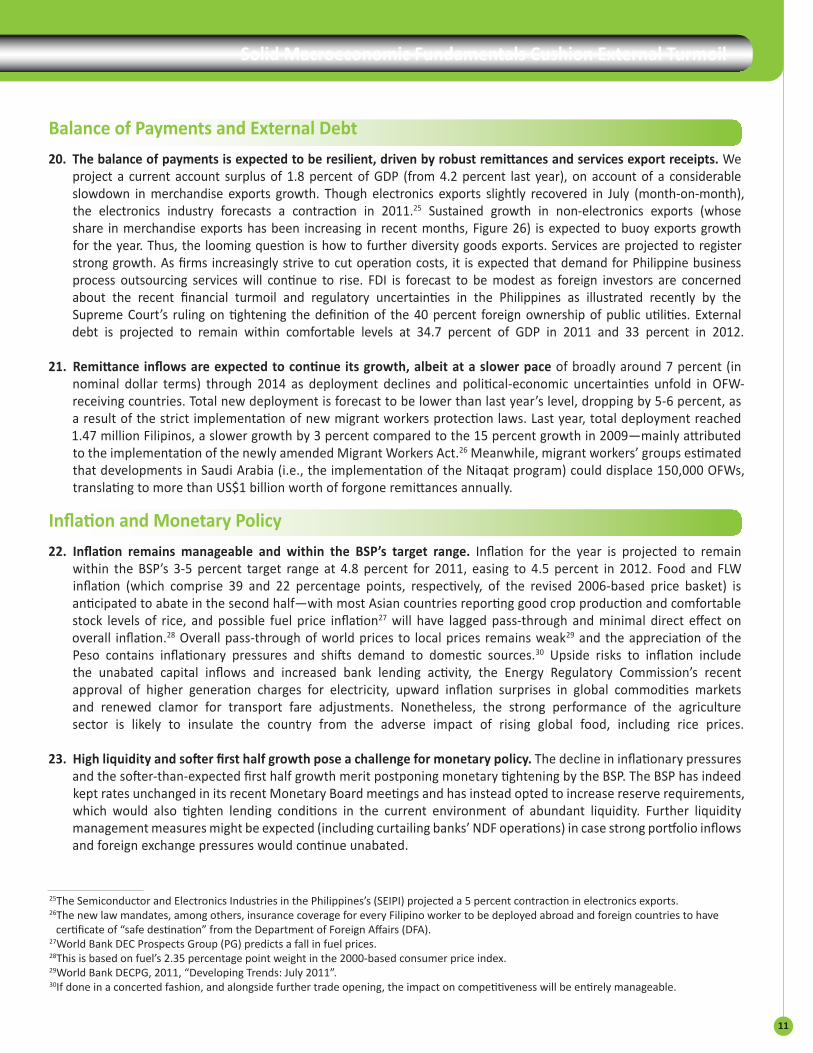
The balance of payments is expected to be resilient, driven by robust remittances and services export receipts. 20. We project a current account surplus of 1.8 percent of GDP (from 4.2 percent last year), on account of a considerable slowdown in merchandise exports growth. Though electronics exports slightly recovered in July (month-on-month), the electronics industry forecasts a contraction in 2011.25 Sustained growth in non-electronics exports (whose share in merchandise exports has been increasing in recent months, Figure 26) is expected to buoy exports growth for the year. Thus, the looming question is how to further diversity goods exports. Services are projected to register strong growth. As firms increasingly strive to cut operation costs, it is expected that demand for Philippine business process outsourcing services will continue to rise. FDI is forecast to be modest as foreign investors are concerned about the recent financial turmoil and regulatory uncertainties in the Philippines as illustrated recently by the Supreme Court’s ruling on tightening the definition of the 40 percent foreign ownership of public utilities. External debt is projected to remain within comfortable levels at 34.7 percent of GDP in 2011 and 33 percent in 2012. Remittance inflows are expected to continue its growth, albeit at a slower pace 21. of broadly around 7 percent (in nominal dollar terms) through 2014 as deployment declines and political-economic uncertainties unfold in OFW-receiving countries. Total new deployment is forecast to be lower than last year’s level, dropping by 5-6 percent, as a result of the strict implementation of new migrant workers protection laws. Last year, total deployment reached 1.47 million Filipinos, a slower growth by 3 percent compared to the 15 percent growth in 2009—mainly attributed to the implementation of the newly amended Migrant Workers Act.26 Meanwhile, migrant workers’ groups estimated that developments in Saudi Arabia (i.e., the implementation of the Nitaqat program) could displace 150,000 OFWs, translating to more than US$1 billion worth of forgone remittances annually.
Inflation and Monetary Policy
Inflation remains manageable and within the BSP’s target range. 22. Inflation for the year is projected to remain within the BSP’s 3-5 percent target range at 4.8 percent for 2011, easing to 4.5 percent in 2012. Food and FLW inflation (which comprise 39 and 22 percentage points, respectively, of the revised 2006-based price basket) is anticipated to abate in the second half—with most Asian countries reporting good crop production and comfortable stock levels of rice, and possible fuel price inflation27 will have lagged pass-through and minimal direct effect on overall inflation.28 Overall pass-through of world prices to local prices remains weak29 and the appreciation of the Peso contains inflationary pressures and shifts demand to domestic sources.30 Upside risks to inflation include the unabated capital inflows and increased bank lending activity, the Energy Regulatory Commission’s recent approval of higher generation charges for electricity, upward inflation surprises in global commodities markets and renewed clamor for transport fare adjustments. Nonetheless, the strong performance of the agriculture sector is likely to insulate the country from the adverse impact of rising global food, including rice prices.
High liquidity and softer first half growth pose a challenge for monetary policy.23. The decline in inflationary pressures and the softer-than-expected first half growth merit postponing monetary tightening by the BSP. The BSP has indeed kept rates unchanged in its recent Monetary Board meetings and has instead opted to increase reserve requirements, which would also tighten lending conditions in the current environment of abundant liquidity. Further liquidity management measures might be expected (including curtailing banks’ NDF operations) in case strong portfolio inflows and foreign exchange pressures would continue unabated.
25The Semiconductor and Electronics Industries in the Philippines’s (SEIPI) projected a 5 percent contraction in electronics exports.26The new law mandates, among others, insurance coverage for every Filipino worker to be deployed abroad and foreign countries to have certificate of “safe destination” from the Department of Foreign Affairs (DFA).27World Bank DEC Prospects Group (PG) predicts a fall in fuel prices.28This is based on fuel’s 2.35 percentage point weight in the 2000-based consumer price index.29World Bank DECPG, 2011, “Developing Trends: July 2011”.30If done in a concerted fashion, and alongside further trade opening, the impact on competitiveness will be entirely manageable.
PHILIPPINES QUARTERLY UPDATE - September 2011
12
Fiscal Policy
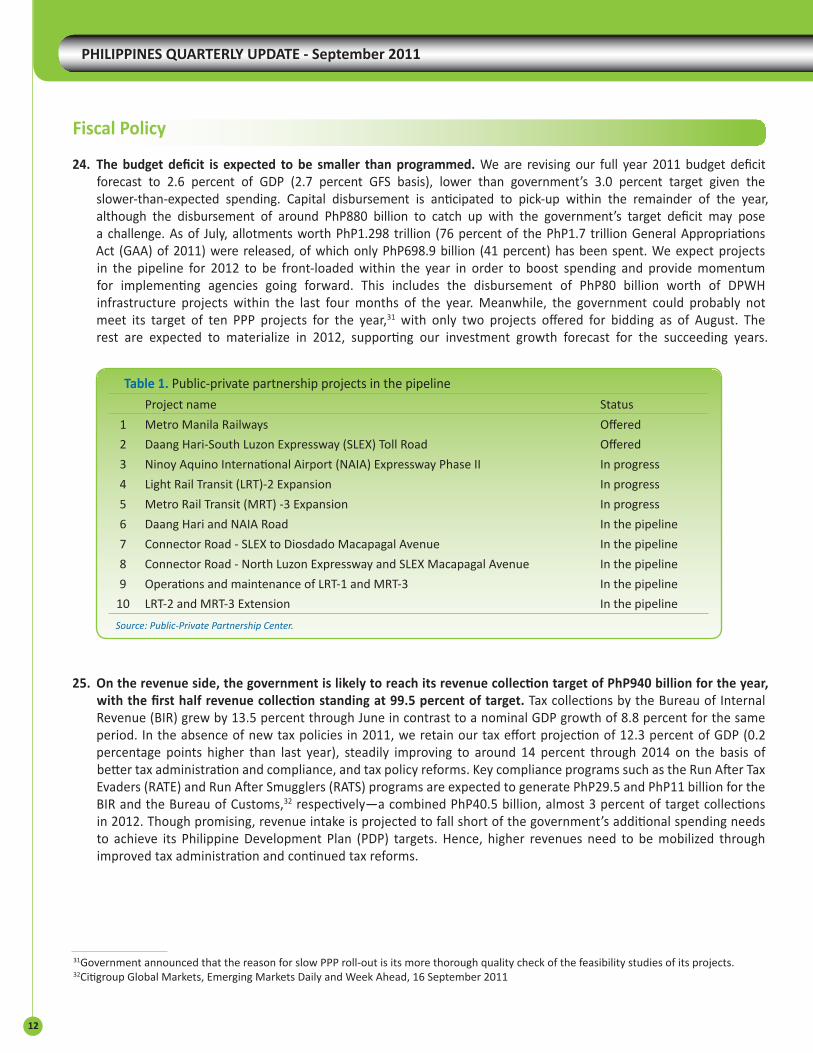
The budget deficit is expected to be smaller than programmed. 24. We are revising our full year 2011 budget deficit forecast to 2.6 percent of GDP (2.7 percent GFS basis), lower than government’s 3.0 percent target given the slower-than-expected spending. Capital disbursement is anticipated to pick-up within the remainder of the year, although the disbursement of around PhP880 billion to catch up with the government’s target deficit may pose a challenge. As of July, allotments worth PhP1.298 trillion (76 percent of the PhP1.7 trillion General Appropriations Act (GAA) of 2011) were released, of which only PhP698.9 billion (41 percent) has been spent. We expect projects in the pipeline for 2012 to be front-loaded within the year in order to boost spending and provide momentum for implementing agencies going forward. This includes the disbursement of PhP80 billion worth of DPWH infrastructure projects within the last four months of the year. Meanwhile, the government could probably not meet its target of ten PPP projects for the year,31 with only two projects offered for bidding as of August. The rest are expected to materialize in 2012, supporting our investment growth forecast for the succeeding years.
On the revenue side, the government is likely to reach its revenue collection target of PhP940 billion for the year, 25. with the first half revenue collection standing at 99.5 percent of target. Tax collections by the Bureau of Internal Revenue (BIR) grew by 13.5 percent through June in contrast to a nominal GDP growth of 8.8 percent for the same period. In the absence of new tax policies in 2011, we retain our tax effort projection of 12.3 percent of GDP (0.2 percentage points higher than last year), steadily improving to around 14 percent through 2014 on the basis of better tax administration and compliance, and tax policy reforms. Key compliance programs such as the Run After Tax Evaders (RATE) and Run After Smugglers (RATS) programs are expected to generate PhP29.5 and PhP11 billion for the BIR and the Bureau of Customs,32 respectively—a combined PhP40.5 billion, almost 3 percent of target collections in 2012. Though promising, revenue intake is projected to fall short of the government’s additional spending needs to achieve its Philippine Development Plan (PDP) targets. Hence, higher revenues need to be mobilized through improved tax administration and continued tax reforms.
31Government announced that the reason for slow PPP roll-out is its more thorough quality check of the feasibility studies of its projects.32Citigroup Global Markets, Emerging Markets Daily and Week Ahead, 16 September 2011
Table 1. Public-private partnership projects in the pipelineProject name Status
1 Metro Manila Railways Offered
2 Daang Hari-South Luzon Expressway (SLEX) Toll Road Offered
3 Ninoy Aquino International Airport (NAIA) Expressway Phase II In progress
4 Light Rail Transit (LRT)-2 Expansion In progress
5 Metro Rail Transit (MRT) -3 Expansion In progress
6 Daang Hari and NAIA Road In the pipeline
7 Connector Road - SLEX to Diosdado Macapagal Avenue In the pipeline
8 Connector Road - North Luzon Expressway and SLEX Macapagal Avenue In the pipeline
9 Operations and maintenance of LRT-1 and MRT-3 In the pipeline
10 LRT-2 and MRT-3 Extension In the pipeline
Source: Public-Private Partnership Center.

13
Solid Macroeconomic Fundamentals Cushion External Turmoil
SPECIAL FOCUS
External Spillovers to Philippine Growth
Abstract: This section examines the size and transmission channels of external spillovers to the Philippines and to its neighboring countries.33,34,35,36 It finds that during 1997-2011, shocks from East Asian-3 economies, China in particular have become more important for ASEAN-5 including the Philippines than those from the United States and the Euro zone. Spillovers of East Asian economies’ shocks are channeled to the Philippines through trade, while the United States and the Euro zone shocks are transmitted largely through financial variables. The findings suggest that vigorous growth in the East Asian economies can cushion declines in demand from the West.
The Philippine economy, especially the manufacturing export sectors, is likely to face strong global economic 26. headwinds. Core exports of the Philippines such as electronics decelerated in July in response to the weak demand in the United States and the Euro zone (US&EU).37 Table 2 shows that economic linkages between the Philippines and the two key international markets are sizable: the US&EU zone accounts for nearly one-third of Philippine exports and half of total remittance inflows.38 Financial linkages are even bigger: US&EU explains two-thirds of Philippine banks’ external exposure. Unlike during the global financial crisis, US&EU governments have weaker political momentum and/or financial resources to respond to weakening demand with fiscal stimulus packages.39 China’s August purchasing managers’ index showed a weak rebound to 50.9 from 50.7 in July40 but exhibits a downward trend in recent months, indicating a more limited role in cushioning declines in demand.
33It employs a vector autoregression (VAR) approach, following Bayoumi and Swiston (2008 and 2009) and Sun (2011). Bayoumi, T. and A. Swiston, 2008. “Spillovers Across NAFTA,” IMF Working Paper No. 08/3; ___, 2009. “Foreign Entanglements: Estimating the Source and Size of Spillovers across Industrial Countries,” IMF Staff Papers, Vol. 56, No. 2, pp. 353-83; Sun, Y., 2011. “From West to East: Estimating External Spillovers to Australia and New Zealand,” IMF Working Paper No. 11/120. The section explores the implications of GDP growth shocks in three major economic blocks for ASEAN-5, namely the Philippines, Malaysia, Indonesia, Thailand and Vietnam
34The three major economic blocks include : (i) the United States and the Euro zone (US&EU), (ii) China, Japan and Korea (EASTASIA), and (iii) the rest of the world (ROW) that includes Australia, Brazil, Bulgaria, Canada, Chile, Denmark, Hong Kong, India, Israel, Mexico, Norway, Peru, Russia, Singapore, South Africa, Sweden, Taiwan, and United Kingdom. The aggregate growth rates are calculated for each region, using IMF’s PPP-based GDP as weights (April 2011). Quarterly real GDP growth series are used for the 1997:Q2-2011:Q2 period, except Vietnam whose data was limited to the 2000:Q1 to 2011:Q2 period.
35Series for transmission channels include contribution of exports to GDP growth, growth rates of remittances (deflated by the GDP deflator), and wholesale price index or produce price index – depending on the availability by country, all of which are obtained from CEIC. Returns of stock price indices (deflated by the GDP deflator), three-month Treasury bill rates, and 10-year sovereign bond yields are proxies for financial variables and obtained from Bloomberg.
36As in Sun (2011), Cholesky decompositions are employed to identify sources of contemporaneous correlation among the four economic blocks. While the Philippines (as well as the other ASEAN members) is placed last, all six ordering possibilities with US&EU, EASTASIA and ROW are explored as the relative orderings among them are not clear-cut. The Philippines (and the other ASEAN members) is assumed to be a small open economy that is unable to affect the external economy. Drawing from evidence in the literature that no single regression model outperforms an average across a range of estimation models, reported results here represent averages of six VAR results. The impulse response functions show the impact of a percent shock to one variable on the forecast variable.
37Deceleration of exports, especially electronics and semiconductors, is partly due to supply chain disruptions caused by the disaster in Japan. 38Remittances from the US can be overestimated as those channeled through US banks are recorded as remittances originating from the US. 39Financial markets have discussed that we are at a Keynesian endpoint where governments can no longer stimulate economies through increased
government spending. 40 Numbers above 50 corresponds to expansion and those below 50 to contraction.
PHILIPPINES QUARTERLY UPDATE - September 2011
14
Table 2. The Philippines’ exposure to the US and the Euro zone
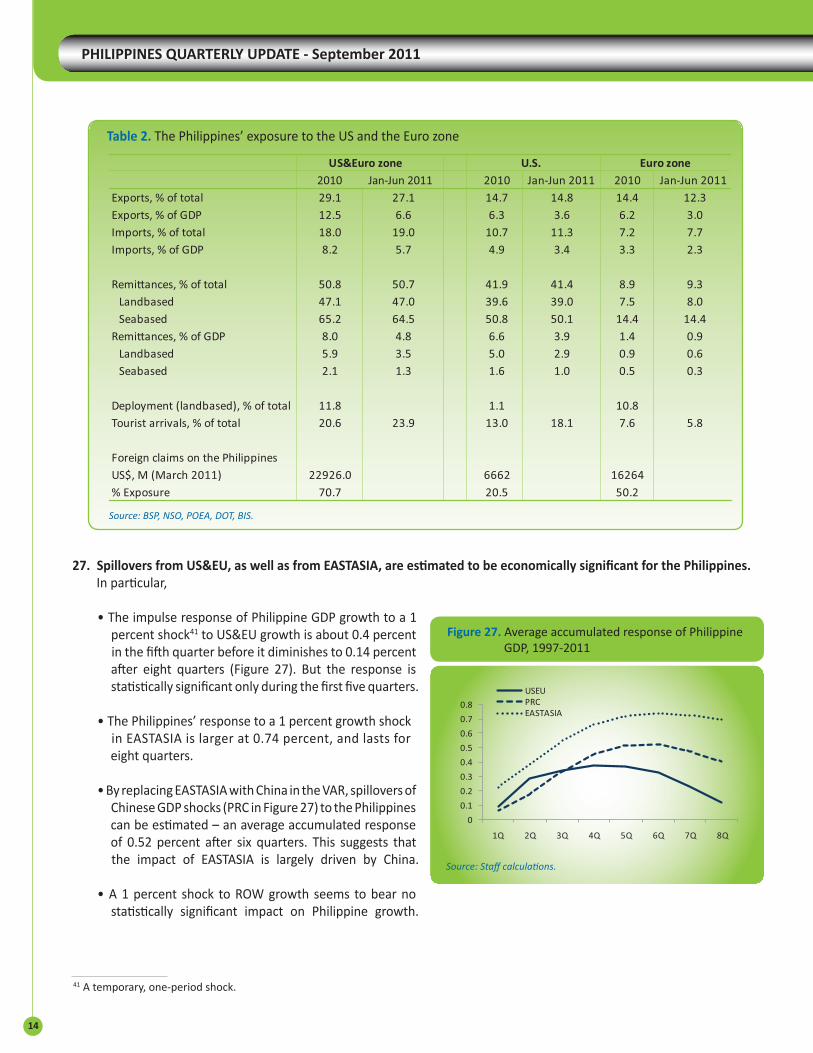
Spillovers from US&EU, as well as from EASTASIA, are estimated to be economically significant for the Philippines.27. In particular,
• The impulse response of Philippine GDP growth to a 1 percent shock41 to US&EU growth is about 0.4 percent in the fifth quarter before it diminishes to 0.14 percent after eight quarters (Figure 27). But the response is statistically significant only during the first five quarters.
• The Philippines’ response to a 1 percent growth shock in EASTASIA is larger at 0.74 percent, and lasts for eight quarters.
• By replacing EASTASIA with China in the VAR, spillovers of Chinese GDP shocks (PRC in Figure 27) to the Philippines can be estimated – an average accumulated response of 0.52 percent after six quarters. This suggests that the impact of EASTASIA is largely driven by China.
• A 1 percent shock to ROW growth seems to bear no statistically significant impact on Philippine growth.
41 A temporary, one-period shock.
Source: Staff calculations.
Figure 27. Average accumulated response of Philippine GDP, 1997-2011
Source: BSP, NSO, POEA, DOT, BIS.
15
Solid Macroeconomic Fundamentals Cushion External Turmoil
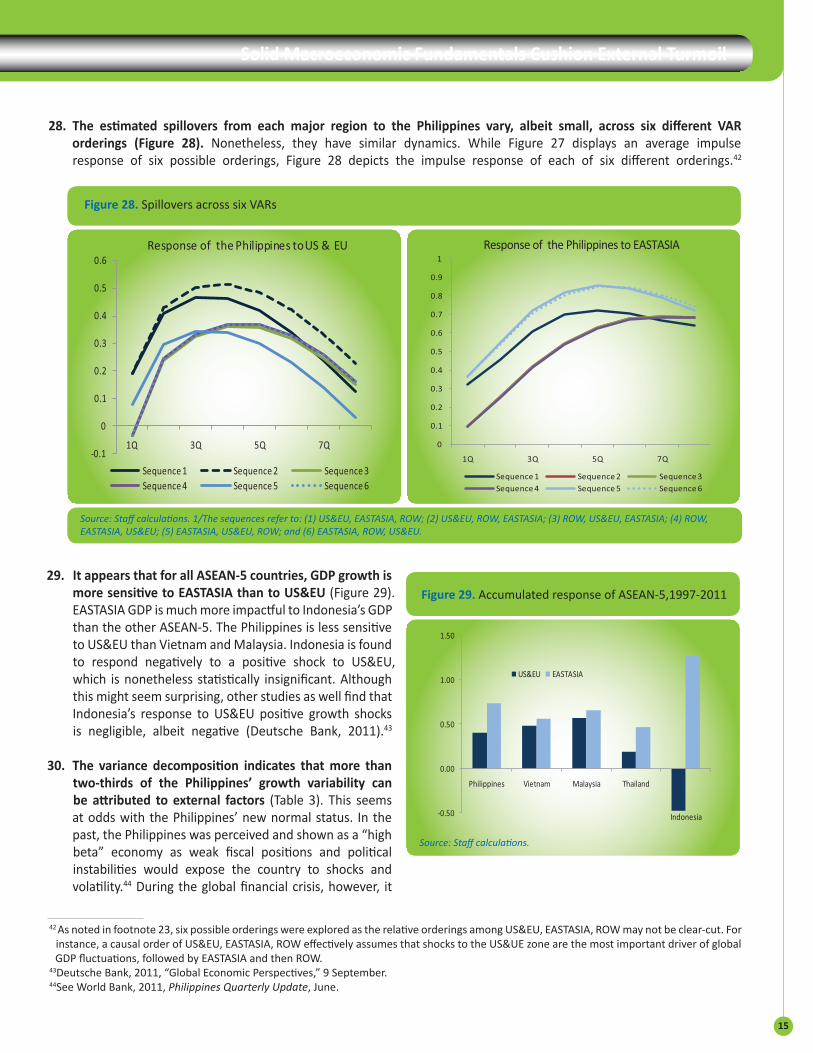
The estimated spillovers from each major region to the Philippines vary, albeit small, across six different VAR 28. orderings (Figure 28). Nonetheless, they have similar dynamics. While Figure 27 displays an average impulse response of six possible orderings, Figure 28 depicts the impulse response of each of six different orderings.42
It appears that for all ASEAN-5 countries, GDP growth is 29. more sensitive to EASTASIA than to US&EU (Figure 29). EASTASIA GDP is much more impactful to Indonesia’s GDP than the other ASEAN-5. The Philippines is less sensitive to US&EU than Vietnam and Malaysia. Indonesia is found to respond negatively to a positive shock to US&EU, which is nonetheless statistically insignificant. Although this might seem surprising, other studies as well find that Indonesia’s response to US&EU positive growth shocks is negligible, albeit negative (Deutsche Bank, 2011).43
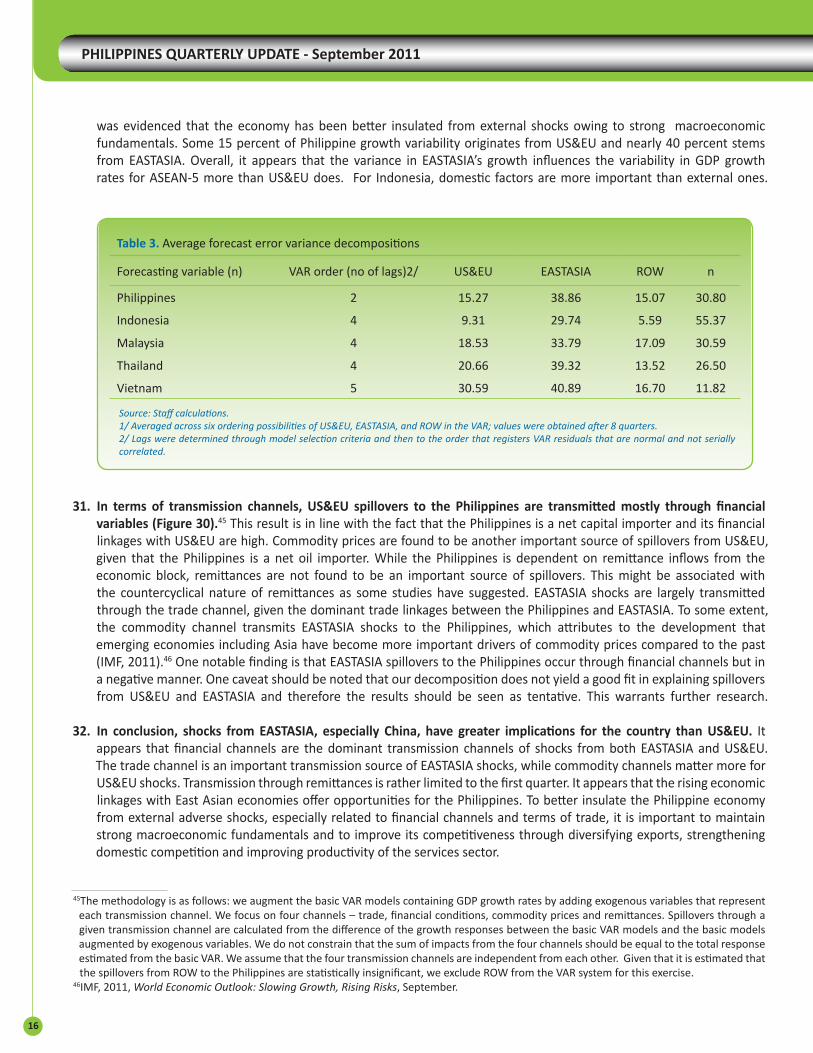
The variance decomposition indicates that more than 30. two-thirds of the Philippines’ growth variability can be attributed to external factors (Table 3). This seems at odds with the Philippines’ new normal status. In the past, the Philippines was perceived and shown as a “high beta” economy as weak fiscal positions and political instabilities would expose the country to shocks and volatility.44 During the global financial crisis, however, it
42 As noted in footnote 23, six possible orderings were explored as the relative orderings among US&EU, EASTASIA, ROW may not be clear-cut. For instance, a causal order of US&EU, EASTASIA, ROW effectively assumes that shocks to the US&UE zone are the most important driver of global GDP fluctuations, followed by EASTASIA and then ROW.
43Deutsche Bank, 2011, “Global Economic Perspectives,” 9 September. 44See World Bank, 2011, Philippines Quarterly Update, June.
Source: Staff calculations. 1/The sequences refer to: (1) US&EU, EASTASIA, ROW; (2) US&EU, ROW, EASTASIA; (3) ROW, US&EU, EASTASIA; (4) ROW, EASTASIA, US&EU; (5) EASTASIA, US&EU, ROW; and (6) EASTASIA, ROW, US&EU.
Figure 28. Spillovers across six VARs
Source: Staff calculations.
Figure 29. Accumulated response of ASEAN-5,1997-2011
PHILIPPINES QUARTERLY UPDATE - September 2011
16
was evidenced that the economy has been better insulated from external shocks owing to strong macroeconomic fundamentals. Some 15 percent of Philippine growth variability originates from US&EU and nearly 40 percent stems from EASTASIA. Overall, it appears that the variance in EASTASIA’s growth influences the variability in GDP growth rates for ASEAN-5 more than US&EU does. For Indonesia, domestic factors are more important than external ones.
In terms of transmission channels, US&EU spillovers to the Philippines are transmitted mostly through financial 31. variables (Figure 30).45 This result is in line with the fact that the Philippines is a net capital importer and its financial linkages with US&EU are high. Commodity prices are found to be another important source of spillovers from US&EU, given that the Philippines is a net oil importer. While the Philippines is dependent on remittance inflows from the economic block, remittances are not found to be an important source of spillovers. This might be associated with the countercyclical nature of remittances as some studies have suggested. EASTASIA shocks are largely transmitted through the trade channel, given the dominant trade linkages between the Philippines and EASTASIA. To some extent, the commodity channel transmits EASTASIA shocks to the Philippines, which attributes to the development that emerging economies including Asia have become more important drivers of commodity prices compared to the past (IMF, 2011).46 One notable finding is that EASTASIA spillovers to the Philippines occur through financial channels but in a negative manner. One caveat should be noted that our decomposition does not yield a good fit in explaining spillovers from US&EU and EASTASIA and therefore the results should be seen as tentative. This warrants further research.
In conclusion, shocks from EASTASIA, especially China, have greater implications for the country than US&EU.32. It appears that financial channels are the dominant transmission channels of shocks from both EASTASIA and US&EU. The trade channel is an important transmission source of EASTASIA shocks, while commodity channels matter more for US&EU shocks. Transmission through remittances is rather limited to the first quarter. It appears that the rising economic linkages with East Asian economies offer opportunities for the Philippines. To better insulate the Philippine economy from external adverse shocks, especially related to financial channels and terms of trade, it is important to maintain strong macroeconomic fundamentals and to improve its competitiveness through diversifying exports, strengthening domestic competition and improving productivity of the services sector.
45The methodology is as follows: we augment the basic VAR models containing GDP growth rates by adding exogenous variables that represent each transmission channel. We focus on four channels – trade, financial conditions, commodity prices and remittances. Spillovers through a given transmission channel are calculated from the difference of the growth responses between the basic VAR models and the basic models augmented by exogenous variables. We do not constrain that the sum of impacts from the four channels should be equal to the total response estimated from the basic VAR. We assume that the four transmission channels are independent from each other. Given that it is estimated that the spillovers from ROW to the Philippines are statistically insignificant, we exclude ROW from the VAR system for this exercise.
46IMF, 2011, World Economic Outlook: Slowing Growth, Rising Risks, September.
Table 3. Average forecast error variance decompositions
Forecasting variable (n) VAR order (no of lags)2/ US&EU EASTASIA ROW n
Philippines 2 15.27 38.86 15.07 30.80
Indonesia 4 9.31 29.74 5.59 55.37
Malaysia 4 18.53 33.79 17.09 30.59
Thailand 4 20.66 39.32 13.52 26.50
Vietnam 5 30.59 40.89 16.70 11.82
Source: Staff calculations. 1/ Averaged across six ordering possibilities of US&EU, EASTASIA, and ROW in the VAR; values were obtained after 8 quarters.2/ Lags were determined through model selection criteria and then to the order that registers VAR residuals that are normal and not serially correlated.

17
Solid Macroeconomic Fundamentals Cushion External Turmoil
Source: Staff calculations. 1/ Bars display the average estimated spillovers of a 1 percent growth shock that are transmitted to the Philippines through a given channel (such as commodity prices). A line corresponds to the average accumulated response to a 1 percent shock (i.e., the same as displayed in Figure 27). What both bars and lines inform is that, at the given period, the sum of the estimated impacts transmitted through the four channels is not equal to the average accumulated response; and therefore the four channels are insufficient to explain 100 percent of the total estimated spillovers, as noted in paragraph 31.
Figure 30. The Philippines: External spillover channels (1997:Q2-2011:Q2)
The 2012 Proposed National Government Budget: Boosting Long-term Growth through Higher Spending on Human Capital Accumulation
Abstract: The 2012 national budget is a results-focused budget and calls for higher spending in general, particularly on social services. The budget will rest on increased revenue collection efficiency by broadening the tax base and improving tax administration and collection efforts. The Administration aims to lower government debt payment for 2012, which would release additional resources available for priority spending. The budget continues to employ the zero-based budget approach to rationalize expenditures and includes reforms to make further progress in improving spending efficiency, transparency, and accountability. Some of the major reforms include (i) fleshing out lump sum funds and (ii) tightening the use of savings, particularly from unfilled authorized positions. The reform in the use of savings implies that the government agencies and institutions, in particular those in the education sector, need to speed up on hiring. For poverty reduction and inclusive growth, higher spending on priority areas (education and health in particular) is required – an increase to 5-7 percent of GDP. To support this additional spending needed, the government needs to continue to strive for heightened revenue mobilization.
The second (proposed) budget of the Aquino administration entitled “Paggugol Na Matuwid Diretso sa 33. Tao” (Responsible Spending, Straight to the People) is a results-focused budget. The budget allocation is guided by the administration’s commitment on the five key result areas of the Social Contract: (1) transparent, accountable and participatory governance, (2) poverty reduction and empowerment of the poor and vulnerable, (3) rapid, inclusive, and sustained economic growth, (4) just and lasting peace and the rule of law, and (5) integrity of the environment and climate change adaptation and mitigation.
PHILIPPINES QUARTERLY UPDATE - September 2011
18
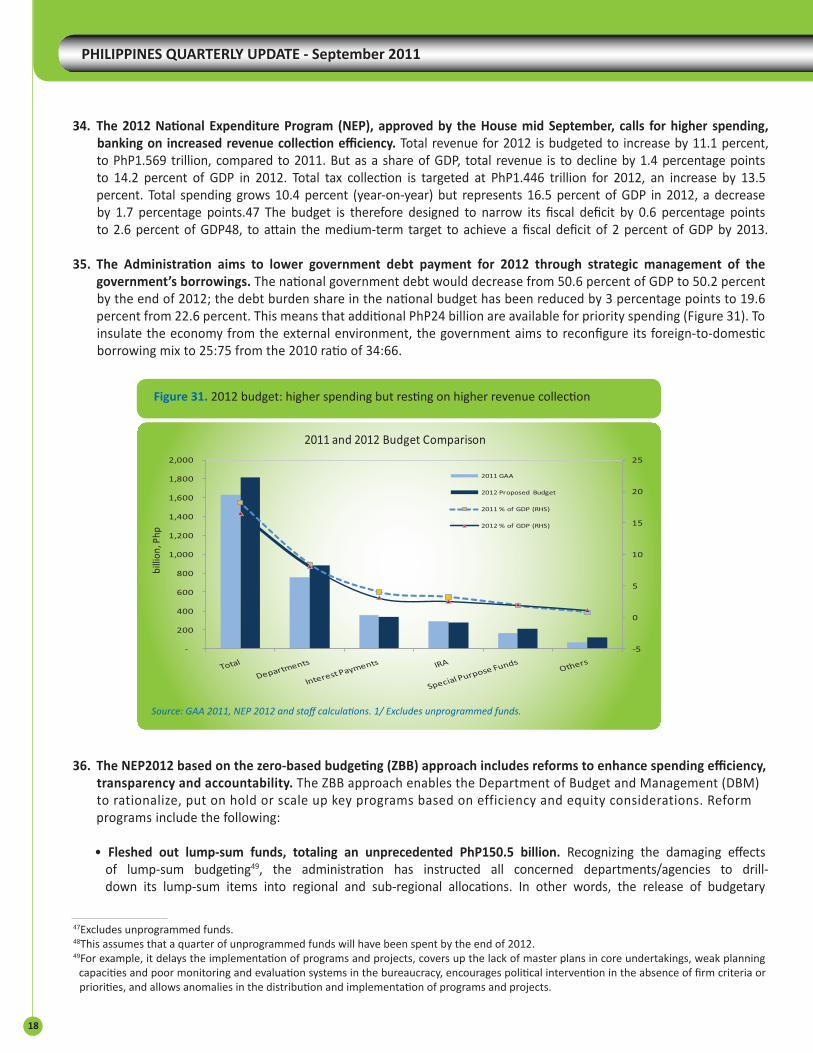
The 2012 National Expenditure Program (NEP), approved by the House mid September, calls for higher spending, 34. banking on increased revenue collection efficiency. Total revenue for 2012 is budgeted to increase by 11.1 percent, to PhP1.569 trillion, compared to 2011. But as a share of GDP, total revenue is to decline by 1.4 percentage points to 14.2 percent of GDP in 2012. Total tax collection is targeted at PhP1.446 trillion for 2012, an increase by 13.5 percent. Total spending grows 10.4 percent (year-on-year) but represents 16.5 percent of GDP in 2012, a decrease by 1.7 percentage points.47 The budget is therefore designed to narrow its fiscal deficit by 0.6 percentage points to 2.6 percent of GDP48, to attain the medium-term target to achieve a fiscal deficit of 2 percent of GDP by 2013. The Administration aims to lower government debt payment for 2012 through strategic management of the 35. government’s borrowings. The national government debt would decrease from 50.6 percent of GDP to 50.2 percent by the end of 2012; the debt burden share in the national budget has been reduced by 3 percentage points to 19.6 percent from 22.6 percent. This means that additional PhP24 billion are available for priority spending (Figure 31). To insulate the economy from the external environment, the government aims to reconfigure its foreign-to-domestic borrowing mix to 25:75 from the 2010 ratio of 34:66.
The NEP2012 based on the zero-based budgeting (ZBB) approach includes reforms to enhance spending efficiency, 36. transparency and accountability. The ZBB approach enables the Department of Budget and Management (DBM) to rationalize, put on hold or scale up key programs based on efficiency and equity considerations. Reform programs include the following:
• Fleshed out lump-sum funds, totaling an unprecedented PhP150.5 billion. Recognizing the damaging effects of lump-sum budgeting49, the administration has instructed all concerned departments/agencies to drill-down its lump-sum items into regional and sub-regional allocations. In other words, the release of budgetary
47Excludes unprogrammed funds.48This assumes that a quarter of unprogrammed funds will have been spent by the end of 2012. 49For example, it delays the implementation of programs and projects, covers up the lack of master plans in core undertakings, weak planning
capacities and poor monitoring and evaluation systems in the bureaucracy, encourages political intervention in the absence of firm criteria or priorities, and allows anomalies in the distribution and implementation of programs and projects.
Source: GAA 2011, NEP 2012 and staff calculations. 1/ Excludes unprogrammed funds.
Figure 31. 2012 budget: higher spending but resting on higher revenue collection
19
Solid Macroeconomic Fundamentals Cushion External Turmoil
allocations from the lump-sum items is directed down to the smallest implementing units to facilitate implementation. This action empowers the implementing units and enforces and improves accountability.50
• Tightened the definition of savings by removing the special provisions granted to the Department of National Defense and the AFP51 and the use of savings by releasing personal service budgets only to the extent of filled positions. The corresponding funding requirement for the unfilled positions was transferred to the Special Purpose Fund – Miscellaneous Personnel Benefits Fund (MPBF), and will only be released by DBM, when certain documentary requirements are complied with by the agencies. This strengthens DBM’s oversight on the realignment of funds across allotment classes. Past practices were that agencies, particularly those with fiscal autonomy, declared budgets for unfilled positions as savings and distributed them as bonuses and/or other additional allowances to incumbent officials and employees.
• Piloted the consultation process with civil society organizations (CSOs). The DBM instructed pilot agencies to consult with CSOs in crafting their 2012 budgets – namely DepEd, DOH, DSWD, DA, DAR, DPWH, NHA, NFA and National Home Mortgage and Finance Corporation. This consultative process will be sustained through all phases of the budget cycle, from their social audit of indigent families under the conditional cash transfer (CCT) to their continued vigilance during the bidding of big-ticket projects.
Tightening the use of savings implies that education-related government agencies need to speed up on hiring. 37. The total number of authorized permanent positions52 in the entire government service for 2012 is 1,272,985. Of which, 104,499 (8.2 percent) are unfilled. In contrast to the current shortage in teachers and health workers throughout the country, the education and health-related institutions and agencies account for 56.5 percent and 5.9 percent of the total unfilled positions, respectively (see Table 4).
The ZBB approach generated sufficient fiscal space to scale up spending on priority social agenda and on digitizing 38. and streamlining government operations to improve the efficiency and transparency of government services. The Administration dedicates the lion’s share of the budget to priority social spending (31.7 percent) and commits (i) to further expand the 4P (CCT) program,53 (ii) to sustain the KALAHI-CIDSS, (iii) to increase spending on education to fulfill the
“secure education for all” agenda, (iv) to finance CHED’s Student Financial Assistance Programs and to implement TESDA’s training-for-work program nationwide, and (v) to upgrade health care facilities and services. The Administration commits to use information communication and technology (ICT) to digitize government transactions, promote arms-length transactions, reduce human intervention, and integrate fragmented processes and data flows in government agencies.54
50To give an example, notable major lump-sum items of the Department of Education (DepEd) that are disaggregated are (a) lump-sum for new positions, (b) GASTPE, (c) purchase of textbooks and instructional materials, (d) purchase of office and IT equipment, and (e) requirements of basic educational facilities. However, for the Department of Public Works and Highways (DPWH), this unbundling undertaking has to be intensi-fied since a big portion of its budget is still classified at the national level with fewer disaggregations. For instance, such items as “payments of right-of-way and contractual obligations” and “public-private partnership strategic support fund” are lumped up at the national level.
51Congress investigations revealed that in the Armed Forces of the Philippines (AFP), fund appropriated for the salaries of soldiers were converted to other uses.
52These positions are generally categorized into the following: (i) Key Positions – refer to executive, managerial, and chief of division or equivalent positions; (ii) Technical Positions – refer to positions directly performing the substantive and/or front-line services/functions of the agency prescribed in its mandate; (iii) Support to Technical Positions – refer to positions which provide staff or technical support functions to key and technical positions but do not perform front-line services/functions; and (iv) Administrative Positions – refer to positions performing general services, clerical, human resource management, financial management, records management, custodial and other related functions. (DBM, Staffing Summary 2012)
53In order to enhance the effectiveness of targeting the poor under the 4P program, the administration encourages spreading the use of the National Household Targeting System (NHTS).
54The Government Integrated Financial Management Information System (GIFMIS), aiming to integrate and reengineer the financial management processes of the DBM, the DOF, the Bureau of Treasury (BTr) and the Commission on Audit (COA), is one concrete initiative (an allocation of P978million under E-government Fund). An upgrade of the Government Manpower Information System (GMIS) of DBM will help establish National Paymaster System that will enable BTr to directly pay personal services, hence having control of the largest component of cash transactions.

PHILIPPINES QUARTERLY UPDATE - September 2011
20
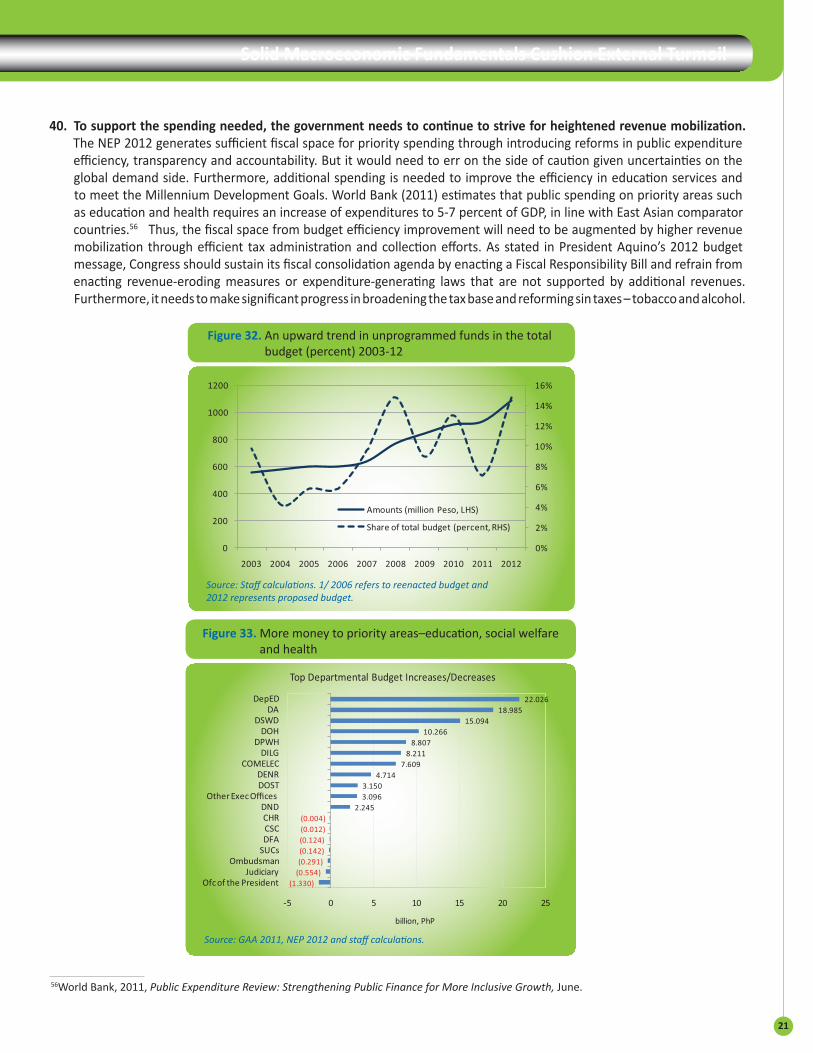
The NEP 2012 expands the overall share and scope of special purpose funds (SPFs).39. This is a significant departure from the 2011 budget which, in an effort to target priority spending and to improve spending efficiency, significantly reduced the size of SPFs, including unprogrammed funds as shown in (Figure 32). The 2012 budget has increased the share of unprogrammed fund in the total budget to the 2008 level – accounting for 15 percent of the total expenditures (or 43 percent of the SPFs).55 Benefiting from the ZBB approach, nonetheless, DBM has strived to align unprogrammed funds with priority spending. For instance, reintroduced less prioritized, albeit still necessary, budget items to the unprogrammed fund, such as the Debt Management Program (PhP85 billion) and the Disaster Risk Reduction and Management (PhP14 billion). To sustain the spending efficiency, the execution of unprogrammed funds, or SPFs in general, requires a good mix of fiscal discipline, allocative efficiency and effective use of resources.
55 This unprogrammed lump sum fund covers items that will be financed by the government only when additional fund resources become avail-able. Specific budget items under this SPF includes (a) Budgetary Support to Government-Owned and/or Controlled Corporations, (b) Support to Foreign-Assisted Projects, (c) General Fund Adjustments, (d) Support for Infrastructure Projects and Social Programs, (e) Collective Negotia-tion Agreement, (f) Disaster Risk Reduction and Management, and (g) Debt Management Program.
Table 4. Summary of unfilled positions and associated budget
Source: DBM, NEP and Staffing Summary 2012.
21
Solid Macroeconomic Fundamentals Cushion External Turmoil
To support the spending needed, the government needs to continue to strive for heightened revenue mobilization.40. The NEP 2012 generates sufficient fiscal space for priority spending through introducing reforms in public expenditure efficiency, transparency and accountability. But it would need to err on the side of caution given uncertainties on the global demand side. Furthermore, additional spending is needed to improve the efficiency in education services and to meet the Millennium Development Goals. World Bank (2011) estimates that public spending on priority areas such as education and health requires an increase of expenditures to 5-7 percent of GDP, in line with East Asian comparator countries.56 Thus, the fiscal space from budget efficiency improvement will need to be augmented by higher revenue mobilization through efficient tax administration and collection efforts. As stated in President Aquino’s 2012 budget message, Congress should sustain its fiscal consolidation agenda by enacting a Fiscal Responsibility Bill and refrain from enacting revenue-eroding measures or expenditure-generating laws that are not supported by additional revenues. Furthermore, it needs to make significant progress in broadening the tax base and reforming sin taxes – tobacco and alcohol.
56World Bank, 2011, Public Expenditure Review: Strengthening Public Finance for More Inclusive Growth, June.
Source: Staff calculations. 1/ 2006 refers to reenacted budget and 2012 represents proposed budget.
Figure 32. An upward trend in unprogrammed funds in the total budget (percent) 2003-12
Source: GAA 2011, NEP 2012 and staff calculations.
Figure 33. More money to priority areas–education, social welfare and health
PHILIPPINES QUARTERLY UPDATE - September 2011
22
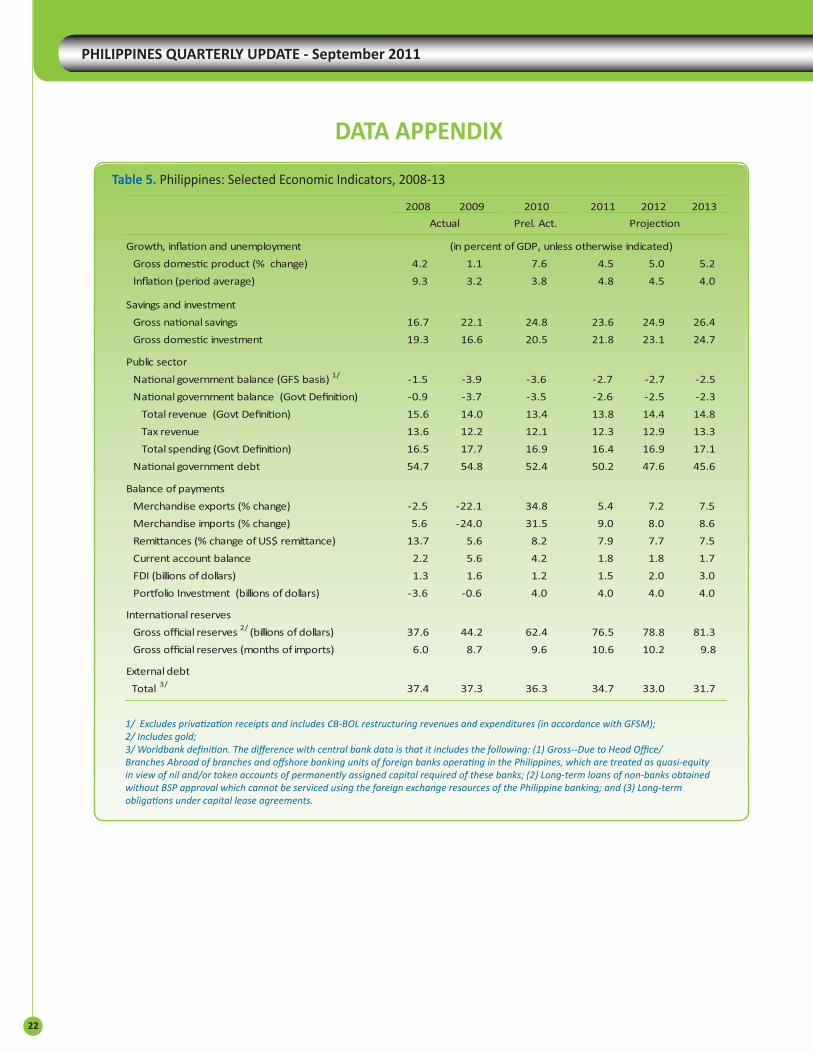
Table 5. Philippines: Selected Economic Indicators, 2008-13
1/ Excludes privatization receipts and includes CB-BOL restructuring revenues and expenditures (in accordance with GFSM);2/ Includes gold;3/ Worldbank definition. The difference with central bank data is that it includes the following: (1) Gross--Due to Head Office/Branches Abroad of branches and offshore banking units of foreign banks operating in the Philippines, which are treated as quasi-equity in view of nil and/or token accounts of permanently assigned capital required of these banks; (2) Long-term loans of non-banks obtained without BSP approval which cannot be serviced using the foreign exchange resources of the Philippine banking; and (3) Long-term obligations under capital lease agreements.
DATA APPENDIX
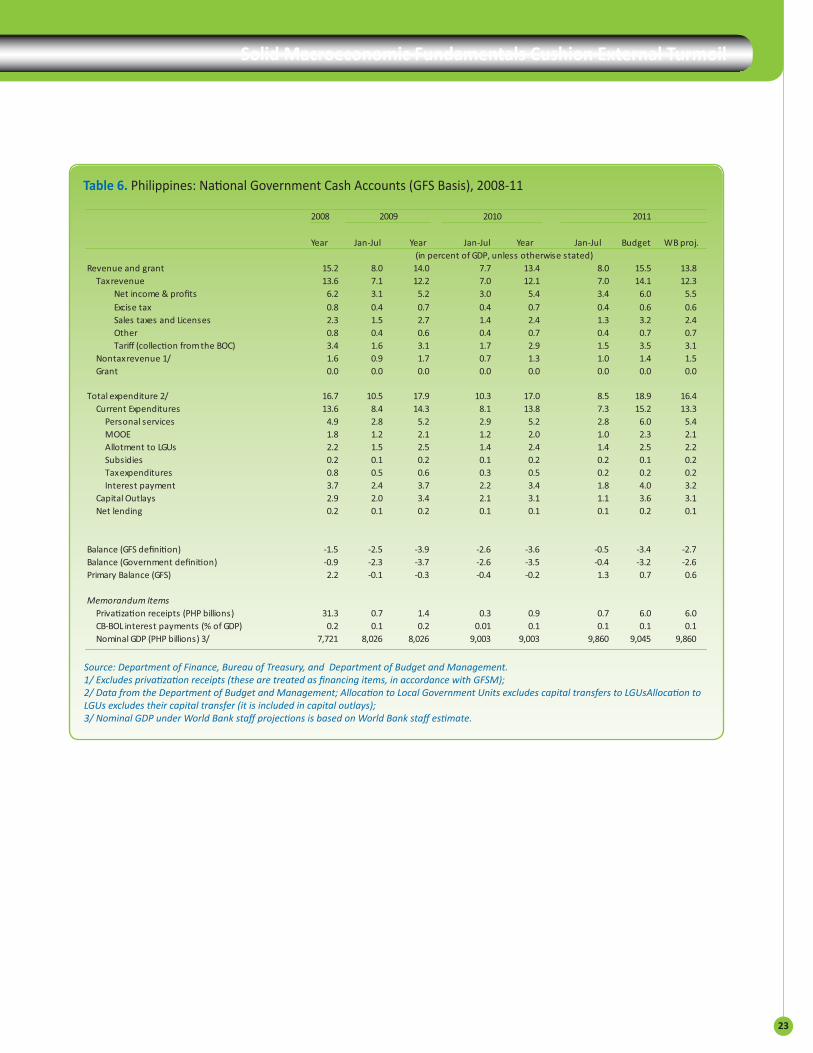
23
Solid Macroeconomic Fundamentals Cushion External Turmoil
Table 6. Philippines: National Government Cash Accounts (GFS Basis), 2008-11
Source: Department of Finance, Bureau of Treasury, and Department of Budget and Management.1/ Excludes privatization receipts (these are treated as financing items, in accordance with GFSM);2/ Data from the Department of Budget and Management; Allocation to Local Government Units excludes capital transfers to LGUsAllocation to LGUs excludes their capital transfer (it is included in capital outlays);3/ Nominal GDP under World Bank staff projections is based on World Bank staff estimate.
PHILIPPINES QUARTERLY UPDATE - September 2011
24
Selected Special Focus from Previous Quarterly Updates
June 2011 PQU: Generating More Inclusive Growth
Poverty and Inequality in the Philippines. The recently released 2009 poverty estimates and household survey (FIES) provide a much needed update on poverty, inequality and income dynamics in the Philippines. The FIES reveals that in contrast with previous trends, household per capita incomes grew from 2006 to 2009 and that, remarkably, rural and poorer households strongly outperformed. However, despite this increase and a resilient economy poverty incidence continued to increase through 2009 though, some improvements occurred in both the gap and severity of poverty. Therefore, poverty, and especially poverty dynamics, in the Philippines remains worse than its neighbors. Spatially, poverty remains highly concentrated in rural areas and in terms of sectors, households that rely on agricultural income are significantly more likely to be poor than other households. From 2006 to 2009, poverty in urban areas increased more rapidly, became more severe, and contributed more to the continuous increase in poverty. Across regions, 10 of the 17 administrative regions experienced an increase in poverty incidence.
The Services Sector in the Philippines. The services sector has the potential to play an important role in promoting inclusive growth in the Philippines. The sector is already large and has been an important driver of employment and GDP growth. However, this has not necessarily led to a rise in the average quality of jobs or productivity gains. Unshackling the constraints on services as a source of inclusive growth will require broad-based policy action: providing higher quality education for all to meet the demand for skills as services move up the value chain; improving infrastructure and enabling policies to facilitate agglomeration economies; removing investment climate distortions to allow services firms to invest and innovate.
The 2011 National Accounts Revisions (1998-2010). The Philippines recently revised its national accounts series for the period 1998 to 2010. The revisions involve shifting to a new base year (from 1985 to 2000) and adopting most of the recommendation of the System of National Accounts (SNA) 1993 and some recommendations of SNA 2008. The new series shows roughly the same GDP growth though sectoral growth varies. The revisions led to a significantly higher investment-to-GDP ratio and to a higher level nominal GDP—of about 6 percent for 2010. Finally, the previously large statistical discrepancies between the production and the expenditure accounts have largely been eliminated through a methodological improvement that made use of the supply-and-use table.
January 2011 PQU: Robust Growth, Stubborn Poverty
Food Prices in the Philippines. In contrast to many countries in the region, food price inflation has been muted so far in the Philippines and is expected to remain moderate in 2011 though risks are tilted upwards. In the short-term, concerns about a return of a 2008-style food crisis in the Philippines seem limited as rice price increases are projected to remain contained thanks to recent strong domestic palay production, good planting intentions, record stock piles of rice, and domestic retail prices significantly above international prices. Food prices are nonetheless expected to rise moderately, not least as the base impact of the increase in some food prices (especially vegetables) following typhoons Ondoy and Pepeng wears out. Fiscal Risks in the Philippines. Fresh into office the Aquino government established a comprehensive assessment of fiscal risks and published the outcome in a Fiscal Risk Statement (FRS) in November 2010. International experience reveals that disclosure of fiscal risks generates important benefits in terms of lower and better managed fiscal risks, improved policies, and lower cost of financing. Historically, fiscal risks have been prevalent in the Philippines and at times have generated large and unexpected fiscal costs. Important weaknesses in the Philippines public financial management framework have contributed to heightened fiscal risks. As the FRS reveals, while fiscal risks have abated in important areas they still remain sizeable in 2010.
25
Solid Macroeconomic Fundamentals Cushion External Turmoil
Export of Services: Lessons from the BPO and Tourism Sectors. Services exports are rising strongly in the Philippines and provide an important source of diversification of the country’s exports. The rapidly rising business process outsourcing (BPO) sector is building on the natural comparative advantages of the Philippines, namely a cost-competitive platform built around an English-speaking, technology-savvy young labor force, readily available telecommunication infrastructure, and a favorable economic zone environment. Tourism could become an important source of diversification for the country but the sector is constrained by a weal investment climate, periodic security concerns, weak transport and tourism-related infrastructure, and regulations on air transport services.
September 2010 PQU: Stepping Up Reforms to Sustain Growth
The 2011 National Government budget: structural reforms and consolidation. The 2011 budget could be the turning point the country public finances as it changes dynamics in two critical areas: (1) the (structural and cyclical) fiscal policy stance, and (2) the efficiency, transparency and accountability of public finances. The budget renews the fiscal consolidation effort—albeit modestly—and contains significant reforms measures aimed at improving spending efficiency, transparency and accountability of the budget. For the 2011 budget to indeed turn the country away from a weak fiscal position, inconsistent spending efficiency, and significant gaps in public expenditure and financial accountability, efforts initiated in this budget will have to both be sustained over time and expanded. Strengthening revenue mobilization—through a modern tax system with efficiency and equity at its core—would enable to scale up spending needed to generate inclusive growth.
Employment, Poverty and distributional impacts of El Niño in the Philippines. The 2010 El Niño phenomenon was less intense than the 1998 one. It is nonetheless estimated to lead to a large reduction in agricultural output and to subtract 0.9 percentage points to 2010 real GDP growth. Using a micro-simulation model, we find that El Niño will result in (1) a 0.9 percent reduction in total household income in 2010 mainly due to a combination of lower employment levels and individual earnings; (2) moderate increases in poverty incidence and poverty gap (0.4 and 0.2 percentage points increases, respectively); and (3) no significant impacts on the indices of overall inequality—though income losses are larger at the bottom of the income distribution—and a similar impact for urban and rural areas at the bottom half of the distribution.
The Philippines during the recent international financial shocks. Contrary to some expectations, the Philippine economy has shown to be remarkably resilient to recent international financial shocks. Using equity price indices and sovereign credit default swaps (CDS) spreads, we document the extent to which the country was affected in absolute and relative terms by the global financial crisis and the more recent European sovereign turmoil. Financial data reveal that: (1) during the last decade, the Philippines stock market exhibited strong co-integration with the US market and, to a lower extent with China’s, (2) the historically high volatility of the Philippine equity index decreased noticeably since the global financial crisis, (3) the sovereign credit quality of the Philippines is emerging favorably from the global financial crisis, and (4) Philippines sovereign CDS have not been correlated with CDSs of the fiscally weak European countries.
Constraints to growth: the agribusiness value chain in Mindanao. Understanding how the Philippines could improve its competitiveness in agribusiness and agricultural commodities markets in which the country, particularly the island of Mindanao, enjoys strong comparative advantages is critical to fighting poverty and boosting rural incomes. A recent World Bank study of the performance of two key agricultural value chains in Mindanao—yellow corn and export bananas—reveals that both corn and banana value chains offer significant future growth potential; yet they are facing some critical issues in terms of their long-term viability and sustainability. These include average farm-level productivity well behind international benchmarks, in large part due to infrastructure and logistics deficiencies. As the specific channels by which these constraints curtail growth prospects resonate with constraints that other regions and sectors also struggle with, this study is illustrative of the developmental challenges facing the Philippines, especially as regards inclusive growth generation and the fight against poverty.
PHILIPPINES QUARTERLY UPDATE - September 2011
26
June 2010 PQU: The Recovery Continues Despite Global Financial Turbulence
Economic development and peace: the case of Mindanao: (Box 1)
Philippines migration patterns during the global recession: resiliency through diversification and flexibility: (Box 2) Despite the global recession, total deployments (both new hires and rehires) to all destinations actually posted stronger growth rates than in the pre-crisis period, with females, service workers, seafarers, and rehires less susceptible to negative shocks from the financial crisis. Due to financial constraints, the shipping industry shifted to more inexpensive Filipino labor, thus inducing large increases in the employment of Filipino seafarers
The European sovereign debt turmoil and the Philippines: (Box 3)
Bottlenecks to the Philippines competitiveness: (Box 4) The marked decline in competitiveness relative to key neighboring ASEAN countries is mostly driven by the opacity of government policy making, favoritism in decisions of government officials, a weak judicial system, high inflation in 2008, high agricultural policy costs, and a weaker relationship between wage and labor productivity
February 2010 PQU: Layout the Exit Strategies
Cyclical and permanent changes in fiscal policy during the global recession: The large counter-cyclical fiscal policy engineered to fight the global recession helped buffer the economy but generated a large and mostly structural fiscal deficit, as permanent revenue-eroding and expenditure-increasing measures were introduced. To enable a measured unwinding of this fiscal expansion, laying out a specific and credible medium-term plan that takes into account the country’s inclusive growth agenda is warranted.
Petroleum Taxation in the Philippines (Box 1): Tax collection from petroleum excises is 1.8 percentage points of GDP lower than in 1997. Raising revenue through such excises would (1) generate minimal economic distortions (excises are “efficient” taxes); (2) predominantly impact the most well-off Filipinos (consumption is strongly “progressive” therefore guaranteeing vertical equity: the richer you are the more you pay); (3) reduce bad side effects of consuming petroleum products (“negative externalities”) such as traffic congestion, accidents, but also pollution which creates health hazards and environmental damages—the Philippines under-taxes compared to the rest of the world a major source of global warming; and (4) be easy to administer provided effective border controls are in place.
November 2009 PQU: Towards an Inclusive Recovery
Comparing the NFA and the 4Ps/CCT as social safety net instruments (Box 3): As a subsidy program for the poor, the NFA rice subsidy program suffers from serious deficiencies, not least: (1) limited assistance reaching the poor as they get only get 16 percent of their rice consumption from the NFA; (2) high leakage to the non poor with about half of NFA rice by the non poor; (3) a very expensive program due to limited operational efficiency of NFA—in 2008, for every peso-equivalent given to the poor through the rice subsidy program, the Philippine taxpayers spent between 3 to 8.6 pesos. Reallocating NFA’s fiscal support to the 4Ps/CCT would cover 100 percent of the poor against 25 percent with NFA, with each poor household receiving 7 times the benefits it receives with the NFA. Reallocating the NFA’s fiscal support to the 4Ps/CCT would generate major social protection gains and notable fiscal savings.
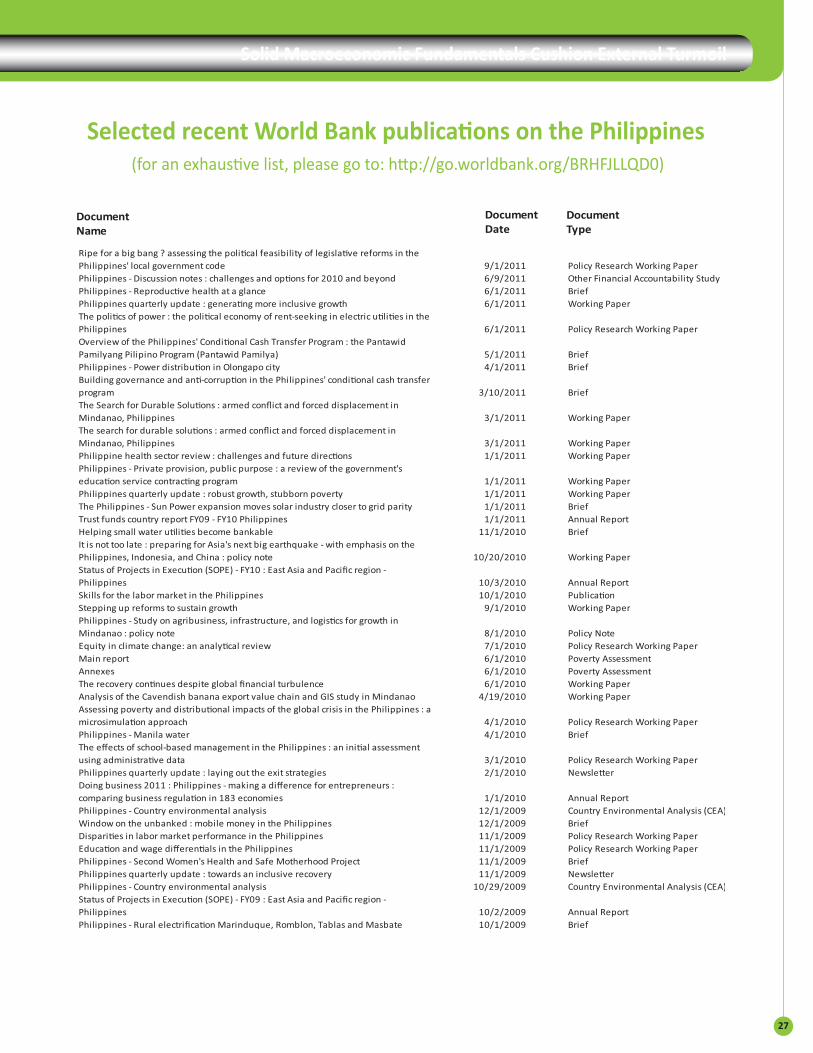
27
Solid Macroeconomic Fundamentals Cushion External Turmoil
Selected recent World Bank publications on the Philippines (for an exhaustive list, please go to: http://go.worldbank.org/BRHFJLLQD0)
PHILIPPINES QUARTERLY UPDATE - September 2011
28
Copies of The Philippines Quarterly Update:
Online copies of this publication can be downloaded in www.worldbank.org.ph
Printed copies are also available in the following Knowledge for Development Centers (KDCs):
World Bank KDCGround Floor The Taipan Place, Francisco Ortigas Jr. Road (former Emerald),Ortigas Business Center, Pasig City 1605
Asian Institute of Management KDCJoseph R. McMicking Campus, 123 Paseo de Roxas, Makati City 1226
Ateneo de Naga University KDCJames O’Brien Library, Ateneo Avenue, Naga City 4400
Central Philippine University KDCGround Floor Henry Luce III Library, Lopez Jaena Street, Jaro, Iloilo City 5000
House of Representatives KDCCongressional Planning and Budget Department, 2F R.V. Mitra Building, Batasang Pambansa Complex, Constitution Hills, 1126 Quezon City
Notre Dame University KDCNotre Dame University Library, Notre Dame Avenue, Cotabato City 9600
Palawan State University KDCGraduate School - Law Building, Manalo Campus, Valencia St., Puerto Princesa City 5300
Saint Paul University Philippines KDC3rd floor, Learning Resource Center, Mabini St., Tuguegarao City 3500
Silliman University KDCSilliman University Library, Dumaguete City 6200
University of San Carlos KDCUniversity Library, P. Del Rosario Street, Cebu City 6000
University of Southeastern Philippines KDCObrero, Davao City 8000


1818 H Street, NWWashington, DC 20043 USAInternet: www.worldbank.org
World Bank Office Manila23rd Floor, The Taipan PlaceF. Ortigas Jr. Road, Ortigas CenterPasig City, PhilippinesTelephone: (63-2) 637-5855Internet: www.worldbank.org/ph/cas
International Finance Corporation11th Floor, Tower OneAyala Triangle, Ayala AvenueMakati City, PhilippinesTelephone: (63-2) 848-7333Internet: www.ifc.org